Early Growth Response of Nine Timber Species to Release in a Tropical Mountain Forest of Southern Ecuador
←
→
Page content transcription
If your browser does not render page correctly, please read the page content below
Article
Early Growth Response of Nine Timber Species to
Release in a Tropical Mountain Forest of
Southern Ecuador
Omar Cabrera 1,2, * , Andreas Fries 3 , Patrick Hildebrandt 1 , Sven Günter 4
and Reinhard Mosandl 1
 1    Institute of Silviculture, Center of Life and Food Sciences Weihenstephan, Technische Universität München,
      Hans-Carl-von-Carlowitz-Platz 2, 85354 Freising, Germany; hildebrandt@tum.de (P.H.);
      mosandl@forst.wzw.tum.de (R.M.)
 2    Department of Biological Sciences, Universidad Técnica Particular de Loja, San Cayetano Alto s/n,
      1101608 Loja, Ecuador
 3    Department of Geology and Mine and Civil Engineering (DGMIC), Universidad Técnica Particular de Loja,
      San Cayetano Alto s/n, 1101608 Loja, Ecuador; aefries@utpl.edu.ec
 4    Institut für Internationale Waldwirtschaft und Forstökonomie, Leuschnerstraße 91,
      21031 Hamburg-Bergedorf, Germany; sven.guenter@thuenen.de
 *    Correspondence: hocabrera@utpl.edu.ec; Tel.: +593-7-370-1444

 Received: 16 January 2019; Accepted: 6 March 2019; Published: 13 March 2019

 Abstract: Research Highlights: This study determined that treatment “release from competitors”
 causes different reactions in selected timber species respective to diametrical growth, in which the
 initial size of the tree (diametric class) is important. Also, the growth habit and phenological traits
 (defoliation) of the species must be considered, which may have an influence on growth after release.
 Background and Objectives: The objective of the study was to analyze the diametric growth of nine
 timber species after their release to answer the following questions: (i) Can the diametric growth of the
 selected timber species be increased by release? (ii) Does the release cause different responses among
 the tree species? (iii) Are other factors important, such as the initial diameter at breast height (DBH)
 or the general climate conditions? Materials and Methods: Four-hundred and eighty-eight trees
 belonging to nine timber species were selected and monitored over a three-year period. Release was
 applied to 197 trees, whereas 251 trees served as control trees to evaluate the response of diametrical
 growth. To determine the response of the trees, a linear mixed model (GLMM, R package: LMER4)
 was used, which was adjusted by a one-way ANOVA test. Results: All species showed a similar
 annual cycle respective to diametric increases, which is due to the per-humid climate in the area.
 Precipitation is secondary for the diametric growth because sufficient rainfall occurs throughout year.
 What is more important, however, are variations in temperature. However, the species responded
 differently to release. This is because the initial DBH and growth habit are more important factors.
 Therefore, the species could be classified into three specific groups: Positive, negative and no response
 to release. Conclusions: Species which prefer open sites responded positively to release, while shade
 tolerant species and species with pronounced phenological traits responded negatively. The initial
 DBH was also an important factor for diametric increases. This is because trees of class I (20 cm
 to 30 cm DBH) responded positively to the treatment, whereas for bigger or older individuals,
 the differences decreased or became negative.

 Keywords: climate conditions; diametric growths; growth habit; initial DBH; tree competition

Forests 2019, 10, 254; doi:10.3390/f10030254                                      www.mdpi.com/journal/forests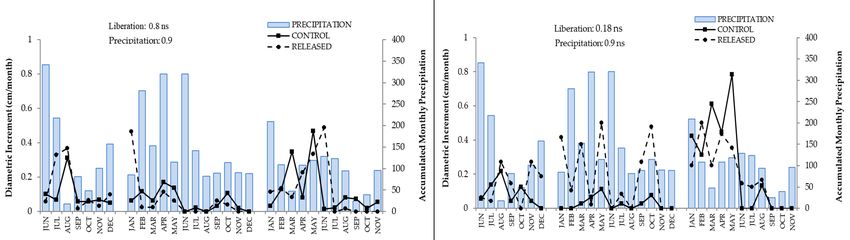
Forests 2019, 10, 254                                                                                 2 of 18

1. Introduction
      During the last few decades, deforestation and land degradation in tropical forests have been
studied extensively, due to their role in the global carbon cycle and climate system [1,2], as well
as because of their importance in ecosystem services [3]. Tropical forests cover 7% of the earth’s
surface but contain 50% of the global forest biomass, and therefore are the most important natural
carbon stocks and sinks regarding future global warming [4]. The above ground biomass (AGB)
accounts for 70%–90% of the total carbon biomass, mainly stored in the trunks and branches of
trees [5]. Furthermore, tropical forests represent 36% of the net primary terrestrial production, which
contributes to the regulation of the carbon dioxide (CO2 ) concentration in the atmosphere [2,6].
Therefore, the challenge for foresters is to understand the dynamics in tropical forest stands, including
the productivity of desired timber species, in order to implement sustainable practices and prevent
deforestation and ecosystem destruction [7,8].
      Intermediate treatments to improve forest productivity, such as the release or removal of
competitors from timber trees, were implemented some decades ago, including implementation
in tropical countries [9–11]. The process, in which undesirable species and other competitors near
the timber species are eliminated, helps to improve their productivity, because diametric growth is
a result of competition for space and resources with other species [12]. This silvicultural treatment
allows a diametric increase in trees [13–15] and therefore is frequently applied in managed forests
for timber production [11]. Release from competitors is best developed in boreal forests [16] and
alpine forests [17], where implementation results in significant diametric increases. Also, in neotropical
countries (e.g., Puerto Rico, Nigeria, Guyana, Sarawak and Brazil) this technique has been implemented
successfully in managed forests [10,15]. However, in natural tropical forests, the release from
competitors around the desired timber species is poorly investigated thus far, because these forest
types present an extraordinarily high species density, even though the density of individual species
is comparatively low [18]. This generally leads to the decelerated diameter growth of tropical forest
trees [19], but growth rates vary significantly between species, depending on their growth habit (early-,
mid- or late-successional), age, phenological traits and climatic conditions [20,21].
      Timber harvesting in natural tropical forests may have a similar effect to release [22], but the
remaining trees often suffer considerable impacts, which can only be minimized by applying directed
fall techniques [23]. Nonetheless, an enhanced diametric growth of desirable timber species in natural
tropical forests may lead to sustainable forest management if the collectivity of the ecosystems involved
are not affected [24]. The same is valid for tropical mountain forests (>1500 m a.s.l.), which have
been recognized as being indispensable for all environmental services, such as water production
and storage, as well as for water regulation [25], besides their extraordinarily high biodiversity [3].
The high biodiversity of tropical mountain forests is a result of rapidly changing climate conditions
caused by the local topography. Generally, air temperature decreases towards higher elevations,
but precipitation amounts increase, resulting in fast changing environmental conditions [26–28].
The altitudinal gradients diversify both structurally and floristically the tropical mountain forest [29,30],
but also limit the growth of timber species, reducing their diametric growth and therefore their
productivity, due to competition with other plant species.
      Knowledge on the behavior of timber species within tropical mountain forests respective to release
is still lacking, but this silvicultural treatment can promote sustainable natural forest management
without ecosystem destruction. In Ecuador, this intermediate treatment was recently implemented,
but the effects must be still evaluated. Hence, the objective of this work is to analyze the radial
incrementation of nine timber species in a tropical mountain forest in southern Ecuador after their
release (removal of competitors). This research aims to answer the following questions: (i) Can the
diametric growth of the selected timber species be increased by release? (ii) Does release cause different
responses in the tree species? (iii) Are other factors important, such as the initial DBH, seasonality
or general climate conditions? To determine the response of the trees, a linear mixed model (GLMM,
R package: LMER4) was applied.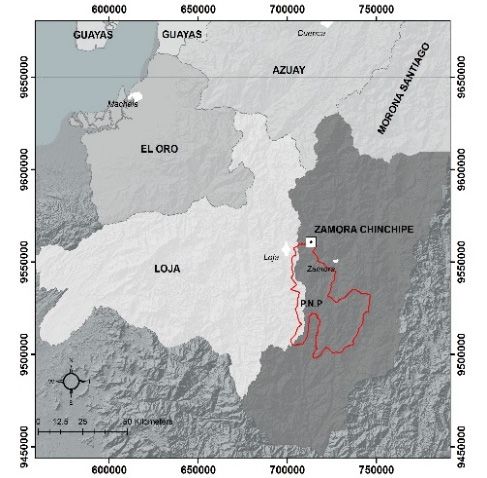
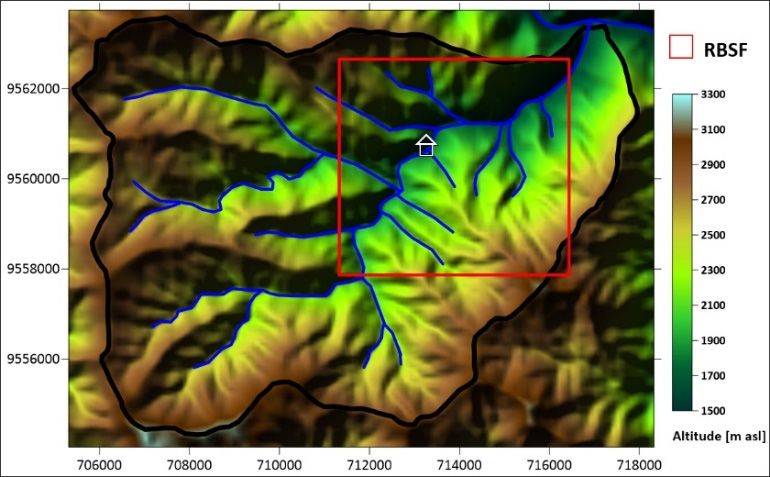
The study was executed in the primary tropical mountain forest of the “Reserva Biológica San
Francisco” (RBSF, 1850 m a.s.l., [31]), located at the eastern escarpment of the south Ecuadorian
Andes. The elevation of the catchment [32], which drains into the Amazon Basin, ranges from ∼1700
m a.s.l. at the valley bottom to ∼3200 m a.s.l. at the highest mountain peaks (Figure 1). The natural
vegetation in 254
Forests 2019, 10, the RBSF is an evergreen tropical mountain forest, which covers the slopes from3 the of 18
valley bottom up to the tree line at ∼2700 m a.s.l. [33]. The forest can be divided into evergreen lower
montane forests (up to 2100–2200 m a.s.l.) and upper montane forests, up to the tree line. Above
2. Materials and Methods
∼2700 m, a shrub-dominated sub-paramo prevails, where small patches of Elfin forest, the so-called
Ceja Andina,
2.1. Study Area dominate the landscape [34]. Both types of montane forest can be subdivided into a
lower slope (ravine) forest and an upper slope (ridge) forest [29,30]. The ravine forests are
The study
characterized bywaslower executed in the primary
stem density, tropical mountain
but simultaneously by greaterforest of the
basal areas“Reserva Biológicaand
(tree diameters) San
Francisco” (RBSF, 1850 m a.s.l., [31]), located at the eastern escarpment
higher canopies when compared to the ridge forests, where lesser tree species are also present. The of the south Ecuadorian Andes.
The elevation
difference of thestructure
in forest catchment [32], which
is mainly due drains into the conditions
to the climatic Amazon Basin, ranges fromsoil
and prevailing ∼1700
typesm[28,35].
a.s.l. at
the valley bottom
The climate the∼catchment
in to 3200 m a.s.l. at the highest
is per-humid, withmountain
marked peaks (Figure
altitudinal 1). Thein
gradients natural vegetation
air temperature,
in the RBSF is an evergreen tropical mountain forest, which covers
humidity and rainfall [36]. The annual mean air temperature ranges from 19.4 °C at the valley bottom the slopes from the valley bottom
up9.4to°C
to theat tree
the highest ∼2700 m a.s.l.
line at mountain tops. [33].
However,The forest can bediurnal
the average divided into evergreen
temperature lower is
amplitude montane
lowest
forests (up to 2100–2200 m a.s.l.) and upper montane forests, up
inside dense forest stands compared to the other vegetation units present in the study area (pasture to the tree line. Above ∼ 2700 m,
a shrub-dominated sub-paramo prevails, where small patches of Elfin
and paramo), because the canopy layer shelters the air inside the forest against daily irradiance and forest, the so-called Ceja Andina,
dominate the
nocturnal landscape
outgoing [34]. Both
radiation types
[37]. of montane forest
Furthermore, the air caninside
be subdivided
the tropical into amountain
lower slope (ravine)
forest is
forest and an upper slope (ridge) forest [29,30]. The ravine forests
generally saturated, because dense canopies hinder the exchange of the air inside the forest with the are characterized by lower stem
density,
free but simultaneously
atmosphere, while the soils by greater
insidebasal areasstands
the forest (tree diameters)
are commonlyand higher canopies
saturated [38].when compared
to the ridge
The forests, where
distribution lesser is
of rainfall tree species
linked to are also present.
altitude, The difference
due to orographic in forest structure
precipitation formation is mainly
[36].
due to the climatic conditions and prevailing soil types [28,35].
The average annual rainfall amounts vary between 2300 mm at the valley bottom and 6700 mm at the
mountainThe climate
tops. These in theannual
catchment is per-humid,
rainfall amounts include with marked
both rain altitudinal
and fog gradients
precipitation,in airbecause
temperature,
both
humidity and rainfall [36]. The annual mean air temperature ranges from 19.4 ◦ C at the valley bottom
clouds and fog deposit water directly onto the vegetation, and therefore both must be considered as
9.4 ◦ C at
atorelevant the highest
available watermountain
input from tops.theHowever,
atmosphere the average
[26]. The diurnal
seasonal temperature amplitude shows
rainfall distribution is lowest a
inside
clear densecycle
annual forestwith
standsthecompared
main rainy toseason
the other vegetation
between May units present in the
and September studywinter)
(austral area (pasture
and a
and paramo),
relative dry season because
between the canopy
November layerandshelters
February the(austral
air inside the forest
summer) [36]. against daily irradiance
and Thenocturnal
soils in the RBSF mainly belong to the order of Inceptisols. At thetropical
outgoing radiation [37]. Furthermore, the air inside the lower partsmountain
of theforest
slopes,is
generally saturated,
Dystrudepts are morebecausefrequent, dense canopies
whereas at thehinder
upperthe exchange
parts Humaqueptsof the air andinside the forest
Petraquepts with the
dominate
free atmosphere, while the soils inside the forest stands are commonly
the area [39]. According to Wilcke et al. [40], the soils in mountain forests are characterized by thick saturated [38].
organic The distribution
layers, which storeof rainfall
largeiscontents
linked to ofaltitude,
biomassdue andtonutrients.
orographic precipitation
However, formation
the thickness of [36].
the
The average annual rainfall amounts vary between 2300 mm
organic layer depends mainly on two factors: The altitude and the slope gradient. At higher at the valley bottom and 6700 mm at the
mountain tops. These annual rainfall amounts include both rain and
elevations, the temperatures are lower and therefore the degradation of the material is decelerated, fog precipitation, because both
clouds and
leading to anfog deposit water
accumulation of directly
the organic ontomatter
the vegetation, and slopes,
[41]. At steep therefore theboth mustlayer
organic be considered
is generally as
a relevant available water input from the atmosphere [26]. The seasonal
thinner due to enhanced soil erosion processes, which transport the material to the lower and less rainfall distribution shows
a clear annual
inclined parts, cyclewherewith the the main matter
organic rainy season between May
is sedimented. These and September
processes also(austral winter)
affect the and a
chemical
relative dry
properties ofseason
the soils,between
making November and February
the availability (austral
of nutrients summer)
for plants highly[36].heterogeneous [25].
(A) (B)
Figure 1. Location of the study site at the border of the Podocarpus National Park (P.N.P., A) and a
digital elevation model (UTM 17S) of the San Francisco catchment, including the Reserva Biológica San
Francisco (RBSF) area (B).
The soils in the RBSF mainly belong to the order of Inceptisols. At the lower parts of the slopes,
Dystrudepts are more frequent, whereas at the upper parts Humaquepts and Petraquepts dominate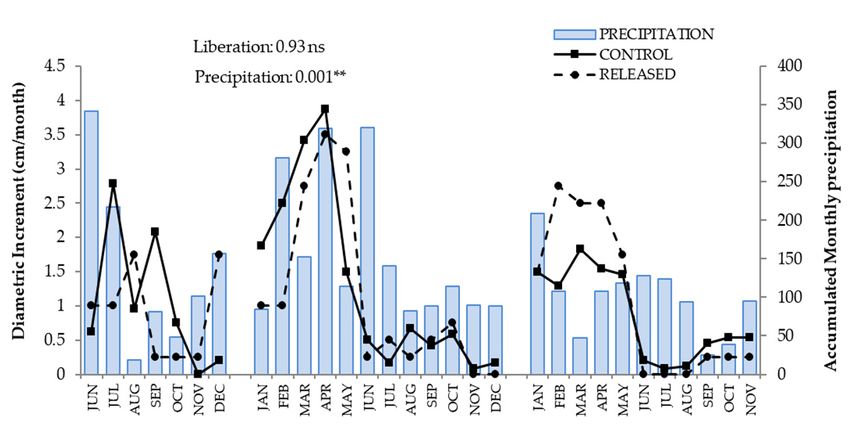
Forests 2019, 10, 254                                                                                            4 of 18

the area [39]. According to Wilcke et al. [40], the soils in mountain forests are characterized by thick
organic layers, which store large contents of biomass and nutrients. However, the thickness of the
organic layer depends mainly on two factors: The altitude and the slope gradient. At higher elevations,
the temperatures are lower and therefore the degradation of the material is decelerated, leading to an
accumulation of the organic matter [41]. At steep slopes, the organic layer is generally thinner due
to enhanced soil erosion processes, which transport the material to the lower and less inclined parts,
where the organic matter is sedimented. These processes also affect the chemical properties of the soils,
making the availability of nutrients for plants highly heterogeneous [25].

2.2. Experimental Design
      Over the past few decades, several permanent plots have been monitored in a natural tropical
mountain forest in southern Ecuador, where the growth of different tree species has been analyzed
along with observations of the behavior of the trees, respective to the addition of nutrients [34]. Other
studies monitored the DBH increment of the different tree species to estimate the AGB and annual
biomass production, as well as the influence of climate factors on the trees at different altitudes [29,35]
and alterations of the climate conditions due to deforestation [37,38]. As part of a long-term monitoring
forestry project, in January 2003, 52 plots of 2500 m2 each were installed inside the tropical mountain
forest of the RBSF. The plots were located in three different gullies (quebradas) at different altitudes:
Quebrada 2 (Q2, 20 plots), quebrada 3 (Q3, 16 plots) and quebrada 5 (Q5, 16 plots). After the plot
installation, a forest inventory was carried out and all trees with a DBH greater than 20 cm were
marked, as recommended by [42], to analyze the growth of the forest trees. Afterwards, botanical
samples were collected and identified taxonomically in the herbarium LOJA.
      For the release, only high-quality trees were selected, called “potential crop trees” (PCTs),
including nine timber species, because the silvicultural treatment applied here tends to promote
sustainable forest management without ecosystem destruction. A PCT is a commercial species
with a diameter at breast height (DBH) larger than 20 cm, with a good stem shape and concurrent
health [43]. The PCT species selected for this study were: Tabebuia chrysantha (Jacq.) G. Nicholson;
Cedrela montana Turcz.; Inga acreana Harms., Hyeronima asperifolia Pax & K. Hoffm., Hyeronima moritziana
Mull Arg., Podocarpus oleifolius D. Don ex Lamb., Nectandra membranacea (Sw.) Griseb., Dugand.
Three of these species are considered to be valuable timbers, namely Tabebuia chrysantha, Podocarpus
oleifolius and Cedrela montana, whereas the other six are classified as medium quality timbers. Tabebuia
chrysantha, Podocarpus oleifolius and Nectandra membranacea are hard wood trees of late-succession.
Tabebuia chrysantha has rings and pores which are easily visible. Cedrela montana is a semi-hard wood
tree of mid-succession with visible rings and pores. Inga acreana, Hyeronima asperifolia and Hyeronima
moritziana are also semi-hard wood trees of mid-succession, but do not present rings. Clusia ducoides
and Ficus subandina are soft wood trees of early to mid-succession without rings [44].
      In the installed plots, a total of 448 PCT individuals were identified, of which 197 individuals
were selected for release and 251 were left in their natural environment as a reference (control trees) to
compare the effect of the silvicultural treatment to natural conditions. In Q5, eight of the nine PCT
species were present, with exception of Clusia ducuoides, whereas in Q3, Ficus citrifolia and Inga acreana
were absent and only one individual of Cedrela montana was found. The plots in Q2 included all of the
selected PCT species, with several individuals (Table 1).

      Table 1. Released potential crop trees (PCTs) and reference trees (R) that were monitored in the different
      gullies (Quebradas: Q2, Q3 and Q5).

    Species                    Q5 PCT      Q5 R      Q3 PCT       Q3 R       Q2 R       Total PCT’s      Total R
    Cedrela montana               20         14         0           1         7              20             22
    Podocarpus oleifolius          1          0         12          7         10             13             17
    Tabebuia chrysantha           46         14         0           2         25             46             41
    Ficus citrifolia               4          3          0          0         13              4             16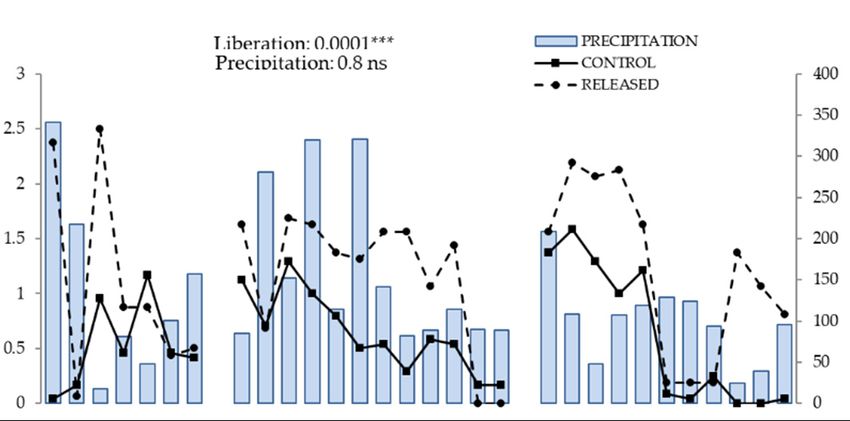
Forests 2019, 10, 254                                                                                              5 of 18

                                                   Table 1. Cont.

    Species                    Q5 PCT      Q5 R     Q3 PCT          Q3 R    Q2 R       Total PCT’s      Total R
    Nectandra membranacea         9          8          5             1      27             14               36
    Hyeronima asperifolia        27         10         1             1       15             28               26
    Hyeronima moritziana          3          0         16            10      11             19               21
    Clusia ducuoides              0          0         37            37      14             37               51
    Inga acreana                 16          5         0             0       16             16               21
                                                                                           197               251
                                                                            Total
                                                                                                 448

     By means of their initial DBH, the individual trees were grouped into four diametric classes (class
I = 20.1–30.0 cm DBH, class II = 30.1–40.0 cm DBH, class III = 40.1–50.0 cm DBH, and class IV ≥ 50.1
cm DBH). Afterwards, the treatment was defined (release or control) and the monitoring periods
(monthly) were established, taking into consideration the general climatic conditions (Table 2).

                 Table 2. Variables analyzed and the factors included in the applied GLMM model.

         Analyzed Variables                       Description                               Factor
                                                                                  Class I: 20.1–30.0 cm DBH
                                      Diametric class of the released and         Class II: 30.1–40.0 cm DBH
            Diameter Class
                                               reference trees                    Class III: 40.1–50.0 cm DBH
                                                                                   Class IV: >50.0 cm DBH
                                            Removed competitors                            Released
               Treatments
                                          Non-removed competitors                         Reference
                                                                                      Period I: 12 months
                                   Time between initial measurement drive
                 Period                                                              Period II: 24 months
                                            by climatic seasons
                                                                                     Period III: 36 months
              Precipitation           Accumulated monthly precipitation                  mm/month
              Temperature               Monthly average temperature                       ◦ C/month

2.3. Silvicultural Treatment
      As mentioned before (Section 1), release consists of the removal of competitors to improve space
and increase the availability of nutrient for the desired species [12,43]. This treatment is based on the
theory that the growth rates of trees are directly related to the quantity of sunlight received. Therefore,
all other trees and undesirable species or competitors around the desired timber species are removed
to obtain adequate lighting and to enhance nutrient availability [45,46] (Figure 2). To determine
the competitors of the selected PCT trees, all plots were visited and the tree form, crown diameter
and social position within the forest stand, as well as stem quality, were analyzed and evaluated.
All detected competitors were labeled with plastic tape and removed during a campaign between April
and May of 2004. The release included mainly competitor trees, which were cut using the method of
directional falling to avoid additional damage to the ecosystem [10]. Furthermore, no herbicides were
applied to the stumps to guarantee the development of species collectivity in their natural environment
without alterations or contaminations.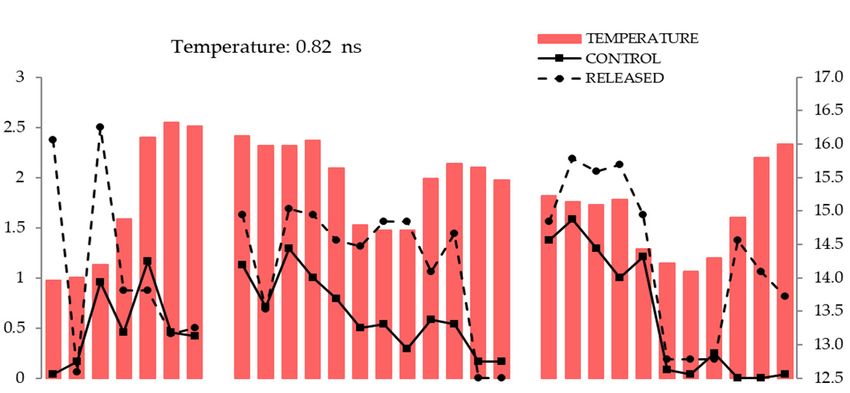
Forests 2019, 10, 254 6 of 18
Forests 2018, 9, x FOR PEER REVIEW 6 of 21
FigureFigure 2. Implementation
2. Implementation scheme scheme
of theofapplied
the applied silviculture
silviculture treatment
treatment with photos
with photos duringduring
the the
campaign (May 2004, place:
campaign (May 2004, place: Q5). Q5).
2.4. Data
2.4. Analysis
Data Analysis
To evaluate individuals
To evaluate individualsin thein nine
theselected PCT species,
nine selected the monthly
PCT species, the monthly diameter increase
diameter of each
increase of each
tree was measured. The trees were monitored for 36 months
tree was measured. The trees were monitored for 36 months and the DBH measurements and the DBH measurements of eachof each
recording, compared
recording, to the initial
compared to thevalueinitialasvalue
well asasto the as
well previous
to the data,
previous weredata,usedwere
to analyze
used the effect the
to analyze
of liberation on the individual tree species over time. Therefore, metallic
effect of liberation on the individual tree species over time. Therefore, metallic dendrometersdendrometers were used, fixed were
to theused,
PCTs and control trees, besides specific labels for each tree species and
fixed to the PCTs and control trees, besides specific labels for each tree species and their their respective diameter
class (Figure
respective2). Furthermore,
diameter classto(Figure improve 2).the analysis, additional
Furthermore, to improve the the
DBH data of additional
analysis, the selectedthe species
DBH data
were included,
of the selected species were included, provided by other studies which estimated AGB and thein
provided by other studies which estimated AGB and the annual biomass production annual
the RBSF [34,47].
biomass production in the RBSF [47,34].
The diametric
The diametric increase of theof
increase PCTs and reference
the PCTs trees were
and reference trees calculated
were calculated by means of theof
by means equation
the equation
proposed by [21]. The diametric increase (Di [cm/month]) can
proposed by [21]. The diametric increase (Di [cm/month]) can be determined as thebe determined as the difference between
difference
the initial diameter
between (Do [cm])
the initial diameter and (Do
the subsequent
[cm]) and the DBH measurement
subsequent DBH (D1 [cm]), divided
measurement by thedivided
(D1 [cm]), time by
betweenthe the
time field campaigns
between the field(which is monthly
campaigns here).isThe
(which equation
monthly wasThe
here). applied to all selected
equation was applied trees to all
after their initial
selected DBH
trees measurement,
after their initial DBH indicating the monthly
measurement, DBH increase
indicating of eachDBH
the monthly tree. increase
Then, allof ofeach
the tree.
individual
Then,monthly
all of the results were averaged
individual monthly to obtainwere
results the mean
averagedincrease for each
to obtain thespecies,
mean considering
increase for each
their specific
species,diametric
considering class. Finally,
their the diametric
specific average monthly DBH increases
class. Finally, the average weremonthly
used to DBH
calculate mean were
increases
annual values
used as well as
to calculate a value
mean for the
annual entire
values as study
well asperiod
a value (36for
months).
the entire study period (36 months).
The homoscedasticity of the results was
The homoscedasticity of the results was checked by meanschecked by means of theof Levene’s test [48].
the Levene's test Their
[48]. Their
normality was checked with the Shapiro–Wilk test [49] using
normality was checked with the Shapiro–Wilk test [49] using the software R, version the software R, version 3.2.0 [50].
3.2.0 [50]. If
If significant
significantdifferences
differences in diameter
in diameter growth
growthbetween
betweenthe PCTs
the PCTs and theandreference
the referencetrees trees
were were
found, found,
considering the different diametric classes, an exploratory T-test (using the
considering the different diametric classes, an exploratory T-test (using the software R) was executed,software R) was executed,
whereas an independent
whereas an independent TukeyTukey test (Tukey HSD function,
test (Tukey HSD function, usingusingthe software
the softwareR) was R) applied
was applied if if
significant differences
significant between
differences the monitoring
between the monitoringperiods were determined.
periods were determined. Both tests
Both were
tests accepted
were accepted
with p-values ≤ 0.05,
with p-values meaning
≤ 0.05, meaningthat the
thatresults were were
the results statistically significant.
statistically significant.
To check whether
To check the initial
whether DBH (diametric
the initial DBH (diametricclasses) or other
classes) factors,
or other like seasonality
factors, or climate
like seasonality or climate
conditions, determine the diameter growth of the selected timber species,
conditions, determine the diameter growth of the selected timber species, a linear mixed model a linear mixed model
(GLMM, R package:
(GLMM, LMER4)
R package: was applied.
LMER4) The linear
was applied. mixedmixed
The linear modelmodelcombines explanatory
combines categorical
explanatory categorical
factors like diameter
factors like diameter class,class,
treatment
treatmentor climate conditions,
or climate conditions, andand provides
provides a "random"
a "random" variable
variable forfor the
the repeated measurements throughout time (period). To adjust the
repeated measurements throughout time (period). To adjust the linear mixed model, a one-way linear mixed model, a one-way
ANOVA test was
ANOVA testexecuted
was executed and accepted
and acceptedwith p-value ≤ 0.05.≤ 0.05.
with p-value
3. Results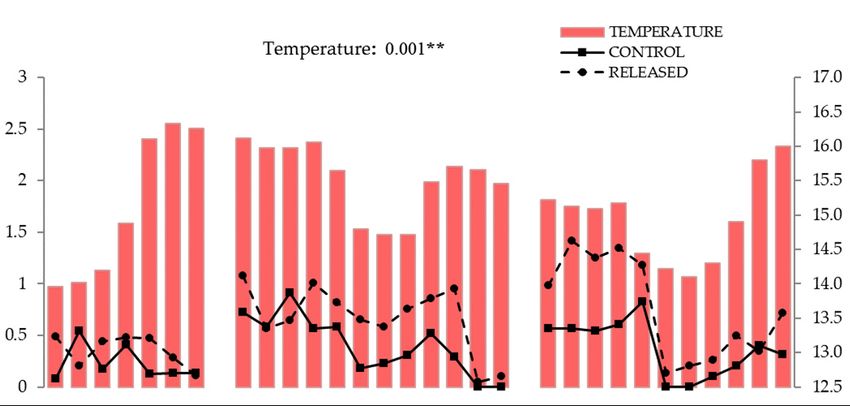
Forests 2019, 10, 254                                                                              7 of 18

3. Results
     The selected timber species responded differently to release respective to their reference trees
(Table 3). Therefore, the species analyzed were separated into three groups (positive response, negative
response and no response to release).

3.1. Positive Response to Release
     The species that responded positively to release were Inga acreana and Hyeronima asperifolia, which
had a greater diametric increment than their reference trees. Inga acreana showed a mean growth of
1.13 cm ± 0.72 (standard deviation) over the whole study period, whereas the control trees showed
an increment of only 0.56 cm ± 0.47. The diametric growth of the released trees was not continuous,
in which the lowest increment was measured during the first year (1.01 cm ± 0.81), which afterwards
increased to 1.16 cm ± 0.61 (second year) and finally to 1.22 cm ± 0.78 (third year). For the reference
trees, a more constant growth was observed, but also with the lowest increment during the first year.
This may be due to the initiation time of the investigation (June, austral winter), when precipitation
generally peaks but the lowest temperatures are typically observed [36,37]. Furthermore, temperatures
were lowest in June 2004, directly after the release, compared to the following years, which may have
influenced the diametric growth of all species. In general, the highest DBH increments for all species
were observed at the beginning of the year (austral summer), when temperatures are highest and
enough water is available (Figures 3 and 4).
     The released trees of Hyeronima asperifolia showed a mean growth of 0.63 cm ± 0.64 over the whole
study period, whereas the control trees only had an increase of 0.35 cm ± 0.36 (Table 3). Similar to
Inga acreana, the diametric growth of Hyeronima asperifolia increased during the observation period,
which resulted in the highest increment of growth during the third year (0.76 cm ± 0.53). However,
the diametric class of the released trees was also important, because smaller trees showed higher
DBH increments (Table 4). For Inga acreana, increments were exclusively observed in class I (diameter:
20.1 cm to 30.0 cm), whereas Hyeronima asperifolia showed increments in all classes, but showed higher
values for classes I–III. As shown in Table 5, the enhanced diametric growth of both species was
principally caused by the treatment (release), but also the temperature (Figure 3) and precipitation
(Figure 4). The diametric class had significant influence for Hyeronima asperifolia.
     In summary, both species showed higher diametric growth compared to their control trees during
the entire study period, which illustrates the expected effects of release, namely improvements in light
and nutrient availability, leading to faster DBH growth.

3.2. Negative Response to Release
      The species with negative responses to release were Cedrela montana, Tabebuia chrysantha,
Podocarpus oleifolius and Nectandra membranacea. All of these species showed significantly lower
diametric growth respective to their control trees, especially during the second and third year after
release (Table 3). The species with the most significant differences were Cedrela montana (1.16 cm ± 1.21
vs. 0.87 cm ± 1.24), followed by Nectandra membranacea (0.44 cm ± 0.62 vs. 0.26 cm ± 0.32). This
is because light and nutrient availability are not the main factors for their DBH increments, what is
more important are their growth habits and phenological traits, besides temperature and precipitation
(Table 5). However, like the two species which responded positively to release, the highest DBH
increments were observed for diametric classes I–III. Only Tabebuia chrysantha showed small increments
in class IV (diameter over 50 cm) over the whole study period (Table 4).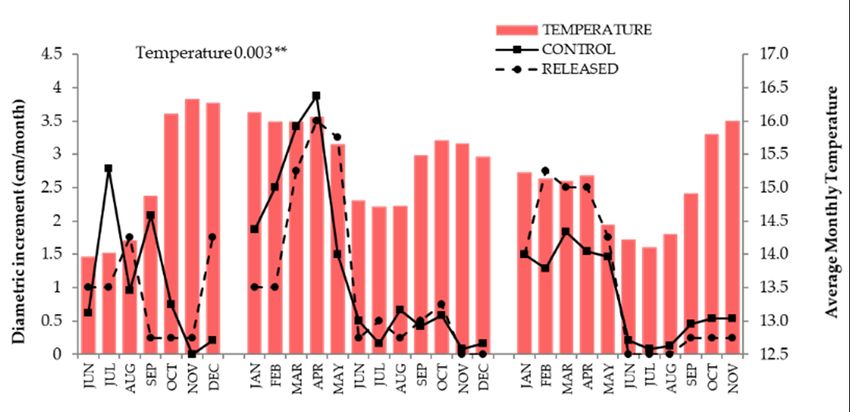
Forests 2019, 10, 254                                                                                                                                                                                           8 of 18

                   Table 3. Average annual diameter increase, including standard deviation (SD). Values highlighted (bold) are statistically significant (p ≤ 0.05).

                                                Treatment                                                                          Treatment × Period
                                                                                               I                                               II                                           III
         Species                        Control          Released
                                                                               Control               Released                 Control                 Released             Control                  Released
                                       x       SD       x       SD            x         SD           x         Sd            x         SD             x     SD            x          SD            x      SD
         Inga acreana                0.56      0.47    1.13     0.72        0.43        0.36        1.01       0.81         0.64       0.36          1.16   0.61         0.63        0.66         1.22   0.78
         Hyeronima asperifolia       0.35      0.36    0.62     0.54        0.26        0.34        0.44       0.58         0.41       0.39          0.67   0.46         0.38        0.34         0.76   0.53
         Cedrela montana             1.16      1.21    0.87     1.24        1.20        1.23        0.93       1.38         1.25       1.02          0.98   1.55         1.03        1.32         0.70   0.63
         Tabebuia chrysantha         0.27      0.34    0.21     0.41        0.16        0.21        0.28       0.62         0.32       0.32          0.21   0.28         0.33        0.45         0.12   0.15
         Podocarpus oleifolius       0.15      0.26    0.14     0.46        0.09        0.19        0.19       0.68         0.16       0.32          0.19   0.35         0.21        0.26         0.05   0.13
         Nectandra membranacea       0.44      0.62    0.26     0.32        0.25        0.30        0.26       0.28         0.34       0.43          0.25   0.30         0.76        0.90         0.27   0.38
         Clusia ducuoides            0.10      0.16    0.10     0.21        0.11        0.15        0.10       0.15         0.06       0.10          0.07   0.18         0.12        0.20         0.13   0.29
         Hyeronima moritziana        0.12      0.23    0.17     0.22        0.10        0.20        0.12       0.16         0.03       0.06          0.19   0.27         0.25        0.31         0.20   0.20
         Ficus citrifolia            1.11      1.04    1.09     1.22        1.12        0.92        1.06       1.21         1.31       1.37          1.15   1.32         0.87        0.69         1.07   1.18

                                 Table 4. Values of diametric increase (cm) per period and the diametric classes of the nine selected timber species.

                                                                            Class 1                        Class 2                         Class 3                      Class 4
                                    Species           Periods
                                                                  Control          Released        Control      Released           Control      Released    Control           Released
                             Inga acreana                            0.43             1.01            0               0               0               0            0                0
                             Hyeronima asperifolia                   0.48             0.45          0.15             0.43           0.15             0.78        0.04             0.1
                             Cedrela montana                         1.01             0.81          1.39             0.47           1.36             1.5          0                0
                             Tabebuia chrysantha                     0.28             0.72          0.14             0.11           0.15             0.07        0.08             0.23
                             Nectandra membranacea      1            0.16             0.34          0.27             0.17           0.31             0.17          0               0
                             Podocarpus oleifolius                   0.17             0.12          0.07             0.02           0.03             0.42          0               0
                             Ficus subandina                         1.00             0.88          1.24             1.25             0               0            0                0
                             Clusia ducuoides                        0.13             0.15          0.06             0.08           0.13             0.08          0               0
                             Hyeronima moritziana                    0.12             0.18          0.11             0.06             0               0            0                0
                             Inga acreana                            0.64             1.16            0               0               0               0            0                0
                             Hyeronima asperifolia                   0.45             0.73          0.43             0.67           0.35             0.83          0              0.46
                             Cedrela montana                         1.20             0.96          1.31             0.65           1.25             1.33          0               0
                             Tabebuia chrysantha                     0.37             0.44          0.32             0.12           0.19             0.14        0.42             0.13
                             Nectandra membranacea      2            0.35             0.41          0.20             0.08           0.46             0.08          0               0
                             Podocarpus oleifolius                   0.08             0.10          0.06             0.04           0.33             0.42          0               0
                             Ficus subandina                         1.35             0.96          1.27             1.33             0               0            0                0
                             Clusia ducuoides                        0.07             0.06          0.11             0.05             0              0.08          0                0
                             Hyeronima moritziana                    0.05             0.25          0.03             0.13             0               0            0                0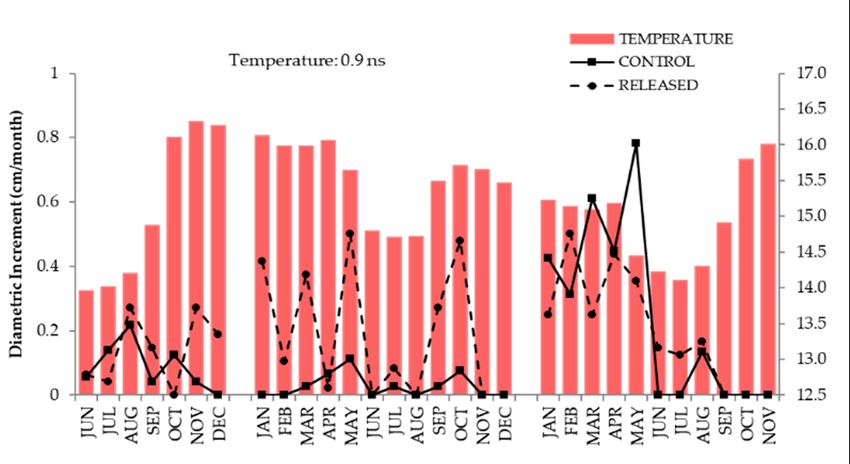
Forests 2019, 10, 254                                                                                                                                                                                             9 of 18

                                                                                                Table 4. Cont.

                                                                             Class 1                         Class 2                       Class 3                      Class 4
                                   Species            Periods
                                                                    Control         Released         Control      Released     Control            Released      Control      Released
                           Inga acreana                               0.63             1.22             0               0             0               0            0                0
                           Hyeronima asperifolia                      0.49             0.82           0.20             0.78         0.44             0.86          0              0.57
                           Cedrela montana                            0.99             0.74           1.06             0.64           1              0.73          0                0
                           Tabebuia chrysantha                        0.47             0.09           0.16             0.15         0.10             0.06        0.59             0.18
                           Nectandra membranacea         3            0.37             0.50           0.56             0.05         1.34             0.05          0               0
                           Podocarpus oleifolius                      0.11             0.16           0.20              0           0.30              0            0                0
                           Ficus subandina                            0.86             1.18           0.88             0.95           0               0            0                0
                           Clusia ducuoides                           0.13             0.15           0.09             0.05         0.14             0.18          0               0
                           Hyeronima moritziana                       0.30             0.20           0.17             0.20           0               0            0                0
                                                      Class I = 20.1–30 cm, class II = 30.1–40 cm, class III = 40.1–50 cm, class IV ≥ 50.1 cm.

      Table 5. P-values of the variables and the interactions that influence the variability of the diametric increase (GLMM). Significant values (p ≤ 0.05) are highlighted
      in bold.

                                                                                                                        Release ×                                                         Diametric        Diametric
                                                                                                                                            Release ×            Release ×
                               Release        Precipitation         Temperature               Diametric Class           Diametric                                                          Class ×          Class ×
         Species                                                                                                                           Precipitation        Temperature
                                                                                                                          Class                                                          Precipitation    Temperature
                          Ch         p        Ch         p         Ch           p             Ch         p             Ch      p            Ch              p    Ch         p            Ch        p      Ch        p
 Inga acreana             14.9    ≤0.0001    0.05       0.81       0.05       0.83             –          –             –      –           0.18        0.66     0.99      0.31            –        –       –       –
 Hyeronima asperifolia    33.5    ≤0.0001    4.1        0.04        9.8       0.001           16.7     0.0008          5.01   0.08          0.0        0.99     0.27      0.6            0.42     0.9     3.5     0.31
 Cedrela montana          6.2       0.01     15.1     ≤0.0001     31.9       ≤0.0001          4.9      0.08            1.5    0.21         1.01        0.31     2.3       0.12           4.5      0.1      5.9    0.05
 Tabebuia chrysantha      2.3       0.12     13.5     0.0002      1.74        0.18            26.3    ≤0.0001          4.04   0.39          1.9        0.16     0.39      0.52           13.5    0.003    0.62    0.88
 Podocarpus oleifolius    0.04      0.83     0.09      0.75       0.009       0.92            8.6      0.01             1.6    0.5         0.34         0.6      0.2      0.65           0.07     0.96    0.89    0.64
 Nectandra membranacea    5.5       0.01     14.9     ≤0.0001     31.8       ≤0.0001          1.4      0.49            0.12   0.72          2.7         0.9     3.5       0.06           0.2      0.9      2.7     0.2
 Clusia ducuoides         0.02      0.86     0.0004     0.98       1.3        0.24            2.4       0.3            0.91   0.63         0.09        0.76      1.1       0.3           2.2      0.33     4.7    0.09
 Hyeronima moritziana     1.7       0.19     0.0008     0.98      0.0006      0.98             2.4       0.3           0.07   0.79         0.45         0.5      3.4      0.05           0.64     0.72   0.0002   0.99
 Ficus citrifolia        0.007      0.93      10.1     0.001       8.8        0.002           0.46      0.49           0.12   0.72         0.19        0.65     0.17      0.67            1.9     0.16     3.3    0.06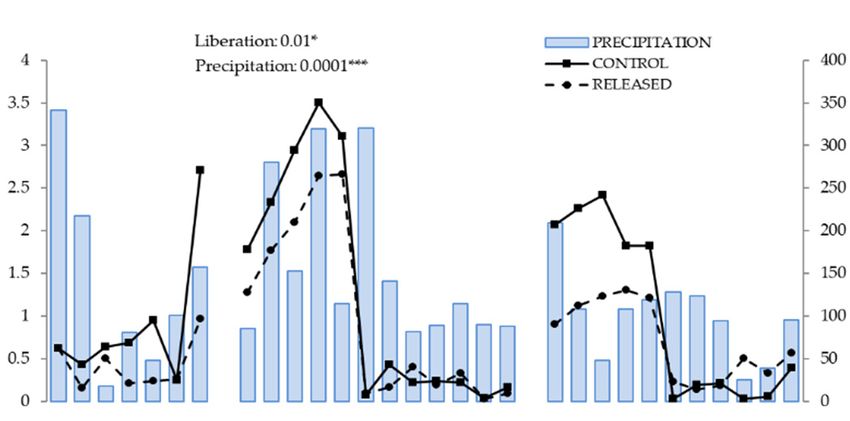
Forests 2019, 10, 254                                                                               10 of 18

3.3. Null Response to Release
     The species that did not show significant responses to release (neither positive nor negative)
were Hyeronima moritziana, Clusia ducuoides and Ficus citrifolia, which indicates that other factors have
a greater influence on the diametric growth of these species. The diametric growth of Hyeronima
moritziana (0.12 cm ± 0.23 vs. 0.17 cm ± 0.22) and Clusia ducuoides (0.10 cm ± 0.16 vs. 0.10 cm ± 0.21)
was generally low (released trees and control trees) over the complete study period, but with generally
the highest DBH increments during the third year. In contrast, Ficus citrifolia (1.11 cm ± 1.04 vs.
1.09 cm ± 1.22) showed higher DBH increments during the first two years of the study, which can
be related to the prevailing climate conditions, because mean monthly temperatures as well as
precipitation amounts were higher then, when compared to the third year (Figures 3 and 4). This is
confirmed in Table 5, where temperature and precipitation are seen to show significant influence on
the diametric growth of Ficus citrifolia but are secondary for the other two species (Table 5). Respective
to the diametric classes, the three species had the highest increments in class I and class II. Only Clusia
ducuoides showed small DBH increments in class III (Table 4).
              Forests 2018, 9, x FOR PEER REVIEW                                     1 of 21

       (A)                                                 (B)

        (C)                                                 (D)

       (E)                                                 (F)

        (G)                                                 (H)

                                                   Figure 3. Cont.
Forests 2019, 10, 254 11 of 18
Forests 2018, 9, x FOR PEER REVIEW Forests 2018, 9, x FOR PEER REVIEW 2 of 21 2 of 21
(I)
(I)
Figure 3. Diameter increase, by period, respective to the mean monthly temperature. (A) Inga acreana,
Figure 3. Diameter increase, by period, respective to the mean monthly temperature. (A) Inga acreana,
(B) Hyeronima
Figure 3. Diameter increase, by period, respectiveasperifolia, (C) Cedrela
to the mean monthlymontana, (D) Tabebuia
temperature. (A) chrysantha,
Inga acreana,(E) Nectandra membranaceae, (F)
(B) Hyeronima asperifolia, (C) Cedrela
(B) Hyeronima asperifolia, (C) Cedrela
montana,
Podocarpus (D)
montana,oleifolius, (G)Tabebuia
(D) Tabebuia Clusia chrysantha,
ducuoides,
chrysantha, (E)(H) Hyeronima
Nectandra
Nectandra
(E)membranaceae, membranaceae,
moritziana, (I)(F)
Ficus citrifolia.
(F) Podocarpus oleifolius,
Podocarpus Clusia
(G)Clusia
oleifolius, (G) ducuoides,
ducuoides, (H) Hyeronima
(H) Hyeronima moritziana,
moritziana, (I) Ficus citrifolia.
(I) Ficus citrifolia.
(A) (B)
(A) (B)
(C) (D)
(C) (D)
(E) (F)
(E) (F)
Figure 4. Cont.Forests 2018, 9, x FOR PEER REVIEW 3 of 21
Forests 2019, 10, 254 12 of 18
(G) (H)
(I)
Figure Figure 4. Diametric increase, by period, respective to monthly precipitation. (A) Inga acreana, (B)
4. Diametric increase, by period, respective to monthly precipitation. (A) Inga acreana,
Hyeronima asperifolia, (C) Cedrela montana, (D) Tabebuia chrysantha, (E) Nectandra membranaceae, (F)
(B) Hyeronima asperifolia, (C) Cedrela montana, (D) Tabebuia chrysantha, (E) Nectandra membranaceae,
Podocarpus oleifolius, (G) Clusia ducuoides, (H) Hyeronima moritziana, (I) Ficus citrifolia.
(F) Podocarpus oleifolius, (G) Clusia ducuoides, (H) Hyeronima moritziana, (I) Ficus citrifolia.
4. Discussion
4. Discussion
The nine selected timber species responded differently to the release because their growth habits,
The nineDBH
initial selected timber
(diametric class)species responded
and phenological differently
traits, to the release
which determined because
the success their growth habits,
of the treatment.
initial DBH (diametric
Historically, class)has
tree growth and beenphenological
modeled based traits, which classification
on different determinedcriteria,
the success
in which ofthe
the treatment.
most common
Historically, tree growthcriterion
hasare taxonomic
been modeled affinity,
basedecological guild and
on different growth dynamics
classification [18,51].
criteria, The
in which the most
growth and dynamics of natural tropical forests in Ecuador have been monitored for decades by
common criterion are taxonomic affinity, ecological guild and growth dynamics [18,51]. The growth
means of continuous measurements over time [52]. However, the main focus of this work has been
and dynamics
determining of natural tropical
the influence forests
of climatic in Ecuador
factors and ecosystemhave been monitored
services, due to the highfordeforestation
decades by means of
continuous
rates measurements
observed in Ecuador over [53,54],
time [52].but However, the main
not silvicultural focus of
treatments, suchthis
as work has been
the release fromdetermining
competitors.
the influence Monitoring
of climatic the diametric
factors growth ofservices,
and ecosystem certain species
dueby toadding
the highnutrients to the soil [34]
deforestation rates observed
or analyzing
in Ecuador [53,54],the butDBHnotincrement,
silvicultural respective to climatic
treatments, conditions
such [29,35], are
as the release fromtopics that provide Monitoring
competitors.
knowledge about forest dynamics, but do not contribute to sustainable forest management.
the diametric growth of certain species by adding nutrients to the soil [34] or analyzing the DBH
Although the study area corresponds to a natural tropical mountain zone, where marked
increment, respective
altitudinal gradients toinclimatic
temperature conditions [29,35],
and precipitation are[37,36],
exist topics that provide
provoking different knowledge
physiologicalabout forest
dynamics, but do
responses notspecies
in the contribute to sustainable
[55], climate conditions wereforest management.
secondary due to the pre-humid tropical climate
in the study
Although thearea.
studyThe relative dry season is formed
area corresponds between tropical
to a natural austral winter and austral
mountain summer
zone, where marked
(October/November), which is used by many species for phenological processes such as flowering
altitudinal gradients in temperature and precipitation exist [36,37], provoking
and fruiting [36]. All of the selected PCT species showed a similar annual cycle respective to diametric
different physiological
responses in the
growth, species
which [55], climate
was mainly triggeredconditions
by the slightlywere secondary
higher temperaturesdueduring
to thethepre-humid
austral summertropical climate
in the study
period. area.
This alsoThe relative
holds true fordry season
the species is formed
Cedrela montanabetween
and Tabebuia austral winter
chrysantha, which and austral summer
interrupt
(October/November), which is used by many species for phenological processes such as flowering
and fruiting [36]. All of the selected PCT species showed a similar annual cycle respective to diametric
growth, which was mainly triggered by the slightly higher temperatures during the austral summer
period. This also holds true for the species Cedrela montana and Tabebuia chrysantha, which interrupt
their cambial activity, simulating a dormancy period (defoliation), similar to tree species in temperate
climatic regions [56], leading to the formation of growth rings.
The released trees of the individual species were separated into three groups based on their
diametric class and individual response. The first group consisted of species which responded
positively to the release (Inga acreana and Hyeronima asperifolia), whereas the second group included
species which responded negatively (Cedrela montana, Nectandra membranacea, Podocarpus oleifolius andForests 2019, 10, 254 13 of 18
Tabebuia chrysantha), while the third group of species were those that responded neutrally (Hyeronima
moritziana, Clusia ducuoides and Ficus citrifolia).
The members of the species of genus Inga are generally medium-sized and shade intolerant [57],
but some species are only moderately shade tolerant [18]. However, Inga acreana grows in relatively
open sites, where release improves the environmental conditions and consequently diameter
growth [23,58,59]. Nonetheless, as the present study found, this is only valid for smaller individuals
(20–30 cm, class I) because larger diameter classes did not show any significant increments.
Hyeronima asperifolia also responded positively to release, which was also stated in [23], which
additionally found an interesting early response for this species. However, the early response could
not be confirmed by the present study because significant differences between the released and control
trees were higher at the end of the observation period (Table 3). Respective to the diametric classes,
the highest increments were calculated for classes I–III, whereas class IV only showed small increases
for the released trees (Table 4). The differences in growth between the diametric classes were stated
in previous studies [7,21], which indicate that diametric growth is strongly dependent on the size of
the tree, in which larger trees generally show lower increments. By analyzing the climate conditions
(Figures 3 and 4), it is evident that Hyeronima asperifolia reduces or suspends growing in June (austral
winter) when precipitation amounts are at their highest but temperatures are at their lowest. This
behavior was also found in other species in the RBSF area [58], because rainwater is usually stored
in the soil and is available for the plants for longer periods or during the whole year. The diametric
growth generally occurs during austral summer, when highest temperatures are observed, confirming
that temperature variations control the phenological processes and growth rates of the different species
in the study area.
The next group of species showed a negative response to the treatment, which means that release
produced an inverse effect, as was expected respective to diameter growth. As [60] indicated, variations
in the diameter growth of certain species are related to two factors: First, the amount of light intercepted
by the tree and second, the density of the wood. Therefore, an inverse relationship between growth
and wood density can be assumed, which is confirmed by this study, because the four species of
this group have hard and dense wood. Additionally, Cedrela montana and Tabebuia chrysantha exhibit
defoliation, which also affects their diametric growth [55].
Cedrela montana is a slow-growing deciduous species which forms growth rings in its trunk and
has defoliation [61], which is associated with austral winter, when temperature is lowest. Although
the seasonal temperature fluctuations are only around 1.5 ◦ C in the study area, other studies have
confirmed that temperature is significantly correlated to diametrical growth [42]. The highest diametric
increases are observed during the warm season (austral summer), whereas growth is reduced or
suspended during the cold season (austral winter). This overall trend matches with the growth rates
found in this study. However, the reason for the negative response of Cedrela montana may be the
time of release (June), because normally the trees begin with the process of leaf change and flower
production [42]. Release generated changed light conditions, which may have interrupted the natural
phenological cycle of the species. This is confirmed by [23], which also found a negative response
to release for Cedrela montana, concluding that the negative response is due to the species’ marked
phenological traits and physiological processes.
Tabebuia chrysantha is also a deciduous species [42] whose defoliation time coincides with Cedrela
montana, starting in June (austral winter). According to [62], Tabebuia chrysantha shows very low
diametric increments during austral winter, when the production of new leaves and flowers begins.
This is because the tree needs all of its available resources to progress through these physiological stages.
Therefore, the time of release for this study may have affected this species, however, the growth rates
were similar to the control trees during the first year of observation (Figures 3 and 4). This leads to the
assumption that the change in light conditions has also affected the released trees over the following
years, because this species prefers shaded sites [57]. Observing Table 4, the control trees showed
notably higher diametric increases during years 2 and 3, especially during the austral summer periods.Forests 2019, 10, 254 14 of 18
The negative response of Podocarpus oleifolius cannot be explained by the time of release nor the
general climate conditions. This is because temperature and precipitation did not produce a significant
effect on growth for this species (Table 5). Therefore, the change in light conditions may have affected
this species too. However, as the results of the applied statistical model indicated (Table 5), significant
differences between released trees and control trees were only found in terms of size (diameter class;
p = 0.01). As shown in Table 4, Podocarpus oleifolius only presented small increments for classes I–III,
in which the released trees in class I showed a generally higher diametric growth than the control trees,
whereas the control trees had higher increments than the released trees in class II. Class III showed
the highest diametric growth rates for both the control and released trees, especially during the first
two years of observation. However, during the third year, the released class III trees did not show any
increment, explaining the overall trend for the released trees being negative. Therefore, the applied
silvicultural treatment was only useful for smaller or younger trees, where their diametric growth
was enhanced due to the improved light conditions. For bigger or older trees this factor is secondary.
The generally low growth rates of Podocarpus oleifolius were also observed in [63], where an average
annual growth of 1.7 mm in Costa Rica was calculated. However, the present study only obtained an
annual average growth of 0.21 mm, which is confirmed by [34], which investigated Podocarpus oleifolius
in the RBSF area.
Additionally, for Nectandra membranacea, the effect of release was negative. The diametric growth
of this species was related to the treatment and the climatic conditions (temperature and precipitation,
Table 5), as Podocarpus oleifolius and Nectandra membranacea showed clear variation in growth between
diametric classes (Table 4). Young and small trees (typically class I) reacted positively to release. This
is because their diametric increment is higher when compared to the control trees. Nonetheless, in
classes II and III, the diametric growths of the released trees were notably lower than the control trees,
resulting in a negative response. The negative response of Nectandra membranacea was also found in [23],
which indicated that light conditions are important for younger trees, but if the tree is established
in the ecosystem, other factors such as nutrient availability are more important. Furthermore, too
much light may increase plant transpiration and therefore more water is necessary, which may reduce
diametric growth.
Ficus citrifolia, Clusia ducuoides and Hyeronima moritziana showed no response to the treatment,
which means that no differences in diametric growth between the released and control trees were
found. These species are tolerant to shade and light, and as such, no effect was obtained. However,
within the timber species studied, the highest increments were measured for diametric classes I and II
(smaller and younger trees), whereas in class III, the increments were strongly reduced, and in class IV
they were absent or insignificant (Table 4).
The present investigation, as with most growth studies, was based on traditional forest inventory
practices, including diameter measurements and applying a linear model (here, we applied GLMM,
R package: LMER4). However, as [64] suggested, to get a better resolution of the growth response
of species and individual trees, non-linear models should also be examined. Hence, individual tree
variability, as well as the tree’s specific location within the ecosystem can be considered in the models.
These variables could improve the understanding of the growth response of individual trees after this
intermediate treatment [65]. Furthermore, tree-ring series should be analyzed, because they provide
more accurate estimations of radial growth than inventory data and allow reconstruction at a fine
scale [66]. However, tropical forest trees generally do not form rings, which limits analyses to specific
species, however in boreal or alpine forests, where all tree species have growth-rings, this factor should
be included. Consequently, developing future studies using this approach can improve the resolution
of the growth pattern of trees within forest stands.
5. Conclusions
The silvicultural treatment (release from competitors) that was applied to nine timber species
in a natural tropical mountain forest in southern Ecuador resulted in different individual responses.Forests 2019, 10, 254 15 of 18
In general, species which preferred open sites responded positively to release, whereas shade tolerant
species responded negatively. Tree species which are light- and shade-tolerant did not show any
changes respective to diametric growth. Furthermore, the two species with defoliation (seasonality)
responded negatively, which may be due to the time of release (June, during austral winter), which
occurred during the time new leaves are built.
All of the selected species showed a similar annual cycle respective to their diametric increase.
Generally, growth was observed during the austral summer period, specifically between December
and April, when temperatures are highest and sufficient water is available. During austral winter
(June to September), most of the species reduced or suspended their growth because of the lower
temperatures during this period. Therefore, due to the per-humid climate in the RBSF, precipitation is
secondary for diametric growth, because enough rainfall occurs during the year which is then stored
in the soil, where water is consequently always available for the plants. What is more important are
the small temperature variations between austral summer and austral winter, which are generally
used by the plants to begin their phenological processes.
Finally, the initial DBH of the trees (diametric classes) was found to be an important factor for the
success of the treatment. Trees of class I (20 cm to 30 cm DBH) generally responded positively to the
treatment, whereas for bigger or older individuals, the differences between the released and control
trees decreased or became negative. This means that improved light conditions as well as nutrient
availability are specifically beneficial for younger trees, which still compete for space and nutrients.
Older trees are established within their ecosystem and generally grow slower, which explains why
release did not increase their competitive abilities. Therefore, the release of trees in natural tropical
mountain forests is only practical for younger trees, which are still competing for light and nutrients.
Author Contributions: Conceptualization, R.M.; Methodology, R.M, S.Gand O.C.; Formal analysis, O.C. and A.F.;
Writing—original draft preparation, O.C. and A.F.; Writing—review and editing, O.C., A.F., R.M, S.G. and P.H.;
Supervision S.G.
Funding: This work was funded by the German Research Foundation (DFG) in the framework of Research Unit
FOR 402, FOR816.
Acknowledgments: Special thanks to the Technical University of Munich (TUM) and the Universidad Técnica
Particular de Loja (UTPL) for the investigation support. Also, thanks to Gregory Gedeon for text revision.
Conflicts of Interest: The authors declare no conflict of interest. None of the authors has financial or personal
relationship with other people or organizations that could inappropriately or bias the content of the paper.
References
1. Olander, L.P.; Gibbs, H.K.; Steininger, M.; Swenson, J.J.; Murray, B.C. Reference scenarios for deforestation
and forest degradation in support of REDD: A review of data and methods. Environ. Res. Lett. 2008, 3,
025011. [CrossRef]
2. Pan, Y.; Birdsey, R.A.; Fang, J.; Houghton, R.; Kauppi, P.E.; Kurz, W.A.; Phillips, O.; Shvidenko, A.; Lewis, S.L.;
Canadell, J.G.; et al. A large and persistent carbon sink in the world’s forests. Science 2011, 333, 988–993.
[CrossRef] [PubMed]
3. Beck, E.; Bendix, J.; Kottke, I.; Makeschin, F.; Mosandl, R. Gradients in a Tropical Mountain Ecosystem of Ecuador;
Springer Science & Business Media: Berlin, Germany, 2008; ISBN 978-3-540-73526-7.
4. Saatchi, S.S.; Harris, N.L.; Brown, S.; Lefsky, M.; Mitchard, E.T.; Salas, W.; Zutta, B.R.; Buermann, W.;
Lewis, S.L.; Hagen, S.; et al. Benchmark map of forest carbon stocks in tropical regions across three
continents. Proc. Natl. Acad. Sci. USA 2011, 108, 9899–9904. [CrossRef] [PubMed]
5. Sprugel, D.G. When branch autonomy fails: Milton’s Law of resource availability and allocation. Tree Physiol.
2002, 22, 1119–1124. [CrossRef]
6. Malhi, Y.; Phillips, O.L. Tropical forests and global atmospheric change: A synthesis. Philos. Trans. R. Soc. B
2004, 359, 549–555. [CrossRef]
7. Clark, D.A.; Clark, D.B. Assessing the growth of tropical rain forest trees: Issues for forest modeling and
management. Ecol. Appl. 1999, 9, 981–997. [CrossRef]You can also read