UC Merced Frontiers of Biogeography - eScholarship
←
→
Page content transcription
If your browser does not render page correctly, please read the page content below
UC Merced
Frontiers of Biogeography

Title
Co-occurrence frequency in vegetation patches decreases towards the harsh edge along
an arid volcanic elevational gradient

Permalink
https://escholarship.org/uc/item/0jj1h22p

Journal
Frontiers of Biogeography, 13(3)

Authors
Eibes, Pia M.
Eisenbacher, Judith
Beierkuhnlein, Carl
et al.

Publication Date
2021

DOI
10.21425/F5FBG49743

Supplemental Material
https://escholarship.org/uc/item/0jj1h22p#supplemental

Copyright Information
Copyright 2021 by the author(s).This work is made available under the terms of a
Creative Commons Attribution License, available at
https://creativecommons.org/licenses/by/4.0/

Peer reviewed

 eScholarship.org                              Powered by the California Digital Library
                                                               University of California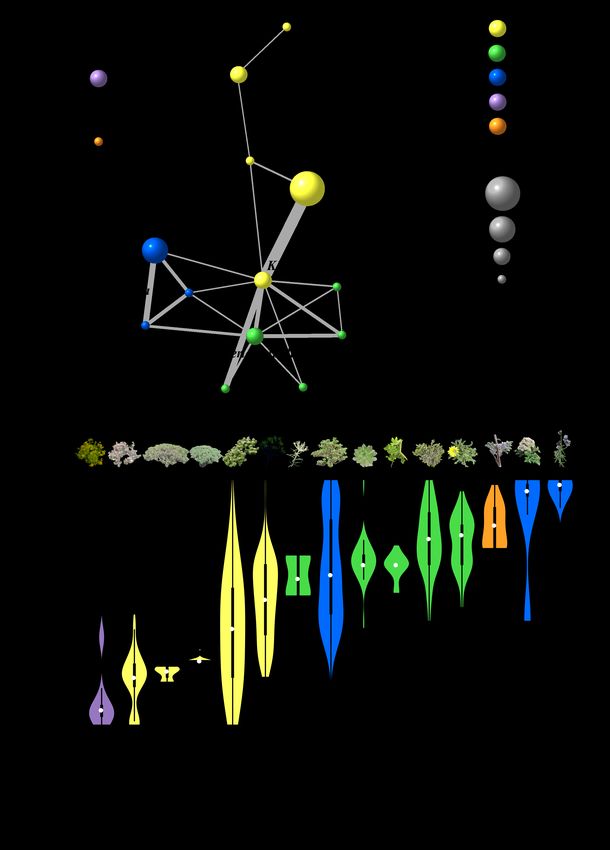
a
Frontiers of Biogeography 2021, 13.3, e49743
Frontiers of Biogeography
Research Article the scientific journal of
the International Biogeography Society
Co-occurrence frequency in vegetation patches decreases towards
the harsh edge along an arid volcanic elevational gradienta
Pia M. Eibes1* , Judith Eisenbacher2 , Carl Beierkuhnlein2 ,
Alessandro Chiarucci3 , Richard Field4 , Anke Jentsch5 ,
Tina Köhler2 , Ole R. Vetaas6 , and Severin D.H. Irl1
1
Institute of Physical Geography, Goethe-University Frankfurt am Main, Frankfurt am Main, Germany; 2 Department of
Biogeography, BayCEER, University of Bayreuth, Bayreuth, Germany; 3 Department of Biological, Geological and Environmental
Sciences, University of Bologna, Bologna, Italy; 4 School of Geography, University of Nottingham, Nottingham, UK;
5
Department of Disturbance Ecology, BayCEER, University of Bayreuth, Bayreuth, Germany; 6 Department of Geography,
University of Bergen, Bergen, Norway. *Corresponding Author: Pia M. Eibes, eibes@geo.uni-frankfurt.de
This paper is part of an Elevational Gradients and Mountain Biodiversity Special Issue.
Abstract Highlights
Positive plant–plant interactions are thought to drive
vegetation patterns in harsh environments, such as semi-arid • Different types of stress gradient may favour different
areas. According to the stress-gradient hypothesis (SGH), the types of biotic interactions (e.g., facilitation or
role of positive interactions between species (facilitation) is competition); elevational gradients are typically
expected to increase with harshness, predicting associated related to changes in temperature.
variation in species composition along environmental
gradients. However, the relation between stress and • We investigate an elevational gradient on La Palma,
facilitation along environmental gradients is debated. Canary Islands, where harshness inversely correlates
Furthermore, differentiating facilitative interactions from with elevation because of aridity, using a novel
other underlying mechanisms, such as microtopographic
heterogeneity, is not trivial. We analysed the spatial co- approach combining a co-occurrence and network
occurrence relationships of vascular plant species that analysis.
form patchy vegetation in arid lapilli fields (tephra) from
recent volcanic eruptions on La Palma, Canary Islands. • We find a decrease of positive co-occurrences with
We assume a harshness gradient negatively correlated increasing harshness, and different patterns for
with elevation because of more arid conditions at lower species richness and abundance.
elevations where water availability is considered the most
limiting resource. Based on the SGH we expect a greater • Co-occurrence patterns and their drivers appear to
degree of co-occurrence at lower elevations, as an outcome differ depending on whether temperature or aridity
of facilitation is plants co-occurring in the same patch. We determine the underlying harshness gradient.
tested this at both the species and the individual plant
level. We analysed the species composition of 1277 shrubby • Addressing the effects of harshness on co-occurrences
vegetation patches at 64 different sampling points, ranging helps to improve general hypotheses about biotic
from the coast to around 700 m a.s.l. Patch morphology interactions.
and microtopographic heterogeneity variables were also
measured, to account for their potential effects on the
species composition of patches. We used generalized linear
models and generalized mixed-effects models to analyse
species richness, number of individuals in patches and
percentage of patches with positive co-occurrences, and a
pairwise co-occurrence analysis combined with a graphical
network analysis to reveal positive links between 13 of the
species. We found that the percentage of patches with
positive co-occurrences increased at higher elevations, in
contrast to the predictions of the SGH, but in accordance with
a refined stress-gradient hypothesis for arid sites, in which
characteristics of the interacting species are incorporated.
Keywords: aridity gradient, Canary Islands, elevational gradient, facilitation, La Palma, oceanic island, plant–plant
interactions, species co-occurrence, stress-gradient hypothesis, volcanic substrate
e-ISSN: 1948-6596 https://escholarship.org/uc/fb doi:10.21425/F5FBG49743
© the authors, CC-BY 4.0 license 1Eibes et al. Plant co-occurrences along an arid elevational gradient
Introduction conditions and resource availability. Indeed, a collapse
of positive plant–plant interactions towards extremely
Plant–plant interactions, whether positive or
arid sites may be common in ecosystems where water
negative or reflecting complex dynamics, directly affect
the distribution and spatial organization of species at availability is the limiting factor.
local and regional scales (McIntire and Fajardo 2014). Plant patchiness is a characteristic pattern for water-
Negative plant–plant interactions (competition) have limited sites (Lejeune and Tlidi 2002, Rietkerk et al.
for a long time been thought to act as a biotic filter 2004). The drivers of species’ aggregation within
(White and Jentsch 2004) and thereby an important patches can include environmental heterogeneity, seed
factor shaping plant communities (Brooker et al. 2008). trapping, vegetative propagation, dispersal limitation
However, numerous studies in the last few decades and true biotic interactions (López et al. 2016).
have provided evidence that positive interactions Disentangling these reasons for species co-occurrences
(facilitation) play a crucial role as well (Bertness is not trivial because microsite particularities that favour
and Callaway 1994, Bruno et al. 2003, Michalet the establishment of one or more individual plants
2006). Facilitation describes positive interactions (or at least increase survival) will gain enormously in
between species within a single trophic level, for importance at harsh sites compared with more benign
which proposed underlying mechanisms are diverse. sites (Steinbauer et al. 2016). As a result, the effects
Facilitative interactions between plants can be direct of both microtopographic heterogeneity and positive
(e.g. nurse plants enabling the survival of a seedling biotic interactions may increase in a similar way. In
that would otherwise die) or indirect (e.g. enhanced other words, patchy vegetation cover might reflect
reproductive fitness through pollinator attraction by patchy environmental suitability, facilitative biotic
neighbouring plants) (Brooker et al. 2008, Tielbörger interactions or a combination of both. Additionally,
and Kadmon 2000), and change over time. It is now species tend to interact in complex networks rather
widely considered that positive interactions often than pairwise combinations, which results in indirect
contribute substantially to species distributions, and effects among plants through diffuse or intransitive
enhance local biodiversity, especially on sites where interactions (Losapio et al. 2019). Furthermore,
species have to cope with unfavourable conditions patterns of biotic interactions may change over time,
for plant growth and meet their environmental limits with a changing hierarchy of resource ratios, changing
(Cavieres and Badano 2009, McIntire and Fajardo stoichiometric requirements of individual species and
2014). thus of limiting factors, as suggested by the theory of
Stressful conditions usually prevail at the pulse dynamics and disturbance in ecology (Jentsch and
extremes of environmental gradients due to resource White 2019). However, there is increasing interest in
restrictions. Attempts to understand how the balance inferring plant–plant interactions from co-occurrence
of facilitative and competitive plant–plant interactions field data and promising statistical methods to analyse
change in increasingly harsh environments have complex co-occurrence data have been proposed.
led to the development of different conceptual These include pairwise interaction matrices (Gotelli
models. Bertness and Callaway (1994) proposed 2000, Veech 2013), uni- and bipartite network
the stress-gradient hypothesis (SGH), according to approaches (Morueta-Holme et al. 2016, Montesinos-
which facilitative interactions among plant species Navarro et al. 2018, Losapio et al. 2019), spatial pattern
increase when environmental conditions get harsher analysis (Wiegand et al. 2013, López et al. 2016) and
or disturbance increases, while the role of competition combinations of these (e.g., Fournier et al. 2016),
between plants plays a more important role at benign which can be applied to co-occurrence data derived
sites. The SGH has received empirical support from from field observations.
a number of studies along different stress gradients, Plants of the lapilli fields in the south of the
such as salinity (He et al. 2011, Zhang and Tielbörger volcanic Canary Island La Palma spatially organise
2019) and especially along elevational gradients in a characteristic mosaic of vegetation patches and
in cold alpine environments (Callaway et al. 2002, bare (tephra) soil. Here, we study an elevational
Cavieres et al. 2006). However, the SGH is still debated, gradient on these lapilli fields ranging from the coast
with several recent studies reporting contradictory towards the higher-elevation San Antonio volcano.
findings, such as a decreasing (Bonanomi et al. 2016) This elevational study gradient represents an inverse
or hump-shaped relationship (Maestre and Cortina harshness gradient, from most arid (harshest) near the
2004) between stress and facilitation, and even a coast to more mesic with increasing elevation (Irl and
lack of any facilitative interaction (Michalet et al. Beierkuhnlein 2011, Irl et al. 2020). Harshness towards
2006) or a shift to enhanced competition (Tielbörger the coastal edge of the gradient may also be increased
and Kadmon 2000, Armas and Pugnaire 2005) at the through increased salinity from salt spray exposure.
most extreme sites. Because most studies did not We therefore expect patches at lower elevations to
find enhanced facilitation in extremely dry areas (e.g., reflect the greater harshness by smaller patch size
Tielbörger and Kadmon 2000, Berdugo et al. 2018, and sparser patch organisation. According to the SGH,
Filazolla et al. 2020), a refined SGH was proposed for positive plant–plant interactions should increase in
aridity gradients (Michalet et al. 2006, Maestre et al. preponderance at harsher sites. Here, several species
2009). This revised hypothesis incorporates the life might act as facilitators (nurse plants), which should
histories of the interacting species, as well as the be reflected in high numbers of positive links with
respective stress factor in terms of environmental other plants of the same or different species. From this
Frontiers of Biogeography 2021, 13.3, e49743 © the authors, CC-BY 4.0 license 2Eibes et al. Plant co-occurrences along an arid elevational gradient
hypothesis we therefore expect a greater degree of lapilli ensures consistency of substrate type, controlling
species co-occurrence in patches at lower elevations, substrate variation. La Palma is characterized in
which should result in increased a) species richness, general by a subtropical climate with humid winters
b) number of individuals and c) percentage of patches and dry summers. However, precipitation varies
with positive co-occurrences. locally with high amounts on the north-eastern side
and lower amounts on the western and especially
Materials and Methods on the southern part of the island, and semi-arid
coastal areas. Mean annual precipitation ranges from
Study area 1,500 mm at the north-eastern part to 200 mm at the
La Palma is one of the seven main islands of the south-western part of the island (Irl et al. 2020). Fog
Canary archipelago in the Atlantic Ocean. The island drip can supplement lower amounts of precipitation
originates from eruptions of several volcanoes. Our during the drier summer months on a local scale,
study was conducted in the southern part of the depending on the topography and vegetation type
island in the Fuencaliente municipality (Fig. 1), where (Irl et al. 2015). Mean annual temperature decreases
the two most recent eruptions of the San Antonio from around 22 °C at the coast to around 9 °C at high-
volcano (1677) and the Teneguía volcano (1971) elevation summits (Irl et al. 2015). On the lapilli fields
formed an arid, black landscape consisting of lava of the Fuencaliente municipality, the arid conditions of
and lapilli fields (Klügel et al. 1999). Lapilli describes both climate and soil are associated with very patchy
pyroclastic fragments (tephra) with grain sizes ranging vegetation (Fig. 1).
from 2 to 64 mm, which are emitted during mafic
and silicic eruptions (Troll et al. 2017). The usually Sampling Design and Methods
high porosity of interconnected voids and a lack of In March 2018, we sampled 1277 vegetation
reactive silica characterize lapilli fields as nutrient patches at 64 different sampling sites along an
poor and dry environments with low water storage elevational gradient of approximately 650 metres,
capacity (Lomoschitz et al. 2006). Sampling only on ranging from the coast (17 m a.s.l.) to the top of the
Fig. 1. Study area on the Canary Island La Palma. A) La Palma is the second youngest island of the Canary archipelago;
B) 64 sampling sites along the elevational study gradient, ranging from the coast to approximately 700 m a.s.l. along the
slopes of the San Antonio volcano on the southern tip of La Palma; C) characteristic patchy vegetation on the lapilli fields;
D) multi-species patches (Aeonium davidbramwellii, Echium brevirame, Micromeria herpyllomorpha, Rubia fructicosa);
and E) single-species patches with an abiotic rock ‘partner’ (A. davidbramwellii) (Basemap sources A and B: Esri, Digital
Globe, GeoEye, Earthstar Geographics, CNES/Airbus DS, USDA, USGS, AeroGRID, IGN, and the GIS user community. Photos:
J. Eisenbacher).
Frontiers of Biogeography 2021, 13.3, e49743 © the authors, CC-BY 4.0 license 3Eibes et al. Plant co-occurrences along an arid elevational gradient
San Antonio volcano (675 m a.s.l.) thereby collecting Statistical analysis
information on a total of 31 plant species. The 64 All statistical analyses were performed using R
sampling sites were chosen randomly along the version 4.0.2 (R Core Team, 2020). The threshold
elevational gradient at intervals of roughly 15 m for determining significance was alpha = 0.05 for all
elevation. We avoided sites in close proximity to analyses.
roads and buildings as well as sites that showed any We used single-predictor generalized linear
signs of human disturbance or intensive land use. We models with a Gaussian error distribution to test
recorded elevation (m a.s.l.), slope (%) and aspect (°) how mean annual precipitation, patch volume, the
at the centre of each site. Starting from the central distance to the nearest neighbour as well as the
point, we marked the 20 closest vegetation patches site density proxy changed with elevation. We used
and measured the distance to the closest as well single-predictor and multi-predictor generalized linear
as the most remote patch. Patches with vegetation models with a Poisson error distribution (natural
entirely < 0.10 m in height were excluded from logarithm link function) to analyse changes in species
sampling, to avoid recording seedlings and annual richness and number of individuals within the patches
species, as we expect high seedling mortality rates (n patches = 1277, n species = 31) along the elevational
and annual species to be more prone to react to gradient. Single-predictor models were calculated
short-term weather fluctuations than to longer-term for each explanatory variable, respectively. For the
biotic interactions (Morris et al. 2008). The sampled multi-predictor models, environmental parameters
patches met our criteria for a patch according to the were tested for collinearity by using Spearman’s rank
definition by Tongway and Hindley (2004), which correlation. For all pairs of environmental parameters
defines a patch as a single plant or an association of with correlation coefficient > 0.6, one was excluded
plants, connected by living plant matter overlapping from further analysis based on strength of correlation
each other physically above ground or at least via a with the response variable (species richness or number
litter bridge. For each vegetation patch, we recorded of individuals in the patches) in the single-predictor
species richness, identity and abundance (number of models. The remaining variables were scaled to yield
individuals) of perennial species. We used the flora estimates in standard deviation without centering
of the Canary Islands (Muer et al. 2016) for species by the scale() function and then included in a first
identification and taxonomic nomenclature. We also multi-predictor model. We excluded non-significant
measured the patch height, width and length (all in parameters by manual stepwise model simplification,
m), estimated the percentage of dead wood and litter, and compared models using the Akaike information
the orientation of the longest patch side and the criterion (AIC) and pseudo-R2.
distance (m) to the nearest neighbouring patch. To Single-predictor and multi-predictor generalized
account for potential micro-topographic specificities linear models were performed using the glm() function
and micro-availability of nutrients, we recorded the in R. Pseudo-R2 (pseudo-r2 in the case of single-predictor
presence or absence of rocks, hills, depressions and models) was calculated using the Nagelkerke method,
rabbit excrement for each patch. with the PseudoR2() function in the “DescTools”
For each patch, we calculated the patch package (Signorell et al. 2020). To quantify the relative
volume (m3) by its measured height, length and contribution of the final explanatory variables, we
performed hierarchical partitioning with the hier.
width, respectively. For this, we used the formula part() function in the “hier.part” package (Mac Nally
2 and Walsh 2004), with root-mean-square prediction
* pi * a * b * c , where a, b and c are patch height,
3 error as the goodness-of-fit measure for Poisson-error
length and width, respectively. The formula glms. Categorical microsite specificities (Rocks, Hills,
describes a dome-shaped semi-ellipsoid that we Depressions, Rabbit excrements, None, Several) were
considered the most proximate geometric form for included as random effects in a subsequent generalized
the patch biomass above ground. We calculated a mixed-effects model with Poisson error distribution,
density proxy for each of the 64 sites by dividing the to account for microsite heterogeneity along the
distance from the site centre to the closest and the elevational gradient. We performed the generalized
most remote patch at each site. Density values closer mixed-effects models with the glmer() function in
to 1 therefore indicate patches in close proximity the “lme4” package (Bates et al. 2015) and used AIC
to each other (while still being small patches rather to compare this model with the final multi-predictor
than continuous vegetation), while values close to 0 generalized linear model, as Nagelkerke’s pseudo-R2
represent sites with very sparse patch organization. is not available for generalized mixed-effects models.
The amount of mean annual precipitation (mm) We analysed the species associations of the multi-
was extracted for each elevational site (n=64) from species patches by calculating a pairwise probabilistic
the interpolated precipitation dataset published by co-occurrence model, using the approach of Veech et al.
Irl et al. (2020). (2013). We implemented this in the “cooccur” package in
To approximate normality of residuals, the variables R (Griffith et al.2016) in combination with the R packages
patch volume, site density, amount of dead wood and “vegan” (Oksanen et al. 2019) and “MASS” (Venables and
litter were log transformed (natural logarithm), and Ripley 2002). To reduce the impact of rare species, we
the variables slope and distance to nearest neighbour excluded all species occurring in fewer than 5 of the 1277
were square-root transformed. patches from the co-occurrence and network analysis.
Frontiers of Biogeography 2021, 13.3, e49743 © the authors, CC-BY 4.0 license 4Eibes et al. Plant co-occurrences along an arid elevational gradient
By using the cooccur() function (“cooccur” package), Table 1). Species richness significantly increased with
we calculated a pairwise species co-occurrence increasing log-transformed number of individuals
matrix. This matrix was then compared to a probability per patch (Fig. 2C, Table 1). In the single-predictor
matrix, containing the expected co-occurrences of
the species, based on the probability mass function
of a hypergeometric distribution (Griffith et al. 2016).
A final output matrix was produced with positive (1),
neutral (0) or negative (-1) values for each species pair,
depending on whether the observed co-occurrences are
higher, equal or lower than the frequencies expected
from the probability matrix. In the cooccur() function,
we chose to activate a threshold that removed species
with less than one expected co-occurrence, and thus
reduced the amount of potential species pairs. A true-
random classifier in the function has to be defined to
statistically distinguish truly random from unclassifiable
associations, which we set to a stricter value (0.05) than
the default (0.1). This means that the deviance from
the expected co-occurrences should not be more than
0.05 times the total number of included sites to classify
a species association as truly random. As we were
mainly interested in positive plant–plant associations,
we subsequently excluded all random associations to
build an undirected species co-occurrence network,
where random or negative links between species are
not shown. We assessed the modularity of our final
network graph by calculating the leading non-negative
eigenvector of the community matrix according to the
method developed by Newman (2006) for undirected
unipartite networks. The network was built and its
modularity analyzed using the “igraph” package (Csardi
& Nepusz 2006); illustration was done in combination
with the free software “Inkscape”.
Based on the results of the co-occurrence and
network analyses, we identified all patches that
contained at least one positive co-occurrence pair.
We calculated the percentage of patches with positive
co-occurrences (number of patches with positive co-
occurrences/ number of patches at the site), as well as
the percentage of multi-species and multi-individuals
patches at each site. We used generalized linear
models with binomial errors to test these variables
against elevation.
Results
Co-occurrence pattern along the elevational Fig. 2. A) Plant species richness within patches slightly
gradient increases with elevation on La Palma, Canary Islands. B)
Within the 1277 patches among 64 different Number of individuals within patches along the study
sampling sites, we recorded 31 plant species in total. gradient is best explained by a weak U-shaped relationship.
Overall, 878 patches consisted of only one species C) Species richness increases with increasing number of
(single-species patches) and 399 patches consisted individuals in patches (please note that the number of
of more than one species (multi-species patches). individuals in patch is log-transformed by natural logarithm
Regarding the number of individuals (irrespective transformation). D) Mean annual precipitation significantly
of species), 613 patches consisted of only one increases with elevation, representing an inverse harshness
individual, while 664 patches consisted of more than
one individual. gradient. E) The number of individuals in a patch significantly
Species richness per patch slightly increased with increases with increasing patch volume (please note that
increasing elevation, our inverse proxy for harshness the x-axis in E is log-transformed by natural logarithm
(pseudo-r2 = 0.034; Fig. 2A; Table 1), while the number transformation). Pseudo-r2 by Nagelkerke. In plots A, B, C
of individuals per patch showed a weak U-shaped and E, n=1277 patches. Please note that explained variation
relationship with elevation (pseudo-r2 = 0.05) (Fig. 2B, is low for models shown in A-C.
Frontiers of Biogeography 2021, 13.3, e49743 © the authors, CC-BY 4.0 license 5Eibes et al. Plant co-occurrences along an arid elevational gradient
Table 1. Model statistics of best fit single-predictor generalized linear models explaining species richness (patch richness) and
number of individuals (patch individuals) within patches (log = natural log-transformation, sqrt = square root transformation).
Pseudo-r2 according to Nagelkerke. For all models, sample size was 1277 and the Poisson error distribution was used. For
most models, high sample size led to statistical significance, while explained variance (pseudo-r2) was very low.
dependent
model coefficient pseudo-r2 AIC p-value
variable
patch richness ~ site density (log) -0.024 0.000 3456.3 0.515 n.s.
orientation of longest 0.001 0.002 3453.9 0.091 n.s.
patch richness ~ patch side
patch richness ~ slope (sqrt) -0.044 0.004 3451.7 0.024 *
distance to nearest -0.038 0.022 3429.9 0.000 ***
patch richness ~ neighbour (sqrt)
patch richness ~ dead wood (log) 0.098 0.023 3428.6 0.000 ***
patch richness ~ litter (log) 0.100 0.029 3422.1 0.000 ***
patch richness ~ elevation 0.001 0.034 3416.0 0.000 ***
patch richness ~ patch volume (log) 0.107 0.090 3344.3 0.000 ***
patch richness ~ patch individuals (log) 0.043 0.250 3118.2 0.000 ***
patch individuals ~ site density (log) -0.048 0.003 8207.0 0.058 n.s.
orientation of longest 0.001 0.012 8195.7 0.000 ***
patch individuals ~ patch side
patch individuals ~ slope (sqrt) -0.117 0.062 8129.2 0.000 ***
distance to nearest -0.100 0.247 7849.8 0.000 ***
patch individuals ~ neighbour (sqrt)
patch individuals ~ poly(elevation,2) 10.044 0.276 7802.9 0.000 ***
patch individuals ~ dead wood (log) 0.300 0.319 7720.1 0.000 ***
patch individuals ~ litter (log) 0.352 0.467 7409.2 0.000 ***
patch individuals ~ patch volume (log) 0.321 0.837 5903.9 0.000 ***
generalized linear models, the number of individuals pairs, of which 28 pairs were removed as the expected
per patch was best explained by the patch volume co-occurrence was less than one. The analysis found
(pseudo-r2 = 0.84) with more individuals in bigger 45 of the remaining co-occurrences to be non-random,
patches (Fig. 2E, Table 1). Mean annual precipitation of which 22 were classed as positive co-occurrences
significantly increased with elevation (r2 = 0.967) and 23 as negative. All 15 species were included in the
(Fig. 2D, Table 2). Mean annual temperature decreased network produced from these data (Fig. 3A). Due to
significantly with elevation (see Fig. S1, Supplementary our focus on positive species associations, we chose
material). an undirected network, where links between species
The final multi-predictor model for species richness represent positive co-occurrences, while random or
per patch (pseudo-R2 = 0.187, AIC = 3220.4) included negative links are not shown (Fig. 3A). For 13 out of 15
five explanatory variables (Table 3). Adding microsite species we detected at least one positive co-occurrence
specificities as a random factor slightly improved with other plant species. Kleinia neriifolia (Asteraceae)
the model (AIC = 3161.1). Hierarchical partitioning showed the most co-occurrences with other species
revealed that the relative contribution of patch volume (npartners = 9), followed by Micromeria herpyllomorpha
and elevation was highest (Fig. S2, Supplementary (Lamiaceae, npartners = 7) and Todaroa aurea (Apiaceae,
material). The final multi-predictor model for the npartners = 4) (Fig. 3, Table S1 Supplementary material).
number of individuals per patch (pseudo-R2 = 0.914, The final network had a relatively low modularity
AIC= 5116.6) included seven explanatory variables and (0.24), with five modules. The two species without
was improved by the addition of microsite specificities any positive co-occurrence with other plant species
as random effects (AIC= 4992.5). Patch volume had the (Astydamia latifolia and Bystropogon origanifolius)
highest contribution to the total explained deviance constituted single-species modules.
(Fig. S2, Supplementary material). The percentage of multi-species patches and
multi-individual patches did not change significantly
Co-occurrence network analysis of main species with elevation (Table 4). The percentage of patches
Our co-occurrence matrix analysis included 1277 containing positive co-occurrences significantly
patches and 15 species, and led to 105 potential species increased with increasing elevation (pseudo-r2 = 0.183)
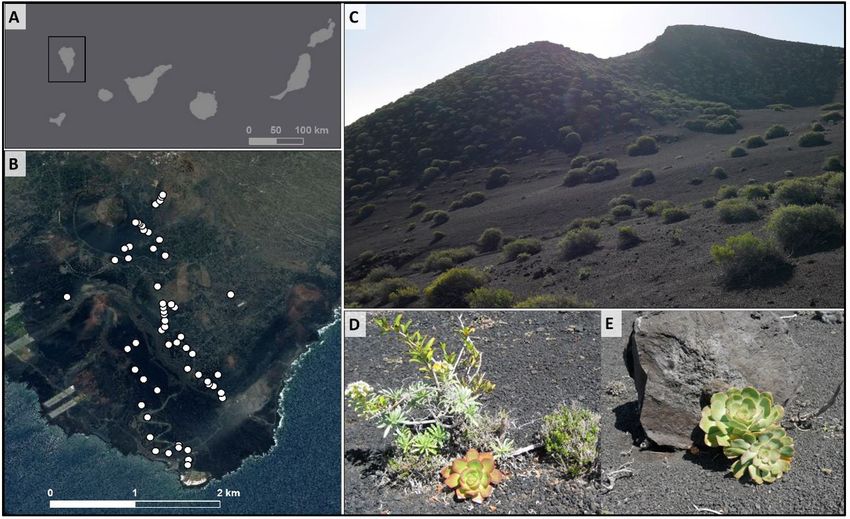
Frontiers of Biogeography 2021, 13.3, e49743 © the authors, CC-BY 4.0 license 6Eibes et al. Plant co-occurrences along an arid elevational gradient Fig. 3. A) Plant species co-occurrence network of the 1277 patches and the 15 main plant species of the study area, La Palma, Canary Islands. Colours show the module affiliation of each species, while circle size represents the occurrence frequency of a species within all patches. Links represent undirected positive co-occurrences between species. Thicker lines indicate higher co-occurrence frequencies of a connected species pair. The two species without any link, Astydamia latifolia and Bystropogon origanifolius, did not show any positive co-occurrence with other species and constitute single- species modules. B) Distribution of the same 15 species along the elevational study gradient illustrated by a violin plot based on species abundances at each elevation. Violin plots show the entire distribution of the data by combining a boxplot with a Kernel density plot. White dots represent the median, while interquartile ranges are indicated by the black bars. Colours indicate the module affiliation from panel A. (Plant icons by Pia Eibes based on photos by Judith Eisenbacher, Dagmar Hanz and Carl Beierkuhnlein). Frontiers of Biogeography 2021, 13.3, e49743 © the authors, CC-BY 4.0 license 7
Eibes et al.                                                               Plant co-occurrences along an arid elevational gradient

Table 2. Model statistics of best fit single-predictor generalized linear models explaining site parameters (distance to nearest
neighbor, patch volume and site density) as well as mean annual precipitation along the study gradient. (log = natural
log-transformation, sqrt = square root transformation). All models used Gaussian error distribution. For the first three
models, high sample size led to statistical significance, while explained variance (r2) was very low.
         dependent variable                         model          n=            r2            AIC        p-value
distance to nearest neighbour (sqrt)           ~   elevation      1277         0.009          6677.0       0.001         ***
patch volume (log)                             ~   elevation      1277         0.037          5623.0       0.000         ***
site density (log)                             ~   elevation      1277         0.036          2299.4       0.000         ***
precipitation                                  ~   elevation       64          0.967          515.11       0.000         ***

Table 3. Model statistics of best fit multi-predictor generalized linear models explaining species richness within patches
(patch richness) and number of individuals (patch individuals) in patches (log = natural log-transformation, sqrt = square
root transformation). Pseudo-R2 according to Nagelkerke. All models used Poisson error distribution and had a sample
size of n = 1277. The undermost row (1|microsite specificity) shows the model statistic of a generalized mixed-effects
model, where microsite specificities (Rocks, Hills, Depressions, Rabbit excrements, None, Several) were added to the final
generalized linear model. We compared the models according to their AIC values.
 dependent variable                                model                        pseudo-R2          AIC   p-value
patch richness              ~ elevation                                           0.187           4220.4 0.000            ***
                              +slope (sqrt)                                                               0.000           ***
                              +patch volume (log)                                                         0.000           ***
                              +distance to nearest neighbour (sqrt)                                       0.000           ***
                              +litter (log)                                                               0.000           ***
                              +(1|microsite specificity)                             -            3161.1
patch individuals           ~ elevation                                            0.914          5116.6 0.000            ***
                              +slope (sqrt)                                                               0.000           ***
                              +patch volume (log)                                                         0.000           ***
                              +orientation of longest patch side                                          0.000           ***
                              +distance to nearest neighbour (sqrt)                                       0.000           ***
                              +dead wood (log)                                                            0.000           ***
                              +litter (log)                                                               0.000           ***
                              +(1|microsite specificity)                               -          4992.5

Table 4. Model statistics of best fit single-predictor generalized linear models explaining the percentage of multi-species
patches, multi-individual patches and patches containing positive co-occurrences against elevation. Pseudo-r2 according
to Nagelkerke. For all models, sample size was 64 and a binomial error distribution was used.
           dependent variable                           model coefficient           pseudo-r2         AIC           p-value
multi-individual patches per site (in %)           ~   elevation -0.000               0.006          92.861      0.866 n.s.
multi-species patches per site (in %)              ~   elevation  0.002               0.024          69.887      0.155 n.s.
patches with positive co-occurrences               ~   elevation  0.004               0.183          42.727      0.041     *
per site (in %)

(Fig. 4, Table 4). The percentage of patches containing           sites comprise characteristic vegetation patterns with
negative co-occurrences did not change significantly              scarce biotic islands within a matrix of bare substrate;
along the elevational gradient (see Fig. S3,                      in the islands, perennial plants ameliorate the micro-
Supplementary material).                                          conditions and enable plant growth (Pugnaire et al.
                                                                  2011, Verwijmeren et al. 2013). Despite the significant
Discussion                                                        increase in precipitation with elevation, we did not find
                                                                  the expected pattern of smaller and more sparsely
   In our study site along an elevational harshness               growing patches toward the harsh edge at the coast.
gradient in an arid volcanic ecosystem, we found                  Against our expectation from the stress-gradient
plant species growing in a patchy vegetation, as is               hypothesis (SGH), we observed no increase in species
characteristic for dry sites. Such arid and semi-arid             richness within those patches or percentage of positive

Frontiers of Biogeography 2021, 13.3, e49743                                               © the authors, CC-BY 4.0 license     8
Eibes et al. Plant co-occurrences along an arid elevational gradient
interaction was recognized by previous studies.
Maestre et al. (2009) proposed a refinement of the
original SGH, recommending the incorporation of
species life history and stress factor characteristics.
Our results agree with those of other studies at
arid sites, where a peak of facilitative interactions
between plants at most extreme aridity seems to
be an exception and a reverse shift from positive
to negative or neutral interactions was frequently
observed (Berdugo et al. 2019, Lucero et al. 2020).
Species-specificity is probably one explanation for this
collapse of facilitative interactions at the most extreme
sites (Soliveres et al. 2012, Filazolla et al. 2020) and
also likely one of the reasons at our coastal gradient
edge (see Fig. 3B). The interpretation of co-occurrence
patterns is further complicated by potential additional
or overlapping stress gradients and species turnover.
Both factors might play a role when sampling across
environmental gradients or vegetation communities
(Gallien et al. 2018). An overlapping stress gradient
Fig. 4. Percentage of patches (n=64) containing positive co- imposed by enhanced salinity probably applies to
occurrences between plant species significantly increases the low elevations of our study gradient at the coast,
with increasing elevation on La Palma, Canary Islands. The where we did not detect any patches with positive co-
coastal sites at low elevations do not show any patches with occurrences (Fig. 4). Here, patches were mostly single-
positive co-occurrences. individual patches of Astydamia latifolia, a compact,
salt-tolerating, succulent shrub that is typically found
in rocky habitats along the Mediterranean coast
co-occurrences towards the harsh edge of the gradient (Pérez-Alonso et al. 1999). This species is evidently well
adapted to the arid and saline conditions in coastal
at low elevation. In contrast, there was a significant,
areas. It showed no significant positive co-occurrence
but weak increase of species richness per patch and link to other species of the study area, which indicates
percentage of patches with positive co-occurrences that the effect of adaptive traits might play a more
with increasing elevation (i.e. towards the more important role compared to plant–plant interactions
benign gradient section). This contradicts the findings to establish and survive in extremely dry habitats
of several studies along elevational gradients, which such as these (Soliveres et al. 2012). Hence, species
reported a notable shift from negative to positive identity and specificity should be considered when
plant–plant interactions with increasing harshness, as interpreting co-occurrence patterns.
predicted by the original stress-gradient hypothesis Patch morphology had an additional impact on
of Bertness and Callaway (1994). However, most species co-occurrences along the gradient. Small and
of these studies were conducted in high-elevation compact patches at the coast probably do not offer
(Choler et al. 2001, Callaway et al. 2002, Cavieres et al. similarly favourable conditions to establish as do the
2002) or high-latitude ecosystems (Dorrmann and larger and less dense canopies of patches at higher
Brooker 2002, Gavini et al. 2019), where changes elevations. This could have notable impact on the
in elevation primary reflect a temperature gradient potential to act as a facilitator or nurse plant, as was
(Körner 2003), whereas the elevational gradient in shown for cushion plants with varying morphology
this study is assumed to reflect a water limitation along an elevational gradient (Bonanomi et al. 2016).
gradient. Facilitative plant interactions seem to play The number of individuals per patch did not increase
an important role when environmental conditions towards the harsh gradient edge, but significantly
get colder, enhance local biodiversity and might increased with elevation and patch volume. As the
even represent a future protection mechanism for species richness per patch did not increase in a similar
alpine ecosystems (Cavieres et al. 2016). As we do proportion, we assume different drivers for these co-
not reach comparable elevations, and precipitation occurrence patterns. Plant aggregation in a patchy
amount increases with elevation while evaporative mosaic can be driven by biotic interactions, but as
demand decreases (Irl and Beierkuhnlein 2011), our patch volume explained a large part of the number
sampling gradient reflects an aridity-stress rather than of individuals in our sampled patches, seed trapping
a temperature-stress gradient, being most stressful and seedling survival in the shadow of adults might be
at the lowest elevations. Our findings indicate that the major driver. In sparsely vegetated environments,
different abiotic stress factors act when not sampling patches probably act as key accumulation objects
along a classic high-elevational gradient, resulting in for wind-dispersed seeds (López et al. 2016). This
a very different pattern of plant–plant interactions. explanation is supported by the fact that including
The fact that the nature of the stress factor the percentage of litter and dead wood as well as
might affect the outcome of studies analysing biotic microsite heterogeneity improved the explanatory
Frontiers of Biogeography 2021, 13.3, e49743 © the authors, CC-BY 4.0 license 9Eibes et al. Plant co-occurrences along an arid elevational gradient
power of the final model predicting the number of community level, as we have done, can serve as the
individuals per patch. Hence, patch morphology, and first step towards identifying potential biotic drivers
microsite heterogeneity and sun shelter by tall adults and relevant plant traits behind vegetation patterns
probably facilitate the establishment and survival of co-occurrence, especially in a study system where
of plants within the patch, rather than species- knowledge of underlying interactions is lacking, as are
specific facilitation mechanisms, as proposed by a priori hypotheses on which species may be facilitator
Steinbauer et al. (2016). The limited dispersal ranges or benefactor species.
of island species (Carlquist 1974) might furthermore
contribute to seed dispersal within or close to the Conclusions
parental patch. Additionally, woody shrubs in arid
sites often disperse by vegetative propagation (Bond We found that the percentage of positive co-
and Midgley 2001). We determined the number of occurrences slightly increased along an elevational
individuals within a patch by counting the above ground gradient in vegetation patches in an arid volcanic
distinguishable present plants. Regarding the strong environment and thus, did not increase towards the
slope of most sites and the easily erodible lapilli, true harsh edge of the sampled elevational gradient. This is
differentiation of individuals is therefore only possible consistent with the refined stress gradient hypothesis,
by genetic analyses or (destructive) sampling of the where positive plant–plant interactions are predicted
rooting network. Our results emphasize the importance to decrease at most extreme sites, which may be
of including information on morphology, microsite most applicable to aridity as a stressor. The number
topography and microsite soil water availability as well of individuals per patch revealed a different pattern
as testing co-occurrence patterns on different levels and increased with increasing elevation towards the
(species richness, number of individuals and relative more benign end of the gradient. Number of individuals
contribution of positive interactions) to disentangle was mainly correlated with patch morphology and
potential drivers of species aggregation in patches. microsite heterogeneity. Studying co-occurrences
Interactions between species are complex, and at the community scale can help to reveal potential
differentiation becomes more difficult the more interaction networks, but finds its limit when it comes
species a study area contains (Wisz et al. 2013). As to quantifying the intensity, the direction and the
a consequence, a lot of surveys focus on predefined mechanism of facilitation.
target species or few species pairs and neglect further
explanatory variables (Steinbauer et al. 2016). However, Acknowledgements
facilitative interactions are frequently concluded based
on species co-occurrences. We wanted to test whether CB was supported by the European Horizon 2020
positive species interactions could be identified by project 64176 ECOPOTENTIAL: Improving future
co-occurrence data without previous knowledge of ecosystem benefits through Earth Observations. We
potential facilitator species. Across all 31 species kindly thank the Caldera de Taburiente National Park
along the studied gradient, we found a network of 13
Directorate and Felix Medina from the Consejería
species with at least one positive co-occurrence link
de Medio Ambiente, Cabildo de La Palma, for field
to another species. Most of the species co-occurring
with others are common shrubs that are endemic to work permissions and their expertise on the study
La Palma or the Canary Islands. The species most often sites and flora. We thank the technical staff of the
occurring with other species was Kleinia neriifolia, a Biogeography department for their help during field
shrub from the Asteraceae family with archipelago-wide work preparation. We thank all participants of the La
distribution in the succulent scrub vegetation of the Palma Science School 2018 for fruitful discussions,
Canary Islands (del Arco-Aguilar et al. 2010); it rarely Dagmar Hanz for her valuable review of the first
grew alone. This indicates that the patchy vegetation manuscript version and support during the statistical
pattern here could be at least partly explained by biotic analysis and David Kienle for his support regarding
interactions and that several species might either act the statistical analysis and the figure illustration. We
as facilitators or benefactors. As it is difficult to infer thank Robert Whittaker, Lea de Nascimento and one
true facilitation exclusively by observed co-occurrence anonymous reviewer whose insightful comments
data, we here suggest a potential interaction network and suggestions have substantially improved the
without defining the mechanism, the direction or the manuscript.
intensity of the respective plant–plant interactions.
Moreover, quantifying facilitative interactions is Author Contributions
complicated by the complexity of potential interactions
in vegetation communities. It is difficult enough to
measure pairwise interactions, but understanding their PE, JE, TK, CB, AJ and SI designed the concept of
direction and effects becomes even more challenging this study. PE, JE, TK conducted the field work and
with increasing species richness. More species result in sampled the data with help and input from SI, CB, AC,
more complex networks, where indirect or intransitive
positive or negative effects of different species on each OV and RF. PE analysed the data with contributions
other might mask the underlying biotic interactions from JE. PE wrote the manuscript with contributions
(Losapio et al. 2019). Analyzing co-occurrences at a from all authors.
Frontiers of Biogeography 2021, 13.3, e49743 © the authors, CC-BY 4.0 license 10Eibes et al. Plant co-occurrences along an arid elevational gradient
Supplementary Material Bruno, J.F., Stachowicz, J.J. & Bertness, M.D. (2003)
The following materials are available as part of the Inclusion of facilitation into ecological theory.
online article at https://escholarship.org/uc/fb Trends in Ecology and Evolution, 18, 119–125.
Table S1. Species of the 15 main species of the co- Callaway, R.M., Brooker, R.W., Choler, P., et al., (2002)
occurrence analysis.
Figure S1. Mean annual temperature along the Positive interactions among alpine plants
elevational study gradient. increase with stress. Nature, 417, 844–848.
Figure S2. Hierarchical partitioning of the final multi- Carlquist, S.J. (1974) Island biology. Columbia
predictor glms. University Press.
Figure S3. Patches containing negative co-occurrences
along the study gradient. Cavieres, L.A., Arroyo, M.T.K., Peñaloza, A., Molina-
Montenegro, M. & Torres, C. (2002) Nurse
effect of Bolax gummifera cushion plants in the
References
alpine vegetation of the Chilean Patagonian
Armas, C. & Pugnaire, F.I. (2005) Plant interactions Andes. Journal of Vegetation Science, 13,
govern population dynamics in a semi-arid 547–554.
community. Journal of Vegetation Science, Cavieres, L.A., Badano, E.I., Sierra-Almeida, A.,
93, 978–989. Gómez-González, S. & Molina-Montenegro,
del Arco Aguilar, M.J., González-González, R., Garzón- M.A. (2006) Positive interactions between
Machado, V. & Pizarro-Hernández, B. (2010) alpine plant species and the nurse cushion
Actual and potential natural vegetation on plant Laretia acaulis do not increase with
the Canary Islands and its conservation elevation in the Andes of central Chile. New
status. Biodiversity and Conservation, 19, Phytologist, 169, 59–69.
3089–3140. Cavieres, L.A. & Badano, E.I. (2009) Do facilitative
Bates, D., Maechler, M., Bolker, B. & Walker, S. (2015) interactions increase species richness at the
Fitting linear mixed-effects models using entire community level? Journal of Ecology,
lme4. Journal of Statistical Software, 67, 1–48. 97, 1181–1191.
Berdugo, M., Maestre, F.T., Kéfi, S., Gross, N., Cavieres, L.A., Hernández-Fuentes, C., Sierra-
Le Bagousse-Pinguet, Y. & Soliveres, S. Almeida, A. & Kikvidze, Z. (2016) Facilitation
(2018) Aridity preferences alter the relative among plants as an insurance policy for
importance of abiotic and biotic drivers on
diversity in Alpine communities. Functional
plant species abundance in global drylands.
Ecology, 30, 52–59.
Journal of Ecology, 107, 190–202.
Choler, P., Michalet, R. & Callaway, R.M. (2001)
Berdugo, M., Soliveres, S., Kéfi, S. & Maestre, F.T.
Facilitation and competition on gradients
(2019) The interplay between facilitation and
in alpine plant communities. Ecology, 82,
habitat type drives spatial vegetation patterns
3295–3308.
in global drylands. Ecography, 42, 755–767.
Bertness, M.D. & Callaway, R. (1994) Positive Csardi, G. & Nepusz, T. (2006) The igraph software
interactions in communities. Trends in package for complex network research,
Ecology and Evolution, 9, 191–193. InterJournal, Complex Systems 1695.
Bonanomi, G., Stinca, A., Chirico, G.B., Ciaschetti, G., Dormann, C.F. & Brooker, R.W. (2002) Facilitation
Saracino, A. & Incerti, G. (2016) Cushion plant and competition in the high Arctic: the
morphology controls biogenic capability and importance of the experimental approach.
facilitation effects of Silene acaulis along an Acta Oecologica, 23, 297–301.
elevation gradient. Functional Ecology, 30, Filazolla, A., Lortie, C.J., Westphal, M.F. & Michalet,
1216–1226. R. (2020) Species specificity challenges the
Bond, W.J. & Midgley, J.J. (2001) Ecology of sprouting predictability of facilitation along a regional
in woody plants: the persistence niche. Trends desert gradient. Journal of Vegetation Science,
in Ecology and Evolution, 16, 45–51. 00, 1–12.
Brooker, R.W., Maestre, F.T., Callaway, R.M., et al., Fournier, B., Mouly, A. & Gillet, F. (2016) Multiple
(2008) Facilitation in plant communities: the assembly rules drive the co-occurrence
past, the present, and the future. Journal of of Orthopteran and plant species in
Ecology, 96, 18–34. grasslands: combining network, functional
Frontiers of Biogeography 2021, 13.3, e49743 © the authors, CC-BY 4.0 license 11Eibes et al. Plant co-occurrences along an arid elevational gradient
and phylogenetic approaches. Frontiers in (2006) Basaltic lapilli used for construction
Plant Science, 7, 1224. purposes in the Canary Islands, Spain.
Gallien, L., Zurell, D. & Zimmermann, N.E. (2018) Environmental & Engineering Geosciences,
Frequency and intensity of facilitation reveal 12, 327–336.
opposing patterns along a stress gradient. López, R.P., Squeo, F.A., Armas, C., Kelt, S.A. &
Ecology and Evolution, 8, 2171–2181. Gutiérrez, J.R. (2016) Enhanced facilitation
Gavini, S.S., Suárez, G.M., Ezcurra, C. & Aizen, M.A. at the extreme end of the aridity gradient
(2019) Facilitation of vascular plants by in the Atacama Desert: a community-level
cushion mosses in high-Andean communities. approach. Ecology, 97, 1593–1604.
Alpine Botany, 129, 137–148. Losapio, G., Montesinos-Navarro, A. & Saiz, H.
Gotelli, N.J. (2000) Null model analysis of species co- (2019) Perspectives for ecological networks
occurrence patterns. Ecology, 81, 2606–2621. in plant ecology. Plant Ecology and Diversity,
Griffith, D.M., Veech, J.A. & Marsh, C.J. (2016) cooccur: 12, 87–102.
probabilistic species co-occurrence analysis Lucero, J.E., Seifan, M., Callaway, R.M. & Lortie, C.J.
in R. Journal of Statistical Software, 69, 1–17. (2020) Positive associations with native
He, Q., Cui, B. & An, Y. (2011) The importance of shrubs are intense and important for an exotic
facilitation in the zonation of shrubs along a invader but not the native annual community
coastal salinity gradient. Journal of Vegetation across an aridity gradient. Diversity and
Science, 22, 828–836. Distributions, 26, 1177-1197.
Irl, S.D.H. & Beierkuhnlein, C. (2011) Distribution Mac Nally, R. & Walsh, C. (2004) Hierarchical
of endemic plant species on an oceanic island partitioning public domain-software.
– a geospatial analysis of La Palma (Canary
Biodiversity and Conservation, 13, 659–660.
Islands). Procedia Environmental Sciences,
7, 170–175. Maestre, F.T. & Cortina, J. (2004) Do positive
interactions increase with abiotic stress? A
Irl, S.D.H., Harter, D.E.V., Steinbauer, M.J., Gallego
Puyol, D., Fernández-Palacios, J.M., Jentsch, test from a semi-arid steppe. Proceedings of
A. & Beierkuhnlein, C. (2015) Climate vs. the Royal Society B, 271, 331–333.
topography – spatial patterns of plant species Maestre, F.T., Callaway, R.M., Valladares, F. & Lortie,
diversity and endemism on a high-elevation C.J. (2009) Refining the stress-gradient
island. Journal of Ecology, 103, 1621–1633. hypothesis for competition and facilitation
Irl, S.D.H., Obermeier, A., Beierkuhnlein, C. & in plant communities. Journal of Ecology,
Steinbauer, M.J. (2020) Climate controls plant 97, 199–205.
life-form patterns on a high-elevation oceanic McIntire, E.J.B. & Fajardo, A. (2014) Facilitation
island. Journal of Biogeography, 00, 1–13. as a ubiquitous driver of biodiversity. New
Jentsch, A. & White, P.S. (2019) A theory of pulse Phytologist, 201, 403–416.
dynamics and disturbance in ecology. Ecology, Michalet, R. (2006) Is facilitation in arid environments
100, 1–15. the result of direct or complex interactions?
Klügel, A., Schmincke, H.U., White, J.D.L. & Hoernle, New Phytologist, 169, 3–6.
K.A. (1999) Chronology and volcanology Michalet, R., Brooker, R.W., Cavieres, L.A., Kikvidze,
of the 1949 multi-vent rift-zone eruption
Z., Lortie, C.J., Pugnaire, F.I., Valiente-Banuet, A.
on La Palma (Canary Islands). Journal of
& Callaway, R.M. (2006) Do biotic interactions
Volcanology & Geothermal Research, 94,
267–282. shape both sides of the humped-back model
of species richness in plant communities?
Körner, C. (2003) Alpine plant life – functional
plant ecology of high mountain ecosystems. Ecology Letters, 9, 767–773.
Springer–Verlag, Berlin Heidelberg. Michalet, R. & Pugnaire, F.I. (2016) Facilitation
Lejeune, O. & Tlidi, M. (2002) Localized vegetation in communities: underlying mechanisms,
patches: a self-organized response to resource community and ecosystem implications.
scarcity. Physical Review, 66, 0109011- Functional Ecology, 30, 3–9.
0109014. Montesinos-Navarro, A., Estrada, A., Font, X., Matias,
Lomoschitz, A., Jiménez, J.R., Yepes, J., Pérez- M.G., Meireles, C., Mendoza, M., Honrado, J.P.,
Luzardo, J.M., Macías-Machín, A., Socorro, M., Prasad, H.D., Vicente, J.R. & Early, R. (2018)
Hernández, L.E., Rodríguez, J.A. & Olalla, C. Community structure informs species
Frontiers of Biogeography 2021, 13.3, e49743 © the authors, CC-BY 4.0 license 12Eibes et al. Plant co-occurrences along an arid elevational gradient
geographic distributions. PLoS ONE, 13, Tielbörger, K. & Kadmon, R. (2000) Indirect effects
e0197877. in a desert plant community: is competition
Morris, W.F., Pfister, C.A., Tuliapurkar, S., et al., among annuals more intense under shrub
(2008) Longevity can buffer plant and canopies? Plant Ecology, 150, 53–63.
animal populations against changing climatic Tongway, D.J. & Hindley, N.L. (2004) Landscape
variability. Ecology, 89, 19–25. function analysis: a system for monitoring
Morueta-Holme, N., Blonder, B., Sandel, B., McGill, rangeland function. African Journal of Range
B.J., Peet, R.K., Ott, J.E., Violle, C., Enquist,
& Forage Science, 21, 109–113.
B.J., Jørgensen, P.M. & Svenning, J.C. (2016)
A network approach for inferring species Troll, V.R., Carracedo, J.C., Jägerup, B., Streng, M.,
associations from co-occurrence data. Barker, A.K., Deegan, F.M., Perez-Torrado,
Ecography, 39, 1139–1150. F., Rodriguez-Gonzalez, A. & Geiger, H.
Muer, T., Sauerbier, H. & Cabrera Calixto, F. (2016) (2017) Volcanic particles in agriculture and
Die Farn- und Blütenpflanzen der Kanarischen gardening. Geology Today, 33, 148–154.
Inseln. Markgraf Publishers, Weikersheim.
Veech, J.A. (2013) A probabilistic model for analysing
Newmann, M.E.J. (2006) Modularity and community
species co-occurrence. Global Ecology and
structure in networks. Proceedings of the
National Academy of Sciences USA, 103, Biogeography, 22, 252–260.
8577–8582. Venables, W.N. & Ripley, B.D. (2002) Modern applied
Oksanen, J., Blanchet, G.F., Friendly, M., et al., (2019) statistics with S. Fourth Edn. Springer, New York.
vegan: community ecology package. R package Verwijmeren, M., Rietkerk, M., Wassen, M.J. & Smit,
version 2.5-5. C. (2019) Interspecific facilitation and critical
Pérez-Alonso, M.J., Velasco-Negueruela, A., Palá- transitions in arid ecosystems. Oikos, 122,
Paúl, J., Ramos-Vázquez, P.R., Pérez de Paz,
341–347.
P.L. & García Vallejo, M.C. (1999) Volatile
constituents from the fruits of Astydamia White, P.S. & Jentsch, A. (2004) Disturbance,
latifolia (L.fil.) Baillon grown in the Canary succession and community assembly in
Islands. Journal of Essential Oil Research, 11, terrestrial plant communities. In: Assembly
403–405. rules in restoration ecology – bridging the
Pugnaire, F.I., Armas, C. & Maestre, F.T. (2011) gap between theory and practise. (ed. by
Positive plant interactions in the Iberian V.M. Temperton, R. Hobbs, M. Fattorini, and
Southeast: mechanisms, environmental
S. Halle), pp. 341-366. Island Press Books.
gradients, and ecosystem function. Journal
of Arid Environments, 75, 1310–1320. Wiegand, T. & Moloney, K.A. (2013) Handbook of
Rietkerk, M., Dekker, S.C., de Ruiter, P.C. & van de spatial point-pattern analysis in ecology. CRC
Koppel, J. (2004) Self-organized patchiness Press, Taylor & Francis Group, New York.
and catastrophic shifts in ecosystems. Science, Wisz, M.S., Pottier, J., Kissling, W. D. et al., (2013)
305, 1926–1929. The role of biotic interactions in shaping
Signorell et mult. al. (2020) DescTools: tools for distributions and realized assemblages of
descriptive statistics. R package version
species: implications for species distribution
0.99.36.
modelling. Biological Reviews, 88, 15–30.
Soliveres, S., Eldridge, D.J., Hemmings, F. & Maestre,
F.T. (2012) Nurse plant effects on plant species Zhang, R. & Tielbörger, K. (2019) Facilitation from
richness in drylands: the role of grazing, an intraspecific perspective – stress tolerance
rainfall and species specificity. Perspectives determines facilitative effect and response
in Plant Ecology, Evolution and Systematics, in plants. New Phytologist, 221, 2203–2212.
14, 402–410.
Steinbauer, M.J., Beierkuhnlein, C., Khan, M.A.S.A., Submitted: 8 September 2020
Harter, D.E. V, Irl, S.D.H., Jentsch, A., Schweiger,
First decision: 20 October 2020
A.H. & Svenning, J., 2016. How to differentiate
facilitation and environmentally driven co- Accepted: 21 December 2020
existence. Journal of Vegetation Science, 27,
1071–1079. Edited by Robert J. Whittaker
Frontiers of Biogeography 2021, 13.3, e49743 © the authors, CC-BY 4.0 license 13You can also read