Cascade effect of rock bridge failure in planar rock slides: numerical test with a distinct element code
←
→
Page content transcription
If your browser does not render page correctly, please read the page content below
Nat. Hazards Earth Syst. Sci., 21, 1263–1278, 2021
https://doi.org/10.5194/nhess-21-1263-2021
© Author(s) 2021. This work is distributed under
the Creative Commons Attribution 4.0 License.

Cascade effect of rock bridge failure in planar rock slides:
numerical test with a distinct element code
Adeline Delonca1 , Yann Gunzburger2 , and Thierry Verdel2
1 Departamentode Ingeniería Metalúrgica y de Materiales (DIMM), Universidad Técnica Federico Santa Maria,
Campus San Joaquín, Santiago, Chile
2 GeoRessources, UMR 7359, Université de Lorraine – CNRS, Ecole des Mines de Nancy, Campus ARTEM,

BP14234 FR-54042 Nancy Cedex, France

Correspondence: Adeline Delonca (adeline.delonca@usm.cl)

Received: 24 August 2020 – Discussion started: 17 October 2020
Revised: 1 March 2021 – Accepted: 17 March 2021 – Published: 21 April 2021

Abstract. Plane failure along inclined joints is a classical      phenomenon generally results from the failure of weakness
mechanism involved in rock slope movements. It is known           planes and the fall of one or several rock blocks down to the
that the number, size and position of rock bridges along          target area (Corominas et al., 2005). In other words, the rock-
the potential failure plane are of prime importance when          fall hazard can be defined as the failure probability multiplied
assessing slope stability. However, the rock bridge failure       by the probability of propagation. While different probabilis-
phenomenology itself has not been comprehensively under-          tic methods exist to calculate the probability of propagation
stood up to now. In this study, the propagation cascade ef-       (Guzzetti et al., 2002; Jaboyedoff et al., 2005; Bourrier et al.,
fect of rock bridge failure leading to catastrophic block slid-   2009; Levy et al., 2018), the failure probability is more com-
ing is studied and the influence of rock bridge position in       plex to assess. Methods mainly based on expert judgement
regard to the rockfall failure mode (shear or tension) is         (Delonca et al., 2016), empirical methods (Jaboyedoff et al.,
highlighted. Numerical modelling using the distinct element       2005; Mazzoccola and Hudson, 1996; Dussauge-Peisser et
method (UDEC, Itasca) is undertaken in order to assess the        al., 2002) and kinematic analysis (Pappalardo and Mineo,
stability of a 10 m3 rock block lying on an inclined joint with   2015; Mineo et al., 2018; Kromer et al., 2018) have mostly
a dip angle of 40 or 80◦ . The progressive failure of rock        been used to date, but they do not consider the failure mecha-
bridges is simulated assuming a Mohr–Coulomb failure cri-         nism leading to the triggering of an event. Statistical analysis
terion and considering stress transfers from a failed bridge to   (Chau et al., 2003; Coe et al., 2004; Delonca et al., 2014) can
the surrounding ones. Two phases of the failure process are       also be used to approach the temporality of the hazard but
described: (1) a stable propagation of the rock bridge fail-      presents the same restriction as the other methods. However,
ures along the joint and (2) an unstable propagation (cascade     the understanding of the failure process of weakness planes
effect) of rock bridge failures until the block slides down.      is a major issue for risk assessment as it is responsible for the
Additionally, the most critical position of rock bridges has      generation of a rockfall and defines its time of occurrence.
been identified. It corresponds to the top of the rock block         The main parameter controlling the resistance of a rock
for a dip angle of 40◦ and to its bottom for an angle of 80◦ .    joint, and therefore the failure mechanism, is rock bridges
                                                                  (Dershowitz and Einstein, 1988; Dershowitz and Herda,
                                                                  1992), defined as areas of intact unfractured rock where dis-
                                                                  continuities have yet to propagate (de Vilder et al., 2017).
1   Introduction                                                  Therefore, intact rock bridges could be defined as portions
                                                                  of intact rock separating joint surfaces (Elmo et al., 2018).
Rockfall hazard is defined as “the probability of occurrence      Along the rock joint, the following are accounted for: (1)
of a potentially damaging rockfall within a given area and        rock bridge areas (intact rock), (2) open-crack areas, and
in a given period of time” (Varnes, 1984). The damaging

Published by Copernicus Publications on behalf of the European Geosciences Union.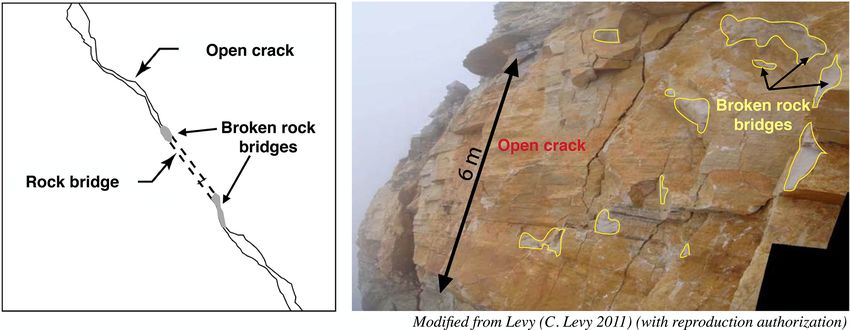
1264                                              A. Delonca et al.: Cascade effect of rock bridge failure in planar rock slides

(3) areas where rock bridges have already failed (“broken            models are defined. In Sect. 3, the results of our 2D simu-
rock bridges”) and where the joint surfaces are in frictional        lations are shown: stress redistribution along the joint after
contact. Figure 1a presents a diagram of a discontinuity             reducing the proportion of rock bridges is observed leading
along which these three elements can be observed. The photo          to the highlighting of the rock bridge failure phenomenology.
(Fig. 1b) was taken after the fall of an unstable block. The         In Sect. 4, the results are discussed and the influence of the
open-crack areas as well as the broken rock bridges are visi-        rock bridge location and the role of the tensile shear strength
ble. No rock bridges are observed in this photo; it is assumed       on the phenomenology is evaluated. Finally, the conclusions
that after the occurrence of the fall, there is no remaining rock    are presented in Sect. 5.
bridge along the former joint. Before the fall of the unstable
block, it can be expected that the broken rock bridge areas
identified in the photo were in fact composed of intact rock         2     Numerical modelling of the rock bridge failure
and fresh intact rock rupture (broken rock bridges).                       propagation
   Conceptually, the location and distribution of rock bridges
along a scar is supposed to control the failure mode (Tuckey         The simulations were undertaken with UDEC (Universal
and Stead, 2016; Stock et al., 2011). For example, the pres-         Distinct Element Code), a two-dimensional distinct element
ence of rock bridges over as little as just a few percent of         code developed by Cundall (Cundall, 1980) that can model
the detachment surface is known to significantly increase the        the mechanical, hydraulic and thermal behaviour of a frac-
factor of safety by increasing apparent overall cohesion of          tured rock mass. This code has successfully been used in past
a rock joint (Matasci et al., 2015; Tuckey and Stead, 2016).         studies to model the behaviour of rock discontinuities (Gu
Moreover, the location of a rock bridge is important for un-         and Ozbay, 2014; Jiang et al., 2006; He et al., 2018; Roslan
derstanding if rockfall fails in tension or shear, as it can form    et al., 2020). It has a scripting language embedded within it,
a pivot point about which the failing rock block is able to po-      FISH, that allows the user to create new model variables, cus-
tentially rotate and fail in tension (Stock et al., 2012; Bonilla–   tomize functionality and interact with the model. This func-
Sierra et al., 2015).                                                tionality has been decisive in the selection of the appropriate
   Moreover, various authors (Frayssines and Hantz, 2009;            numerical tools, as it allows the rock bridge areas, open-crack
Matasci et al., 2015; Tuckey and Stead, 2016) have shown             areas and broken rock bridge areas to be defined.
the very low proportion of rock bridges existing before the             UDEC models the rock medium as a collection of blocks
fall (between only 0.2 % to 5 % of the detachment surface).          separated by joints regarded as smooth planes. The blocks
In particular, Frayssines and Hantz (2009) have shown that           can be rigid or deformable. They can mechanically interact
rock blocks can remain stable for a long time thanks to rock         through discontinuities. A distinction is made between data
bridges and that the rock bridge proportion in the failure sur-      relating to blocks – nodes and corners – and data relating to
faces in these rock blocks may be very small (less than 1 %          discontinuities – contacts and domains. The characteristics
of the joint surface).                                               of the discontinuities are defined through the contacts.
   Previous research has shown that failure occurs through              In order to study the phenomenology of the failure, an ide-
progressive fracturing of intact rock bridges, in a process          alized two-dimensional numerical model has been defined.
termed step-path failure (Kemeny, 2005; Eberhardt et al.,            Therefore, there is no consideration of water infiltration, ther-
2004; Scavia, 1995; Brideau et al., 2009) that may in some           mal implication or icing impact on the discontinuity at this
cases be compared to a cascade-effect failure which can              stage, even though these phenomena may act as preparatory
cause rock bridges to fail like dominoes along sloping chan-         or triggering factors.
nels (Bonilla–Sierra et al., 2015; Harthong et al., 2012; Zhou
et al., 2015). The contribution of rock bridges has been im-         2.1    Geometry and definition of the two models
plemented in numerical models of rock slope stability us-
ing apparent cohesion (Eberhardt et al., 2004; Fischer et al.,       Two numerical models were built. Both models describe a
2010; Gischig et al., 2011) or areas of intact rock (Stead et al.,   potential plane failure along a pre-existing joint. Model 1
2006; Sturzenegger and Stead, 2009; Agliardi et al., 2013;           presents a joint with an 80◦ dip angle, while model 2 presents
Paronuzzi et al., 2016). These previous studies aimed to anal-       a dip angle of 40◦ . These two models have been proposed in
yse the failure modes and evolution of the rock bridges. How-        agreement with the objective of this work: to study the phe-
ever, they do not analyse the phenomenology of the rock              nomenology of the rock bridge failure. To do so, a steeply
bridge failure’s propagation.                                        dipping rock wall and a gentle slope are considered. These
   This paper studies (1) the phenomenology of the rock              two cases are defined in the function of the expected rock-
bridge failure propagation and (2) the influence of the rock         fall failure mode (shear or tension). It is expected that in the
bridges’ location, using a simple two-dimensional numeri-            case of a steep slope, a tensile and/or shear failure mode will
cal model. The paper is structured as follows. In Sect. 2,           be observed. Indeed, authors (Stock et al., 2012; Bonilla–
the numerical modelling process considered in the study is           Sierra et al., 2015) have highlighted that the location of a
presented: the geometry, characteristics and procedure of the        rock bridge is important for understanding if rockfall fails in

Nat. Hazards Earth Syst. Sci., 21, 1263–1278, 2021                                   https://doi.org/10.5194/nhess-21-1263-2021
A. Delonca et al.: Cascade effect of rock bridge failure in planar rock slides 1265
Figure 1. Left: definition of rock bridges; right: open-crack and failed-rock-bridge areas. Modified from Levy (2011) (with reproduction
authorization).
Table 1. Mechanical properties of the rock mass based on Urgonian
limestone.
Young’s Poisson’s Density
modulus (E) ratio (ν) (ρ)
68.9 GPa 0.31 26.9 kN/m3
Table 2. Elastic mechanical properties of typical rock joints in Ur-
gonian limestone.
Normal stiffness (kn ) Shear stiffness (ks )
6.9 GPa/m 2.7 GPa/m
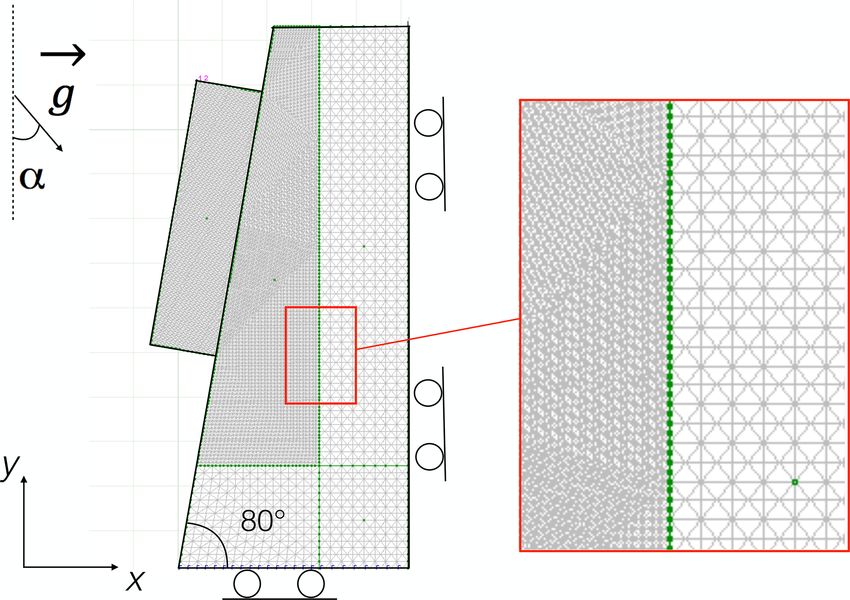
Figure 2. Geometry of both models. α is equal to 0◦ for model 1 nates in x and y (altitude). The behaviour of the rock joint is
(slope angle 80◦ ) and is equal to 40◦ for model 2 (slope angle 40◦ ).
defined by the mechanical properties implemented for each
individual contact (presented in Sect. 2.2). As only contacts
belonging to regions can be modified in UDEC, the rock joint
tension or shear, as they can form a pivot point about which was then divided into 100 regions of the same length that can
the failing rock block is able to potentially rotate and fail in represent either “rock bridges” or “open-crack” areas. This
tension. In the case of a gentle slope, only a shear failure division has been undertaken using the FISH language. Each
mode is expected. Therefore, it is possible to assess the influ- region can therefore include one or two contacts. During the
ence of the location of the rock bridges as well as the initial computation process, the local stress distribution along the
morphology of the rock wall. joint can lead to the rupture of some rock bridge regions,
The geometry of the two models is presented in Fig. 2. then becoming a region of “failed rock bridges” that behaves
The rock block presents a length of 6 m and a width of 1.5 m, as an open-crack area. This phenomenon progressively in-
leading to a total area of 9 m2 , which, considering an out-of- creases the number of open-crack regions along the joint.
plane thickness of 1 m, is also the volume (in m3 ) defined as Once the models are meshed, they are loaded only by grav-
“particularly dangerous for linear infrastructures and private ity to evaluate the initial local state of stress along the joint.
residence” (Effendiantz et al., 2004). The total height of the
model is 12 m. In practice, the geometry of the two models is 2.2 Mechanical parameters
the same; only the inclination of gravity is changed (angle α
in Fig. 2). An elastic model is assumed for the rock blocks, and a Mohr–
During the meshing process, 128 contacts were created Coulomb elasto-plastic model is assumed for the rock joint
along the joint located between the block and the underlay- (contacts along the joint). A contact exhibits a shear failure
ing rock mass. Each contact can be defined by its coordi- mode when the local stress reaches the Mohr–Coulomb fail-
https://doi.org/10.5194/nhess-21-1263-2021 Nat. Hazards Earth Syst. Sci., 21, 1263–1278, 2021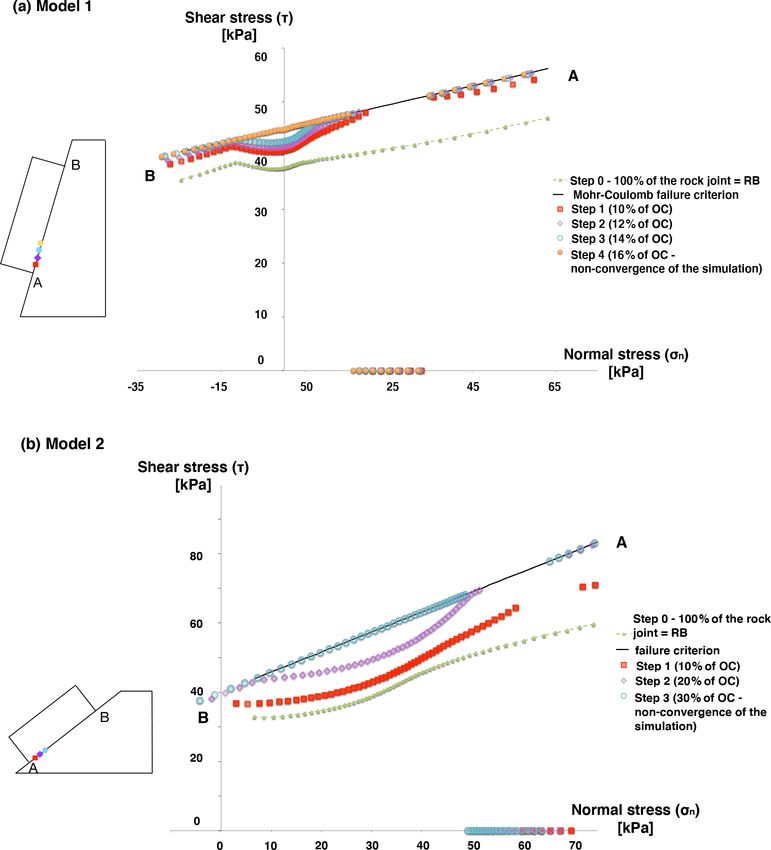
1266                                            A. Delonca et al.: Cascade effect of rock bridge failure in planar rock slides

ure criterion and a tensile failure mode when its tensile nor-      1. All the 100 regions and so the 128 contacts of the rock
mal stress becomes equal to the assigned tensile strength.             joint are initially considered rock bridge (RB). In other
   The mechanical properties of the rock blocks (Table 1)              words, 100 % of the rock joint is defined as RB. The
were defined based on a literature review of a common lime-            model is run to equilibrium under gravitational loading.
stone in the French Alps (“Urgonian” limestone) (Frayssines,           This corresponds to the initial stage (Step 0).
2005). This limestone has been considered the reference in
this study as it forms high cliffs in south-eastern France,         2. Disturbances are introduced into the system. To do so,
where present traces of failed rock bridges are widely doc-            selected regions along the joint are transformed into
umented (Frayssines and Hantz, 2006).                                  open crack (OC) regions using FISH language (steps 1
   Along the rock joint, three types of contact are considered:        to n, with n being the maximum number of steps be-
                                                                       fore the block does not stabilize anymore). These re-
 1. rock bridge (RB) contacts which behave elastically with            gions can be selected randomly considering a uniform
    the same characteristics as the intact rock; to determine          distribution or chosen intentionally by the user at spe-
    the normal and shear stiffness of the rock bridges, a cen-         cific locations. During these steps, X % of the rock joint
    timetric opening of the joint has been considered;                 is defined as OC and (100 − X) % is defined as RB. At
                                                                       each of these calculating steps, the introduction of dis-
 2. open crack (OC) contacts which represent an absence of
                                                                       turbance induces a stress redistribution along the joint,
    contact along the joint and behave in a perfectly plastic
                                                                       which leads to the failure of some rock bridges, then
    way;
                                                                       converted into RBF. This introduction of open-crack ar-
 3. rock bridge failed (RBF) contacts that failed due to               eas simulates a virtual time as it represents the aper-
    stress transfers along the joint and behave in a perfectly         ture of a crack and the propagation of the discontinuity
    plastic way after their rupture.                                   through the rock bridges. It simulates the joint alteration
                                                                       that can be caused by, for example, water, freeze–thaw,
RB and RBF contacts have the same mechanical elastic pa-               root growth or another external parameter.
rameters; the only difference between them comes from the
fact that RB contacts present a purely elastic behaviour, while     3. New open cracks are introduced stepwise (Step n) until
RBF contacts present an elasto-plastic behaviour.                      the block does not stabilize anymore.
   The normal and shear stiffnesses of RB and RBF contacts
have been defined based on a literature review of Urgonian         At each step of the modelling process, the following data are
limestone fractures (Frayssines, 2005). They are presented in      recorded:
Table 2.                                                             – the normal and shear stresses at each contact along the
   The failure envelope properties of RB and RBF contacts              rock joint,
(cohesion, friction angle and tensile strength) were defined
following a step-by-step procedure. As the objective of the          – the number of contacts considered open crack (OC),
numerical modelling is to study the phenomenology of the
rock bridge failure propagation, the failure criterion has to        – the number of considered failed contacts (open crack
be close enough to the initial stresses along the joint, when          and rock bridges that failed due to the increased of the
considering only RB contacts. Therefore, during a first step,          stresses, OC + RBF).
the distribution of stresses has been evaluated and com-           Considering this modelling protocol, different scenarios have
pared to “classical” failure criteria provided in the literature   been considered:
(Frayssines, 2005). Then, in a second step, the characteris-
tics of the criteria have been decreased to fit the objective.       – Scenario 1. The propagation of an open fracture was
The classical values and the ones defined with this procedure          simulated. A 60 cm long area of open crack (OC) (10 %
for the RB and RBF contacts are presented in Table 3. Even if          of the rock joint length) was initially defined, located at
the values considered in the study are much lower than those           the lower part of the rock joint (30 cm from point A) for
found in literature, it is assumed that the failure propagation        both model 1 and model 2. Then, a progressive propa-
phenomenology will be the same as in reality. In the case of           gation of the open crack upwards was simulated (in this
OC contacts all the values are taken as equal to 0 (Table 3) to        part of the study, contacts are not randomly modified
ensure the phenomenology is identified and not polluted by             from RB to OC.) At each step, the open-crack area is
other behaviour.                                                       enlarged. For model 1, an increase of 2 % of the rock
                                                                       joint length is imposed (12 cm long area of open crack).
2.3    Modelling protocol                                              For model 2, an increase of 10 % of the rock joint length
                                                                       is imposed (60 cm long area of open crack).
The modelling protocol proposed to study the rock bridge
failure phenomenology is based on the following steps. It is         – Scenario 2. The influence of rock bridge location along
summarized in Fig. 3.                                                  the joint was studied. (1) Open cracks are introduced

Nat. Hazards Earth Syst. Sci., 21, 1263–1278, 2021                                https://doi.org/10.5194/nhess-21-1263-2021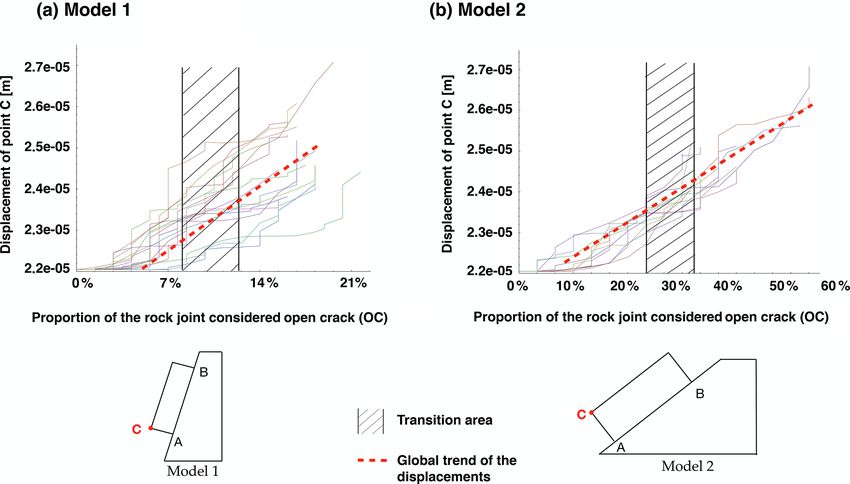
A. Delonca et al.: Cascade effect of rock bridge failure in planar rock slides                                                     1267

Table 3. Shear strength characteristics of RB, RBF and OC areas along the joint for both model 1 and model 2.

                                        Classical         Rock bridge (RB)           Rock bridge (RB)         Open-crack
                                        rock bridge       and failed rock bridge     and failed rock bridge   (OC) model 1
                                        characteristics   (RBF) model 1              (RBF) model 2            and model 2
                  Cohesion C            23 MPa            45 kPa                     40 kPa                   0 Pa
                  Angle of friction     54◦               10◦                        30◦                      0◦
                  Tensile strength TS   7 MPa             10 kPa                     10 kPa                   0 Pa

       into the upper part of the rock joint (30 cm from point          crease in these shear stresses in the vicinity of the OC area.
       B), and (2) open cracks are introduced into the lower            This increase in the shear stresses brings the joint closer to
       part of the joint (30 cm from point A). This protocol was        the failure criterion not only in the vicinity of the OC area but
       followed for both dip angles – 40 and 80◦ . For model 1,         also elsewhere, in particular at contacts located in the upper
       an increase of 2 % in the rock joint length is imposed at        part of the rock joint (point B in Fig. 4). The normal stresses
       each step (12 cm long area of open crack). For model 2,          slightly vary during this first stage.
       an increase of 10 % in the rock joint length is imposed             During each subsequent Step 2 to n, 2 % of additional con-
       at each step (60 cm long area of open crack).                    tacts are modified from RB to OC in model 1 and 10 % of
                                                                        additional contacts are modified from RB to OC in model 2.
    – Scenario 3. A total of 40 simulations with a random in-           These modifications induce the failure of rock bridges di-
      troduction of new OC contacts were carried out to statis-         rectly near the OC contacts by increasing the shear stresses
      tically compare results. For model 1, an increase of 2 %          along the rock joint, but the model reaches a mechanical
      in the rock joint length is imposed at each step (12 cm           equilibrium at the end of each step. There is also an increase
      long area of open crack). For model 2, an increase of             in the normal stresses along the rock joint. This phenomenon
      10 % in the rock joint length is imposed at each step             continues until no mechanical equilibrium is reached any-
      (60 cm long area of open crack).                                  more, which is associated with the downward sliding of the
  It can be noted that the numerical model has been validated           block (simultaneous failure of all the contacts).
by comparing the stresses evaluated by a simple theoretical                The non-convergence of the model occurs when 16 % of
analytical calculation of a block laying on an inclined plane           the contacts are converted to OC in the case of model 1 and
by numerical shear and normal stress values.                            30 % for model 2.
                                                                           These results highlighted two phases during the rock
                                                                        bridge failure: a first phase during which only the intention-
3     Results                                                           ally created open-crack contacts are observed and a second
                                                                        phase during which the stress transfers induce the additional
3.1    Stress transfer and RB failure induced by the                    failure of rock bridges. In other words, in a first phase, the
       introduction of new OC contacts                                  crack enlarges without inducing rupture elsewhere, and in a
                                                                        second phase the open crack reaches a state where rupture
To study the phenomenology of rock bridge failure (RB and               self-propagation starts until the block slides along the joint.
RBF), the evolution of normal and shear stresses along the
joint during the stepwise introduction of open-crack (OC)               3.2    Rock bridge cascading failure phenomenology
contacts has been analysed in detail. To do so, Scenario 1
was considered.                                                         To study more specifically rock bridge cascading failure phe-
   Figure 4 presents, for both model 1 and model 2, the dis-            nomenology, Scenario 2 was considered. Results are pre-
tribution of the normal and shear stresses along the rock joint         sented in Fig. 5 in terms of the proportion of so-called “failed
at different equilibrium steps 0 to n.                                  contacts” (OC + RBF) versus the proportion of OC contacts
   First, the distribution of the stresses along the rock joint is      along the joint. For both dip angles, there is a first linear
presented at Step 0, considering that the joint is only com-            phase during which the only failed contacts are the intention-
posed of rock bridges. In the case of model 1 (slope of 80◦ ),          ally introduced OC ones. During this first phase, the block
tension (σn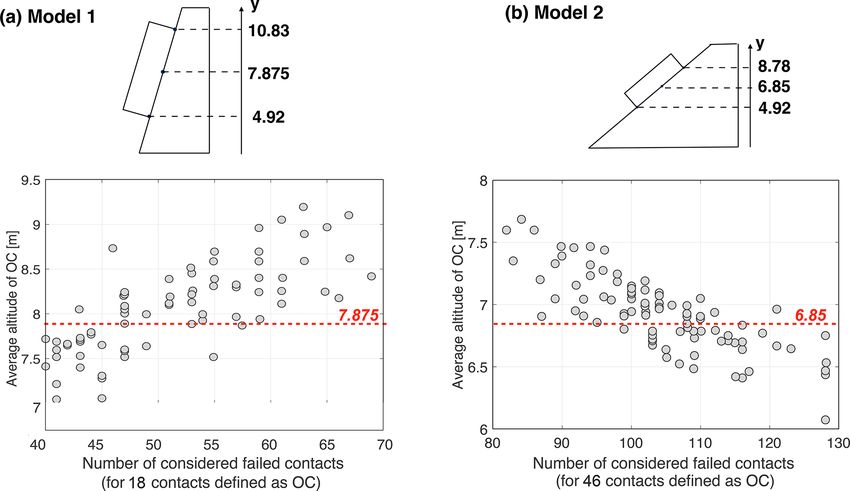
1268                                              A. Delonca et al.: Cascade effect of rock bridge failure in planar rock slides

Figure 3. Modelling process. Step 0: 100 % of the rock joint is defined as rock bridge (RB). Step 1 to Step n: introduction of open crack
(OC) contacts along the joint. From Step 2 to Step n, in the graph of model 1 the increase in shear stresses due to the introduction of OC
contacts can be introduced.

highlights the cascading failure phenomenology affecting the           model 2, the second phase begins for an average of (29±5) %
rock bridges. The slope of the linear regression in this second        of the rock joint defined as OC, and the slide of the block oc-
phase is around 10 in the case of model 1 and 5 in the case of         curs for an average proportion of (44 ± 5) %. The transition
model 2, meaning that the introduction of 1 OC contact leads           area (Figs. 5–7) has first been identified in Fig. 6 and reported
to the failure of 10 RB contacts for model 1 and 5 RB con-             in Figs. 5–7. It corresponds to the transition between both
tacts for model 2. This second phase starts for approximately          phases in the propagation of the rock bridge failure and is
8 % of the rock joint defined as OC for model 1 and 23 % for           due to the difference in the location of the RB.
model 2. The start of this phase differs slightly depending on
the position of the RB and OC along the joint.
                                                                       3.3   Block displacement with time
   The non-convergence of the model starts when OC con-
tacts represent 19 and 35 % of the joint for models 1 and 2
respectively.                                                          In order to check whether there is a correlation between the
   Based on these preliminary results, Scenario 3 was consid-          two phases of rock bridge failure and the displacement that
ered. Results are shown in Fig. 6.                                     can be monitored on a potentially unstable block, a tracking
   For both model 1 and model 2, two phases in the propaga-            point (C), shown in Fig. 7, has been introduced. Such a point
tion of the rupture may be identified for all the simulations          could easily be instrumented in the real case of motion track-
carried out. In the case of model 1, the second phase starts for       ing if displacements of the order of millimetres are observed
an average of (10 ± 2) % of the rock joint defined as OC, and          before the failure of the block.
the slide of the block (non-convergence of the simulation)                Scenario 3 was considered. The displacement of point C
occurs for an average proportion of (20 ± 1.5) %. Regarding            was studied versus the proportion of OC along the joint,
                                                                       which is a marker of “virtual time”. The movement is no

Nat. Hazards Earth Syst. Sci., 21, 1263–1278, 2021                                      https://doi.org/10.5194/nhess-21-1263-2021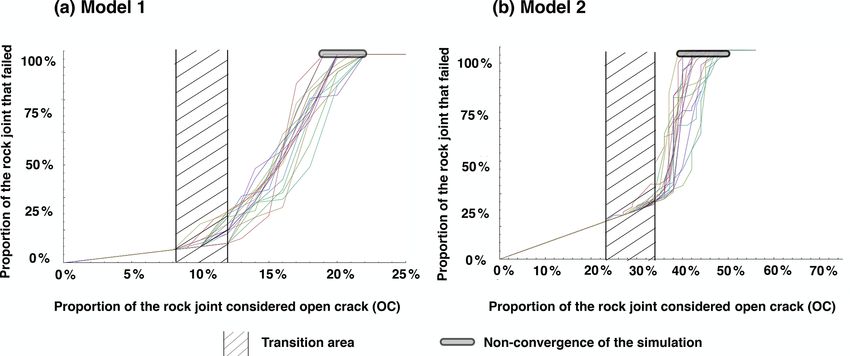
A. Delonca et al.: Cascade effect of rock bridge failure in planar rock slides                                                          1269

Figure 4. Distribution of the normal and shear stresses for models 1 and 2 considering Scenario 1. The different steps represent the introduc-
tion of new OC contacts until the model does not converge anymore. The points on the x axis have normal stress but no shear stress as if the
friction angle were zero. Each colour between point A and point B in the model corresponds to the step presented in the graph.

longer recorded as soon as all the contacts have failed, be-             duce the additional failure of rock bridges. Based on these
cause the computation does not converge anymore.                         results, the influence of different parameters on this observed
   Figure 7 shows that there is only one phase when consider-            phenomenology was tested. The results are presented below.
ing the displacement. Both phases identified previously can-
not be observed through displacement. To be certain of this              4.1    Influence of OC location on the evolution of RBF
result, a smaller mesh has been defined, and the same results                   with time
have been obtained.
                                                                         As highlighted by different authors (Tuckey and Stead, 2016;
                                                                         Stock et al., 2011), the location of the rock bridges has a
                                                                         strong impact on the stability of a potentially unstable block.
4   Discussion                                                           To see whether our model leads to the same conclusion, the
                                                                         following protocol has been followed:
The results highlight that the rock bridge failure phe-
nomenology presents two phases: a first phase during which                 1. A number N of contacts is defined to be OC and ran-
only the intentionally created open-crack contacts are ob-                    domly located along the joint. N is equal to 18 for
served and a second phase during which stress transfers in-                   model 1 (14 % of the joint) and to 46 for model 2 (36 %

https://doi.org/10.5194/nhess-21-1263-2021                                       Nat. Hazards Earth Syst. Sci., 21, 1263–1278, 2021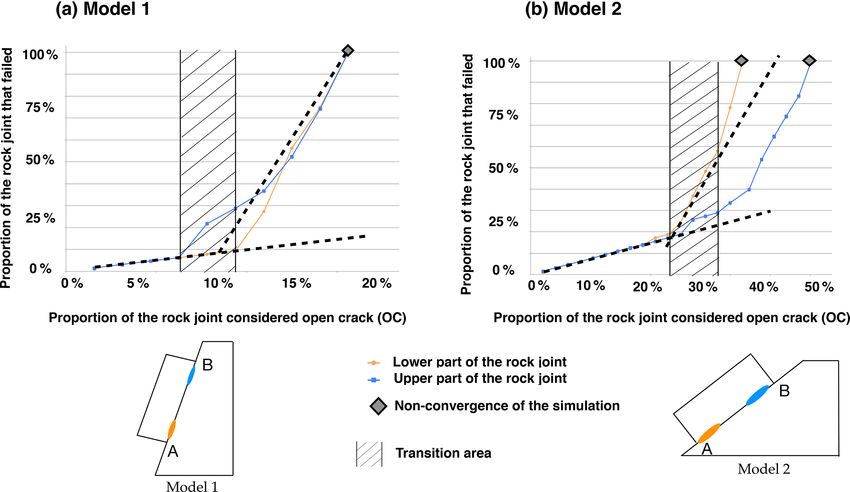
1270                                                 A. Delonca et al.: Cascade effect of rock bridge failure in planar rock slides

Figure 5. Propagation of rock bridge failure for models 1 and 2 considering Scenario 2. Intentionally introduced OC contacts are located in
the upper part of the joint (blue curve) or in the lower part of the joint (orange curve). The proportion of the rock joint that failed is defined
as a ratio between the number of failed contacts (OC + RBF) and the total number of contacts (OC + RB + RBF).

Figure 6. Propagation of rock bridge failure for models 1 and 2 considering Scenario 3 in the case of randomly introduced new OC contacts.

     of the joint). These values were chosen for the model                 To maximize the number of data, Scenario 3 is run two times,
     to be in the second phase, where the cascading failure                and therefore 80 models are considered.
     phenomenology affecting the rock bridges is observed                     The results are presented in Fig. 8. The figure (top part)
     (Sect. 3.2). As seen previously, these proportions are                shows the values of the minimum, maximum and average
     sufficient to induce the additional RBF.                              contact altitude along the rock joint for both model 1 and
                                                                           model 2. It also shows (bottom part) the total number of con-
  2. The number of considered failed contacts (OC + RBF)                   sidered failed contacts for a number N of contacts defined to
     is determined.                                                        be OC with respect to the average altitude of the OC contacts
                                                                           for both model 1 and model 2.
  3. The number of failed contacts is compared to the aver-
     age altitude of the OC contact.

Nat. Hazards Earth Syst. Sci., 21, 1263–1278, 2021                                           https://doi.org/10.5194/nhess-21-1263-2021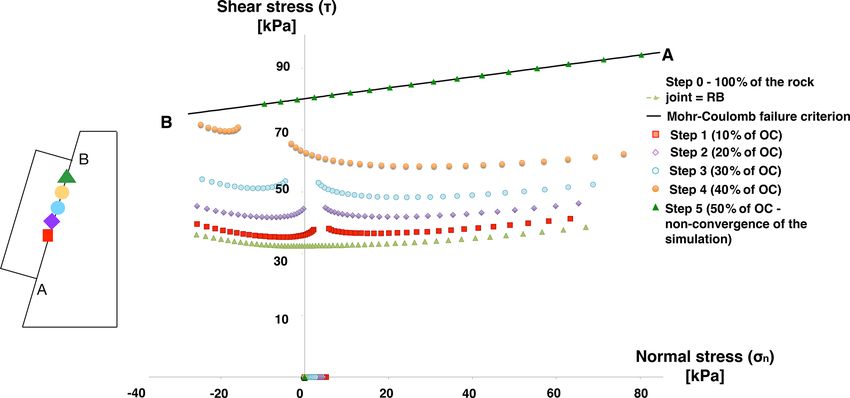
A. Delonca et al.: Cascade effect of rock bridge failure in planar rock slides                                                          1271

Figure 7. Displacement of point C (in metres) with respect to the proportion of OC contacts along the joint, for models 1 and 2 considering
Scenario 3. The transition zone presented here corresponds to the one defined previously (Sect. 3.2).

Figure 8. Number of considered failed contacts for a number N of contacts defined to be OC with respect to the average altitude (y coordinate)
of the OC contacts, for models 1 and 2 considering Scenario 3 (run two times). N is equal to 18 and 46 for model 1 and 2 respectively.

   Figure 8a presents the results of model 1. It highlights                This difference highlighted between the two models can be
that there are a larger number of failed contacts (OC + RBF)             explained by the distribution of the stresses along the joint.
when the OC contacts are localized on average in the up-
per part of the joint. Figure 8b shows that, for model 2, con-
trary to model 1, there are a larger number of failed contacts             1. In model 1, there is tension in the upper part of the rock
(OC + RBF) when the OC are localized on average in the                        joint (Fig. 4a) when considering 100 % of RB contacts.
lower part of the joint.                                                      To the contrary, in model 2, there is no tension along the
                                                                              rock joint (Fig. 4b).

https://doi.org/10.5194/nhess-21-1263-2021                                       Nat. Hazards Earth Syst. Sci., 21, 1263–1278, 2021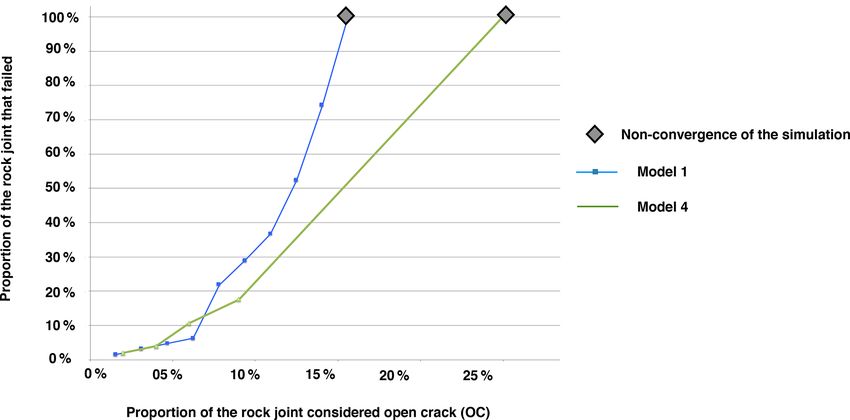
1272 A. Delonca et al.: Cascade effect of rock bridge failure in planar rock slides
2. During the introduction of new OC contacts, the stresses Table 4. Mechanical characteristics of rock bridges in model 3 used
increase along the entire rock joint and more specifically when studying the effect of tensile strength. The dip angle is equal
around the OC area. Therefore, the distance to the fail- to 80◦ .
ure criterion must play an important role if it is assumed
that the increase in stresses is made in a homogeneous Rock bridge Rock bridge
(RB) model 1 (RB) model 3
way, which seems to be the case based on Fig. 4. For
model 1, the distance to the criterion is the smallest in Cohesion C 45 kPa 130 kPa
the upper part of the block and vice versa for model 2, Friction angle 10◦ 10◦
which may explain the influence of the position of the UCS 107 kPa 312 kPa
open crack. Tensile strength TS 10 kPa∗ 31.2 kPa
∗ As defined in model 1.
Figure 8 highlights the presence of the critical position of
the OC area. Figure 9 presents the histogram of the average
altitude of OC contacts. The critical position could be de-
failure of 6 % of the joint at the initial Step 0 (eight contacts
fined as the position where, for the same proportion of OC
present a tensile normal stress that becomes equal to the as-
contacts, more RBF contacts will be generated than in any
signed tensile strength). At each subsequent step, 10 % of
other position along the joint. In the case of model 1, the crit-
additional OC contacts are introduced along the rock joint.
ical position of the open-crack area corresponds to the upper
Because the cohesion is 3 times higher than for model 1, the
part of the joint (i.e. RB located preferentially in the lower
stresses along the joint are further away from the failure cri-
part of the joint). To the contrary, for model 2, it is the OC
terion of rupture than for model 1 (Fig. 10). As observed pre-
area located in the lower part of the joint that corresponds
viously, the normal and shear stresses progressively increase.
to the critical position (RB located in the upper part of the
It can be noted, as for the previous models, there is a more
joint). These results combined with geophysical-tool inves-
significant increase in the shear stress in the vicinity of the
tigations (Stock et al., 2011; Matasci et al., 2015; Paronuzzi
OC area. Up to 40 % of the joint can be defined as OC area
et al., 2016; Guerin et al., 2019; Frayssines and Hantz, 2006;
before the calculation does not converge anymore.
Paronuzzi and Serafini, 2009; Spreafico et al., 2017) could
For model 3, the transition phase identified previously is
allow the prioritization of the potentially unstable blocks.
comprised of between 40 % and 50 % of the rock joint de-
4.2 Role of the tensile strength in the evolution of RBF fined as OC, while in model 1, it is comprised of between
with time 10 % and 20 %. In other words, when increasing cohesion
value, the proportion of open-crack area needs to be higher
In the presented study, as the tensile strength is relatively to reach the cascading failure affecting the rock bridges than
high in comparison with the cohesion and the friction an- when considering low cohesion values. It justifies that in re-
gle, only shear failure was observed, and no tensile failure ality, as the cohesion values of the rock bridges are 500 times
was reported. Based on this observation, it is needed to study higher than in the study presented in this paper, only a few
more specifically the role of tensile strength in the evolution portions of rock bridges allow a potentially instable block to
of RBF with time. To do so, a new model 3 has been de- be in place. The second phase observed in the paper occurs
fined and run. It is based on model 1 (dip angle of 80◦ ) as instants before the fall of the block.
model 1 shows tension. In the new model, a tensile trunca- This study shows that, when considering tensile failure
tion was added to the Mohr–Coulomb failure criterion. The through the tensile truncation of the Mohr–Coulomb failure
tensile strength (TS) has been taken as equal to the uniaxial criterion, a proportion of failed rock bridges comes from the
compressive strength (UCS) value divided by 10 (UCS / 10). tensile stresses along the joint. However, the same “bi-phase”
The compressive strength is calculated according to Eq. (1). propagation failure phenomenology was observed regardless
of the comprehensive consideration of the tensile failure.
2c cos ϕ
UCS = , (1) 4.3 Influence of RBF shear strength on the results
1 − sin ϕ
with c being the cohesion and φ the friction angle. In the modelling procedure presented in Sect. 2.3 and applied
The mechanical characteristics of model 3 are listed in Ta- to models 1 to 3, the rock bridges that failed during the calcu-
ble 4. The cohesion value has been increased in comparison lation (RBF) are considered to keep the same shear strength
to model 1 for numerical modelling requirements: when con- values as RB. This hypothesis has been made to consider as-
sidering the same cohesion value, the model was not converg- perity that can exist along areas of failed rock bridges. An
ing. The cohesion value has been increased until the model alternate approach would be to consider that RBF contacts
could be run. behave like OC contacts. This is discussed hereafter, by the
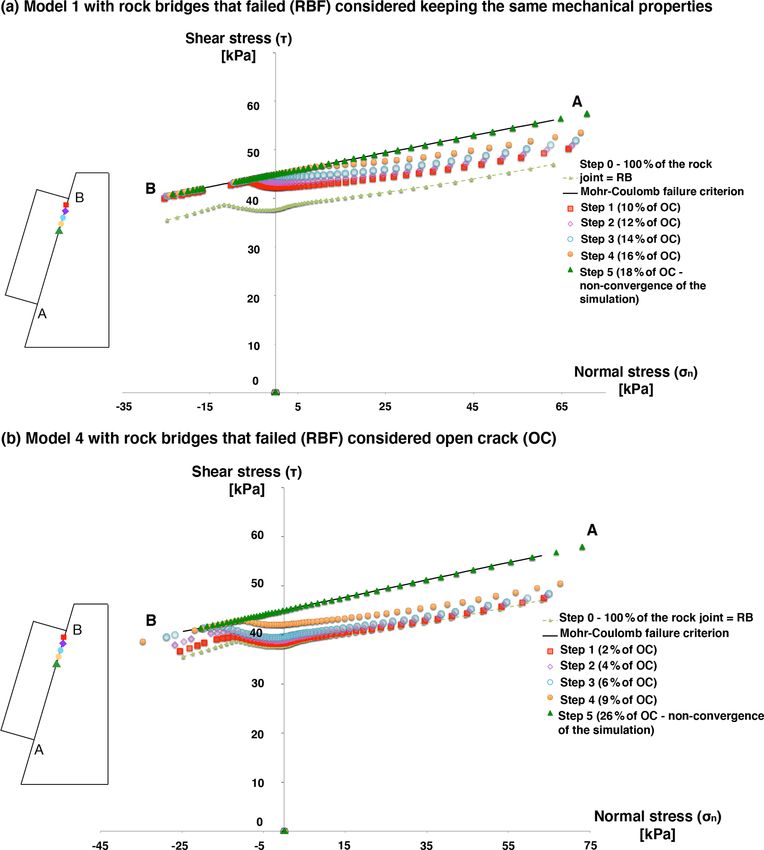
The results are presented in Fig. 10. The tensile trunca- mean of an additional model 4 comprising only two types of
tion of the Mohr–Coulomb failure criterion results in tensile contact: RB and OC. RBF are considered to behave as OC.
Nat. Hazards Earth Syst. Sci., 21, 1263–1278, 2021 https://doi.org/10.5194/nhess-21-1263-2021A. Delonca et al.: Cascade effect of rock bridge failure in planar rock slides 1273 Figure 9. Histogram of the average altitude (y coordinate) of the OC contacts, for models 1 and 2 considering Scenario 3 (run two times). N is equal to 18 and 46 for model 1 and 2 respectively. Figure 10. Distribution of the normal and tangential stresses in the plane of Mohr for model 3 considering Scenario 1. The various steps represent the introduction of 10 % of open-crack (OC) contacts each time, until the non-convergence of the model. This model is based on model 1 (dip angle of 80◦ ), to which which is in agreement with what was observed before. When it will be compared. considering 16 % of the joint defined as OC (last step be- The new OC contacts will be introduced into the upper part fore the model does not converge), there are 22 % failed con- of the joint as it has been highlighted that for model 1, there tacts (OC + RBF). Model 4 stops converging for 26 % of OC are a larger number of failed contacts (OC + RBF) when the (Fig. 11b). Therefore, considering two or three types of con- OC contacts are localized on average in the upper part of the tact gives similar results. To test this theory, Fig. 12 presents joint. the proportion of so-called failed contacts (OC + RBF) ver- Figure 11 presents the distribution of stresses along the sus the proportion of OC contacts along the joint. It shows joint at different steps of computation for models 1 and 4. that the two phases highlighted previously are again identi- The first OC area is introduced into the upper part of the fied. The main difference comes from the fact that consider- joint, 10 cm away from point B. It is observed, as previ- ing only two types of contact, the first phase is smaller. ously, that there is a general increase in shear stresses and a very small increase in normal stresses. Model 1 stops con- verging when 18 % of the joint is defined as OC (Fig. 11a), https://doi.org/10.5194/nhess-21-1263-2021 Nat. Hazards Earth Syst. Sci., 21, 1263–1278, 2021
1274                                               A. Delonca et al.: Cascade effect of rock bridge failure in planar rock slides

Figure 11. Normal and shear stress distribution for (a) model 1 in the case where three types of contact are considered (open crack (OC),
rock bridge (RB), rock bridge that failed (RBF)) and (b) model 4 if the contacts defined as rock bridges that failed are automatically changed
to open crack (OC) – Scenario 1.

4.4    Influence of the rock bridges’ mechanical                         that have yet to be overcome. From a numerical point of view,
       properties                                                        modelling less than 1 % of the joint as rock bridges would
                                                                         require an extremely dense meshing, due to the high stress
                                                                         concentration and stress gradients in the rock bridge areas. In
In this study, the choice has been made to consider much
                                                                         order to answer the objective of this paper, which is to high-
lower strength properties of the rock bridges than in real-
                                                                         light the phenomenology of the rock bridge failure propaga-
ity (see Sect. 2.2), due to numerical restrictions. Indeed, it
                                                                         tion and not to accurately represent rock bridge behaviour,
has been shown by various authors (Frayssines and Hantz,
                                                                         the authors have considered that decreasing the mechanical
2009; Matasci et al., 2015; Tuckey and Stead, 2016) that only
                                                                         properties of the rock bridges is an adequate way of answer-
a few percent of rock bridges along the detachment surface
                                                                         ing the presented difficulty.
are enough to maintain a compartment in a stable state. This
                                                                            Despite the fact that low rock bridge mechanical prop-
extremely low proportion of rock bridges brings modelling
                                                                         erties are imposed by numerical modelling restrictions, it
challenges, such as high stress concentration at rock bridges,

Nat. Hazards Earth Syst. Sci., 21, 1263–1278, 2021                                        https://doi.org/10.5194/nhess-21-1263-2021
A. Delonca et al.: Cascade effect of rock bridge failure in planar rock slides 1275
Figure 12. Propagation of rock bridge failure for (a) model 1 in the case where three types of contact are considered (open crack (OC), rock
bridge (RB), rock bridge that failed (RBF)) and (b) model 4 if the contacts defined as rock bridges that failed are automatically changed to
open crack (OC) – Scenario 2.
is essential to assess the influence of this choice. The au- shear failure mode along a steep slope. This observation can
thors feel confident in the proposed methodology as mod- be directly related to the influence of the rock bridges’ po-
els have been realized with higher mechanical properties and sitions on the stability of the block. In the case of a steep
have shown similar phenomenology. An example of this is slope, the critical position of the rock bridges corresponds to
model 3, which considers in particular a higher cohesion the lower part of the joint. To the contrary, for a gentle slope,
value (130 kPa for model 3 compared to 45 kPa for model 1). it is the rock bridges located in the upper part of the joint that
Moreover, as shown by previous research, the compartment is critical. This result is consistent with previously published
instability occurs through progressive fracturing of intact work (Tuckey and Stead, 2016; Stock et al., 2011).
rock bridges, in a process termed step-path failure (Kemeny, These interesting results lead to a better understanding of
2005; Eberhardt et al., 2004; Scavia, 1995; Brideau et al., the failure mechanism leading to the triggering of a rockfall.
2009) that may in some cases be compared to a cascade- They help complement the current assessment methods of the
effect failure: they can fail like dominoes along sloping chan- failure probability of the rockfall hazard. In particular, they
nels (Bonilla–Sierra, et al., 2015; Harthong et al., 2012; Zhou describe why it can be so challenging to assess the occur-
et al., 2015). The study presented in this paper corrobo- rence probability of such events and the temporal probability
rates the previously observed cascade-effect failure of rock (Delonca et al., 2016).
bridges. Furthermore, the work presented in this paper has high-
lighted the importance of the rock bridge location and its
assessment. Therefore, the use of geophysical investigations
5 Conclusions could allow the prioritization of the potentially unstable
blocks. It is to be noted that the monitoring of displacements
The work presented in this paper has allowed the phe- does not seem to be a good indicator to identify the two
nomenology of rock bridge failure to be studied. It has shown phases in the failure propagation and, therefore, to be able
that the rock bridge failure phenomenology can be associated to anticipate or predict the acceleration of the rock bridge
with a cascade-effect failure (two phases in the failure propa- failure. Moreover, the monitored displacement in the models
gation), which is consistent with previous research. This phe- is of less than a hundredth of a millimetre, and this quantity
nomenon can be explained by the increase in the shear stress is very difficult to monitor in the field.
in the vicinity of the open-crack areas, which can lead to the Finally, while interesting results have been drawn and val-
failure of the neighbouring rock bridges. idated by previous work, additional work needs to be carried
Moreover, it has been highlighted that the stress redistri- out and could be the topic of future studies:
bution along the rock joint is directly related to the geometry
and failure mode of the rock block: when considering a shear – The choice of low rock bridges’ shear strength char-
failure mode (sliding along a gentle slope), the increase in acteristics, even if justified, does not allow a perfect
the shear stress is slower than when considering a tensile or comparison with real case conditions to be made. This
https://doi.org/10.5194/nhess-21-1263-2021 Nat. Hazards Earth Syst. Sci., 21, 1263–1278, 20211276 A. Delonca et al.: Cascade effect of rock bridge failure in planar rock slides
means that more work has to be carried out to better References
model the cascade-effect failure of the rock bridges for
realistic environments. From a numerical point of view, Agliardi, F., Crosta, G. B., Meloni, F., Valle, C., and Rivolta,
an extremely dense meshing could be realized to over- C.: Structurally-Controlled Instability, Damage and Slope Fail-
ure in a Porphyry Rock Mass, Tectonophysics, 605, 34–47,
come the current limitations exposed in the presented
https://doi.org/10.1016/j.tecto.2013.05.033, 2013.
work. Bonilla–Sierra, V., Scholtès, L., Donzé, F., and Elmouttie,
M.: DEM Analysis of Rock Bridges and the Contribu-
– Only shear and tension failure modes have been consid- tion to Rock Slope Stability in the Case of Translational
ered in the presented study, in order to focus on repre- Sliding Failures, Int. J. Rock Mech. Min., 80, 67–78,
https://doi.org/10.1016/j.ijrmms.2015.09.008, 2015.
sentative failure modes, that would allow clear conclu-
Bossi, G., Borgatti, L., Gottardi, G., and Marcato, G.: The Boolean
sions about the phenomenon of failure and in particular Stochastic Generation Method – BoSG: A Tool for the Anal-
the cascade effect of the failure to be drawn. To com- ysis of the Error Associated with the Simplification of the
plete the analysis, more failures mode could be consid- Stratigraphy in Geotechnical Models, Eng. Geol., 203, 99–106,
ered (for example transitional failure mode). https://doi.org/10.1016/j.enggeo.2015.08.003, 2016.
Bourrier, F., Dorren, L., Nicot, F., Berger, F., and Darve, F.: Toward
Objective Rockfall Trajectory Simulation Using a Stochastic Im-
– The choice of discretizing the joint into regions and con- pact Model, Geomorphology, 110, 68–79, 2009.
sidering only a uniform distribution has allowed a first Brideau, M.-A., Yan, M., and Stead, D.: The Role of Tec-
approximation of the process involved in the rock bridge tonic Damage and Brittle Rock Fracture in the Development
failure to be observed. However, it would be interesting of Large Rock Slope Failures, Geomorphology, 103, 30–49,
to test other random distribution (Bossi et al., 2016) and https://doi.org/10.1016/j.geomorph.2008.04.010, 2009.
consider that every contact along the joint can be modi- Chau, K. T., Wong, R. H. C., Liu, J., and Lee, C. F.: Rockfall Haz-
fied (not only the region). This should be considered in ard Analysis for Hong Kong Based on Rockfall Inventory, Rock
future work. Mech. Rock Eng., 36, 383–408, 2003.
Coe, J. A., Michael, J. A., Crovelli, R. A., Savage, W. Z.,
Laprade, W. T., and Nashem, W. D.: Probabilistic Assessment
– A simplified planar open crack has been considered in of Precipitation-Triggered Landslides Using Historical Records
the presented work. In reality, a discontinuity presents of Landslide Occurrence, Seattle, Washington, Environ. Eng.
asperity, rugosity and defects that could affect the shear Geosci., 10, 103–22, 2004.
strength of the plane. This point could be integrated into Corominas, J., Copons, R., Moya, J., Vilaplana, J. M., Altimir, J.,
future work. and Amigó, J.: Quantitative Assessment of the Residual Risk in
a Rockfall Protected Area, Landslides, 2, 343–357, 2005.
Cundall, P. A.: UDEC-A Generalised Distinct Element Program
for Modelling Jointed Rock, DTIC Document, available at:
Code availability. The code can be found in the first author’s PhD
https://apps.dtic.mil/dtic/tr/fulltext/u2/a087610.pdf (last access:
thesis, available here – Annex 7: http://docnum.univ-lorraine.fr/
20 July 2020), 1980.
public/DDOC_T_2014_0184_DELONCA.pdf (Delonca, 2021).
Delonca, A.: Les incertitudes lors de l’évaluation de départ
des éboulements rocheux, Ph. D thèses, Université de Lor-
raines, Français, 2014, available at: http://docnum.univ-lorraine.
Data availability. The data are available by contacting the corre- fr/public/DDOC_T_2014_0184_DELONCA.pdf, last access:
sponding author. 19 April 2021.
Delonca, A., Gunzburger, Y., and Verdel, T.: Statistical correlation
between meteorological and rockfall databases, Nat. Hazards
Author contributions. AD was responsible for investigation, formal Earth Syst. Sci., 14, 1953–1964, https://doi.org/10.5194/nhess-
analysis and writing of the original draft. YG was responsible for 14-1953-2014, 2014.
conceptualization, methodology, review and editing of the paper, Delonca, A., Verdel, T., and Gunzburger, Y.: Influence of
and supervision. TV was responsible for conceptualization, method- expertise on rockfall hazard assessment using empirical
ology, review and editing of the paper, and supervision. methods, Nat. Hazards Earth Syst. Sci., 16, 1657–1672,
https://doi.org/10.5194/nhess-16-1657-2016, 2016.
Dershowitz, W. S. and Einstein, H. H.: Characterizing Rock Joint
Competing interests. The authors declare that they have no conflict Geometry with Joint System Models, Rock Mech. Rock Eng.,
of interest. 21, 21–51, 1988.
Dershowitz, W. S. and Herda, H. H.: Interpretation of Fracture
Spacing and Intensity, in: American Rock Mechanics Associ-
Review statement. This paper was edited by Daniele Giordan and ation, available at: https://www.onepetro.org/conference-paper/
reviewed by three anonymous referees. ARMA-92-0757 (last access: 10 July 2020), 1992.
de Vilder, S. J., Rosser, N. J., Brain, M. J., and Vann Jones, E. C.:
Forensic Rockfall Scar Analysis: Development of a Mechani-
Nat. Hazards Earth Syst. Sci., 21, 1263–1278, 2021 https://doi.org/10.5194/nhess-21-1263-2021A. Delonca et al.: Cascade effect of rock bridge failure in planar rock slides 1277 cally Correct Model of Rockfall Failure, Landslides: Putting Ex- Tech., 72, 242–249, https://doi.org/10.1016/j.tust.2017.11.031, perience, Knowledge and Emerging Technologies into Practice, 2018. 829–839, Association of Environmental & Engineering Geolo- Jaboyedoff, M., Dudt, J. P., and Labiouse, V.: An attempt to refine gists (AEG), Zanesville, Ohio, available at: http://www.aegweb. rockfall hazard zoning based on the kinetic energy, frequency and org/?page=AdditionalPubs (last access: 17 July 2020), 2017. fragmentation degree, Nat. Hazards Earth Syst. Sci., 5, 621–632, Dussauge-Peisser, C., Helmstetter, A., Grasso, J.-R., Hantz, D., https://doi.org/10.5194/nhess-5-621-2005, 2005. Desvarreux, P., Jeannin, M., and Giraud, A.: Probabilistic ap- Jiang, Y., Tanabashi, Y., Li, B., and Xiao, J.: Influence of Geomet- proach to rock fall hazard assessment: potential of histori- rical Distribution of Rock Joints on Deformational Behavior of cal data analysis, Nat. Hazards Earth Syst. Sci., 2, 15–26, Underground Opening, Tunn. Undergr. Sp. Tech., 21, 485–491, https://doi.org/10.5194/nhess-2-15-2002, 2002. https://doi.org/10.1016/j.tust.2005.10.004, 2006. Eberhardt, E., Stead, D., and Coggan, J. S.: Numerical Analysis Kemeny, J.: Time-Dependent Drift Degradation Due to of Initiation and Progressive Failure in Natural Rock Slopes – the Progressive Failure of Rock Bridges along Dis- the 1991 Randa Rockslide, Int. J. Rock Mech. Min., 41, 69–87, continuities, Int. J. Rock Mech. Min., 42, 35–46, https://doi.org/10.1016/S1365-1609(03)00076-5, 2004. https://doi.org/10.1016/j.ijrmms.2004.07.001, 2005. Effendiantz, L., Guillemin, P., Rochet, L., Pauly, C., and Payany, Kromer, R. A., Rowe, E., Hutchinson, J., Lato, M., and Abellán, M.: Les études spécifiques d’aléa lié aux éboulements rocheux, A.: Rockfall Risk Management Using a Pre-Failure Deformation 1 vols. Guide technique – Laboratoire central des ponts et Database, Landslides, 15, 847–858, 2018. chaussées, ISSN 1151-1516, Laboratoire central des ponts et Levy, C.: Etude instrumentale et numérique de la réponse dy- chaussées, Paris, 2004. namique d’une écaille calcaire potentiellement instable, Sciences Elmo, D., Donati, D., and Stead, D.: Challenges in the Characteri- de la Terre, Université de Grenoble, Français, 2011. sation of Intact Rock Bridges in Rock Slopes, Eng. Geol., 245, Levy, C., Rohmer, J., Colas, B., and Rey, A.: Sensitivity Analysis 81–96, https://doi.org/10.1016/j.enggeo.2018.06.014, 2018. of Rockfall Trajectory Simulations to Material Properties, in: 4th Fischer, L., Amann, F., Moore, J. R., and Huggel, C.: Assess- RSS Rock Slope Stability Symposium, Chambéry, 2018. ment of Periglacial Slope Stability for the 1988 Tschierva Rock Matasci, B., Jaboyedoff, M., Ravanel, L., and Deline, P.: Sta- Avalanche (Piz Morteratsch, Switzerland), Eng. Geol., 116, 32– bility Assessment, Potential Collapses and Future Evolution 43, https://doi.org/10.1016/j.enggeo.2010.07.005, 2010. of the West Face of the Drus (3754 m a.s.l., Mont Blanc Frayssines, M.: Contribution à l’évaluation de l’aléa Éboulement Massif), in: Engineering Geology for Society and Territory, Rocheux (Rupture), Ph.D. thesis, Université de Joseph Fourier – vol. 2, 791–795, Springer International Publishing, Cham, Grenoble I, Français, 2005. https://doi.org/10.1007/978-3-319-09057-3_134, 2015. Frayssines, M. and Hantz, D.: Failure Mechanisms and Triggering Mazzoccola, D. F and Hudson, J. A.: A Comprehensive Method of Factors in Calcareous Cliffs of the Subalpine Ranges (French Rock Mass Characterization for Indicating Natural Slope Insta- Alps), Eng. Geol., 86, 256–70, 2006. bility, Q. J. Eng. Geol. Hydroge., 29, 37–56, 1996. Frayssines, M. and Hantz, D.: Modelling and Back-Analysing Fail- Mineo, S., Pappalardo, G., Mangiameli, M., Campolo, S., and Mus- ures in Steep Limestone Cliffs, Int. J. Rock Mech. Min., 46, sumeci, G.: Rockfall Analysis for Preliminary Hazard Assess- 1115–1123, 2009. ment of the Cliff of Taormina Saracen Castle (Sicily), Sustain- Gischig, V., Amann, F., Moore, J. R., Loew, S., Eisenbeiss, H., ability, 10, 417, https://doi.org/10.3390/su10020417, 2018. and Stempfhuber, W.: Composite Rock Slope Kinematics at Pappalardo, G. and Mineo, S.: Rockfall Hazard and Risk As- the Current Randa Instability, Switzerland, Based on Remote sessment: The Promontory of the Pre-Hellenic Village Castel- Sensing and Numerical Modeling, Eng. Geol., 118, 37–53, mola Case, North-Eastern Sicily (Italy), in: Engineering Geol- https://doi.org/10.1016/j.enggeo.2010.11.006, 2011. ogy for Society and Territory, edited by: Lollino, G., Manconi, Gu, R. and Ozbay, U.: Distinct Element Analysis of Unsta- A., Clague, J., et al., Springer International Publishing, Cham, ble Shear Failure of Rock Discontinuities in Underground Switzerland, Vol. 2, 1989–1993, https://doi.org/10.1007/978-3- Mining Conditions, Int. J. Rock Mech. Min., 68, 44–54, 319-09057-3_353, 2015. https://doi.org/10.1016/j.ijrmms.2014.02.012, 2014. Paronuzzi, P., Bolla, A., and Rigo, E.: 3D Stress–Strain Anal- Guerin, A., Jaboyedoff, M., Collins, B. D., Derron, M. H., ysis of a Failed Limestone Wedge Influenced by an In- Stock, G. M., Matasci, B., Boesiger, M., Lefeuvre, C., and tact Rock Bridge, Rock Mech. Rock Eng., 49, 3223–3242, Podladchikov, Y. Y.: Detection of Rock Bridges by In- https://doi.org/10.1007/s00603-016-0963-7, 2016. frared Thermal Imaging and Modeling, Sci. Rep., 9, 1–19, Paronuzzi, P. and Serafini, W.: Stress State Analysis of a Collapsed https://doi.org/10.1038/s41598-019-49336-1, 2019. Overhanging Rock Slab: A Case Study, Eng. Geol., 1–2, 65–75, Guzzetti, F., Malamud, B. D., Turcotte, D. L., and Reichen- https://doi.org/10.1016/j.enggeo.2009.06.019, 2009. bach, P.: Power-Law Correlations of Landslide Areas in Cen- Roslan, R., Omar, R. C., Putri, R. F., Wahab, W. A., Baharuddin, I. tral Italy, Earth and Planetary Science Letters, 195, 169–183, N. Z., and Jaafar, R.: Slope Stability Analysis Using Universal https://doi.org/10.1016/S0012-821X(01)00589-1, 2002. Distinct Element Code (UDEC) Method, IOP C. Ser. Earth Env., Harthong, B., Scholtès, L., and Donzé, F. V.: Strength Character- 451, 012081, https://doi.org/10.1088/1755-1315/451/1/012081, ization of Rock Masses, Using a Coupled DEM–DFN Model, 2020. Geophys. J. Int., 191, 467–480, https://doi.org/10.1111/j.1365- Scavia, C.: A Method for the Study of Crack Propaga- 246X.2012.05642.x, 2012. tion in Rock Structures, Géotechnique, 45, 447–463, He, S., Li, Y., and Aydin, A.: A Comparative Study of UDEC Sim- https://doi.org/10.1680/geot.1995.45.3.447, 1995. ulations of an Unsupported Rock Tunnel, Tunn. Undergr. Sp. https://doi.org/10.5194/nhess-21-1263-2021 Nat. Hazards Earth Syst. Sci., 21, 1263–1278, 2021
1278                                                 A. Delonca et al.: Cascade effect of rock bridge failure in planar rock slides

Spreafico, M. C., Franci, F., Bitelli, G., Borgatti, L., and Ghirotti,   Sturzenegger, M. and Stead, D.: Close-Range Terrestrial Digital
   M.: Intact Rock Bridge Breakage and Rock Mass Fragmenta-                 Photogrammetry and Terrestrial Laser Scanning for Discontinu-
   tion upon Failure: Quantification Using Remote Sensing Tech-             ity Characterization on Rock Cuts, Eng. Geol., 106, 163–182,
   niques – Spreafico – 2017 – The Photogrammetric Record – Wi-             2009.
   ley Online Library, The Photogrammetric Record, 32, 513–536,          Tuckey, Z. and Stead, D.: Improvements to Field and Remote
   https://doi.org/10.1111/phor.12225, 2017.                                Sensing Methods for Mapping Discontinuity Persistence and In-
Stead, D., Eberhardt, E., and Coggan, J. S.: Developments in the            tact Rock Bridges in Rock Slopes, Eng. Geol., 208, 136–153,
   Characterization of Complex Rock Slope Deformation and Fail-             https://doi.org/10.1016/j.enggeo.2016.05.001, 2016.
   ure Using Numerical Modelling Techniques, Eng. Geol., 83,             Varnes, D. J.: Landslide Hazard Zonation: A Review of Principles
   217–235, 2006.                                                           and Practice, Unesco, United Nations, available at: https://trid.
Stock, G. M., Martel, S. J., Collins, B. D., and Harp, E. L.: Progres-      trb.org/view.aspx?id=281932 (last access: 17 July 2020), 1984.
   sive Failure of Sheeted Rock Slopes: The 2009–2010 Rhombus            Zhou, G. G. D., Cui, P., Zhu, X., Tang, J., Chen, H., and Sun,
   Wall Rock Falls in Yosemite Valley, California, USA, Earth Surf.         Q.: A Preliminary Study of the Failure Mechanisms of Cas-
   Proc. Land., 37, 546–561, https://doi.org/10.1002/esp.3192,              cading Landslide Dams, Int. J. Sediment. Res., 30, 223–234,
   2012.                                                                    https://doi.org/10.1016/j.ijsrc.2014.09.003, 2015.
Stock, G. M., Bawden, G. W., Green, J. K., Hanson, E., Down-
   ing, G., Collins, B. D., Bond, S., and Leslar, M.: High-
   Resolution Three-Dimensional Imaging and Analysis of Rock
   Falls in Yosemite Valley, California, Geosphere, 7, 573581,
   https://doi.org/10.1130/GES00617.1, 2011.

Nat. Hazards Earth Syst. Sci., 21, 1263–1278, 2021                                       https://doi.org/10.5194/nhess-21-1263-2021
You can also read