Cytocompatible cellulose nanofibers from invasive plant species Agave americana L. and Ricinus communis L.: a renewable green source of highly ...
←
→
Page content transcription
If your browser does not render page correctly, please read the page content below
Journal of Zhejiang University-SCIENCE B (Biomedicine & Biotechnology) 2021 22(6):450-461
            www.jzus.zju.edu.cn; www.springer.com/journal/11585
            E-mail: jzus_b@zju.edu.cn

Research Article
https://doi.org/10.1631/jzus.B2000683

Cytocompatible cellulose nanofibers from invasive plant species
Agave americana L. and Ricinus communis L.: a renewable green
source of highly crystalline nanocellulose
Olga L. EVDOKIMOVA1, Carla S. ALVES1, Radenka M. KRSMANOVIĆ WHIFFEN1,2, Zaida ORTEGA3*,
Helena TOMÁS1, João RODRIGUES1,4*
1
  CQM‒Centro de Química da Madeira, MMRG, Universidade da Madeira, Campus Universitário da Penteada, 9020-105 Funchal, Portugal
2
  Faculty of Polytechnics, University of Donja Gorica, Oktoih 1, 81000 Podgorica, Montenegro
3
 Departamento de Ingeniería de Procesos, Universidad de Las Palmas de Gran Canaria, 35017 Las Palmas de Gran Canaria, Las Palmas, Spain
4
  School of Materials Science and Engineering/Center for Nano Energy Materials, Northwestern Polytechnical University, Xi’an 710072, China

Abstract: In this study, the fibers of invasive species Agave americana L. and Ricinus communis L. were successfully used for
the first time as new sources to produce cytocompatible and highly crystalline cellulose nanofibers. Cellulose nanofibers were
obtained by two methods, based on either alkaline or acid hydrolysis. The morphology, chemical composition, and crystallinity
of the obtained materials were characterized by scanning electron microscopy (SEM) together with energy-dispersive X-ray
spectroscopy (EDX), dynamic light scattering (DLS), X-ray diffraction (XRD), and Fourier transform infrared (FTIR)
spectroscopy. The crystallinity indexes (CIs) of the cellulose nanofibers extracted from A. americana and R. communis were
very high (94.1% and 92.7%, respectively). Biological studies evaluating the cytotoxic effects of the prepared cellulose
nanofibers on human embryonic kidney 293T (HEK293T) cells were also performed. The nanofibers obtained using the two
different extraction methods were all shown to be cytocompatible in the concentration range assayed (i.e., 0‒500 µg/mL). Our
results showed that the nanocellulose extracted from A. americana and R. communis fibers has high potential as a new
renewable green source of highly crystalline cellulose-based cytocompatible nanomaterials for biomedical applications.

Key words: Nanofiber; Nanocellulose; Agave americana L.; Ricinus communis L.; Crystallinity; Invasive species; Biomedical
application

1 Introduction                                                               Invasive plant species can be exploited as a cheap
                                                                       and widely available renewable source of cellulosic
     The increasing number of invasive species                         fibers (Satyanarayana et al., 2013; Sun et al., 2020).
worldwide is considered a global environmental and                     At present, the exploitation of various non-traditional
economic problem and a major threat to biodiversity                    sources of cellulose (such as annual plants, vegetables,
(Charles and Dukes, 2007). These invasive species                      weeds, residues from crops such as wheat/vine stems,
are damaging the native fauna and flora of ecosys‐                     corn grain/cobs, sugarcane bagasse, and marine resi‐
tems, leading to severe threats to local biodiversity,                 dues) is gaining more importance as a way to reduce
agricultural and forest production, and ultimately to                  the high consumption of natural fibers and to find
human health (Mooney and Hobbs, 2000; Crowl et al.,                    new strategies for their potential application and valo‐
2008).                                                                 rization (Aguir and M'Henni, 2006; Fiserova et al.,
                                                                       2006; Abrantes et al., 2007; Khiari et al., 2011; Ridzuan
* Zaida ORTEGA, zaida.ortega@ulpgc.es                                  et al., 2016). For instance, Abrantes et al. (2007) used
    João RODRIGUES, joaor@uma.pt; joaoc@staff.uma.pt
                                                                       annually harvested non-wood fibers from Cynara car‐
    Zaida ORTEGA, https://orcid.org/0000-0002-7112-1067
    João RODRIGUES, https://orcid.org/0000-0003-4552-1953              dunculus L. (cardoon) for paper and paperboard pro‐
Received Oct. 24, 2020; Revision accepted Jan. 8, 2021;                duction. Maheswari et al. (2012) extracted cellulose
Crosschecked Apr. 12, 2021                                             microfibrils from the agricultural residue of coconut
© Zhejiang University Press 2021                                       palm leaf sheaths. Another research group (Fiore et al.,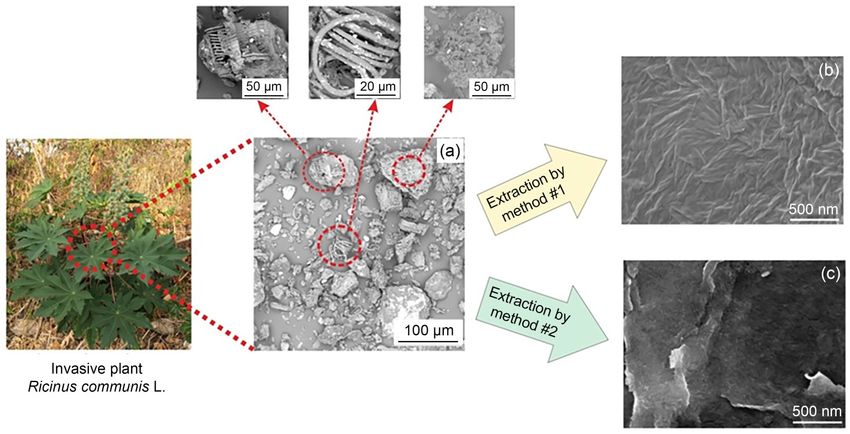
J Zhejiang Univ-Sci B (Biomed & Biotechnol) 2021 22(6):450-461 | 451

2014) studied the possibility of using an invasive plant,      waste cotton cloth, and old corrugated cardboard, and
Arundo donax L., as a source of reinforcement fibers           demonstrated its potential in commercial applications
in polymer composites. Our team recently explored the          for sustainable development.
use of pure Agave americana L. fibers for reinforcement             For the islands of the Macaronesia archipelagos
in polymer composites (Ortega et al., 2019).                   (Azores (Portugal), Madeira (Portugal), Canary Islands
       Within the past decade, nanoscale cellulose has         (Spain), and Cape Verde) and other regions of the
demonstrated great potential in the biomedical field,          world, the revalorization of invasive plants such as A.
namely, in drug delivery, tissue engineering, cartilage        americana, A. donax (giant reed), Pennisetum setace‐
replacements, medical implants, skin wound dressings,          um, and Ricinus communis for the production of bio‐
bioimaging, and biosensing (Lin and Dufresne, 2014;            materials and composites would constitute an environ‐
Guise and Fangueiro, 2016; Kargarzadeh et al., 2017;           mental benefit and an attractive economic income that
Mishra et al., 2018; Xu et al., 2018). Nanocellulose has       would support eradication campaigns. The plants
been exploited as a biomaterial for three-dimensional          mentioned above are currently utilized only as a source
(3D) printing to design drug delivery devices with the         of cellulose fibers for the textile and automobile in‐
desired drug release profile for personalized therapy          dustries (Ridzuan et al., 2016; Motaung et al., 2017;
(Yu et al., 2009; Sandler and Preis, 2016). Lately,            Trifol et al., 2017; Vinayaka et al., 2017). To the best
nanocellulose has been increasingly utilized as 3D             of our knowledge, no attempts have been made to use
scaffolds in liver tissue engineering, adipose tissue en‐      the fibers of these invasive plant species as an inex‐
gineering, and vascular tissue engineering (Bacakova           pensive nanocellulose source for biomedical applica‐
et al., 2019). Rees et al. (2015) explored the application     tions. In the present study, we chose the fast-growing,
of nanocellulose as a bioink for possible use as a             widely distributed, and highly abundant plants A.
wound-dressing material. Åhlén et al. (2018) developed         americana and R. communis to produce cytocompatible
contact lenses based on cellulose-nanocrystal-reinforced       nanoscaled cellulose. The exploration and revalorization
polyvinyl alcohol that could be used for controlled            of these plants are particularly crucial for the Macaro‐
ocular drug delivery. Bacterial nanocellulose has been         nesia archipelagos island, where they present a severe
applied as a new patch for the repair of congenital            environmental problem since they occupy abandoned
heart defects (Lang et al., 2015). Another interesting         agricultural land and all areas not cared for or that
use of nanocellulose was reported by Wang et al.               have been victims of the fire. Therefore, the primary
(2016). They obtained biocomposites of nanofibrillated         objective of the study was to explore the potential of
cellulose for dressing materials in an emerging concept        the selected invasive plants as an inexpensive and
of Cu-containing wound healing dressings.                      abundantly available renewable source of natural,
       Numerous studies have demonstrated the possi‐           highly crystalline cellulose nanofibers.
bility of obtaining cellulose nanofibers, nanocrystals,
or nanofibrils from non-conventional cellulose resources
(Oun and Rhim, 2016; Bajpai, 2017; Chen and Lee,               2 Materials and methods
2018; Pereira and Arantes, 2018). Reddy and Rhim
                                                               2.1 Materials
(2014) demonstrated that paper-mulberry (Broussonetia
kazinoki Siebold) bast pulp could be used as a new,                 Two samples of invasive plants, A. americana
environmentally friendly nanocellulose source. Bettaieb        and R. communis, were collected from the Macaronesia
et al. (2015a, 2015b) reported on the preparation of a         archipelago, specifically on Gran Canaria island (Canary
new source of nanocellulose crystals extracted from            Islands archipelago, Spain); plants were collected from
Posidonia oceanica leaves and balls. Nanocellulose             abandoned farmland (global positioning system (GPS)
fibers with a high crystallinity index (CI) of about           coordinates: 28.079 766, −15.455 594) now transformed
70% and improved thermal stability were produced               into the urban ground, and oven-dried for 24 h at
from pinecones (Jack pine: Pinus banksiana Lamb.)              105 °C before further use.
using chemical and mechanical treatments (Rambabu                   All reagents were purchased from Sigma Aldrich
et al., 2016). Chen and Lee (2018) recently isolated           (Madrid, Spain or Lisbon, Portugal) and were used
nanocellulose from Panax ginseng, spent tea residue,           without further purification.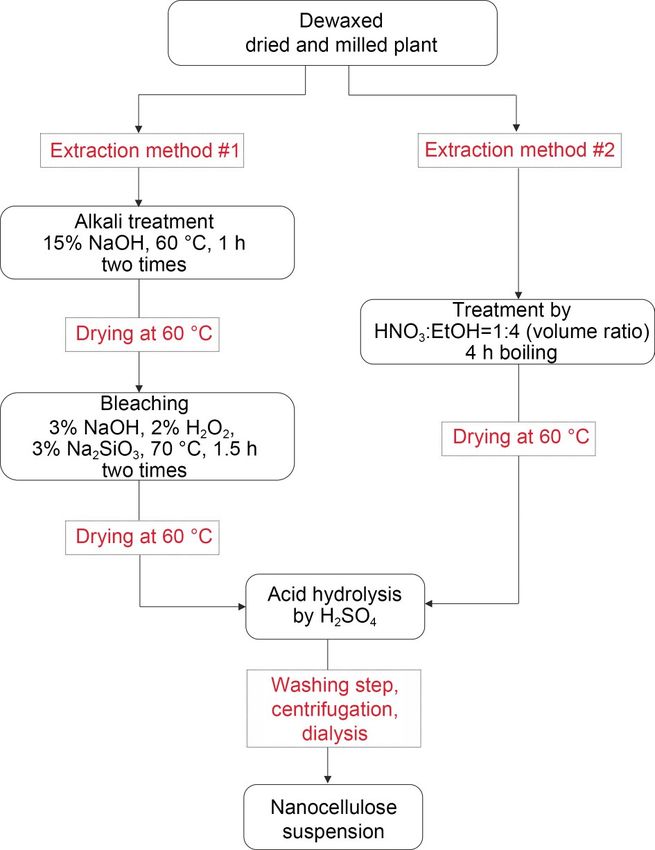
452 | J Zhejiang Univ-Sci B (Biomed & Biotechnol) 2021 22(6):450-461

2.2 Cellulose extraction procedure                                     dried at room temperature until a constant weight was
                                                                       achieved. The alkali-treated fibers were bleached with
     Cellulose nanofibers were extracted from two
                                                                       a mixture of 3% NaOH, 2% H2O2, and 3% Na2SiO3
different raw material sources, A. americana and
                                                                       (all at mass fraction) solution at 70 °C for 1.5 h under
R. communis. Before extraction, the raw, dried, and
                                                                       mechanical stirring using a fiber to liquid ratio of 1:60.
milled plants were processed by refluxing with toluene-
                                                                       This treatment was repeated twice. After bleaching,
ethanol (2:1, volume ratio) for 8 h in a Soxhlet appa‐
                                                                       the fibers were thoroughly washed with distilled wa‐
ratus to remove pigments, waxes, and lipids. The raw
                                                                       ter until a neutral pH was obtained and then dried
materials were then thoroughly washed on a Büchner
                                                                       overnight until a constant weight was achieved. The
funnel with ethanol, acetone, and distilled water, and
                                                                       prepared A. americana and R. communis fibers were
dried at room temperature until a constant weight was
                                                                       mixed with a 60% (mass fraction, the same below)
achieved. Subsequently, two different methods were
                                                                       H2SO4 solution and stirred vigorously at 45 °C for 2.5
used for cellulose extraction, as presented in Fig. 1
                                                                       and 4.5 h, respectively. After that, hydrolysis was im‐
and detailed below.
                                                                       mediately quenched by adding 500 mL of cold dis‐
                                                                       tilled water to the reaction mixture. The resulting
                                                                       nanocellulose suspension was centrifuged several times
                                                                       (10 000 r/min, 10 min) to separate the nanocellulose
                                                                       from the sulphuric acid solution. The final suspension
                                                                       was continuously dialyzed (dialysis membrane 1000 Da)
                                                                       against distilled water to remove the sulfate ions until
                                                                       a constant, neutral pH was reached. Finally, the
                                                                       obtained nanocellulose suspension was freeze-dried
                                                                       and stored at 8 °C for further characterization.
                                                                       2.2.2 Extraction method #2, based on acid hydrolysis

                                                                             The dewaxed dried samples were pretreated using
                                                                       the Kurschner-Hoffer method (Béakou et al., 2008).
                                                                       The resulting sample was refluxed with a mixture of
                                                                       nitric acid and ethyl alcohol (1:4, volume ratio) for 4 h
                                                                       in total. The residue was filtered off and then refluxed
                                                                       again with the alcohol/nitric acid solution. This proce‐
                                                                       dure was repeated three times. Finally, the residue
                                                                       was filtered off and washed with hot distilled water
                                                                       until a neutral pH was achieved. This was followed
                                                                       by drying in an oven at 60 °C until a constant weight
                                                                       was obtained. Then, the prepared A. americana fibers
                                                                       were mixed with a 40% H2SO4 solution and stirred
Fig. 1 Cellulose nanofiber extraction methods. The                     vigorously at 60 °C for 2 h. R. communis fibers were
concentrations of 15% NaOH, 3% NaOH, 2% H2O2, and
3% Na2SiO3 are all at mass fractions.
                                                                       mixed with a 60% H2SO4 solution and stirred vigor‐
                                                                       ously at 45 °C for 2.5 h. The ratio of fibers to the acid
                                                                       solution was 1:40. After that, hydrolysis was immediately
2.2.1 Extraction method #1, based on an alkali
                                                                       quenched by adding 500 mL of cold distilled water to
treatment
                                                                       the reaction mixture. Non-reactive sulfate groups were
      The dewaxed dried samples were treated with                      removed from the resulting suspension by centrifugation,
15% (mass fraction) of NaOH solution at 60 °C for 1 h                  separating the nanocellulose from the solution after
under mechanical stirring, using a fiber to liquid ratio               each washing step. The final suspension was continu‐
of 1: 15. After filtration and extensive washing with                  ously dialyzed (dialysis membrane 1000 Da) against
distilled water on a Büchner funnel, the residue was                   distilled water until a constant neutral pH was reached.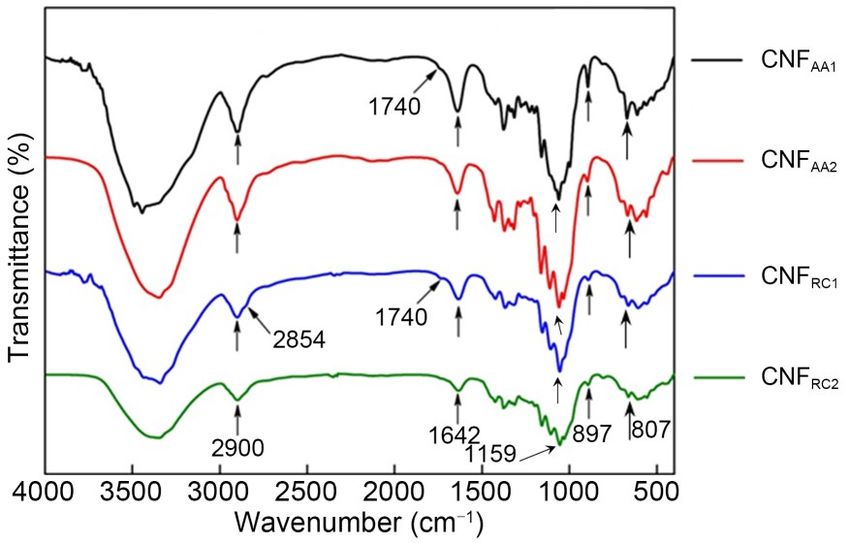
J Zhejiang Univ-Sci B (Biomed & Biotechnol) 2021 22(6):450-461 | 453

Finally, the obtained nanocellulose suspension was             UK). Samples were observed in their natural state,
freeze-dried and stored at 8 °C for further characteriza‐      i. e., without any coating, using a Phenom Charge
tion. The details of the extraction conditions for each        Reduction Sample Holder (ThermoFisher Scientific).
prepared sample are provided in Table 1.                              The hydrodynamic diameter distribution and zeta
                                                               potential of the obtained cellulose nanofibers were
2.3 Characterization
                                                               determined by dynamic light scattering (DLS) and
2.3.1 Chemical composition of raw materials                    electrophoretic light scattering (ELS), respectively,
                                                               using a Zetasizer Nano ZS (Malvern Instruments Ltd.,
      The chemical composition of the raw materials            Malvern, UK) at 25 °C before the freeze-drying process.
was measured as follows: the lignin content was deter‐         Three measurements were taken for each case; the
mined according to the Klason method based on an               mean value and standard deviation are reported.
initial 72% H2SO4 hydrolysis step, followed by dilution
with water to 3% H2SO4 and reflux boiling in the               2.3.3 X-ray diffraction and crystallinity studies
secondary hydrolysis step (Theander and Westerlund,                  X-ray diffraction (XRD) studies of the raw mate‐
1986). The acid-insoluble residue (AIR) was calculated         rials and the freeze-dried cellulose nanofibers were
by the difference between the mass of the acid                 carried out using a Bruker X8 advanced diffractometer
detergent-insoluble residue and the residual mass after        (Bruker, Leipzig, Germany). Samples were scanned
the treatment. The presence of acid-soluble lignin             in the range of 5°–52° for 2θ with increments of 0.02°
(ASL) in the first filtrate was determined by ultraviolet-     using CuKα radiation (λ =1.54 Å=0.154 nm). The CI
visible (UV-Vis) spectroscopy. Total cellulose content of      of the samples was calculated by the Segal method
the invasive species was investigated with the Kürschner-      (Gümüskaya et al., 2003): CI= (I200 − Iam)/I200×100%,
Hoffer method, which is based on the treatment of fibers       where I200 gives the maximum intensity of the peak
with a mixture of nitric acid and ethanol (1:4, volume         corresponding to the plane in the sample with Miller
ratio) for a total duration of 4 h (Béakou et al., 2008).      index of 200, and Iam represents the intensity of dif‐
The hemicellulose content (Ch, %) was estimated the‐           fraction of the non-crystalline material taken at an
oretically as: Ch=100−Cc−Cl, where Cc is cellulose con‐        angle of 2θ=18° in the valley between the peaks.
tent (% ) and Cl is lignin content (% ). An average of               The crystallite size (L) perpendicular to the plane
three replicates was calculated for each sample.               was obtained by the Scherrer equation (Poletto et al.,
                                                               2014): L=0.94λ/βcosθ, where λ is the X-ray wavelength
2.3.2 Morphology analysis
                                                               (0.1542 nm), β is the full width at half-maximum in
      The morphology of the obtained freeze-dried              radians, and θ is the Bragg angle in radians.
nanocellulose samples was characterized with a scan‐
                                                               2.3.4 Fourier transform infrared spectroscopy
ning electron microscope at an accelerating voltage of
15 kV (Analytical JEOL 7001F FEG-SEM, JEOL,                         The Fourier transform infrared (FTIR) spectra of
Tokyo, Japan). All samples were sputter-coated with a          the freeze-dried cellulose nanofibers were analyzed
thin layer of Au before observation. Additional scan‐          using a Spectrum TwoTM spectrophotometer (Perkin-
ning electron microscopy (SEM) images and the energy-          Elmer, Massachusetts, USA). The spectra were obtained
dispersive X-ray spectroscopy (EDX) analysis of                from KBr pellets containing the samples (measured
the raw materials were obtained on a desktop SEM               between a wavenumber range of 4000 to 400 cm−1) at
Phenom-ProX (ThermoFisher Scientific, London,                  a scan rate of 32 scans/min in the transmittance mode.

                                  Table 1 Extraction conditions of nanocellulose samples
                                                               H2SO4
Sample name           Source      Extraction method                                  Temperature (°C)      Hydrolysis time (h)
                                                          (%, mass fraction)
   CNFAA1      Agave americana        Method #1                  60                          45                    2.5
   CNFAA2      A. americana           Method #2                  40                          60                    2.0
   CNFRC1      Ricinus communis       Method #1                  60                          45                    4.5
   CNFRC2      R. communis            Method #2                  60                          45                    2.5
CNF: cellulose nanofiber.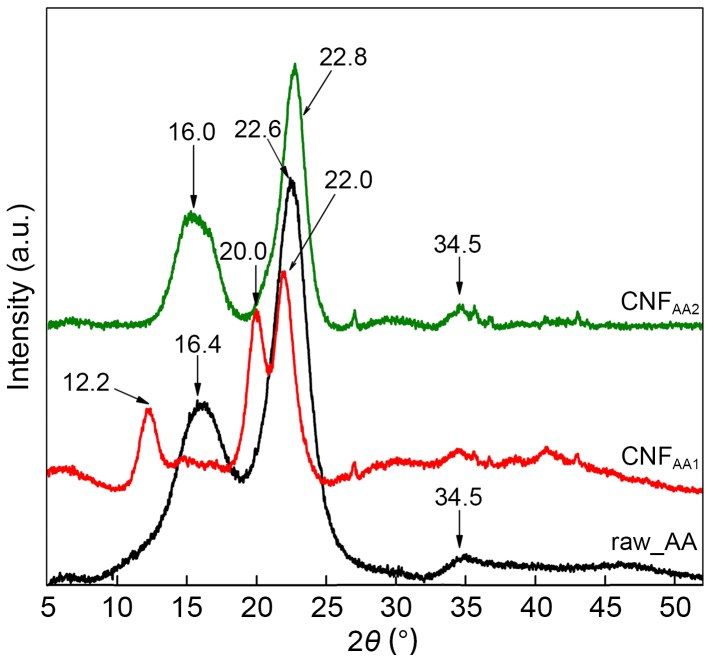
454 | J Zhejiang Univ-Sci B (Biomed & Biotechnol) 2021 22(6):450-461
2.3.5 Cell viability assay Massachusetts, USA); the reference wavelength was
set at 630 nm, and the absorbance at 490 nm was
The cytotoxic effects of the CNFAA1, CNFAA2,
recorded. Three separate cell viability assays were
CNFRC1, and CNFRC2 samples on human embryonic
conducted, where in each case, three replicates were
kidney 293T (HEK293T) cells were evaluated by thia‐
analyzed for each sample under investigation.
zolyl blue tetrazolium bromide (MTT) colorimetric
assay, establishing a correlation between cell metabolic
activity and the number of viable cells in culture. Cell
3 Results and discussion
viability, which was studied as a function of the nano‐
fiber type and its concentration, was assessed after 3.1 Chemical composition of raw materials
exposing cells to various samples for 48 h. MTT was
purchased from Sigma-Aldrich (Lisbon, Portugal), Chemical composition analysis showed that raw
and where applicable, was used without further purifi‐ dried A. americana is composed of (33.2±1.8)% cellulose,
cation. Collagen (collagen I rat tail protein), Dulbecco’s (9.0±0.8)% lignin, and (12.1±0.6)% hemicellulose
modified Eagle’s medium (DMEM)-high glucose, (all at mass fraction). Raw dried R. communis is
fetal bovine serum (FBS), and antibiotic-antimycotic composed of (34.4±1.8)% cellulose, (18.1±2.2)% lignin,
(AbAm) were purchased from Gibco® (ThermoFisher and (32.9±4.3)% hemicellulose. The obtained results
Scientific), while analytical-grade dimethyl sulfoxide are comparable to data reported for other common
(DMSO) was purchased from ThermoFisher Scientific. lignocellulosic materials (Phanthong et al., 2018).
Prior to cell cultivation, a 96-well plate was pre- Nevertheless, it is important to mention that the chemical
treated with collagen (type I, 0.2 mg/mL in 0.25% composition of the plants significantly depends on
(volume fraction) acetic acid). Thereafter, HEK293T many different factors like geographic location,
cells (ATCC® CRL-3216TM) were seeded in a 96-well climate, harvesting, and the age of the plant, as well
plate at a density of 5×10³ cells/well using 200 μL as the extraction process and experimental conditions.
DMEM supplemented with 10% FBS and 1% AbAm 3.2 Morphology characterization of the obtained
solution. The cells were cultured for 24 h at 37 °C in samples
a humidified 5% CO2 atmosphere. At this stage, the
cell culture medium in each well was replaced with The surface morphologies of the dried milled
180 μL of fresh serum-containing DMEM, and the plants of A. americana and R. communis were investi‐
cells were subsequently exposed to 20 μL of each gated by SEM in conjunction with EDX analysis
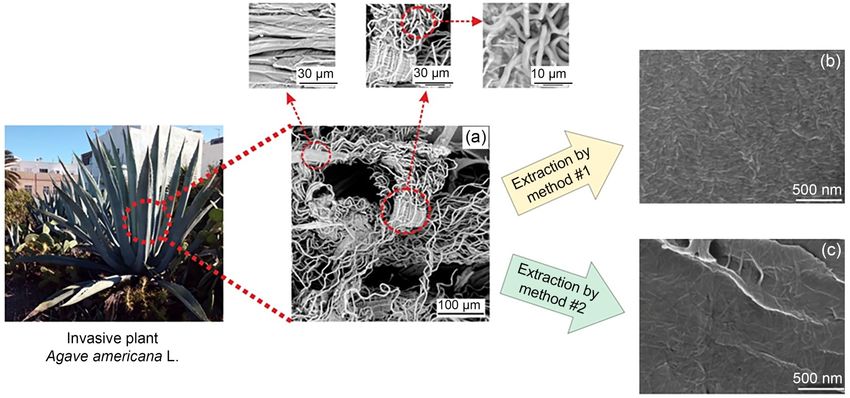
cellulose nanofiber. Here, a 5 mg/mL stock solution (Figs. 2 and 3). As can be seen from Fig. 2a, SEM
of the nanofiber was first prepared by suspending it images of raw A. americana (raw_AA) showed two
in a 5% DMSO solution and then diluting it using different morphologies. One part of the samples had a
filter-sterilized ultrapure water to different concentra‐ layered structure, while the other part formed a network
tions. Final concentrations of 0, 50, 100, 200, 250, of microfibrils tightly packed together and covered
300, 400, and 500 μg/mL were tested for each cellu‐ with some outer membranes. Closer examination of
lose nanofiber under investigation. the raw_AA microfibrils revealed the diameter of the
After 48 h of incubation at 37 °C in a humidified original fibril to be around 3 μm, with the ribbon-
5% CO2 atmosphere, the cell culture medium in each shaped fibrils having a spiral appearance.
well was removed and replaced with a solution made EDX analysis studies also revealed a homogeneous
up of 180 μL serum-containing DMEM and 20 μL elemental composition throughout the whole fiber
MTT (5 mg/mL). The cells were further incubated for region, with several minerals commonly found in soil
4 h at 37 °C in a humidified 5% CO2 atmosphere. The being identified (e.g., potassium and calcium; Fig. S1).
resultant medium in each well was then removed, and The sample was very beam-sensitive, and the fibers
100 μL DMSO was added to each well. This was were ultimately melted down and destroyed by the
followed by gentle shaking of the plate to help EDX electron beam.
dissolve the purple MTT formazan crystals. Finally, Fig. 3a illustrates the morphology of the raw R.
the absorbance of each well was measured using a communis samples (raw_RC). It is evident that the
microplate reader (model Victor3 1420, PerkinElmer, structure consists of spiral-shaped microfibrils covered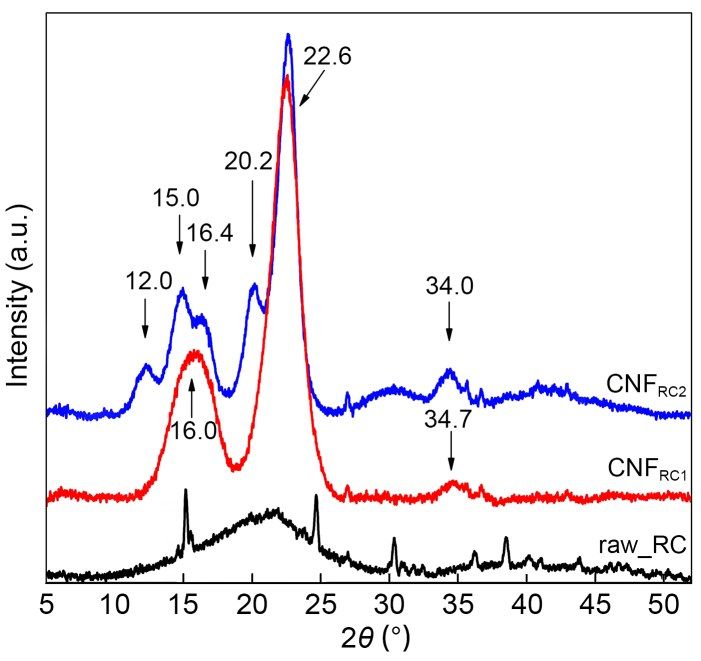
J Zhejiang Univ-Sci B (Biomed & Biotechnol) 2021 22(6):450-461 | 455

with some non-cellulosic constituents (hemicellulose             On the other hand, the CNFAA2 and CNFRC2
and lignin) (Sair et al., 2017).                            samples extracted by method #2 (based on sequential
      Nanocellulose isolation was performed using the       acid hydrolysis) showed a network with a structured
two different processes described above. Figs. 2b and       fibrous morphology (Figs. 2c and 3c). One of the
2c and Figs. 3b and 3c show the SEM micrographs of          main advantages of method #2 lies in the simplicity
the freeze-dried cellulose nanofibers extracted from A.     of the process since the application of the Kürschner-
americana and R. communis fibers, respectively. The         Hoffer method entails a rapid pre-treatment step
results indicated that both extraction methods contrib‐     for sample purification to remove the non-cellulosic
uted to structural changes in the cellulose nanofibers      components. The size distribution of the prepared
compared with the raw fibers. All synthesized samples       samples measured by DLS is shown in Fig. S2.
exhibited a uniform and smooth morphology. We found         The cellulose nanofibers of the CNFAA1 and CNFAA2
that samples CNFAA1 and CNFRC1 extracted by method #1       samples had an average diameter of 58 and 141 nm,
had needle-shaped structures (Figs. 2b and 3b).             respectively, while the diameters of CNFRC1 and CNFRC2

Fig. 2 Scanning electron microscopy (SEM) images of the raw Agave americana (raw_AA) (a) and cellulose nanofibers
extracted from A. americana by extraction method #1 (CNFAA1) (b) and extraction method #2 (CNFAA2) (c).

Fig. 3 Scanning electron microscopy (SEM) images of the raw Ricinus communis (raw_RC) (a) and cellulose nanofibers
extracted from R. communis by extraction method #1 (CNFRC1) (b) and extraction method #2 (CNFRC2) (c).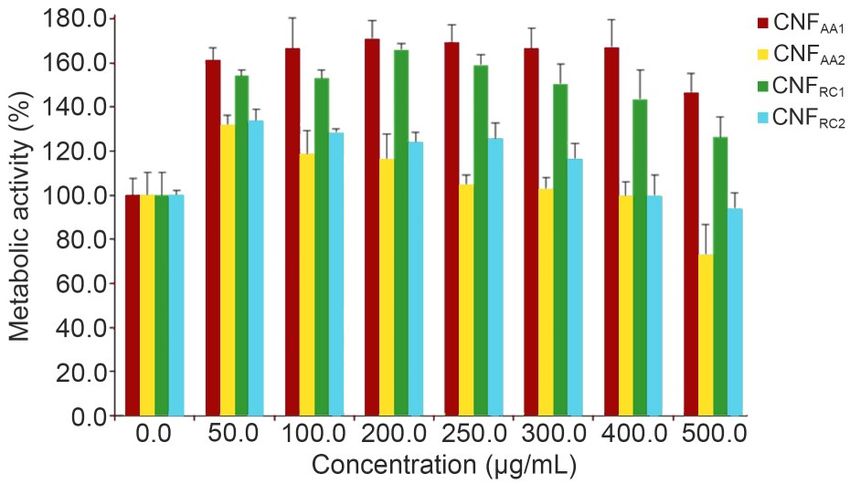
456 | J Zhejiang Univ-Sci B (Biomed & Biotechnol) 2021 22(6):450-461

were about 68 and 120 nm, respectively. As expected,
the obtained average hydrodynamic size for all samples
incorporated water in the primary hydration layers.
3.3 XRD characterization

      The XRD results of the raw fibers and the
extracted cellulose nanofibers are presented in Figs. 4
and 5 and Table 2.
      It should be noted that the structure and CI of the
obtained samples depended on both the raw source of
cellulose and the chemical extraction method applied.
The raw A. americana fibers (i. e., raw_AA) and the
cellulose nanofibers isolated from them had a                          Fig. 4 X-ray diffraction (XRD) patterns of the cellulose
crystalline nature (Fig. 4). The raw_AA sample, in                     nanofibers obtained from Agave americana: raw A.
particular, displayed typical cellulose I structure with               americana (raw_AA), CNFAA1, and CNFAA2.
characteristic diffraction peaks at 2θ =16.4° , 22.6° ,
and 34.5°, indexed as (110), (200), and (004) planes,                  cellulose structure type I. For the A. americana fibers,
respectively (Fig. 4).                                                 both extraction methods contributed to a significant
      The application of method #1 for CNFAA1 extrac‐                  decrease in the amount of amorphous content in the
tion from Agave fibers led to a change in the crystal                  samples. Nevertheless, as shown by the data reported
form of the native cellulose I (Fig. 4). The CNFAA1                    in Table 2, the chemical treatment of the raw Agave fibers
sample was a mixture of cellulose types I and II, as                   by method #2 significantly increased the CI of the
can be observed from the appearance of two peaks at                    cellulose nanofibers compared to extraction method
2θ=20.0° (110) and 22.0° (020), instead of the one main                #1. The calculated CIs of the raw_AA, CNFAA1, and
peak at 22.6°. The obtained results were in agreement                  CNFAA2 samples were found to be 70.4%, 87.7%, and
with previous studies (le Moigne and Navard, 2010;                     94.1%, respectively. Das et al. (2010) obtained crys‐
Sghaier et al., 2012). In particular, Sghaier et al. (2012)            tallinity values of 66.5% for cotton nanofibers and
reported a transformation of the crystal structure of                  78.0% for jute, with crystallite sizes of 2.58 and
A. americana fibers from cellulose I to cellulose II                   3.68 nm, respectively (perpendicular to the 101 plane);
caused by mercerisation with NaOH, while bleaching                     nanocrystalline cellulose obtained by acid hydrolysis
with NaOCl treatment had no crucial effect on the                      from newspapers reached a CI of up to 90.2%, with
Agave fiber properties. On the other hand, the CNFAA2                  a crystallite size of 5.7 nm (Mohamed et al., 2015).
sample isolated by method #2 had a similar diffraction                 The average crystallite size was calculated using the
pattern to that of the raw Agave fibers (Fig. 4). For                  Scherrer formula. Estimation of the sizes of raw_AA,
this sample, the 2θ peaks were observed at 16.0° (110),                CNFAA1, and CNFAA2 resulted in values of 2.5, 4.6,
22.8° (200), and 34.5° (004), corresponding to the                     and 3.9 nm, respectively.

                              Table 2 X-ray diffraction (XRD) data and crystallinity parameters
                                                                                      2θ (°)
     Plane         Cellulose polymorph
                                             Raw_AA          CNFAA1          CNFAA2        Raw_RC       CNFRC1        CNFRC2
     (1-10)          Cellulose II                             12.2                                                     12.0
     (1-10)          Cellulose I                                                                                       15.0
     (110)           Cellulose I               16.4                           16.0                       16.0          16.4
     (110)           Cellulose I                              20.0
     (112)           Cellulose II                                                                                      20.2
     (020)           Cellulose II                             22.0
     (200)           Cellulose I               22.6                           22.8          22.0         22.6          22.6
     (004)           Celluloses I and II       34.5           34.5            34.5                       34.7          34.0
     Crystallinity index (%)                   70.4           87.7            94.1                       90.7          92.7
     Crystallite size (nm)                      2.5            4.6             3.9                        3.4           4.6
J Zhejiang Univ-Sci B (Biomed & Biotechnol) 2021 22(6):450-461 | 457
The X-ray diffraction patterns of the raw_RC, 3.4 FTIR spectroscopy
CNFRC1, and CNFRC2 samples are presented in Fig. 5.
The FTIR spectra of the CNFAA1, CNFAA2, CNFRC1,
As can be seen, the diffraction pattern of raw R. com‐
and CNFRC2 samples are presented in Fig. 6. The broad
munis fibers (i.e., raw_RC) is dominated by a broad,
band positioned in the 3600–3000 cm−1 region was
amorphous halo, showing a broad peak at around
observed in all the synthesized cellulose fiber samples
22.0° in the (200) plane, typical for cellulose type I
and indicates the O–H stretching vibrations of the
(Fig. 5). The X-ray diffraction diagram of CNFRC1
hydrogen-bonded hydroxyl group in the cellulose
showed three characteristic peaks at 16.0° (110),
molecules involved in intermolecular hydrogen bonds
22.6° (200), and 34.7° (004), typical of the cellulose I (Poletto et al., 2014). The absorption peak at 1642 сm−1
structure (Fig. 5). Compared to CNFAA2, the pattern of in all the synthesized samples indicates the presence
the CNFRC2 sample extracted using method #2 exhibited of water, due to the presence of O–H bending. Although
peaks at 2θ=12.0° (1‒10), 15.0° (1‒10), 16.4° (110), all the FTIR samples were freeze-dried before analysis,
20.2° (112), 22.6° (200), and 34.0° (004), indicat‐ it was difficult to completely eliminate water from the
ing a mixture of the cellulose types I and II crystal cellulose molecules due to the strong cellulose–water
structures (Fig. 5). Nanocrystalline cellulose from cot‐ interactions. One of the possible explanations is that
ton shows characteristics peaks at around 15.0° (110) the open surfaces created in the nanocellulose by the
and 23.0° (200), similar to what is observed here. removal of lignin and hemicellulose helped in the
Peaks at 2θ=14.8°, 16.4°, 22.6°, and 34.6° are typical absorption of moisture, leading to higher moisture
of cellulose I, while the one at 22.6° indicates a high‐ content (Lam et al., 2012). The presence of the
er perfection of the crystal structure in the (200) plane absorption peak at 2900 cm−1 can be attributed to the
(Mohamed et al., 2015); this peak is found for sam‐ stretching vibrations of the C – H groups of cellulose
ples with higher crystallinity values. The CI value of (Bettaieb et al., 2015a). The absorption peak in the
CNFRC1 was found to be 90.7%. After extraction by spectrum near 1159 cm−1 is attributable to the C–O–C
method #2, the CI of CNFRC2 was slightly higher (i.e., asymmetric stretching vibrations of cellulose. Several
92.7%). Estimation of the sizes of CNFRC1 and CNFRC2 characteristic absorption bands showed that there were
resulted in values of 3.4 and 4.6 nm, respectively. differences in the chemical structure of the cellulose
nanofiber samples obtained by the two different
extraction methods. This was the case for CNFAA1 and
CNFRC1 samples isolated by method #1. The weak
shoulders at 2854 cm−1 or/and 1740 cm−1 in the FTIR
spectra are indicative of the presence of lignin
content. In the case of the CNFAA2 and CNFRC2 samples
isolated by method #2, these peaks were not detected.
The band around 897 cm−1 is associated with an
Fig. 5 X-ray diffraction (XRD) patterns of the cellulose
nanofibers obtained from Ricinus communis: raw R.
communis (raw_RC), CNFRC1, and CNFRC2.
These results showed that for both A. americana
and R. communis fibers, extraction method #2 was better
at producing highly crystalline cellulose nanofibers once
Fig. 6 Fourier transform infrared (FTIR) spectra of
ethanol at high temperatures had dissolved lignin and cellulose nanofibers obtained from Agave americana and
nitric acid had destroyed hemicellulose. Ricinus communis.458 | J Zhejiang Univ-Sci B (Biomed & Biotechnol) 2021 22(6):450-461 amorphous region in cellulose (Hospodarova et al., CNFRC2), the cells were also observed to actively 2018) (β-glycosidic linkages (Mohamed et al., 2015)), metabolize MTT in the same concentration range, which seems to be less important for R. communis but to a lesser extent relative to their method #1 samples and for Agave treated under method #2, counterparts (i.e., CNFAA1 and CNFRC1); this may be which is in accordance with the results from related to the crystallinity (it seems that the higher the crystallinity measures shown in Table 2. For all the CI, the lower the MTT metabolization). Moreover, synthesized samples, the presence of the symmetrical relative to the CNFAA1, CNFRC1, and CNFRC2 samples, C–O–S vibration at 807 cm−1 is associated with the only the CNFAA2 sample was observed to exert a mild C–O–SO3 groups. This result was confirmed by zeta cytotoxic effect on the HEK293T cells when using a potential measurements, where the negative ζ-potential sample concentration of 500 μg/mL (
J Zhejiang Univ-Sci B (Biomed & Biotechnol) 2021 22(6):450-461 | 459

Author contributions                                                       nanocrystal reinforced polymer. Carbohydr Polym, 123:
     Experiments, data analysis, and original draft preparation:           99-104.
Olga L. EVDOKIMOVA; experiments, data analysis, and                        https://doi.org/10.1016/j.carbpol.2015.01.026
writing the manuscript: Carla S. ALVES and Radenka M.                 Bettaieb F, Khiari R, Hassan ML, et al., 2015b. Preparation
KRSMANOVIĆ WHIFFEN; experiments, data analysis, funding                    and characterization of new cellulose nanocrystals from
acquisition, resources, and writing and editing the manuscript:            marine biomass Posidonia oceanica. Ind Crops Prod, 72:
Zaida ORTEGA; data analysis, and writing and editing the                   175-182.
manuscript: Helena TOMÁS; conceptualization, supervision,                  https://doi.org/10.1016/j.indcrop.2014.12.038
funding acquisition, resources, data analysis, and writing and        Charles H, Dukes JS, 2007. Impacts of invasive species on
editing the manuscript: João RODRIGUES. All authors have                   ecosystem services. In: Nentwig W (Ed.), Biological
read and agreed to the published version of the manuscript. The            Invasions. Springer, Heidelberg, p.217-237.
authors have full access to all the data in the study and take             https://doi.org/10.1007/978-3-540-36920-2_13
responsibility for the integrity and security of the data.            Chen YW, Lee HV, 2018. Revalorization of selected municipal
                                                                           solid wastes as new precursors of “green” nanocellulose
Compliance with ethics guidelines                                          via a novel one-pot isolation system: a source perspective.
     Olga L. EVDOKIMOVA, Carla S. ALVES, Radenka M.                        Int J Biol Macromol, 107:78-92.
KRSMANOVIĆ WHIFFEN, Zaida ORTEGA, Helena TOMÁS,                            https://doi.org/10.1016/j.ijbiomac.2017.08.143
and João RODRIGUES declare that they have no conflict of              Crowl TA, Crist TO, Parmenter RR, et al., 2008. The spread
interest.                                                                  of invasive species and infectious disease as drivers of
     This article does not contain any studies with human or
                                                                           ecosystem change. Front Ecol Environ, 6(5):238-246.
animal subjects performed by any of the authors.
                                                                           https://doi.org/10.1890/070151
                                                                      Das K, Ray D, Bandyopadhyay NR, et al., 2010. Study of the
References                                                                 properties of microcrystalline cellulose particles from
Abrantes S, Amaral ME, Costa AP, et al., 2007. Cynara                      different renewable resources by XRD, FTIR, nanoinden‐
     cardunculus L. alkaline pulps: alternatives fibres for paper          tation, TGA and SEM. J Polym Environ, 18(3):355-363.
     and paperboard production. Bioresour Technol, 98(15):                 https://doi.org/10.1007/s10924-010-0167-2
     2873-2878.                                                       Fiore V, Scalici T, Vitale G, et al., 2014. Static and dynamic
     https://doi.org/10.1016/j.biortech.2006.09.052                        mechanical properties of Arundo Donax fillers-epoxy
Aguir C, M'Henni MF, 2006. Experimental study on carboxy‐                  composites. Mater Des, 57:456-464.
     methylation of cellulose extracted from Posidonia oceanica.           https://doi.org/10.1016/j.matdes.2014.01.025
     J Appl Polym Sci, 99(4):1808-1816.                               Fiserova M, Gigac J, Majtnerova A, et al., 2006. Evaluation
     https://doi.org/10.1002/app.22713                                     of annual plants (Amaranthus caudatus L., Atriplex
Åhlén M, Tummala GK, Mihranyan A, 2018. Nanoparticle-                      hortensis L., Helianthus tuberosus L.) for pulp production.
     loaded hydrogels as a pathway for enzyme-triggered                    Cellul Chem Technol, 40(6):405-412.
     drug release in ophthalmic applications. Int J Pharm,            Guise C, Fangueiro R, 2016. Biomedical applications of
     536(1):73-81.                                                         nanocellulose. In: Fangueiro R, Rana S (Eds.), Natural
     https://doi.org/10.1016/j.ijpharm.2017.11.053                         Fibres: Advances in Science and Technology Towards
Bacakova L, Pajorova J, Bacakova M, et al., 2019. Versatile                Industrial Applications. Springer, Dordrecht, p.155-169.
     application of nanocellulose: from industry to skin tissue            https://doi.org/10.1007/978-94-017-7515-1_12
     engineering and wound healing. Nanomaterials (Basel),            Gümüskaya E, Usta M, Kirci H, 2003. The effects of various
     9(2):164.                                                             pulping conditions on crystalline structure of cellulose in
     https://doi.org/10.3390/nano9020164                                   cotton linters. Polym Degrad Stab, 81(3):559-564.
Bajpai P, 2017. Pulp and Paper Industry. Elsevier, Amsterdam,              https://doi.org/10.1016/S0141-3910(03)00157-5
     p.15-25.                                                         Hospodarova V, Singovszka E, Stevulova N, 2018. Character‐
     https://doi.org/10.1016/b978-0-12-811101-7.00002-2                    ization of cellulosic fibers by FTIR spectroscopy for their
Béakou A, Ntenga R, Lepetit J, et al., 2008. Physico-chemical              further implementation to building materials. Am J Anal
     and microstructural characterization of “Rhectophyllum                Chem, 9(6):303-310.
     camerunense” plant fiber. Compos Part A: Appl Sci                     https://doi.org/10.4236/ajac.2018.96023
     Manuf, 39(1):67-74.                                              Kargarzadeh H, Ioelovich M, Ahmad I, et al., 2017. Methods
     https://doi.org/10.1016/j.compositesa.2007.09.002                     for extraction of nanocellulose from various sources. In:
Bettaieb F, Khiari R, Dufresne A, et al., 2015a. Mechanical                Kargarzadeh H, Ahmad I, Thomas S, et al. (Eds.), Hand‐
     and thermal properties of Posidonia oceanica cellulose                book of Nanocellulose and Cellulose Nanocomposites,
460 | J Zhejiang Univ-Sci B (Biomed & Biotechnol) 2021 22(6):450-461
Volume 1. Wiley-VCH Verlag GmbH & Co. KGaA, in Sugarcane Biorefinery: Technologies, Commercialization,
Weinheim, p.1-49. Policy Issues and Paradigm Shift for Bioethanol and
https://doi.org/10.1002/9783527689972.ch1 By-Products. Elsevier Inc., Amsterdam, p.179-196.
Khiari R, Mauret E, Belgacem MN, et al., 2011. Tunisian https://doi.org/10.1016/B978-0-12-804534-3.00009-4
date palm rachis used as an alternative source of fibres Phanthong P, Reubroycharoen P, Hao XG, et al., 2018.
for papermaking applications. BioResources, 6(1):265-281. Nanocellulose: extraction and application. Carbon Res
Lam E, Male KB, Chong JH, et al., 2012. Applications of Convers, 1(1):32-43.
functionalized and nanoparticle-modified nanocrystalline https://doi.org/10.1016/j.crcon.2018.05.004
cellulose. Trends Biotechnol, 30(5):283-290. Poletto M, Ornaghi HL, Zattera AJ, 2014. Native cellulose:
https://doi.org/10.1016/j.tibtech.2012.02.001 structure, characterization and thermal properties.
Lang N, Merkel E, Fuchs F, et al., 2015. Bacterial nanocellu‐ Materials (Basel), 7(9):6105-6119.
lose as a new patch material for closure of ventricular https://doi.org/10.3390/ma7096105
septal defects in a pig model. Eur J Cardio-Thorac Surg, Rambabu N, Panthapulakkal S, Sain M, et al., 2016. Production
47(6):1013-1021. of nanocellulose fibers from pinecone biomass: evaluation
https://doi.org/10.1093/ejcts/ezu292 and optimization of chemical and mechanical treatment
le Moigne N, Navard P, 2010. Dissolution mechanisms of wood conditions on mechanical properties of nanocellulose films.
cellulose fibres in NaOH-water. Cellulose, 17(1):31-45. Ind Crops Prod, 83:746-754.
https://doi.org/10.1007/s10570-009-9370-5 https://doi.org/10.1016/j.indcrop.2015.11.083
Lin N, Dufresne A, 2014. Nanocellulose in biomedicine: current Reddy JP, Rhim JW, 2014. Characterization of bionanocom‐
status and future prospect. Eur Polym J, 59:302-325. posite films prepared with agar and paper-mulberry pulp
https://doi.org/10.1016/j.eurpolymj.2014.07.025 nanocellulose. Carbohydr Polym, 110:480-488.
Maheswari CU, Reddy KO, Muzenda E, et al., 2012. https://doi.org/10.1016/j.carbpol.2014.04.056
Extraction and characterization of cellulose microfibrils Rees A, Powell LC, Chinga-Carrasco G, et al., 2015. 3D
from agricultural residue—Cocos nucifera L. Biomass bioprinting of carboxymethylated-periodate oxidized
Bioenergy, 46:555-563. nanocellulose constructs for wound dressing applications.
https://doi.org/10.1016/j.biombioe.2012.06.039 BioMed Res Int, 2015:925757.
Mishra RK, Sabu A, Tiwari SK, 2018. Materials chemistry https://doi.org/10.1155/2015/925757
and the futurist eco-friendly applications of nanocellulose: Ridzuan MJM, Majid MSA, Afendi M, et al., 2016. Char‐
status and prospect. J Saudi Chem Soc, 22(8):949-978. acterisation of natural cellulosic fibre from Pennisetum
https://doi.org/10.1016/j.jscs.2018.02.005 purpureum stem as potential reinforcement of polymer
Mohamed MA, Salleh WNW, Jaafar J, et al., 2015. Physico‐ composites. Mater Des, 89:839-847.
chemical properties of “green” nanocrystalline cellulose https://doi.org/10.1016/j.matdes.2015.10.052
isolated from recycled newspaper. RSC Adv, 5(38): Sair S, Oushabi A, Kammouni A, et al., 2017. Effect of
29842-29849. surface modification on morphological, mechanical and
https://doi.org/10.1039/c4ra17020B thermal conductivity of hemp fiber: characterization of
Mooney HA, Hobbs RJ, 2000. Invasive Species in a Changing the interface of hemp‒polyurethane composite. Case
World. Islands Press, p.65-73. https://islandpress.org/ Stud Therm Eng, 10:550-559.
books/invasive-species-changing-world https://doi.org/10.1016/j.csite.2017.10.012
Motaung TE, Linganiso LZ, Kumar R, et al., 2017. Agave Sandler N, Preis M, 2016. Printed drug-delivery systems for
and sisal fibre-reinforced polyfurfuryl alcohol composites. improved patient treatment. Trends Pharmacol Sci,
J Thermoplastic Compos Mater, 30(10):1323-1343. 37(12):1070-1080.
https://doi.org/10.1177/0892705716632858. https://doi.org/10.1016/j.tips.2016.10.002
Ortega Z, Castellano J, Suárez L, et al., 2019. Characterization Satyanarayana KG, Flores-Sahagun THS, Santos LPD, et al.,
of Agave americana L. plant as potential source of fibres 2013. Characterization of blue agave bagasse fibers of
for composites obtaining. SN Appl Sci, 1:987. Mexico. Compos Part A: Appl Sci Manuf, 45:153-161.
https://doi.org/10.1007/s42452-019-1022-2 https://doi.org/10.1016/j.compositesa.2012.09.001
Oun AA, Rhim JW, 2016. Characterization of nanocelluloses Sghaier AEOB, Chaabouni Y, Msahli S, et al., 2012.
isolated from Ushar (Calotropis procera) seed fiber: Morphological and crystalline characterization of NaOH
effect of isolation method. Mater Lett, 168:146-150. and NaOCl treated Agave americana L. fiber. Ind Crops
https://doi.org/10.1016/j.matlet.2016.01.052 Prod, 36(1):257-266.
Pereira B, Arantes V, 2018. Nanocelluloses from sugarcane https://doi.org/10.1016/j.indcrop.2011.09.012
biomass. In: Chandel AK, Silveira MHL (Eds.), Advances Sun DY, Onyianta AJ, O'Rourke D, et al., 2020. A process forJ Zhejiang Univ-Sci B (Biomed & Biotechnol) 2021 22(6):450-461 | 461
deriving high quality cellulose nanofibrils from water copper-containing mesoporous bioactive glass and
hyacinth invasive species. Cellulose, 27(7):3727-3740. nanofibrillated cellulose: biocompatibility and angiogenic
https://doi.org/10.1007/s10570-020-03038-4 promotion in chronic wound healing application. Acta
Theander O, Westerlund EA, 1986. Studies on dietary fiber. Biomater, 46:286-298.
3. Improved procedures for analysis of dietary fiber. J https://doi.org/10.1016/j.actbio.2016.09.021
Agric Food Chem, 34(2):330-336. Xu WY, Wang XJ, Sandler N, et al., 2018. Three-dimensional
https://doi.org/10.1021/jf00068a045 printing of wood-derived biopolymers: a review focused
Trifol J, Sillard C, Plackett D, et al., 2017. Chemically on biomedical applications. ACS Sustain Chem Eng,
extracted nanocellulose from sisal fibres by a simple and 6(5):5663-5680.
industrially relevant process. Cellulose, 24(1):107-118. https://doi.org/10.1021/acssuschemeng.7b03924
https://doi.org/10.1007/s10570-016-1097-5 Yu DG, Branford-White C, Ma ZH, et al., 2009. Novel drug
Vinayaka DL, Guna V, Madhavi D, et al., 2017. Ricinus delivery devices for providing linear release profiles
communis plant residues as a source for natural cellulose fabricated by 3DP. Int J Pharm, 370(1-2):160-166.
fibers potentially exploitable in polymer composites. Ind https://doi.org/10.1016/j.ijpharm.2008.12.008
Crops Prod, 100:126-131.
https://doi.org/10.1016/j.indcrop.2017.02.019 Supplementary information
Wang XJ, Cheng F, Liu J, et al., 2016. Biocomposites of Figs. S1 and S2; Table S1You can also read