Added value of the regionally coupled model ROM in the East Asian summer monsoon modeling - EPIC
←
→
Page content transcription
If your browser does not render page correctly, please read the page content below
Theoretical and Applied Climatology
https://doi.org/10.1007/s00704-020-03093-8

    ORIGINAL PAPER

Added value of the regionally coupled model ROM in the East Asian
summer monsoon modeling
Shoupeng Zhu 1,2,3 & Armelle Reca C. Remedio 2 & Dmitry V. Sein 4,5 & Frank Sielmann 6 & Fei Ge 3,7 & Jingwei Xu 1 &
Ting Peng 1 & Daniela Jacob 2 & Klaus Fraedrich 1,3 & Xiefei Zhi 1

Received: 14 June 2019 / Accepted: 3 January 2020
# Springer-Verlag GmbH Austria, part of Springer Nature 2020

Abstract
The performance of the regional atmosphere-ocean coupled model ROM (REMO-OASIS-MPIOM) is compared with its atmo-
spheric component REMO in simulating the East Asian summer monsoon (EASM) during the time period 1980–2012 with the
following results being obtained. (1) The REMO model in the standalone configuration with the prescribed sea surface conditions
produces stronger low-level westerlies associated with the South Asian summer monsoon, an eastward shift of the western
Pacific subtropical high (WPSH) and a wetter lower troposphere, which jointly lead to moisture pathways characterized by
stronger westerlies with convergence eastward to the western North Pacific (WNP). As a consequence, the simulated precipita-
tion in REMO is stronger over the ocean and weaker over the East Asian continent than in the observational datasets. (2)
Compared with the REMO results, lower sea surface temperatures (SSTs) feature the ROM simulation with enhanced air-sea
exchanges from the intensified low-level winds over the subtropical WNP, generating an anomalous low-level anticyclone and
hence improving simulations of the low-level westerlies and WPSH. With lower SSTs, ROM produces less evaporation over the
ocean, inducing a drier lower troposphere. As a result, the precipitation simulated by ROM is improved over the East Asian
continent but with dry biases over the WNP. (3) Both models perform fairly well for the upper level circulation. In general,
compared with the standalone REMO model, ROM improves simulations of the circulation associated with the moisture
transport in the lower- to mid-troposphere and reproduces the observed EASM characteristics, demonstrating the advantages
of the regionally coupled model ROM in regions where air-sea interactions are highly relevant for the East Asian climate.

                                                                           1 Introduction

* Xiefei Zhi                                                               Climate models are considered to be important and valid tools
  zhi@nuist.edu.cn                                                         in simulating and understanding climate phenomena (Kumar
1
                                                                           et al. 2015; Paeth et al. 2015). A number of state-of-art climate
     Key Laboratory of Meteorological Disasters, Ministry of Education /
     Collaborative Innovation Center on Forecast and Evaluation of
                                                                           models have been developed, although the computational re-
     Meteorological Disasters, Nanjing University of Information Science   sources currently available restrict global climate models
     & Technology, Nanjing 210044, China                                   (GCMs) to performing global climate simulations on a long
2
     Climate Service Center Germany, Helmholtz Centre for Materials        timescale with a regular grid at a horizontal resolution of about
     and Coastal Research, 20095 Hamburg, Germany                          200 km (Lee and Suh 2000; Ngo-Duc et al. 2017). GCMs with
3
     Max Planck Institute for Meteorology, 20146 Hamburg, Germany          such a coarse resolution cannot sufficiently resolve regional
4
     Helmholtz Centre for Polar and Marine Research, Alfred Wegener
                                                                           processes, especially over complex terrains. As a result, re-
     Institute, 27570 Bremerhaven, Germany                                 gional climate models (RCMs) with improved physics repre-
5
     Shirshov Institute of Oceanology, Russian Academy of Science,
                                                                           sentations and higher grid resolutions have been increasingly
     Moscow 117997, Russia                                                 applied to detect local climate information (Ludwig et al.
6
     Meteorological Institute, University of Hamburg,
                                                                           2017; Ge et al. 2019; Zhu et al. 2020). However, although a
     20146 Hamburg, Germany                                                large number of modern RCMs have been developed and
7
     Plateau Atmosphere and Environment Key Laboratory of Sichuan
                                                                           could be sufficient for many requirements, the feedbacks as-
     Province / School of Atmospheric Sciences, Chengdu University of      sociated with atmosphere-ocean interactions and local pro-
     Information Technology, Chengdu 610225, China                         cesses with significant impacts on spatial and temporal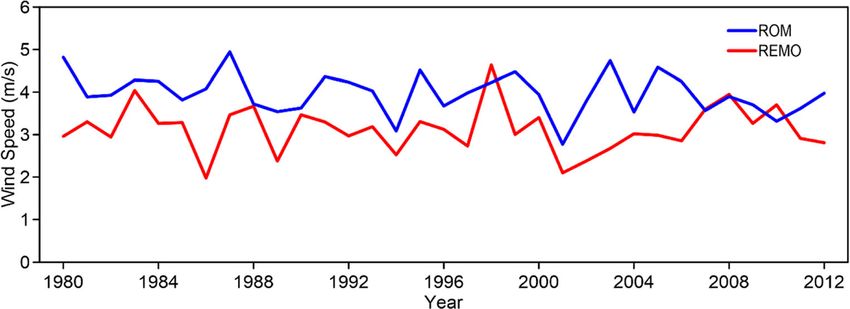
S. Zhu et al.

structures of the regional climate (Wang et al. 2006; Pinto         2 Datasets and modeling
et al. 2014) are still poorly, or even not, taken into account
in most climate models (Lucas-Picher et al. 2011).                  2.1 Observational datasets
    The regional climate model REMO (Jacob 2001; Jacob
et al. 2001) has been applied widely in atmospheric researches.     Multiple reanalysis datasets, hereafter termed observations,
Previous evaluations have highlighted the model performance         are used for the model validation. The first is the European
in terms of the basic features of regional climate over several     Centre for Medium-Range Weather Forecasts interim reanal-
domains (Jacob et al. 2012; Kumar et al. 2014), such as             ysis (ERA Interim; Dee et al. 2011) with a resolution of 0.5° ×
the African area (Paeth et al. 2009; Vondou and Haensler            0.5°. The second is the National Centers for Environmental
2017) and South America (Solman et al. 2013). Based on the          Prediction (NCEP)-Department of Energy (DOE) Reanalysis
atmospheric REMO model, the regionally atmosphere-ocean-            II dataset (NCEP II; Kanamitsu et al. 2002) with a resolution
coupled model ROM (REMO-OASIS-MPIOM) has been de-                   of 2.5° × 2.5°, which is an improved version of the NCEP
veloped to investigate the regional climate and local processes     Reanalysis I model that fixed errors and updated parameteri-
(Sein et al. 2014; Niederdrenk et al. 2016).                        zations of physical processes. In addition, the Modern-Era
    There have been few applications of REMO and ROM to             Retrospective analysis for Research and Applications
East Asia, where the ocean conditions, especially in the west-      Version 2 (MERRA2; Gelaro et al. 2017), the latest atmo-
ern North Pacific (WNP), function as sources of both heat and       spheric reanalysis of the modern satellite era produced by
moisture and have substantial impacts on the local and sur-         the Global Modeling and Assimilation Office (GMAO) of
rounding atmospheric circulation systems (Zhang et al.              National Aeronautics and Space Administration (NASA) with
2015b; Zu et al. 2019). The East Asian summer monsoon               the 0.5° × 0.625° resolution, is also employed in the study.
(EASM) is one of the most typical and important components          Additionally, the Climate Prediction Center Merged
of the climate in this region and affects nearly one-third of the   Analysis of Precipitation (CMAP; Xie and Arkin 1997) en-
world’s population (Xue et al. 2015; Cai et al. 2017; Fan et al.    hanced version (with NCEP Reanalysis) and the Global
2018). Thus, the EASM, with its complex spatial and tempo-          Precipitation Climatology Project (GPCP; Adler et al. 2003)
ral structure, has received increasing attention (Yang et al.       version 2.3 are used as the reference data for precipitation,
2011; Zhang et al. 2015a; Ge et al. 2017; Fan et al. 2019).         both on a 2.5° × 2.5° global grid. In this study, all statistical
As refined numerical simulations of the EASM climatology in         significances are performed for the 95% confidence level
global models do not provide satisfactory results, enormous         using the two-tailed Student’s t test.
efforts have been made to simulate the EASM using RCMs
(Zou and Zhou 2013; Song and Zhou 2014). It has been                2.2 Model components and setup
shown that atmosphere-ocean feedbacks have a crucial role
in regulating the development of the Asian monsoon system           The regionally coupled atmosphere-ocean-sea-ice model
(Zou et al. 2016). Therefore, the explicit inclusion of the feed-   ROM comprising the atmospheric REgional MOdel
backs between the atmosphere and ocean is necessary in              (REMO) (Jacob 2001; Jacob et al. 2001), the Max Planck
modeling the EASM system and understanding the underly-             Institute Ocean Model (MPIOM) (Marsland et al. 2003;
ing mechanisms.                                                     Jungclaus et al. 2013), and the Hydrological Discharge (HD)
    In this study, the climate modeling based on the coupled        model (Hagemann and Dümenil 1997; Hagemann and Gates
model ROM and its standalone atmospheric component                  2001) is applied to reproduce the climatology of the EASM
REMO is carried out at a fine resolution of 50 km to identify       system. In parallel, the standalone atmospheric model REMO
the characteristics of the REMO model and the impacts of the        i s a l s o p e r f o r m e d t o i n v e s t i g a t e im p a c t s o f t h e
regional atmosphere-ocean coupling in reproducing the               regional atmosphere-ocean coupling.
EASM system. The numerical modeling results are compared                The ocean model MPIOM is run in a global configuration,
with several reanalysis datasets for the boreal summer.             with a regionally high horizontal resolution in Southeast Asia.
    This paper is structured as follows. The “Datasets and          MPIOM is performed with a curvilinear grid with shifted
modeling” section describes the datasets and the model de-          poles located over land to avoid the numerical singularity
sign. The “Results” section presents the results of the model       associated with the convergence of meridians, so that the mod-
validation, including the summer precipitation and a simple         el can well reach the regionally high resolution and maintain a
EASM index. The main mechanism behind the different                 global domain. It has 40 vertical levels with increasing level
modeling results from REMO and ROM is also analyzed in              thickness from 10 m in upper 70 m to 500 m in the deep ocean.
the “Results” section, including the moisture transport, atmo-      Moreover, the following parameterizations, aiming at sub-
spheric circulation at different levels, and sea surface condi-     grid-scale physical processes, are included: the bottom bound-
tions. Finally, the “Conclusions and discussion” section            ary layer slope convection scheme (Marsland et al. 2003), the
follows subsequently.                                               isopycnal scheme (Griffies 1998), the Gent and McWilliams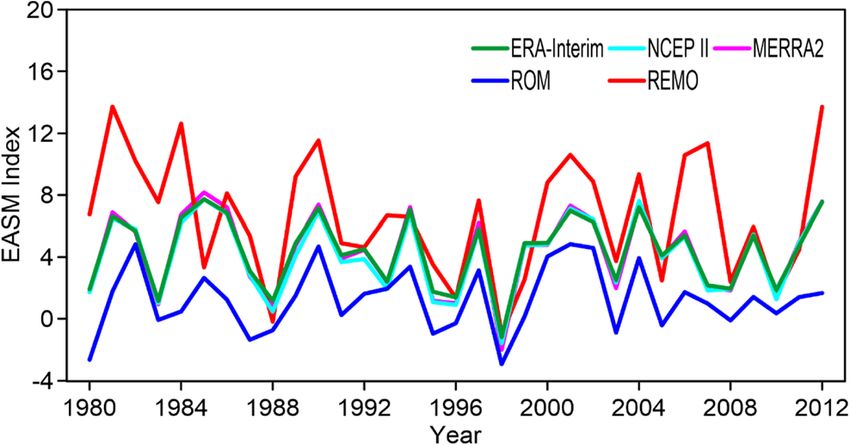
Added value of the regionally coupled model ROM in the East Asian summer monsoon modeling
style parameterization (Gent et al. 1995), and the enhanced and Asselin filter smoothing (Asselin 1972). For the ocean
vertical diffusion parameterization (Marsland et al. 2003). grid points, the sea surface temperature (SST) and sea ice
The model is initialized with the Polar Science Center distribution are prescribed as the lower boundary values. In
Hydrographic Climatology (PHC) temperature and salinity the uncoupled simulations, they are taken from the ERA
(Steele et al. 2001) and is spun up twice for 45 years (1958– Interim reanalysis dataset, whereas from the MPIOM model
2002) with forcing by the ERA-40 Reanalysis (Uppala et al. in the coupled mode. The initial conditions for the REMO
2005). After the ocean spin-up in standalone mode, it is model are the state obtained from the 66-year ROM spin-up
coupled with the REMO model for an additional 45 years (see above). The lateral boundary forcing is obtained from the
(1958–2002). The restart files obtained from this simulation ERA Interim reanalysis for both the standalone and coupled
for 31 December 2002 are used as the initial conditions for the cases.
ROM spin-up with ERA Interim forcing (an additional The terrestrial hydrology model HD is run over the whole
21 years for 1980–2000). Finally, the model state obtained globe with constant 0.5° resolution to simulate the lateral
for 31 December 2000 (90 + 45 + 21, i.e., 156 years of spin- fluxes of freshwater at the land surface. In the model, the total
up for the ocean and 66 years for the atmosphere) is used as lateral water outflow from a grid box contains three flow pro-
the initial conditions for our simulations. cesses: overland flow, base flow, and river flow. Detailed in-
The atmospheric model REMO has a horizontal resolution formation can be found in previous model (Hagemann and
of 50 km and 27 hybrid vertical levels. The domain mainly Gates 2001).
covers the WNP and surrounding area, which play crucial The coupling is carried out via the Ocean Atmosphere Sea
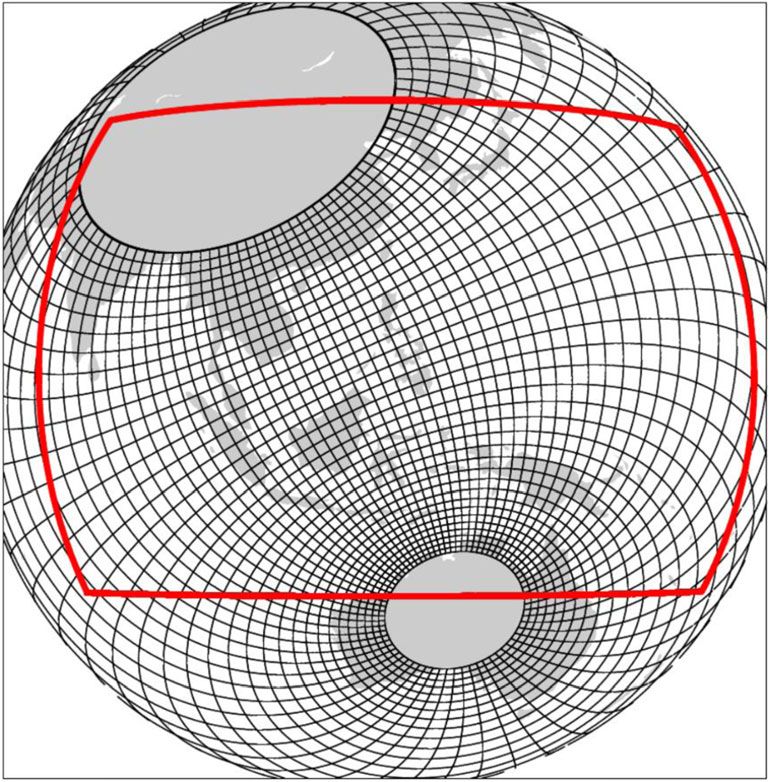
rules in the EASM system (Wang et al. 2005), as shown in Ice Soil Version 3 (OASIS3) coupler developed by the
Fig. 1. A rotated grid is applied in the REMO configuration to European Centre for Research and Advanced Training in
avoid the largely different extensions of grid cells close to the Scientific Computation (CERFACS; Valcke et al. 2003) with
poles. The dynamic core of the model and the discretization in an interval of 3 h. Under the OASIS3 framework, REMO
space and time are based on the Europa Model of the German obtains the lower boundary conditions over the sea and sea
Weather Service (Majewski 1991). The physical parameteri- ice surfaces from the ocean model MPIOM, and provides
zations are taken from the GCM ECHAM versions 4 and 5 MPIOM with the atmospheric momentum and the heat and
(Roeckner et al. 1996, 2003). REMO’s prognostic variables water fluxes. Further details about the model coupling have
are the surface pressure, horizontal wind components, temper- been reported by Sein et al. (2015).
ature, water vapor, liquid water, and cloud ice. The horizontal
discretization is performed on the Arakawa-C-grid, and the
hybrid vertical coordinates are defined according to 3 Results
Simmons and Burridge (1981). The time discretization is
based on the leap frog scheme with semi-implicit correction 3.1 Simulations of summer precipitation
Figure 2 presents the spatial distributions of summer precipi-
tation averaged over 1981–2012 extracted from the observa-
tions and the models, with their differences shown in Fig. 3.
The observations (Fig. 2a, d) are characterized by high precip-
itation from the Bay of Bengal (BOB) to the Indochina
Peninsula (ICP). A clear rain band is seen over the near-
equatorial western Pacific, where the ERA Interim and
CMAP datasets indicate higher precipitation than the GPCP
and MERRA2 datasets.
The coupled model ROM simulation captures the distri-
bution of rainfall well, especially for the center over the
BOB and ICP (Fig. 2e). The pattern correlation coefficients
(PCCs) between the ROM precipitation and the ERA
Interim, CMAP, GPCP, and MERRA2 observations are
0.70, 0.55, 0.67, and 0.55, respectively, all passing the
0.01 significance level. Most biases of the ROM simula-
Fig. 1 Model grid configuration taken from Sein et al. (2015). The red tion over the continental area are not significant according
rectangle denotes the coupled domain. The black lines are the ocean
model grid (only every 12th grid line is shown). The air-sea fluxes are
to Student’s t test (Fig. 3a, d). The main deficiency occurs
coupled over the western North Pacific and surrounding area, which play over the near-equatorial western Pacific east of the
crucial rules in the East Asian summer monsoon system Philippines, with underestimations of precipitation.S. Zhu et al. Fig. 2 Spatial distributions of the summer daily precipitation (shading, unit mm) derived from (a) ERA Interim, (b) CMAP, (c) GPCP, (d) MERRA2, (e) ROM, and (f) REMO, averaged over the time period 1980–2012 The precipitation simulated by the standalone atmospheric slightly higher than the ROM results, except for the GPCP model REMO is characterized by similar patterns to the ob- observation. For the continental areas, REMO produces dry servations (Fig. 2f), with PCCs of 0.73, 0.63, 0.59, and 0.60 biases over the northern part of East Asia (e.g., the Chinese for the ERA Interim, CMAP, GPCP, and MERRA2 datasets, mainland), but has clear wet biases over the ICP (Fig. 3e, h). In respectively, passing the 0.01 significance level. These are contrast with the underestimated precipitation over the WNP Fig. 3 Spatial distributions of the differences in summer daily Interim. f REMO minus CMAP. g REMO minus GPCP. h REMO precipitation (shading, unit mm) between the model results and minus MERRA2. i ROM minus REMO, averaged over the time period observations. a ROM minus ERA Interim. b ROM minus CMAP. c 1980–2012. The black dotted regions indicate the differences exceeding ROM minus GPCP. d ROM minus MERRA2. e REMO minus ERA the 95% confidence level based on Student’s t test
Added value of the regionally coupled model ROM in the East Asian summer monsoon modeling

from ROM, REMO tends to produce excessive precipitation                      correlation coefficient of 0.65, passing the 0.01 significance
with wet biases of up to 3 mm relative to the observations over              level. The results, therefore, suggest that the coupled model
the southern BOB and the western Pacific.                                    ROM performs better in simulating the EASM intensity than
   In general, both models represent the distribution patterns               the standalone atmospheric model REMO.
of the observed summer precipitation over the study area. The
coupled ROM simulation reproduces the summer precipita-
tion well, especially over most parts of the continent, but un-              3.3 Main mechanisms controlling the differences
derestimates the precipitation over the ocean. By contrast, the              in EASM modeling of ROM and REMO
standalone REMO simulation features weaker precipitation
over the north East Asia, but higher over the near-equatorial                3.3.1 Tropospheric moisture transport
area including the BOB, ICP, and the western Pacific.
                                                                             The moisture transport plays an essential role in the EASM
3.2 Simulations of the EASM                                                  system, determining the summer precipitation and influencing
                                                                             both the location and intensity of the monsoon. Figure 5
To reveal the model capability to simulate the intensity and                 shows the observed and simulated summer mean tropospheric
variation of the EASM, the EASM index proposed by Wang                       vertically integrated moisture fluxes and their corresponding
and Fan (1999; the W-F index hereafter) is calculated in this                divergences averaged over 1980–2012. According to the ob-
section. This index is defined by the shear vorticity of the                 servations (Fig. 5a, c), there are three typical water vapor
zonal winds:                                                                 sources supplying the East Asian continent, which have also
                                                                             been identified in many studies (Zhu et al. 1986; Ninomiya
I ¼ U 850 hPa ð5°−15°N; 90°−130°EÞ                                           1999): Starting from the west, the first is the result of westerly
     −U 850 hPa ð22:5°−32:5°N; 110°−140°EÞ                                   moisture fluxes impacted by the South Asian summer mon-
                                                                             soon (SASM), which brings abundant moisture from the
where U850 hPa is the u-component of the horizontal wind                     BOB, ICP, and the South China Sea into the East Asian con-
velocity at 850 hPa. It mainly reflects the two key elements                 tinent. The second source mainly comes from southerly mois-
of the EASM circulation system, that is, the WNP monsoon                     ture fluxes due to cross equatorial flows. The third source is
and the subtropical high.                                                    supplied by moisture fluxes over the western Pacific, which
    Figure 4 shows the W-F monsoon indices derived from the                  can be ascribed to the western Pacific subtropical high
observations and model simulations. The results from ROM                     (WPSH). The convergence of the three water vapor transport
and REMO simulations both reproduce the pronounced inter-                    paths lies over a band from southern china to Japan (the brown
annual variability of the EASM well. The ROM-simulated                       box in Fig. 5) and extends northeastwards, contributing to the
indices closely resemble those from the observations, but with               high levels of precipitation alongside these areas.
slightly lower values, whereas the REMO results are charac-                      The ROM model reproduces the moisture pathways and
terized by noticeably higher values and larger biases, especial-             their convergence (Fig. 5d). Compared with the observations,
ly during the 1980s and the early twenty-first century. The                  the simulated water vapor fluxes converge with a slightly
temporal correlation coefficients between the index series de-               higher magnitude over some parts of southern and eastern
rived from the ROM simulation and the observations are all                   China. By contrast, the lower moisture convergence charac-
about 0.77, whereas the REMO simulation has a lower                          terizes the near-equatorial western Pacific. As a result, ROM
                                                                             reproduces the precipitation over the continental area, but with
                                                                             dry biases to the east of the Philippines (Fig. 2e).
                                                                                 In the REMO simulation (Fig. 5e), the southwesterly mois-
                                                                             ture fluxes from the Indian Ocean associated with the SASM
                                                                             are enhanced relative to the observations, which generates
                                                                             significant wet biases over the BOB and ICP. The southwest-
                                                                             erly moisture stretches continuously too far to the east toward
                                                                             the WNP. The simulated water vapor transport heading to the
                                                                             East Asian continent is not as evident as in the observations
                                                                             and the ROM simulation. Correspondingly, the moisture con-
                                                                             vergence in the REMO model is decreased over the northern
Fig. 4 Time series of the summer mean East Asian summer monsoon              part of East Asia, where the rainfall is subsequently
(EASM) Wang and Fan (W-F) indices derived from ERA Interim, NCEP
II, MERRA2, ROM, and REMO, which are marked by green, turquoise,
                                                                             underestimated (Fig. 3e, h). The water vapor flows converge
purple, blue, and red solid lines, respectively, for the time period 1980–   over the mid-WNP near 135°E, leading to wet biases over the
2012                                                                         western Pacific.
S. Zhu et al.
Fig. 5 Spatial distributions of the summer mean tropospheric vertically from (a) ERA Interim, (b) NCEP II, (c) MERRA2, (d) ROM, and (e)
integrated moisture fluxes (arrows, scale in upper right in kg m−1 s−1) and REMO, averaged over the time period 1980–2012. The brown box
the corresponding divergences (shading, units10−4 kg m−2 s−1) derived represents the main observed convergence area
After the regional atmosphere-ocean coupling, the exten- over the WNP at 850 hPa is weak and also retreats eastward.
sion of water vapor transport related to the SASM, which is The simulated moisture transport follows the spatial low-level
exaggerated in the REMO simulation, is no longer seen. The wind patterns. Similar patterns to those in the REMO simula-
enhanced moisture convergence over the East Asian continent tion also occur in simulations performed by many models
is remarkable in the ROM results, and resembles the observa- under the Coupled Model Inter-comparison Project Phase 5
tions in terms of both location and intensity. The representa- (CMIP5) and several RCMs (Song and Zhou 2014; Zou et al.
tive simulated water vapor transport over the whole WNP 2016). By contrast, the observed low-level features are cap-
makes a large contribution to the improvements in simulating tured well by the coupled ROM model (Fig. 6d). The coupling
summer rainfall over the East Asian continent by the ROM reduces the westerlies associated with the SASM, which, in
model. the standalone REMO simulation, are located too far east. The
simulated low-level southwesterly winds over the East Asian
3.3.2 Atmospheric circulation continent become evident, as well as the stronger WNP anti-
cyclone relative to the REMO simulation. The low-level
Considering that moisture conditions are mainly dominated northward monsoon flow along the western edge of WPSH
by the lower atmosphere, the low-level winds and moisture is therefore represented better by the coupled model ROM.
at 850 hPa are examined in the simulations (Fig. 6). The ob- Figure 6 also shows the distributions of the summer mean
served summer mean wind fields (Fig. 6a, c) are characterized specific humidity at the low level derived from the observa-
by similar features to the moisture transport: the westerlies tions and model simulations. The ROM simulation produces a
related to the SASM; the cross-equatorial flows over the mar- drier lower troposphere over the WNP compared with the
itime continent; and the anticyclonic circulation over the ERA Interim dataset, but the simulated moisture pattern re-
WNP. Flows from the equator move northward through sembles the other two observational datasets (NCEP II and
15°N and converge at about 120°E, leading to the northward MERRA2) well. By contrast, the REMO simulation generates
monsoon flow along the western edge of the WPSH (brown wet biases over most areas, especially from the southern BOB
box in Fig. 6). In the REMO simulation (Fig. 6e), the low- to the eastern Philippines. It indicates that, over this area, the
level westerlies related to the SASM are excessively strong regional atmosphere-ocean coupling reduces the simulated
and shift too far east towards the WNP compared with the lower tropospheric water vapor content. As a consequence,
observations. Correspondingly, the simulated anticyclone the representative simulation of the moisture transport overAdded value of the regionally coupled model ROM in the East Asian summer monsoon modeling Fig. 6 As in Fig. 5 but for the wind (arrows, scale in upper right in m s−1) and the specific humidity (shading, unit g kg−1) at 850 hPa. The brown box represents the main observed convergence area East Asia in ROM mainly results from adjustments of both the WPSH represented by the 5880 gpm line, located in the area weaker low-level westerlies and drier lower troposphere com- of 20°-30°N, 135°-140°E. However, the position is shifted pared with the REMO model. eastwards to about 150°E by the REMO simulation. The For higher levels above 400 hPa, the South Asia high PCCs of the geopotential height at 500 hPa are 0.98, 0.99, (SAH) dominates the Tibetan Plateau and its surroundings, and 0.97 between the ROM simulation and the observations being strongest and steadiest between 150 and 100 hPa. The of ERA Interim, NCEP II, and MERRA2, respectively, which SAH center in the upper troposphere and the nearby circula- are of similar magnitude to those for the REMO results (0.97, tion have great impacts on the EASM, together with the atmo- 0.97, and 0.95), all passing the 0.01 significance level. It is spheric movements at 850 hPa (Liu et al. 2013). The differ- suggested that both REMO and ROM can represent the mid- ence in zonal winds between 850 and 200 hPa is often used to level geopotential height well, whereas ROM is more skillful identify the north-south land-sea thermal contrast and to rec- especially for the WPSH simulation, although the improve- ognize the monsoon intensity (Webster and Yang 1992), ment is not as pronounced as that at low levels. which is presented together with the wind fields at 200 hPa in Fig. 7. Both the ROM and REMO simulations reproduce 3.3.3 Sea surface conditions the high-level circulations satisfactorily, particularly the SAH. The PCCs of zonal winds between the simulations and obser- According to the above analysis, the superiority of the ROM vations are all greater than 0.99, passing the 0.01 significance simulation to the REMO results is increasingly representative level. However, as a result of the stronger 850 hPa westerlies as the level decreases. To a great extent, the explicit difference over East Asia in REMO (Fig. 6e), the regions with positive between the two simulations stems from their respective sea vertical zonal shears cover a larger area over the WNP surface conditions, which affect the simulated atmospheric (expanding eastward to almost 150°E; Fig. 7e) than in the circulation and the related moisture transport. The spatial dis- observations and ROM simulations, which conforms the tributions of summer mean sea level pressures (SLPs) and stronger EASM by REMO (Fig. 4). SSTs show the following features. The SLPs of the coupled In addition to the circulations at low and high levels, the model ROM (Fig. 8d) are comparable with the reanalysis WPSH at 500 hPa also substantially influences the summer datasets (Fig. 8a, c), whereas the REMO simulation (Fig. 8e) monsoon system over East Asia, which is assessed as follows shows lower values than the observations and ROM simula- (contours in Fig. 8). The pattern and intensity of the WPSH are tions, leading to the lower geopotential height in the mid- reproduced by both the ROM and REMO models. The ROM troposphere (Fig. 8e) and the eastward shift of the westerlies simulation also resembles the observed western edge of the (Fig. 6e).
S. Zhu et al.

Fig. 7 As in Fig. 5 but for the wind (arrows, scale in upper right in m s−1) at 200 hPa and the vertical shear of zonal wind (U850 minus U200, shading,
unit m s−1)

   The distribution of SST differences between the ROM and                    the intensified low-level wind (Fig. 10) over the subtropical
REMO simulations is characterized by negative values over                     WNP (Cha et al. 2016). Correspondingly, an anomalous low-
most of the WNP (Fig. 9), especially to the north of 20°N,                    level anticyclone is generated in the WNP, located near south-
representing lower SSTs in the ROM simulation, which is                       ern Japan, which strengthens the simulated WPSH and
associated with the enhanced atmosphere-ocean mixing from                     weakens the low-level westerlies related to the SASM in the

Fig. 8 Spatial distribution of the summer mean geopotential height at 500 hPa (contour, unit m) and the summer mean sea level pressure (SLP, shading,
unit hPa) derived from (a) ERA Interim, (b) NCEP II, (c) MERRA2, (d) ROM, and (e) REMO, averaged over the time period 1980–2012
Added value of the regionally coupled model ROM in the East Asian summer monsoon modeling

                                                                            applications of the air-sea coupling to the regional climate
                                                                            modeling over East Asia. With the aim of studying the added
                                                                            effects of regional atmosphere-ocean coupling, the standalone
                                                                            atmospheric model REMO is compared with the coupled
                                                                            model ROM in simulating the East Asian summer monsoon
                                                                            (EASM) for the time period 1980–2012. In the ROM simula-
                                                                            tion, the boundary layers of atmosphere (REMO) and ocean
                                                                            (MPIOM) interact by exchanging momentum, heat, and water
                                                                            fluxes through the OASIS3 coupler. The two models are eval-
                                                                            uated in terms of their ability to simulate the EASM, including
                                                                            the moisture transport, the atmospheric circulation, and the sea
                                                                            surface condition. The results are briefly summarized in
                                                                            Table 1 and elaborated as follows.

                                                                            1. Both the REMO and ROM simulations resemble the ob-
Fig. 9 Differences in the summer mean sea surface temperature (SST,            served pattern of summer precipitation over East Asia.
shading, unit °C) and sea level pressure (SLP, contour, unit hPa) between      The standalone REMO simulation is characterized by
the ROM and REMO simulations averaged over the time period 1980–               dry biases over the continent, but wet biases over the
2012                                                                           near-equatorial area from the Bay of Bengal to the western
                                                                               Pacific. With the atmosphere-ocean coupling, the ROM
ROM simulation. In addition, the lower SSTs simulated by the                   simulation represents summer precipitation well, especial-
ROM model reduce evaporation from the sea surface, leading                     ly over most of the continental area, but with significant
to a drier lower troposphere over the WNP (Fig. 6d).                           underestimations over the western North Pacific (WNP).
   The improvement in the large-scale atmospheric circula-                     The ROM model simulates the EASM intensity better
tions in the ROM simulation, particularly in the lower tropo-                  than the REMO model, with temporal correlation coeffi-
sphere, is triggered by air-sea flux exchanges between the                     cients between the W-F indices extracted from the model
atmospheric and ocean models and represents a better consis-                   results and observations higher by about 0.1, whereas the
tency with the atmospheric conditions (Cabos et al. 2017).                     REMO model tends to produce a stronger EASM.
However, the atmosphere-ocean feedback is absent in the                     2. In terms of the atmospheric circulation, the REMO and
REMO simulation. With the prescribed sea surface condi-                        ROM simulations mainly differ in the lower and mid tro-
tions, the heat and moisture are provided continuously to the                  posphere. REMO simulates stronger low-level westerlies
atmosphere, which induces relatively lower SLPs over the                       extending too far eastward, which is associated with the
WNP (Fig. 8e) in the REMO simulation.                                          South Asian summer monsoon (SASM) and leads to the
                                                                               convergence being shifted eastward to the WNP.
                                                                               Correspondingly, it produces a further eastward location
4 Conclusions and discussion                                                   of the western Pacific subtropical high (WPSH) at
                                                                               500 hPa, with its western edge shifted to almost 150°E.
Previous studies have emphasized added values of the                           By contrast, the low-level flow and its convergence are
atmosphere-ocean coupling in many cases of climate model-                      reasonably represented in the ROM simulation, as well as
ing. However, there has been only a limited number of                          the 500 hPa geopotential height pattern. Regarding the

Fig. 10 Time series of the annual
mean wind speed at 850 hPa
averaged over the subtropical
WNP (110°-145°E, 20°-32°N)
derived from the ROM (blue solid
line) and REMO (red solid line)
simulations for the time period
1980–2012
S. Zhu et al.
Summary of the EASM metrics used for evaluating the standalone regional climate model REMO and the regionally atmosphere-ocean coupled model ROM compared with the observational
WPSH location of the 5880 Wind flow at
Represented
Represented
low-level specific humidity (at 850 hPa), the REMO sim-
The SAH
200 hPa
ulation shows wet biases over most areas, which is in
contrast to the dry bias over the WNP in the ROM simu-
lation. Both models represent the South Asia High (SAH)
circulation in the upper troposphere (at 200 hPa) well,
Shifted east, with western
edge of about 150°E
20°-30°N, 135°-140°E
20°-30°N, 135°-140°E
with all the PCCs between the observations and the sim-
gpm line at 500 hPa
ulations greater than 0.99, passing the 0.01 significance
level. As a result, the pathways of the tropospheric verti-
cally integrated moisture fluxes, which are mainly domi-
nated by the low- to mid-tropospheric circulations and
water vapor flow conditions, indicate similar structures
to the wind flow patterns at 850 hPa in both the REMO
MERRA2
Temporal correlation coefficients of Flow convergence Pattern correlation coefficients of the
and ROM simulations. The simulated stronger precipita-
tion over the ocean and the weaker precipitation over the
0.95
0.97
East Asian continent from the standalone atmospheric
location at 850 hPa 500 hPa geopotential height
model REMO could be attributed to the joint influence
NCEP II
of the stronger low-level westerlies and the wetter lower
0.97
0.99
troposphere. By contrast, ROM reproduces the low-level
westerlies and the WPSH, which contributes to the repre-
ERA Interim
sentativeness on its modeling of the EASM.
3. With respect to the sea surface boundary layer, the ROM
0.97
0.98
simulations are characterized by lower SSTs than the
REMO results, which is due to mutual flux exchanges
between the atmosphere and ocean from the intensified
Observations ERA Interim CMAP GPCP MERRA2 ERA Interim NCEP II MERRA2 Approx. 120°E
Approx. 140°E
Approx. 120°E
low-level winds over the subtropical WNP in the coupled
model. As a consequence, an anomalous anticyclonic
SLP is generated over the WNP, resulting in a more real-
istic distribution of SLP compared with the REMO simu-
lation. The anomalous low-level anticyclone in the ROM
simulation strengthens the WPSH and weakens the
0.65
0.77
eastward-shifted low-level westerlies, improving the sim-
ulation of the low- and mid-level atmospheric circula-
0.65
0.77
tions. Moreover, ROM produces less evaporation over
the ocean due to the lower SSTs, inducing a drier low-
the W-F index
level troposphere than the REMO simulation. By contrast,
the higher SSTs in the REMO simulation with the pre-
0.65
0.76
scribed sea surface conditions lead to a stronger SASM-
associated low-level westerlies and an eastward shift of
the WPSH, as well as a too wet low-level troposphere.
Pattern correlation coefficients of the
0.59 0.60
0.55
Concerning the regional climate model REMO, it has been
0.67
shown that the model resolution greatly influences the simu-
lation results (Xu et al. 2018). The higher horizontal resolution
summer precipitation
0.55
0.63
could bring about additional fine-scale weather processes in
the REMO modeling over East Asia, particularly over areas
with complex terrains (Xu et al. 2019). However, the
standalone REMO model shows glaring deficiencies in simu-
0.70
0.73
lating the EASM circulation owing to the inconsistencies at
the air-sea interface, which need to be noted in climatology
studies using this regional climate model in the atmosphere-
datasets
Metrics
Table 1
REMO
only mode. Introducing atmosphere-ocean coupling effective-
ROM
ly enhances the consistent interaction between the atmosphereAdded value of the regionally coupled model ROM in the East Asian summer monsoon modeling
over East Asia and the WNP ocean via cooling of the sea Dee DP, Uppala SM, Simmons AJ et al (2011) The ERA-Interim reanal-
ysis: configuration and performance of the data assimilation system.
surface in the coupled ROM model, which, therefore, be-
Q J R Meteorol Soc 137:553–597
comes a more skillful tool to reproduce the EASM system. Fan Y, Fan K, Xu Z et al (2018) ENSO-South China Sea summer mon-
In fact, previous experiments have also revealed the effective soon interaction modulated by the Atlantic Multidecadal Oscillation
improvements in simulating the Asian monsoon system and J Climate 31:3061–3076
Fan Y, Fan K, Zhu X et al (2019) El Niño-related summer precipitation
its variability by regional air-sea coupling as a result of bias
anomalies in Southeast Asia modulated by the Atlantic Multidecadal
compensations (Singh et al. 2015; Zou and Zhou 2016; Yang Oscillation J Climate 32:7971–7987
et al. 2019). Enhancement of the air-sea interactions contrib- Ge F, Zhi X, Babar ZA et al (2017) Interannual variability of summer
utes to a substantially improved reproduction of the large- monsoon precipitation over the Indochina Peninsula in association
with ENSO. Theor Appl Climatol 128:523–531
scale climate characteristics in domains where atmospheric
Ge F, Zhu S, Peng T, et al. 2019. Risks of precipitation extremes over
and oceanic factors are highly relevant (Lin et al. 2019). Southeast Asia: does 1.5°C or 2°C global warming make a differ-
Further investigations on the dynamics with higher resolutions ence? Environ. Res. Lett. 14: 044015
in the atmosphere and ocean models are essential to better Gelaro R, McCarty W, Suárez MJ et al (2017) The modern-era retrospec-
tive analysis for research and applications, version 2 (MERRA-2). J
understand the regional processes and the large-scale drivers
Clim 30:5419–5454. https://doi.org/10.1175/JCLI-D-16-0758.1
of the regional climate. Gent PR, Willebrand J, McDougall TJ, et al. 1995. Parameterizing eddy-
induced tracer transports in ocean circulation models. J Phys
Acknowledgments The anonymous reviewers are thanked for their con- Oceanogr 25: 463–474. https://doi.org/10.1175/1520-0485(1995)
structive comments, which greatly improved this paper. We also thank Dr. 0252.0.CO;2
Xiuhua Zhu and Dr. Torsten Weber for their extensive advices. We are Griffies SM. 1998. The Gent-McWilliams skew flux. J Phys Oceanogr
grateful to ECMWF, NASA, and NOAA for access to their data products. 28: 831–841. https://doi.org/10.1175/1520-0485(1998)0282.0.CO;2
the German Climate Computing Center (DKRZ). Hagemann S, Dümenil L (1997) A parametrization of the lateral
waterflow for the global scale. Clim Dyn 14:17–31. https://doi.org/
Funding information The authors acknowledge the joint financial sup- 10.1007/s003820050205
port of the National Key R&D Program of China (Grant No. Hagemann S, Gates LD (2001) Validation of the hydrological cycle of
2017YFC1502002), the National Natural Science Foundation of China ECMWF and NCEP reanalyses using the MPI hydrological dis-
(Grant Nos 41575104 and 41805056), the Postgraduate Research & charge model. J Geophys Res 106:1503–1510. https://doi.org/10.
Practice Innovation Program of Jiangsu Province (Grant No. KYCX17_ 1029/2000JD900568
0875), the Scientific Research Foundation of CUIT (KYTZ201730), the Jacob D (2001) A note to the simulation of the annual and inter-annual
Project Supported by Scientific Research Fund of Sichuan Provincial variability of the water budget over the Baltic Sea drainage basin.
Education Department (18ZB0112), the Open Research Fund Program Meteorog Atmos Phys 77:61–73. https://doi.org/10.1007/
of KLME, NUIST (KLME201809), the PRIMAVERA project funded by s007030170017
the European Union’s Horizon 2020 program (Grant Agreement No. Jacob D, Elizalde A, Haensler A et al (2012) Assessing the transferability
641727), the state assignment of FASO Russia (Theme Nos 0149-2018- of the regional climate model REMO to different coordinated re-
0014 and 0149-2019-0015), and the China Scholarship Council (Nos gional climate downscaling experiment (CORDEX) regions.
201608320193 and 201808510009). Atmosphere. 3:181–199. https://doi.org/10.3390/atmos3010181
Jacob D, Van den Hurk B, Andrae U et al (2001) A comprehensive model
inter-comparison study investigating the water budget during the
BALTEX-PIDCAP period. Meteorog Atmos Phys 77:19–43.
References https://doi.org/10.1007/s007030170015
Jungclaus JH, Fischer N, Haak H et al (2013) Characteristics of the ocean
simulations in the Max Planck Institute Ocean Model (MPIOM) the
Adler RF, Huffman GJ, Chang A, et al. 2003. The version-2 global pre- ocean component of the MPI-Earth system model. J Adv Model
cipitation climatology project (GPCP) monthly precipitation analy- Earth Syst 5:422–446. https://doi.org/10.1002/jame.20023
sis (1979–present). J Hydrometeorol 4: 1147–1167. https://doi.org/ Kanamitsu M, Ebisuzaki W, Woollen J et al (2002) NCEP-DOE AMIP-II
10.1175/1525-7541(2003)0042.0.CO;2 reanalysis (R-2). Bull Am Meteorol Soc 83:1631–1643. https://doi.
Asselin R (1972) Frequency filter for time integrations. Mon Weather org/10.1175/bams-83-11-1631
Rev 100:487–490 Kumar P, Kotlarski S, Moseley C et al (2015) Response of Karakoram-
Cabos W, Sein DV, Pinto JG, Fink AH, Koldunov NV, Alvarez F, Himalayan glaciers to climate variability and climatic change: a
Izquierdo A, Keenlyside N, Jacob D (2017) The South regional climate model assessment. Geophys Res Lett 42:1818–
Atlantic anticyclone as a key player for the representation 1825. https://doi.org/10.1002/2015GL063392
of the tropical Atlantic climate in coupled climate models. Kumar P, Podzun R, Hagemann S et al (2014) Impact of modified soil
Clim Dyn 48:4051–4069. https://doi.org/10.1007/s00382-016- thermal characteristic on the simulated monsoon climate over South
3319-9 Asia. J Earth Syst Sci 123:151–160. https://doi.org/10.1007/s12040-
Cai D, You Q, Fraedrich K et al (2017) Spatiotemporal temperature var- 013-0381-0
iability over the Tibetan Plateau: altitudinal dependence associated Lee DK, Suh MS (2000) Ten-year east Asian summer monsoon simula-
with the global warming hiatus. J Clim 30:969–984. https://doi.org/ tion using a regional climate model (RegCM2). J Geophys Res 105:
10.1175/JCLI-D-16-0343.1 29565–29577. https://doi.org/10.1029/2000JD900438
Cha D, Jin C, Moon J et al (2016) Improvement of regional climate Lin R, Zheng F, Dong X (2019) The climatology and interannual vari-
simulation of East Asian summer monsoon by coupled air-sea inter- ability of the East Asian summer monsoon simulated by a weakly
action and large-scale nudging. Int J Climatol 36:334–345. https:// coupled data assimilation system. Atmospheric and Oceanic Science
doi.org/10.1002/joc.4349 Letters 12:140–146S. Zhu et al.
Liu B, Wu G, Mao J et al (2013) Genesis of the South Asian high and its Song F, Zhou T (2014) The climatology and interannual variability of
impact on the Asian summer monsoon onset. J Clim 26:2976–2991. East Asian summer monsoon in CMIP5 coupled models: does air-
https://doi.org/10.1175/JCLI-D-12-00286.1 sea coupling improve the simulations? J Clim 27:8761–8777.
Lucas-Picher P, Christensen JH, Saeed F et al (2011) Can regional climate https://doi.org/10.1175/JCLI-D-14-00396.1
models represent the Indian monsoon? J Hydrometeorol 12:849– Steele M, Morley R, Ermold W (2001) PHC: a global ocean hydrography
868. https://doi.org/10.1175/2011jhm1327.1 with a high-quality Arctic Ocean. J Clim 14:2079–2087
Ludwig P, Pinto JG, Raible CC et al (2017) Impacts of surface boundary Uppala SM, Kållberg PW, Simmons AJ et al (2005) The ERA-40 re-
conditions on regional climate model simulations of European cli- analysis. Q J R Meteorol Soc 131:2961–3012. https://doi.org/10.
mate during the last glacial maximum. Geophys Res Lett 44:5086– 1256/qj.04.176
5095. https://doi.org/10.1002/2017GL073622 Valcke S, Caubel A, Declat D et al (2003) Oasis3 ocean atmosphere sea
Majewski D. 1991. The EUROPA-model of the Deutscher Wetterdienst. ice soil user’s guide. CERFACS, Toulouse
Proc. Seminar on Numerical Methods in Atmospheric Models. Vondou DA, Haensler A (2017) Evaluation of simulations with the re-
Reading, United Kingdom, ECMWF, 147–191 gional climate model REMO over Central Africa and the effect of
Marsland SJ, Haak H, Jungclaus JH, et al. 2003. The Max-Planck- increased spatial resolution. Int J Climatol 37:741–760. https://doi.
Institute global ocean/sea ice model with orthogonal curvilinear co- org/10.1002/joc.5035
ordinates. Ocean Model 5: 91–127. https://doi.org/10.1016/S1463- Wang B, Ding Q, Fu X et al (2005) Fundamental challenge in simulation
5003(02)00015-X and prediction of summer monsoon rainfall. Geophys Res Lett 32:
Ngo-Duc T, Tangang FT, Santisirisomboon J et al (2017) Performance L15711. https://doi.org/10.1029/2005GL022734
evaluation of RegCM4 in simulating extreme rainfall and tempera- Wang B, Fan Z. 1999. Choice of South Asian summer monsoon indices.
ture indices over the CORDEX - Southeast Asia region. Int J Bull Am Meteorol Soc 80: 629–638. https://doi.org/10.1175/1520-
Climatol 37:1634–1647. https://doi.org/10.1002/joc.4803 0477(1999)0802.0.CO;2
Niederdrenk AL, Sein DV, Mikolajewicz U (2016) Interannual variability Wang D, Liu Q, Huang RX et al (2006) Interannual variability of the
of the Arctic freshwater cycle in the second half of the twentieth South China Sea throughflow inferred from wind data and an ocean
century in a regionally coupled climate model. Clim Dyn 47:3883– data assimilation product. Geophys Res Lett 33:L14605. https://doi.
3900. https://doi.org/10.1007/s00382-016-3047-1 org/10.1029/2006GL026316
Ninomiya K (1999) Moisture balance over China and the South China
Webster PJ, Yang S (1992) Monsoon and ENSO: selectively interactive
Sea during the summer monsoon in 1991 in relation to the intense systems. Q J R Meteorol Soc 118:877–926. https://doi.org/10.1002/
rainfalls over China. J Meteor Soc Japan 77:737–751. https://doi. qj.49711850705
org/10.2151/jmsj1965.77.3_737
Xie P, Arkin PA. 1997. Global precipitation: a 17-year monthly analysis
Paeth H, Born K, Girmes R et al (2009) Regional climate change in
based on gauge observations, satellite estimates, and numerical
tropical and northern Africa due to greenhouse forcing and land
model outputs. Bull Am Meteorol Soc 78: 2539–2558. https://doi.
use changes. J Clim 22:114–132. https://doi.org/10.1175/
org/10.1175/1520-0477(1997)0782.0.CO;2
2008jcli2390.1
Xu J, Koldunov N, Remedio ARC et al (2018) On the role of horizontal
Paeth H, Müller M, Mannig B (2015) Global versus local effects on
resolution over the Tibetan Plateau in the REMO regional climate
climate change in Asia. Clim Dyn 45:2151–2164. https://doi.org/
model. Clim Dyn 51:4525–4542
10.1007/s00382-014-2463-3
Pinto JG, Gomara I, Masato G et al (2014) Large-scale dynamics associ- Xu J, Koldunov N, Remedio ARC et al (2019) Downstream effect of
ated with clustering of extratropical cyclones affecting Western Hengduan Mountains on East China in the REMO regional climate
Europe. J Geophys Res 119:13704–13719. https://doi.org/10.1002/ model. Theor Appl Climatol 135:1641–1658
2014JD022305 Xue F, Zeng Q, Huang R, Li C, Lu R, Zhou T (2015) Recent advances in
Roeckner E, Arpe K, Bengtsson L, et al. 1996. The atmospheric general monsoon studies in China. Adv Atmos Sci 32:206–229. https://doi.
circulation model ECHAM-4: model description and simulation of org/10.1007/s00376-014-0015-8
present-day-climate. Rep. 218. MPI für Meteorol. Hamburg, Yang B, Zhang Y, Qian Y, et al. 2019. Better monsoon precipitation in
Germany coupled climate models due to bias compensation. npj Clim Atmos
Roeckner E, Baeuml G, Bonaventura L, et al. 2003. The atmospheric Sci 2: 43
general circulation model ECHAM 5. PART I: model description. Yang H, Zhi X, Gao J et al (2011) Variation of East Asian summer
Rep. 349. MPI für Meteorol. Hamburg, Germany monsoon and its relationship with precipitation of China in recent
Sein DV, Koldunov NV, Pinto JG et al (2014) Sensitivity of simulated 111 years. Agricultural Science & Technology 12:1711–1716.
regional Arctic climate to the choice of coupled model domain. https://doi.org/10.16175/j.cnki.1009-4229.2011.11.012
Tellus A. https://doi.org/10.3402/tellusa.v66.23966 Zhang L, Fraedrich K, Zhu X et al (2015a) Interannual variability of
Sein DV, Mikolajewicz U, Gröger M et al (2015) Regionally coupled winter precipitation in Southeast China. Theor Appl Climatol 119:
atmosphere-ocean-sea ice-marine biogeochemistry model ROM: 1. 229–238
Description and validation. J Adv Model Earth Syst 7:268–304. Zhang L, Sielmann F, Fraedrich K et al (2015b) Variability of winter
https://doi.org/10.1002/2014MS000357 extreme precipitation in Southeast China: contributions of SST
Simmons AJ, Burridge DM (1981) An energy and angular-momentum anomalies. Clim Dyn 45:2557–2570
conserving vertical finite-difference scheme and hybrid vertical co- Zhu Q, He J, Wang P (1986) A study of circulation differences between
ordinates. Mon Weather Rev 109:758–766 East-Asian and Indian summer monsoons with their interaction.
Singh UK, Singh GP, Singh V (2015) Simulation skill of APCC set of Adv Atmos Sci 3:466–477. https://doi.org/10.1007/BF02657936
global climate models for Asian summer monsoon rainfall variabil- Zhu S, Ge F, Fan Y et al (2020) Conspicuous temperature extremes over
ity. Theor Appl Climatol 120:109–122. https://doi.org/10.1007/ Southeast Asia: seasonal variations under 1.5 °C and 2 °C global
s00704-014-1155-6 warming. Clim Change:1–18. https://doi.org/10.1007/s10584-019-
Solman SA, Sanchez E, Samuelsson P et al (2013) Evaluation of an 02640-1
ensemble of regional climate model simulations over South Zou L, Zhou T (2013) Can a regional ocean-atmosphere coupled model
America driven by the ERA-Interim reanalysis: model performance improve the simulation of the interannual variability of the western
and uncertainties. Clim Dyn 41:1139–1157. https://doi.org/10.1007/ North Pacific summer monsoon? J Clim 26:2353–2367. https://doi.
s00382-013-1667-2 org/10.1175/jcli-d-11-00722.1Added value of the regionally coupled model ROM in the East Asian summer monsoon modeling
Zou L, Zhou T (2016) Future summer precipitation changes over Zu T, Xue H, Wang D, Geng B, Zeng L, Liu Q, Chen J, He Y (2019)
CORDEX-East Asia domain downscaled by a regional ocean- Interannual variation of the South China Sea circulation during win-
atmosphere coupled model: a comparison to the stand-alone RCM. ter: intensified in the southern basin. Clim Dyn 52:1917–1933.
J Geophys Res 121:2691–2704. https://doi.org/10.1002/ https://doi.org/10.1007/s00382-018-4230-3
2015JD024519
Zou L, Zhou T, Peng D (2016) Dynamical downscaling of historical Publisher’s note Springer Nature remains neutral with regard to jurisdic-
climate over CORDEX East Asia domain: a comparison of regional tional claims in published maps and institutional affiliations.
ocean-atmosphere coupled model to stand-alone RCM simulations.
J Geophys Res 121:1442–1458. https://doi.org/10.1002/
2015jd023912You can also read


