Structure of Online Dating Markets in U.S. Cities - Sociological Science
←
→
Page content transcription
If your browser does not render page correctly, please read the page content below
Structure of Online Dating Markets in U.S. Cities
                                     Elizabeth E. Bruch and M. E. J. Newman
                                     University of Michigan

                                        Abstract: We study the structure of heterosexual dating markets in the United States through an
                                        analysis of the interactions of several million users of a large online dating website, applying recently
                                        developed network analysis methods to the pattern of messages exchanged among users. Our
                                        analysis shows that the strongest driver of romantic interaction at the national level is simple
                                        geographic proximity, but at the local level, other demographic factors come into play. We find that
                                        dating markets in each city are partitioned into submarkets along lines of age and ethnicity. Sex ratio
                                        varies widely between submarkets, with younger submarkets having more men and fewer women
                                        than older ones. There is also a noticeable tendency for minorities, especially women, to be younger
                                        than the average in older submarkets, and our analysis reveals how this kind of racial stratification
                                        arises through the messaging decisions of both men and women. Our study illustrates how network
                                        techniques applied to online interactions can reveal the aggregate effects of individual behavior on
                                        social structure.
                                        Keywords: networks; markets; computational social science; online dating

                                                    of romantic and sexual partnerships—who pairs with whom—have
                                     P    ATTERNS
                                           broad implications for health and society. For example, the level of assortative
                                     mating (the extent to which like pairs with like) has long been considered an
                                     indicator of societal openness (Glass 1954; Kalmijn 1991). Mating patterns also
                                     determine how wealth and resources are passed from one generation to another
                                     (Schwartz 2010; Breen and Salazar 2013), have implications for mental and physical
                                     health (Waldron, Hughes, and Brooks 1996; Smith and Christakis 2008), and shape
                                     sexual networks that drive the spread of sexually transmitted infections (Morris
Citation: Bruch, Elizabeth E.,       and Kretzschmar 1995; Liljeros et al. 2001).
and M. E. J. Newman. 2019.               There exists an extensive empirical and theoretical literature exploring the
“Structure of Online Dating Mar-
kets in U.S. Cities.” Sociological   mechanisms behind patterns of romantic pairing (Kalmijn 1998; Schwartz 2013). In
Science 6: 219-234.                  societies where people choose their own mates, it is widely accepted that romantic
Received: February 13, 2019          pairing is driven by the interplay between individuals’ preferences for partners and
Accepted: February 28, 2019          the composition of the pool of potential mates (Becker 1973; Mare 1991; Xie, Cheng,
Published: April 2, 2019             and Zhou 2015). The process can be modeled game theoretically as a market in
Editor(s): Jesper Sørensen, Olav
Sorenson
                                     which individuals aim to find the best match they can subject to the preferences of
DOI: 10.15195/v6.a9
                                     others (Gale and Shapley 1962; Roth and Sotomayor 1992). There is also a large body
Copyright: c 2019 The Au-            of empirical work that documents the relationship between observed partnering
thor(s). This open-access article    patterns and the supply of partners as reflected in the population composition of
has been published under a Cre-
                                     cities, regions, or countries (Blau, Blum, and Schwartz 1982; Lichter, LeClere, and
ative Commons Attribution Li-
cense, which allows unrestricted     McLaughlin 1991; South and Lloyd 1992a,b; Lichter, Anderson, and Hayward 1995;
use, distribution and reproduc-      Angrist 2002; Blossfeld and Timm 2003; Guzzo 2006; Harknett 2008; Trent and South
tion, in any form, as long as the
original author and source have      2011).
been credited. c b

                                                                         219
Bruch and Newman Online Dating Markets in U.S. Cities
These studies are limited, however, in what they can reveal about the structure
of dating or marriage markets. One issue is that we typically do not have access to
the actual population of available dating partners and must instead make do with
proxies such as census data, obliging us to treat entire towns or cities as a single
undifferentiated market. A more fundamental problem is that previous studies
have only looked at extant partnerships and not the larger set of all courtship
interactions among mate-seeking individuals. In order to properly study dating
markets, one needs data on all courtship overtures that occur within the focal
population: not only those that are successful and result in a partnership but also
those that are rejected. As we show in this article, the complete set of such overtures
forms a connected network whose structure can be analyzed to reveal key features
of romantic markets.
Unfortunately, complete data on courtship interactions have been historically
hard to come by because unrequited overtures are rarely documented. The few
empirical studies that have directly observed courtship patterns have tended to
focus narrowly on specific institutions, subpopulations, or geographic locations
(Sprecher et al. 1984; Laumann et al. 2004), and relatively little is known about the
empirical structure of romantic and sexual markets across the general population
or how this structure varies from one locale to another.
The advent of online dating and its spectacular rise in popularity over the
last two decades has, however, created a new opportunity to study courtship
behaviors in unprecedented detail (Rosenfeld and Thomas 2012). Here we report on
a quantitative study of the structure of adult romantic relationship markets in the
United States using nationwide data on online-dating users and their behaviors. We
combine activity data for millions of participants with recently developed network
analysis methods to shed light on the features of relationship markets at the largest
scales. There have been recent studies using early-stage patterns of online mate
choice—who browses, contacts, or responds to whom—to shed light on individuals’
preferences for mates (Hitsch, Hortaçsu, and Ariely 2010; Lewis 2013; Lin and
Lundquist 2013; Bruch, Feinberg, and Lee 2016), but the work presented here goes
beyond these studies to examine how individuals’ choices aggregate collectively to
create structured relationship markets that strongly influence individuals’ dating
experiences.
The data we analyze come from a popular US dating website with more than
4 million active users at the time of our study. Our analysis focuses on all (self-
identified) heterosexual, single men and women who sent or received at least one
message on the site during the period of observation—January 1, 2014, to January
31, 2014—and who indicated that they were pursuing some form of romantic
relationship (long-term dating, short-term dating, and/or sex). For each user, we
have a range of self-reported personal characteristics along with time-stamped
records of all messages exchanged on the site. It is the latter that are the primary
focus of our analysis because it is the messaging patterns that reveal the aggregate
demand for individuals within the market.
We quantify messaging patterns using methods of network analysis (Newman
2018). We examine the set of all reciprocal interactions between opposite-sex users,
meaning pairs of individuals between whom at least one message was sent in each
sociological science | www.sociologicalscience.com 220 April 2019 | Volume 6Bruch and Newman Online Dating Markets in U.S. Cities
direction in the pair. Reciprocal interactions we take to be a signal of a baseline
level of mutual interest between potential dating partners. Our primary focus is on
understanding the division of the online-dating population into distinct submarkets:
How does the market divide into subpopulations of daters, and how are those
subpopulations characterized? We define submarkets as roughly self-contained
groups of individuals within the network such that most reciprocal exchange of
messages occurs within groups. This corresponds closely to the established concept
of “community structure” in network theory, a community in this context being a
tightly knit subgroup of individuals within a larger network. A number of sensitive
techniques for the detection of network communities have been developed in
recent years, and we employ a selection of those techniques here (Fortunato 2010).
Technical details of the algorithmic methods used in our calculations are given in
the supplementary materials.
Dating Markets Are Divided into Distinct
Geographic Regions
For our first analysis, we examine community structure within the entire data set of
all users of the website during the month of observation. A total of 15,302,512 recip-
rocal interactions took place during this period. We aggregate these interactions at
the level of 3-digit zip codes—geographic regions used by the US Post Office—and
count the number of interactions that take place between every pair of 3-digit zip
codes. For instance, there were 75,686 reciprocal interactions between individuals
in Manhattan and individuals in neighboring Brooklyn but only 2170 interactions
between individuals in Manhattan and individuals in far-away San Francisco.
The result of this aggregation is a weighted network in which the nodes rep-
resent 3-digit zip code regions, and the weighted edges represent the number of
interactions. We take this network and perform a standard community detection
analysis on it using the modularity maximization method (see the supplementary
materials and references [Blondel et al. 2004; Newman 2004]). The results for the
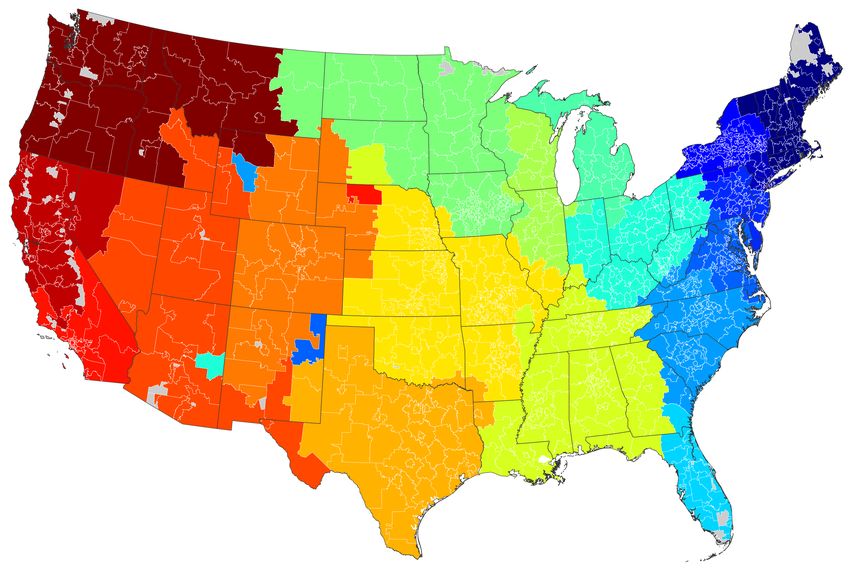
lower 48 states are shown in map form in Figure 1.
As the figure shows, the communities found in this nationwide network of
messaging are tightly geographically circumscribed. Many of them appear to corre-
spond to commonly accepted geographic divisions of the country: New England,
the East Coast, the South, Texas, the Mountain West, Northern and Southern Cal-
ifornia, and so forth. In essence, it says that most people are interested in others
who are in their own region of the country, which is reasonable. Few people living
in New York will exchange messages with people in California if the primary goal
is to arrange a face-to-face meeting with a possible romantic partner. This finding
is consistent with recent work looking at friendship communities using Facebook
data, which finds that incidence of friendship is strongly decreasing in geographic
distance (Bailey et al. 2018).1
Community structure in the broad, nationwide network of messaging thus
appears to be dominated by geographic effects. Because our primary goal here is to
observe and analyze more subtle demographic effects within dating markets, we
sociological science | www.sociologicalscience.com 221 April 2019 | Volume 6Bruch and Newman Online Dating Markets in U.S. Cities
Figure 1: Division of the messaging network for the lower 48 states into 19 communities by modularity
maximization using the Louvain algorithm (Blondel et al. 2004). Colors represent communities at the level of
3-digit zip codes. Gray regions are areas with no assigned zip code.
need to factor out the gross influence of geography. Our approach for doing this is
a simple one: We focus on subnetworks within individual cities. We choose cities as
our basic unit of analysis because they are large enough to provide a population
of significant size and at the same time small enough that travel distance between
individuals will not be a deterrent to interaction. In the sections that follow, we
perform a series of analyses on subsets of the data corresponding to four large
cities: New York, Boston, Chicago, and Seattle. We define cities using the standard
core-based statistical areas (CBSAs) for the corresponding metropolitan regions,
except for New York, where the CBSA is large enough that there are clearly separate
dating markets within it. For New York, therefore, we define our area of study more
narrowly to be the five boroughs of Manhattan, the Bronx, Queens, Brooklyn, and
Staten Island.
One can look at the analysis of Figure 1 as providing some justification for
previous studies that focused on demographics within geographically localized
communities. Although some mate pursuit does take place at longer distances,
behaviors are substantially curtailed by geography, and demographic patterns
of interest can be seen most clearly in smaller markets. Most prior studies do
have the drawback of considering only the population as whole, however, and not
specifically the population of mate seekers and of lacking, in most cases, direct data
on dating and courtship interactions.
Dating Markets Are Demographically Stratified
within Cities
We now turn our attention to the structure of dating markets within our four cities
of New York, Boston, Chicago, and Seattle and particularly to community struc-
sociological science | www.sociologicalscience.com 222 April 2019 | Volume 6Bruch and Newman Online Dating Markets in U.S. Cities
ture at the level of individual participants within these markets. The community
structure in this case is more complex than the simple geographic effects we saw in
Figure 1. Specifically, it displays a mix of so-called assortative and disassortative
mixing (Newman 2003). For the heterosexual dating communities studied here,
it is disassortative by gender, meaning most messages are between individuals
of opposite sex, but assortative by various other characteristics, as we will see. It
is the latter behavior on which we primarily focus, but our community detection
calculations need to be sensitive to both in order to fully reveal the structure of
the market. Here we make use of a powerful and flexible community detection
method based on maximum-likelihood techniques, the expectation-maximization
(EM) algorithm, and belief propagation (Decelle et al. 2011; Karrer and Newman
2011), which can sensitively and rapidly detect complex forms of structure in large
networks. For details, see the supplementary materials.
Focusing again on networks of two-way message exchanges, we present in the
following analyses the results of community divisions of each city network into
four separate communities or submarkets (eight if you count men and women
separately). We find that about 75 percent of all reciprocal interactions in our
four cities are between individuals within the same submarket, indicating that
the communities align well with the conventional definition: tightly knit groups
with most interaction going on within groups. The choice to divide into four
submarkets is to some extent arbitrary. We have repeated the analysis for other
numbers of submarkets and find essentially similar patterns to those reported here
(see the supplementary materials). The choice of four submarkets offers a good
compromise between resolution of finer details and adequate statistical power
within submarkets.
Figure 2 shows a variety of demographic features of the submarkets in the four
cities. The most obvious defining feature of the submarkets is the age of their
members, shown in Figure 2A. The youngest submarket, numbered 1 in each city,
corresponds primarily to individuals in their early 20s, whereas submarkets 2 to 4
correspond to those in their upper 20s, 30s, and 40s and above, respectively. This
pattern is consistent, with only minor variation, across the four cities. As the figure
shows, there is a small but systematic difference in age between men and women
across all submarkets: In every case, the men are older than the women, with a
median age difference of 1 year and 7 months.
However, submarkets are not characterized by age alone. As Figure 2B shows,
they also differ in male-to-female ratio, and here we see another consistent pattern:
The younger submarkets tend to be male heavy, but the mix becomes progressively
more female heavy in the older submarkets. There are a number of factors that may
drive this pattern. Women’s first marriages are at a younger age on average than
men’s (Qian and Preston 1993; Finer and Philbin 2014), which takes more women
than men out of younger dating markets. Furthermore, because partnering of
younger women with older men is more common than the reverse (Hernan, Berardo,
and Berardo 1985; Hitsch et al. 2010), some older men may seek out younger
partners, swelling the ranks of men in the younger submarkets. Conversely, some
younger women may leave the youngest submarkets in search of older partners,
depleting the supply of women. (This would also help explain the higher average
sociological science | www.sociologicalscience.com 223 April 2019 | Volume 6Bruch and Newman Online Dating Markets in U.S. Cities
New York Boston Chicago Seattle
A 60
Age
40
20
70 Women
B
% of women/men
Men
50
30 All 1234 All 1234 All 12 3 4 All 1234
C
0
Age difference
-2
-4
Asian
-6 Black
Hispanic
-8
1 2 3 4 1 2 3 4 1 2 3 4 1 2 3 4
Submarket
Figure 2: (A) Distribution of ages of men and women in each submarket in each of the four cities studied.
Boxes indicate the 25th, 50th, and 75th percentiles; whiskers indicate the ninth and 91st percentiles. (B)
Percentage of men and women in each submarket, and overall, for each city. (C) Average age of minority
women in each submarket by ethnicity, measured relative to average age of white women in the same
submarket. Units of analysis are users.
age of men in each submarket.) The same behaviors also reduce the number of men
in the older submarkets and increase the number of women. Depending on the
overall population balance of the city, the end result can be a severe distortion of
the sex ratio at the oldest or youngest ages. The youngest submarkets in Chicago
and Seattle, for example, have almost two men for every woman.
An additional facet of the submarket structure, one that affects predominantly
women, comes to light when we look at the balance of ethnicities. Figure 2C shows
the mean age of minority women in each submarket broken down by ethnicity
and measured, in this case, relative to the mean age of white women in the same
submarket. The plot demonstrates a systematic tendency for minority women to
be younger than their white counterparts within the same submarket. The effect
is small in the younger submarkets but becomes more pronounced in the older
sociological science | www.sociologicalscience.com 224 April 2019 | Volume 6Bruch and Newman Online Dating Markets in U.S. Cities
ones. This is partly due to the fact that there are fewer black women than white
women among the oldest users of the site (supplemental materials, Figure S4), but
these compositional effects are not large enough to account for the pronounced
age difference seen in Figure 2C. Studies of mate preferences of online daters
have shown that black women are on average viewed by heterosexual men as less
desirable partners than nonblack women (Fisman et al. 2008; Hitsch et al. 2010;
Robnett and Feliciano 2011; Lin and Lundquist 2013), and the behavior seen in
Figure 2C may reflect the aggregate outcome of such preferences at the submarket
level. In Chicago’s oldest submarket, for instance, black women are more than
eight years younger on average than white women, suggesting that men in that
submarket are exchanging messages with black women who are substantially
younger than the white women they exchange messages with.2
Dating Markets Reflect the Aggregated Choices
of Individuals
Next we examine how the choices of men and women about whom to message differ
across submarkets and by gender. Because men send more than 80 percent of first
messages on the site, we focus on men’s first messages and women’s replies. Figure
3 shows the difference between the ages of men and the women they message,
by submarket and race, in Chicago and New York, in the form of “heat maps.”
(Similar figures for Boston and Seattle are shown in the supplementary materials.)
The rows labeled “1st messages” show age difference in first messages, and the
rows labeled “Replies” show the age difference in replies, with brighter colors
corresponding to larger age differences. We see that in both Chicago and New York,
the age differences between men and the women they message are approximately
two to three times larger in the oldest submarket than in the youngest. This is
consistent with previous work showing that men’s preferences for partners become
more pronounced as they age (Skopek, Schmitz, and Blossfeld 2011).
Figure 3 also sheds light on the behavioral mechanisms driving the racial stratifi-
cation patterns we observed in Figure 2C. The top two rows of the figure for Chicago
reveal that white men in older submarkets pursue minority women who are on
average two or more years younger than the white women they message. This is
especially pronounced in submarket 4, where the average age gap between white
men and the minority women they write to is around five to six years compared
to two years for white women. However, minority women tend not to reciprocate
overtures from older white men, which is why the age gap in replies among minor-
ity and white women is not as pronounced. The one exception is for black women
in Chicago: The average age gap in messages between these women and the white
men they respond to is around 5.8 years. Thus, it is both how men pick the women
they message and how women reply that drive the racial stratification we saw in
Figure 2.
In New York, the messaging patterns look somewhat different from Chicago
because New York men, despite being of similar age to their Chicago counterparts,
pursue younger women on average. Black men in the oldest New York submarket
sociological science | www.sociologicalscience.com 225 April 2019 | Volume 6Bruch and Newman Online Dating Markets in U.S. Cities
Submarket
1 2 3 4
A
1st messages
6
B
H
W 5
Chicago
A
B
Replies
4
Age difference (years)
H
W
3
A
1st messages
B
H 2
New York
W
A 1
B
Replies
H
0
W
A B H W A B H W A B H W A B H W
Figure 3: Mean difference in years between the age of men of varying races and the women they message in
Chicago and New York by race of women and submarket. Race is coded as follows: A = Asian, B = Black, H
= Hispanic, and W = White. The first two rows show the average age difference for all initial messages sent
in Chicago and those that received a reply, respectively; and the bottom two rows show the same patterns
for New York. In both cities, the age gap between men and their potential mates increases (lighter colors)
as we move from younger to older submarkets. In addition, we see that black and white men in the oldest
New York submarket pursue younger women, on average, than black and white men in the oldest Chicago
submarket. However, unlike in Chicago, only Asian women are pursued by older black men in New York at
substantially younger ages than their non-Asian counterparts. White men in the oldest submarket pursue
both Asian and black women at younger ages compared to Hispanic and white women.
write to women who are on average 4.5 years younger than they are, whereas for
white men, the corresponding figure is 6.2 years. And although older white men
in New York message younger black and Asian women than white women, the
differences are slight: Women of all races in New York’s submarket 4 are being
pursued at younger ages, so the racial difference is more attenuated. In other
words, it’s not that black women in New York’s oldest submarket receive messages
from younger men than black women in Chicago’s oldest submarket (i.e., men
closer to their own age) but that white women in New York’s oldest submarket
receive messages from older men than white women in Chicago’s oldest submarket.
Overall, we see that men’s and women’s choices about who to message and respond
to shape submarket structure differently in the two cities.
Additional features of interest in the submarket structure are revealed by an
examination of messaging patterns within and between submarkets. For this
analysis, we focus on initial contacts between individuals and on whether those
contacts receive a reply. Across all submarkets and cities, we find that 57 percent of
sociological science | www.sociologicalscience.com 226 April 2019 | Volume 6Bruch and Newman Online Dating Markets in U.S. Cities
Figure 4: Fractions of messages sent, and fraction that receive a reply, for messages from men to women (top
two rows) and women to men (bottom two rows) in each of the four cities studied. Brighter colors indicate
larger numbers of messages.
first contacts are between users in the same submarket. The remaining 43 percent
are between users in different submarkets, and the pattern of within- and between-
group messages, depicted in Figure 4, shows a number of interesting regularities.
The first and third rows of the figure show data for initial contacts made by men and
women, respectively. The bright squares down the diagonal of each matrix represent
the large fraction of within-group contacts. The darker squares off the diagonal show
that users are sending a modest number of messages to the submarkets immediately
older and younger than their own but very few messages to submarkets two or
more steps away. One deviation from this pattern is visible in the messages sent by
men in submarket 3 (the 30-somethings). Across all four of our cities, this group
is the only one whose members send a majority of their messages to women in
different submarkets from their own, the largest number going to women in the
next youngest submarket, submarket 2 (mid-to-late 20s).
The second and fourth rows of Figure 4 give the fraction of first messages that
receive a reply—establishing a possible reciprocal interest between the individuals
in question. Women’s replies to messages sent by men (second row) occur at a
substantially lower rate than men’s replies to women (fourth row), which is likely a
volume effect: Because women receive four times as many first messages as men,
they can afford to be more selective in their replies. Again, across all cities and
among both men and women, reply rates are highest within submarkets. Women
receive replies more often when initiating contact with men in older submarkets
sociological science | www.sociologicalscience.com 227 April 2019 | Volume 6Bruch and Newman Online Dating Markets in U.S. Cities
compared to younger ones (which is consistent with prior studies), although there
are some exceptions. Notice, for instance, that in all cities, women in the oldest sub-
market (submarket 4) are—surprisingly—more likely to receive a reply from men in
the youngest submarket (submarket 1) than in the second youngest (submarket 2).
Discussion
The experience of mate selection is frequently described, both in popular discourse
and the scientific literature, in the language of markets: An individual’s goal is
to secure the best possible mate for themselves in the face of competition from
others. However, we know little about the structure of these romantic markets in
part for lack of appropriately detailed data. The advent and vigorous growth of the
online dating industry in the last two decades provides a new source of data about
courtship interactions on an unprecedented scale.
In this study, we have provided a first look at how network analysis techniques
can reveal the structure of U.S. dating markets as evidenced by interactions on a
popular dating website. Across the United States as a whole, we find that geography
is the defining feature of national dating markets. Within cities, submarkets are de-
fined by age as well as other demographic factors—most notably, race. We find that
submarket structure is shaped by both first-messaging patterns and replies. Three-
quarters of all reciprocated messages fall within submarkets, and only one-quarter
fall between individuals in different submarkets. A larger fraction, about 43 percent,
of all first messages are between different submarkets, which indicates that people
do attempt to contact partners outside of their submarkets, but those attempts are
often unsuccessful. Overall, our results reveal the aggregate implications of individ-
uals’ mate choices and suggest that metropolitan areas are best characterized as a
collection of geographically integrated but demographically distinct submarkets.
More generally, our study illustrates how state-of-the-art network science tech-
niques can be applied to rich data from online interactions or administrative records
to reveal subtle features of social structure. In recent years, the growing availability
of search data from online sources has led to interest in how individuals’ choices
reveal submarkets in other social domains (Piazzesi, Schneider, and Stroebel 2015;
Rae 2015). As we have shown in the dating context, market outcomes reflect the
choices made by actors on both sides (e.g., men and women in heterosexual dating
markets, workers and firms in job markets). Our approach could straightforwardly
be extended to look at structural features of housing or job markets, and we view
this as a fruitful direction for future work.
Materials and Methods
Data
The data used as the starting point for our study come from one of the largest
free dating sites in the United States and were collected in July 2014. The site
does not market itself to any particular demographic group and attracts a diverse
population of users whose makeup, in most locales, corresponds loosely to that of
sociological science | www.sociologicalscience.com 228 April 2019 | Volume 6Bruch and Newman Online Dating Markets in U.S. Cities
the general population. The site is known for its user-driven matching algorithm,
which reduces the effect of site interference on users’ mate-choice behavior. The
population of users is concentrated in coastal areas, although there are significant
numbers of users in major Midwestern cities, such as Chicago. We restrict our
analysis to active users, which we define to mean that they sent or received at least
one message on the site during the observation period, which was January 1, 2014,
to January 31, 2014. This eliminates a significant number of users who sign up and
use the site but then become inactive or who sign up and never use it. We also
remove from the data all users who identify as gay or bisexual (about 14 percent of
the overall user base of the site) and those who indicate that they are not looking
for romantic relationships. (People can indicate, for example, that they are only
looking for friendship or activity partners.)
Community Detection
The primary technical tool employed in our analysis is community detection (Fortu-
nato 2010), which takes a network of nodes and the connections, or edges, between
them—users and messages in the present context—and divides it into tightly knit
groups such that most edges fall within groups and few fall between. The most
widely used method for community detection is modularity maximization (New-
man 2004; Fortunato 2010), which makes use of the standard quality function known
as modularity (Newman and Girvan 2004). This function, defined as the fraction of
edges within groups minus the expected fraction of such edges if edges are placed
at random, is large and positive for divisions of a network into good communities
and small for poor divisions. Modularity maximization finds good communities by
looking for the division with the largest modularity score. In our analysis of the
complete, nationwide network of messages between active users, Figure 1, we make
use of modularity maximization on the weighted network of conversations between
users in different 3-digit zip codes. There are a range of practical methods for per-
forming the maximization itself. In our calculations, we use the Louvain algorithm
of Blondel et al. (2004), which is an iterative greedy algorithm that has been shown
to give high-quality results with short run times (Yang, Algesheimer, and Tessone
2016). We use the implementation from the Gephi network analysis package, with
the resolution parameter equal to 0.65, which results in the 19-community division
shown in Figure 1.
Though it is fast and gives good results, modularity maximization is not ideal
for the community analysis of our individual city networks. This is because, as
explained, these networks contain both assortative and disassortative structure.
Modularity maximization is normally capable only of detecting assortative structure.
For this part of our analysis, therefore, we use an alternative community detection
method based on the maximum-likelihood fitting of a generative, community-
structured network model: the degree-corrected stochastic block model (Karrer and
Newman 2011). In this approach, one defines a model that generates networks with
community structure then fits that model to the observed network. The parameters
of the best fit tell us which nodes of the network belong to which communities.
More specifically, they give us the posterior probability that each node belongs
sociological science | www.sociologicalscience.com 229 April 2019 | Volume 6Bruch and Newman Online Dating Markets in U.S. Cities
to each community; in the final stage of the calculation, we assign every node to
the community for which it has highest probability of membership. The fitting
itself is performed using an EM algorithm, with the E-step carried out using belief
propagation (Decelle et al. 2011). Technical details are given in the supplementary
materials. Code is available upon request.
Notes
1 There are a small number of zip codes on the map that appear to have been assigned
to the “wrong” community, such as the portion of eastern Arizona that is placed in
a community together with Ohio and Indiana. Despite appearances, however, these
assignments are not a data error or a fault in the algorithm. They are a real phenomenon.
Each of them represents an area that had an usual amount of communication with
another, far-away locale. In the eastern Arizona zip code, for example, 13 percent of
conversations were with users in Cleveland, Ohio, a far larger percentage than with
any other area, so the community detection algorithm correctly places this zip code in
the same community as Cleveland. Such anomalies will inevitably occur occasionally,
usually in sparsely populated areas, where the messages sent by even one uncommonly
active user can bias the statistics substantially.
2 Black women are overrepresented in the oldest submarkets in Chicago and Boston,
relative to their fractions in the population, but not in New York or Seattle. Chicago and
Boston are also the only cities where black men tend to be younger than nonblack men
within the oldest submarket. This may be because they are pursuing black women, who,
within a given submarket, tend to be younger than their nonblack counterparts.
References
Angrist, Josh. 2002. “How Do Sex Ratios Affect Marriage and Labor Markets? Evidence
from America’s Second Generation.” Quarterly Journal of Economics 117:997–1038. https:
//doi.org/10.1162/003355302760193940.
Bailey, Michael, Rachel Cao, Theresa Kuchler, Johannes Stroebel, and Arlene Wong. 2018.
“Social Connectedness: Measurement, Determinants, and Effects.” Journal of Economic
Perspectives 32:259–80. https://doi.org/10.1257/jep.32.3.259.
Becker, Gary S. 1973. “A Theory of Marriage: Part I.” The Journal of Political Economy 81:813–46.
https://doi.org/10.1086/260084.
Blau, Peter M., Terry C. Blum, and Joseph E. Schwartz. 1982. “Heterogeneity and Intermar-
riage.” American Sociological Review 47:45–62. https://doi.org/10.2307/2095041.
Blondel, Vincent D., Anahí Gajardo, Maureen Heymans, Pierre Senellart, and Paul Van
Dooren. 2004. “A Measure of Similarity between Graph Vertices: Applications to Synonym
Extraction and Web Searching.” SIAM Review 46:647–66. https://doi.org/10.1137/
S0036144502415960.
Blossfeld, Hans-Peter, and Andreas Timm. 2003. Who Marries Whom? Educational Systems
as Marriage Markets in Modern Societies. Vol. 12. Berlin, Germany: Springer Science and
Business Media. https://doi.org/10.1007/978-94-007-1065-8.
sociological science | www.sociologicalscience.com 230 April 2019 | Volume 6Bruch and Newman Online Dating Markets in U.S. Cities
Breen, Richard, and Leire Salazar. 2013. “Educational Assortative Mating and Earnings
Inequality in the United States.” American Journal of Sociology 117:808–43. https://doi.
org/10.1086/661778.
Bruch, Elizabeth, Fred Feinberg, and Kee Yeun Lee. 2016. “Extracting Multistage Screening
Rules from Online Dating Activity Data.” Proceedings of the National Academy of Sciences
113:10530–5. https://doi.org/10.1073/pnas.1522494113.
Decelle, Aurelien, Florent Krzakala, Cristopher Moore, and Lenka Zdeborová. 2011. “Asymp-
totic Analysis of the Stochastic Block Model for Modular Networks and Its Algorithmic
Applications.” Physical Review E 84:066106. https://doi.org/10.1103/PhysRevE.84.
066106.
Finer, Lawrence B., and Jesse M. Philbin. 2014. “Trends in Ages at Key Reproductive
Transitions in the United States, 1951–2010.” Women’s Health Issues 24:e271–9. https:
//doi.org/10.1016/j.whi.2014.02.002.
Fisman, Raymond, Sheena S. Iyengar, Emir Kamenica, and Itamar Simonson. 2008. “Racial
Preferences in Dating.” Review of Economic Studies 75:117–32. https://doi.org/10.1111/
j.1467-937X.2007.00465.x.
Fortunato, Santo. 2010. “Community Detection in Graphs.” Physical Reports 486:75–174.
https://doi.org/10.1016/j.physrep.2009.11.002.
Gale, David, and Lloyd S. Shapley. 1962. “College Admissions and the Stability of Mar-
riage.” American Mathematical Monthly 69:9–15. https://doi.org/10.1080/00029890.
1962.11989827.
Glass, David. 1954. Social Mobility in Britain. London, United Kingdom: Rougledge and
Kegan Paul.
Guzzo, Karen Benjamin. 2006. “How Do Marriage Market Conditions Affect Entrance into
Cohabitation vs. Marriage?” Social Science Research 35:332–55. https://doi.org/10.
1016/j.ssresearch.2004.05.005.
Harknett, Kristen. 2008. “Mate Availability and Unmarried Parent Relationships.” Demogra-
phy 45:555–71. https://doi.org/10.1353/dem.0.0012.
Hernan, Vera, Donna H. Berardo, and Felix M. Berardo. 1985. “Age Heterogamy in Marriage.”
Journal of Marriage and the Family 47:553–66. https://doi.org/10.2307/352258.
Hitsch, Günter J., Ali Hortaçsu, and Dan Ariely. 2010. “Matching and Sorting in Online
Dating.” American Economic Review 100:130–63. https://doi.org/10.1257/aer.100.1.
130.
Kalmijn, Matthijs. 1991. “Status Homogamy in the United States.” American Journal of
Sociology 97:496–523. https://doi.org/10.1086/229786.
Kalmijn, Matthijs. 1998. “Intermarriage and Homogamy: Causes, Patterns, Trends.” Annual
Review of Sociology 24:395–421. https://doi.org/10.1146/annurev.soc.24.1.395.
Karrer, Brian, and Mark E. J. Newman. 2011. “Stochastic Blockmodels and Community Struc-
ture in Networks.” Physical Review E 83:016107. https://doi.org/10.1103/PhysRevE.
83.016107.
sociological science | www.sociologicalscience.com 231 April 2019 | Volume 6Bruch and Newman Online Dating Markets in U.S. Cities
Laumann, Edward O., Stephen E. Ellingson, Jenna E. Mahay, Anthony E. Paik, and Yoosik E.
Youm. 2004. The Sexual Organization of the City. Chicago, IL: University of Chicago Press.
https://doi.org/10.7208/chicago/9780226470337.001.0001.
Lewis, Kevin. 2013. “The Limits of Racial Prejudice.” Proceedings of the National Academy
of Sciences of the United States of America 110:18814–19. https://doi.org/10.1073/pnas.
1308501110.
Lichter, Daniel T., Robert N. Anderson, and Mark D. Hayward. 1995. “Marriage Markets
and Marital Choice.” Journal of Family Issues 16:412–31. https://doi.org/10.1177/
019251395016004001.
Lichter, Daniel T., Felicia B. LeClere, and Diane K. McLaughlin. 1991. “Local Marriage
Markets and the Marital Behavior of Black and White Women.” American Journal of
Sociology 96:843–67. https://doi.org/10.1086/229610.
Liljeros, Frederick, Christofer R. Edling, Luis A. Nunes Amaral, Harry Eugene Stanley,
and Yvonne Åberg. 2001. “The Web of Human Sexual Contacts.” Nature 411:907–8.
https://doi.org/10.1038/35082140.
Lin, Ken-Hou, and Jennifer Lundquist. 2013. “Mate Selection in Cyberspace: The Intersection
of Race, Gender, and Education.” American Journal of Sociology 119:183–215. https:
//doi.org/10.1086/673129.
Mare, Robert D. 1991. “Five Decades of Educational Assortative Mating.” American Sociologi-
cal Review 56:15–32. https://doi.org/10.2307/2095670.
Morris, Martina, and Mirjam Kretzschmar. 1995. “Concurrent Partnerships and Transmis-
sion Dynamics in Networks.” Social Networks 17:299–318. https://doi.org/10.1016/
0378-8733(95)00268-S.
Newman, Mark E. J. 2003. “Mixing Patterns in Networks.” Physical Review E 67:026126.
https://doi.org/10.1103/PhysRevE.67.026126.
Newman, Mark E. J. 2004. “Fast Algorithm for Detecting Community Structure in Networks.”
Physical Review E 69:066133. https://doi.org/10.1103/PhysRevE.69.066133.
Newman, Mark E. J. 2018. Networks. 2nd ed. Oxford, United Kingdom: Oxford University
Press. https://doi.org/10.1093/oso/9780198805090.001.0001.
Newman, Mark E. J., and Michelle Girvan. 2004. “Finding and Evaluating Community Struc-
ture in Networks.” Physical Review E 69:026113. https://doi.org/10.1103/PhysRevE.
69.026113.
Piazzesi, Monika, Martin Schneider, and Johannes Stroebel. 2015. Segmented Housing Search.
Cambridge: National Bureau of Economic Research: Technical Report. Cambridge, MA:
National Bureau of Economic Research. https://doi.org/10.3386/w20823.
Qian, Zhenchao, and Samuel H. Preston. 1993. “Changes in American Marriage, 1972 to
1987: Availability and Forces of Attraction by Age and Education.” American Sociological
Review 58:482–95. https://doi.org/10.2307/2096072.
Rae, Alasdair. 2015. “Online Housing Search and the Geography of Submarkets.” Housing
Studies 30:453–72. https://doi.org/10.1080/02673037.2014.974142.
sociological science | www.sociologicalscience.com 232 April 2019 | Volume 6Bruch and Newman Online Dating Markets in U.S. Cities
Robnett, Belinda, and Cynthia Feliciano. 2011. “Patterns of Racial-Ethnic Exclusion by
Internet Daters.” Social Forces 89:807–28. https://doi.org/10.1093/sf/89.3.807.
Rosenfeld, Michael J., and Reuben J. Thomas. 2012. “Searching for a Mate: The Rise of
the Internet as a Social Intermediary.” American Sociological Review 77:523–47. https:
//doi.org/10.1177/0003122412448050.
Roth, Alvin E., and Marilda Sotomayor. 1992. “Two-Sided Matching.” Handbook of Game
Theory with Economic Applications 1:485–541. https://doi.org/10.1016/S1574-0005(05)
80019-0.
Schwartz, Christine R. 2010. “Earnings Inequality and the Changing Association between
Spouses’ Earnings.” American Journal of Sociology 115:1524. https://doi.org/10.1086/
651373.
Schwartz, Christine R. 2013. “Trends and Variation in Assortative Mating: Causes and
Consequences.” Annual Review of Sociology 39:451–70. https://doi.org/10.1146/
annurev-soc-071312-145544.
Skopek, Jan, Andreas Schmitz, and Hans-Peter Blossfeld. 2011. “The Gendered Dynamics of
Age Preferences - Empirical Evidence from Online Dating.” Zeitschrift für Familienforschung
23:267–90.
Smith, Kirsten P., and Nicholas A. Christakis. 2008. “Social Networks and Health.” An-
nual Review of Sociology 34:405–29. https://doi.org/10.1146/annurev.soc.34.040507.
134601.
South, Scott J., and Kim M. Lloyd. 1992a. “Marriage Markets and Nonmarital Fertility in the
United States.” Demography 29:247–64. https://doi.org/10.2307/2061730.
South, Scott J., and Kim M. Lloyd. 1992b. “Marriage Opportunities and Family Formation:
Further Implications of Imbalanced Sex Ratios.” Journal of Marriage and the Family 54:440–51.
https://doi.org/10.2307/353075.
Sprecher, Susan, John DeLamater, Nancy Neuman, Michael Neuman, Pam Kahn, David
Orbuch, and Kathleen McKinney. 1984. “Asking Questions in Bars: The Girls (and Boys)
May Not Get Prettier at Closing Time and Other Interesting Results.” Personality and Social
Psychology Bulletin 10:482–8. https://doi.org/10.1177/0146167284103017.
Trent, Katherine, and Scott South. 2011. “Too Many Men? Sex Ratios and Women’s Partnering
Behavior in China.” Social Forces 90:247–68. https://doi.org/10.1093/sf/90.1.247.
Waldron, Ingrid, Mary Elizabeth Hughes, and Tracy L. Brooks. 1996. “Marriage Protection
and Marriage Selection: Prospective Evidence for Reciprocal Effects of Marital Status and
Health.” Social Science & Medicine 43:113–23. https://doi.org/10.1016/0277-9536(95)
00347-9.
Xie, Yu, Siwei Cheng, and Xiang Zhou. 2015. “Assortative Mating without Assortative
Preference.” Proceedings of the National Academy of Sciences 112:5974–8. https://doi.org/
10.1073/pnas.1504811112.
Yang, Zhao, René Algesheimer, and Claudio J. Tessone. 2016. “A Comparative Analysis of
the Community Detection Algorithms on Artificial Networks.” Scientific Reports 6:30750.
https://doi.org/10.1038/srep30750.
sociological science | www.sociologicalscience.com 233 April 2019 | Volume 6Bruch and Newman Online Dating Markets in U.S. Cities
Acknowledgments: The authors thank Travis Martin for useful conversations. This work
was funded in part by the National Institutes of Health under grant K01-HD-079554 (E.
E. B.) and the National Science Foundation under grants DMS–1107796, DMS–1407207,
and DMS–1710848 (M. E. J. N.). The authors declare no conflicts of interest. The data are
protected under institutional review board–approved guidelines for HUM00075042.
Elizabeth E. Bruch: Department of Sociology and Center for the Study of Complex Systems,
University of Michigan, and Santa Fe Institute. E-mail: ebruch@umich.edu.
M. E. J. Newman: Department of Physics and Center for the Study of Complex Systems,
University of Michigan, and Santa Fe Institute. E-mail: mejn@umich.edu.
sociological science | www.sociologicalscience.com 234 April 2019 | Volume 6You can also read