Temperature driven hibernation site use in the Western barbastelle Barbastella barbastellus (Schreber, 1774) - Nature
←
→
Page content transcription
If your browser does not render page correctly, please read the page content below
www.nature.com/scientificreports
OPEN Temperature driven hibernation
site use in the Western barbastelle
Barbastella barbastellus (Schreber,
1774)
Luc De Bruyn 1,2,5, Ralf Gyselings 1,5, Lucinda Kirkpatrick 2
, Alek Rachwald 3
,
Grzegorz Apoznański 4 & Tomasz Kokurewicz 4*
In temperate regions, winter is characterized by cold temperatures and low food availability.
Heterothermic animals can bridge this period by entering a state of torpor characterized by decreased
body temperature and reduced metabolic rate. Hibernation site choice is crucial since temperature
conditions in the hibernaculum will impact torpor. We analysed temperature-dependent hibernation
site use of Barbastella barbastellus. Bats and temperature were monitored in an underground system
(1999–2019) and standalone bunkers (2007–2019) in Western Poland. During the winter of 2017–2018
we analysed the thermal variability of the hibernacula. Seasonal variation is higher in bunkers and
thus temperatures get colder in winter than in the underground system. On the other hand, short-
term variability (thermal variability index) in the bunkers was lower than in the underground system.
This makes bunkers a more stable environment to hibernate for cold dwelling bats in warm winters,
when temperatures in the bunkers do not get below freezing. Bats use both the warm underground
system and the colder bunkers. During the last decade, a continuous series of warm winters occurred
and the population of barbastelle bats partly moved from the underground system to the bunkers.
These present temperature increases broadened the range of potential hibernation sites for
barbastelles. Our study indicates that long-term trends, seasonal variation and short-term variability
in temperatures are all important and should be analysed to investigate hibernaculum use by bats. Our
study shows that small hibernation sites may become more important in the future.
During winter, when ambient temperatures are low, many animals face a high energy need combined with a lack
of food. To cope with this period of limited energy supply, during which the cost may prohibit homeothermy,
heterotherms enter a state of torpor, characterized by a decrease in their body temperature set point and a
drastically reduced metabolic rate1–6. For example, the torpor metabolic rate for Myotis lucifugus at 2 °C body
temperature is only 1% of the resting metabolic rate at a body temperature of 37 °C5. Using prolonged periods
of torpor, hibernators can survive on stored fat for m onths1. However, surviving the whole winter season on fat
reserves can be a challenge, especially when harsh conditions occur at the end of the w inter7,8.
In torpor, heterotherms can lower their body temperature down to a minimum temperature ( Tmin) at which
the rate of energy expenditure is minimal. At ambient temperatures below T min the rate of energy expenditure
increases sharply. The minimum body temperature T ependent9. Traditionally it was thought
min is species d
that heterotherms should select microclimates with a temperature close to T min to minimize their metabolic
rate and energy consumption10–12, although the reported range of temperatures at which heterotherms of dif-
ferent species were found hibernating is very wide and there is a considerable overlap in the reported range
of temperatures for different s pecies13–19. Today it is well understood that there are also costs associated with
lowering the body temperature in t orpor20. Several negative physiological impacts have been reported, includ-
ing reduced immunocompetence21,22, sleep deprivation23 and reduced protein synthesis24. Furthermore, torpor
can reduce a hibernator’s ability to escape from predators, or can lead to missed opportunities such as m ating20.
1
Research Institute for Nature and Forest (INBO), Brussels, Belgium. 2Evolutionary Ecology Group, University of
Antwerp, Antwerp, Belgium. 3Forest Ecology Department, Forest Research Institute, Sękocin Stary, Raszyn,
Poland. 4Department of Vertebrate Ecology and Paleontology, Institute of Environmental Biology, Wrocław
University of Environmental and Life Sciences, Wrocław, Poland. 5These authors contributed equally: Luc De Bruyn
and Ralf Gyselings *email: tomasz.kokurewicz@upwr.edu.pl
Scientific Reports | (2021) 11:1464 | https://doi.org/10.1038/s41598-020-80720-4 1
Vol.:(0123456789)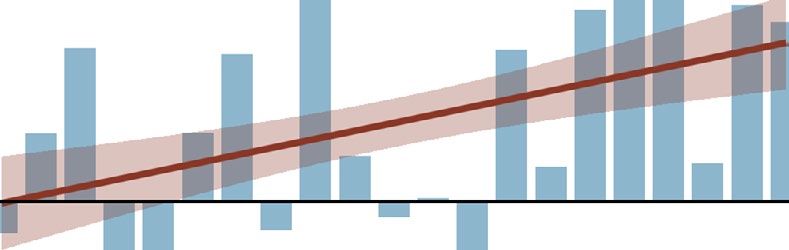
www.nature.com/scientificreports/
Microclimate selection therefore is a process of balancing the trade-off between maximizing energy conservation
and minimizing the negative consequences of torpor, as was elaborated extensively in an optimal hibernation
theory framework by Boyles, et al.20. Optimal microclimate selection can vary not only between species, but also
between juveniles and a dults25,26, between sexes, or even between i ndividuals26,27. Optimal microclimate selection
will also change during the course of the winter, with bats often switching between microhabitats10,28–31, indicat-
ing that bats optimize their hibernation strategy by using both physiological and behavioral mechanisms20,27.
The choice of an optimal hibernation site is constrained by the availability of hibernacula, and subsequently
the microsites within said hibernacula in the landscape, while the availability of microsites within a hiberna-
tion site are determined by the physical laws of heat transport. In a cave environment, sites deep in the cave will
have on average higher and more stable temperatures. Closer to the entrance, temperatures will drop to lower
average values when the winter progresses, but they will be more variable and thus less p redictable10,19,29,32. This
unpredictability can make a choice for higher temperatures more optimal33,34. Boyles, et al.32 introduced the
thermal variability index (TVI), which quantifies the temperature variation in a hibernaculum, and used this
metric to compare variability between different microsites in a cave system. The TVI is in essence a modified
form of standard deviation that estimates the magnitude of variation in ambient temperature over a given time
period in relation to the ambient temperature at the beginning of the time period. Biologically this represents the
variation away from the ambient temperature that a bat can expect when it chooses a microsite for hibernation32.
Since microclimate temperatures are ultimately driven by the outside temperature, climate change can have a
significant effect on the availability and choice of hibernation sites. Most climate change impact studies focus on
conditions during the summer or growing/reproduction season, despite winter conditions being more severely
altered35. There is growing evidence that winter conditions are changing rapidly, resulting in an increasing aver-
age global temperature, a reduction in the number of frost days in temperate regions, shortening of the snow
season and an increased rate of extreme warm temperature events35–37. Based on the size of the energy reserves
at the onset of hibernation, the depletion rate during winter, and the length of the winter, Humphries, et al.38
developed a bioenergetic model that relates winter energetic requirements to ambient winter temperatures. The
model suggests that only a relatively narrow combination of hibernaculum temperature and winter duration
permits successful overwintering. For example, for Myotis lucifugus, their model indicates that for a winter
length of 193 days, hibernation should take place between 0 and 12 °C, with a minimum energy consump-
tion at 2 °C. Similar conclusions were obtained for Myotis sodalis albeit with a narrower temperature r ange39.
This may render hibernating species particularly vulnerable to changing winter climatic conditions as ambient
winter temperatures modify the microclimatic conditions within sites, potentially raising hibernacula tem-
peratures above optimal hibernation temperatures and negatively impacting crucial life history phases such as
hibernation40. Understanding the dynamics of microclimatic conditions in hibernation sites during the winter
period is therefore critical to bat conservation32,41, particularly in the face of our changing climate. Therefore, a
better understanding of hibernaculum use and site choice under different temperature conditions is necessary,
with the monitoring of microclimatic conditions within winter sites of primary i mportance32,41.
Here, we focus on how bat species preferring cold temperatures may adjust hibernation site use, using the
Barbastelle bat Barbastella barbastellus as an example. Barbastella barbastellus is a psychrophilic species reported
to hibernate in exposed, dry (75–90% relative humidity) and well ventilated shelters with temperatures rang-
ing between -3.0° and 6.5 °C, but usually above 0 °C13,42. In deep underground systems B. barbastellus is often
found hibernating in the colder parts of the system near the entrance15,16. They also often use smaller shelters
like cellars and bunkers43,44, and can even hibernate in trees45. B. barbastellus is among the seven European spe-
cies most vulnerable for climate change e ffects46, it faces major reductions in its distribution range under many
future climate change s cenarios40, which are exacerbated by its sedentary n ature47 (a study in Germany estimated
the majority of movements as being between 4 and 44 km ). We studied numbers of B. barbastellus in a deep
48
underground system, and in stand-alone above ground bunkers scattered in the vicinity of the underground
system in Western Poland. Previous work by Gottfried, et al.41 found a decrease in the number of B. barbastellus
hibernating in the underground system and an increase in the surrounding bunkers, but they did not find any
significant correlation between the two. We also monitored the temperatures within the underground system
and the bunkers during a full winter season (2017–2018) to analyse the thermal dynamics of both systems and
microsite choice by B. barbastellus. In addition, we analysed changes in bat numbers in the underground system
(1999–2019) and bunkers (2007–2009) and related these to temperature conditions to assess long term effects
in hibernation site use.
In this study we want to assess the thermal characteristics of hibernation sites and relate this to hibernaculum
use by the bats. We predict that thermal variability is higher in the above ground bunkers than in the under-
ground system, and that temperatures in the bunkers drop to lower values as the winter proceeds. Since B. bar-
bastellus is a psychrophilic species, we predict it will predominantly use the colder available microsites. We also
predict that in warm winters the deep underground system becomes too warm for hibernating B. barbastellus,
and they move to alternative hibernation sites.
Materials and methods
Fieldwork. Bats were monitored in an underground corridor system of the Natura 2000 site PLH080003
"Nietoperek" in Lubuskie Region, Western Poland (52°25′N, 15°32′ E) (Supplementary Figure S.1) and 19 bun-
kers in the neighbourhood of the underground system (Supplementary Figure S.2). The underground system
and the bunkers are part of a military defence belt built in the period 1934–1944. In 1957 the military construc-
tions were abandoned, and nature was left to take over the system. The fortifications consist of a large main
underground corridor system (ca 32 km long, 20-30 m below ground) and one or two storey bunkers situated on
the surface and partially destroyed by explosives (Supplementary Figure S.2).
Scientific Reports | (2021) 11:1464 | https://doi.org/10.1038/s41598-020-80720-4 2
Vol:.(1234567890)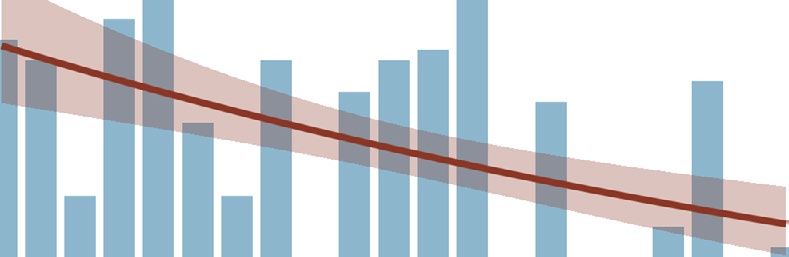
www.nature.com/scientificreports/
Every year up to 40,000 bats of 13 species hibernate in both the main underground system "Nietoperek" and
the surrounding bunkers, making it one of the largest and most important bat hibernation sites in E urope49.
Bat populations in Nietoperek have been censused biennially between 1999 and 2005 and annually afterwards,
making this an extremely valuable long-term database. For monitoring purposes the underground system is
divided in 9 sections (143 subsections; Supplementary Figure S.1), each of which is counted by a single team of
orkers49–51. To ensure reliability of the data, teams were always led by a selected group of people that
about 7 bat w
have a lot of experience with the system. To minimize disturbance, censuses in the main underground system
are carried out in mid-January, the period when the number of hibernating bats is highest, during a single day
from the sunrise to sunset. Annual monitoring of the bunkers started in 2007 and involves teams of 5–7 bat
workers examining the bunkers the day after the visit to the underground system, counting the number of bats
per room. Not all bunkers were counted every year, but all bunkers included in the dataset were counted at least
six times during the study period. Bats were identified and counted visually, without handling the animals under
the licences issued by the Regional Nature Conservation Management in Gorzów Wielkopolski.
Temperature data collection. Long-term (1999–2019) temperature data consisting of three daily meas-
urements (6am, 12 pm, 6 pm) were obtained from the nearest weather station of the National Institute of Mete-
orology and Water Management at Lubinicko-Świebodzin, 10 km from our study site. As a measure of winter
climatic conditions, we calculated four parameters based on the temperature data for the period between 1
November and 15 January: the average daily mean temperature, the average daily minimum temperature, the
number of frost days (total number of days when frost occurred at least part of the day, i.e. days with a minimum
temperature below 0 °C) and the number of ice days (total number of days when frost occurred all day, i.e. days
with a maximum temperature below 0 °C).
In the winter of 2017–2018, temperature loggers (iButtons models DS1921 and DS1925, Thermochron,
Baulkham Hills, Australia) were deployed in 52 (sub)sections of the underground system and in 53 rooms of 7
bunkers. The corridors of the underground system in which loggers were placed consist of three types: a main
corridor with a height of 3.7–4 m, large side corridors with a height of 3–3.5 m and small side corridors with a
height of 2.2–2.5 m. If the height of the corridor was less than 3 m loggers were placed in the middle of the ceil-
ing. In higher corridors loggers were placed at a height of 3–3.5 m, which corresponds to a height where most
bats are found. At four control points, additional loggers were placed at lower heights, but they did not show any
temperature difference compared with the loggers at the standard high height. In the bunkers loggers were always
placed against the wall near the ceiling, which is 2–2.5 m high. Loggers recorded the temperature every 4 h with
an accuracy of ± 0.5 °C. We used the temperature data from November to April to assess seasonal variation in
the temperature of underground sections and bunker rooms with and without barbastelle bats.
Data analysis. Climate parameter trends. Long-term (1999–2019) trends in the average daily mean tem-
perature, the average daily minimum temperature, the number of frost days and the number of ice days were
modelled with generalised linear models (GLM). We used a gaussian error distribution for the average daily
mean temperature and the average daily minimum temperature, and a negative binomial distribution with a log
link for the number of frost days and the number of ice days. All models were compared with an intercept only
null model without a trend term. Model comparison was based on AIC values, with models with an AIC at least
two units lower than the null model being considered significantly better.
Thermal variability index. To assess the short-term variability in temperatures at the 52 (sub)sections and 53
rooms with loggers, we calculated the Thermal Variability Index (TVI) as defined by Boyles, et al.32.
n 2
i=1 (T0 − Ti )
TVIx =
n−1
where x is the timeframe over which TVI is calculated, n is the number of times temperature is sampled across
the calculation period, T 0 is the temperature at the beginning of the timeframe and T i is the i-th temperature
measurement in the timeframe. TVI represents how much variation in temperature a bat will experience if
it chooses a site at the beginning of the timeframe and stays there for the length of the timeframe. We used a
timeframe of 14 days, as suggested by Boyles et al.32, to capture short-term temperature fluctuations. This period
corresponds to an average torpor bout length of several species as found by Brack and Twente52. We chose January
as a reference period because all censuses were carried out in this month and used each measuring time point
in January as the starting point to calculate a T VI14 series for each site. The maximum of these values per time
series was used as Thermal Variability Index for the site.
Thermal Variability Index was modelled against mean January temperature with a non-linear Generalised
additive model (GAM)53, with object type (underground vs. bunkers) as factorial covariate and compared to a
null model without object type as covariate. Model comparison was based on AIC values, with models with an
AIC at least two units lower than the null model being considered significantly better.
Trends in bat numbers. To assess the trend in bat numbers in the underground system we summed the annual
bat numbers counted in all 9 sections.
To assess the trend in bat numbers in the bunkers, we summed the annual bat numbers in all the bunkers
after imputing missing values, since not all bunkers were examined every year. We used the multiple imputation
method proposed by Onkelinx, et al.54 to estimate the yearly population totals of the bunkers (with standard
errors) in the presence of missing data. Onkelinx, et al.54 compared this method with other imputation methods
Scientific Reports | (2021) 11:1464 | https://doi.org/10.1038/s41598-020-80720-4 3
Vol.:(0123456789)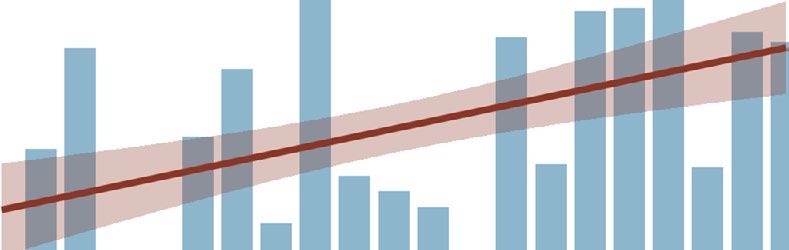
www.nature.com/scientificreports/
using a dataset of waterbird counts in terms of bias and variance, and concluded that their multiple imputation
method performs better than other existing imputation methods. To carry out the multiple imputation we first
modelled the complete available dataset with a generalized linear model with a negative binomial distribution.
To estimate values for the missing data points, we randomly drew all model parameters (intercept, regression
parameters and their standard deviations) from their respective distributions and then randomly drew imputa-
tion values from a negative binomial distribution with the drawn model parameters and the number of bats per
bunker as independent variables. This step was repeated 1000 times to create 1000 imputed datasets. To model
the barbastelle numbers against a dependent variable, modelling was carried out on all 1000 imputed datasets
with a negative binomial regression model. Finally we calculated the overall regression parameters β i and their
standard errors σ i following Rubin’s rules55:
N
1
βi = β̂
N
n=1
N N
1 N +1
σ 2i = σ̂ 2 +
N N
n=1 n=1
where N is number of imputed datasets (in our case N = 1000), β i is the overall regression parameter i, β̂ is the
estimated regression parameter i from imputed dataset n, σ i is the overall standard deviation for regression
parameter i and σ̂ is the estimated standard deviation for regression parameter i from imputed dataset n. The
overall AIC value was calculated as the mean of the N AIC values of the modeling of the N imputed datasets.
The average of β̂ over all N imputed datasets is an unbiased estimate of the true index βi . The squared stand-
ard error σ 2i of this average, β i , is the sum of two c omponents56. The first is the average of the squared standard
errors σ̂ 2 of the individual β̂ over the N imputated datasets and is a measure of within-imputation variability.
The second is the variance of β̂ among the imputed datasets, i.e. the between-imputation variability, multiplied
with a correction factor (L + 1)/L. This component will be large when the imputation step is highly variable.
Trends in barbastelle numbers were modelled with generalised linear models and generalised additive mod-
els with a negative binomial distribution and a log link. All models were compared with an intercept only null
model without a trend term. Model comparison was based on AIC values, with models with an AIC at least two
units lower than the null model being considered significantly better. AIC of a model on the imputed dataset was
calculated as the average AIC of the modelling on all 1000 imputed datasets. Pearsons’ correlation was used to
assess whether the trends in bat numbers seen in the underground and in the bunkers were correlated.
Software. All data were analysed with R version 3.6.1 R
57. Generalized additive models (GAM) were fitted with
the gam-function of the mgcv-package version 1.8–2858. Generalised linear models (GLM) with the glm.nb
function of the MASS package version 7.3–51.459.
Results
Temperatures inside the hibernacula. Temperatures in both the underground system and the bunkers
were well above the outside temperatures apart from in the bunkers at the end of the winter in March (Fig. 1).
In the underground system, hibernating B. barbastellus bats occupy the coldest sections, but are also found in
a number of the warmer sections. During the course of winter, temperatures in the underground sections only
decrease slightly because the system is well buffered. On average the sections containing B. barbastellus get
slightly colder because they are situated closer to the entrances. However, part of the population also uses the
warmer parts of the system which is illustrated in Fig. 1 by the increasing quantile range as winter progresses.
In contrast to the underground system, temperatures in the surface located bunkers decrease strongly until they
reached freezing conditions in March (Fig. 1). The seasonal variation, taken over a whole winter season, of the
temperatures is much higher in the bunkers than in the underground system. For the above ground bunkers, we
found no difference in temperature between the sites where B. barbastellus was found and where B. barbastellus
was absent. In November, there is overlap in temperatures that are available between the coldest sections of the
underground system and the bunkers (Fig. 1). This overlap gradually disappeared to end of the winter in March.
However, in January there still was an overlap in mean January temperature between the coldest sections of the
underground system and the bunkers (Fig. 2).
In the winter 2017–2018, when inside temperatures were monitored, B. barbastellus was found in hiberna-
tion sites with mean January temperatures ranging between 2.5 and 10 °C. In the deep underground system,
53% of the bats (354 individuals) were found at sites with a mean January temperature above 6.5 °C, 36% (238
individuals) at sites with a mean January temperature above 8 °C. In the bunkers all sites used by hibernating B.
barbastellus had a mean January temperature below 5.5 °C.
Short-term variability, as depicted by the Thermal Variability Index, is higher at sites with a low mean Janu-
ary temperature (Fig. 2). A regression model of the T VI14 against the mean January temperature reveals a lower
short-term variability as the mean January temperature is higher. This pattern is found in the underground
system as well as in the above ground bunkers. However, the regression line for the above ground bunkers lies
well below the regression line for the underground system. In the colder sections of the underground system,
thermal variability was higher than in the bunker rooms with comparable mean temperatures. The difference
between bunkers and underground is highly significant (model with object type: AIC = 143; model without object
type: AIC = 171). Thus, the relationship between long-term and short-term variability is system dependent, and
microclimates with a different short-term thermal variability for the same inside mid-winter mean temperature
can occur if different types of systems are available.
Scientific Reports | (2021) 11:1464 | https://doi.org/10.1038/s41598-020-80720-4 4
Vol:.(1234567890)
www.nature.com/scientificreports/
Figure 1. Temperatures (winter 2017/2018) of Barbastella barbastellus hibernation sites. The boxplots
represent temperatures measured outside, in the bunker rooms and the subsections of the underground
corridor system with B. barbastellus (Bba +) and without B. barbastellus (Bba −). Centre line, median; box limits,
25–75% quantiles; whiskers, 0.05–0.95% quantiles. Number of loggers (rooms/subsections) are respectively:
Underground Bba + 48, Underground Bba- 52, Bunkers Bba + 16, Bunkers Bba − 39.
Figure 2. Maximum Thermal Variability Index in January against Mean January temperature for the bunkers
and for the underground system. Bba + are subsections/rooms where Barbastella barbastellus was found during
the mid January census of 2018. Bba- are subsections/rooms where Barbastella barbastellus was absent during
the mid January census of 2018. Trend line = mean ± SE.
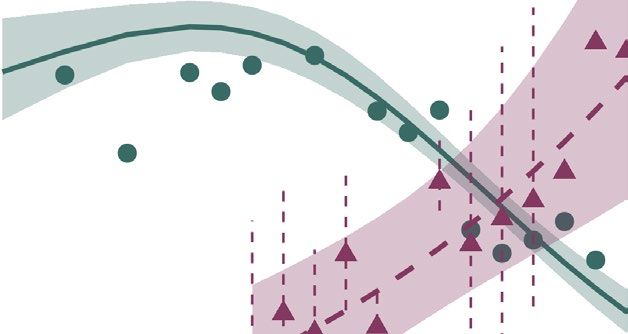
Long term Barbastella barbastellus trends. Numbers of B. barbastellus in the underground system
varied between 900 and 1400 individuals during the first decade, but significantly decreased thereafter to less
than 500 by 2019. The trend was highly non-linear (AIC GAM = 228, AIC GLM = 239, AIC null model = 251;
Fig. 3). At the same time, there was a significant, exponential increase in numbers of B. barbastellus in the bun-
kers (AIC GAM = 133, AIC GLM = 132, AIC null model = 145). A GAM model did not perform better than a
GLM model, possibly reflecting the relatively short duration of the time series (13 years). The increasing trend
in the bunkers is significantly correlated with the decreasing trend in the underground system (Pearson r2 = 0.48,
df = 11, p = 0.008). The decrease in the last decade in the underground system corresponds with a yearly popula-
tion decline of 8.85%, the increase in the bunkers in the same period with a yearly population increase of 8.93%.
Temperature trends. There was a significant increase in average daily mean and minimum temperature,
and a significant decrease in number of frost days over the study period (Table 1; Fig. 4). From 2012 onwards
Scientific Reports | (2021) 11:1464 | https://doi.org/10.1038/s41598-020-80720-4 5
Vol.:(0123456789)www.nature.com/scientificreports/
Figure 3. Population trend of Barbastella barbastellus in the underground system and the bunkers.
Underground (●): yearly total count of the underground corridor system. Bunkers (▲): yearly total count in
bunkers after imputation of missing data. Vertical dashed lines represent the 95% confidence interval for partly
imputed values. Trend line = mean ± SE for the best fitting model: GAM for the underground and GLM for the
bunkers.
AIC
Parameter Trend estimate Standard error AIC Null model
Average daily mean temperature 0.115 0.056 82.30 84.47
Average daily minimum temperature 0.114 0.057 82.46 84.49
Number of frost days -0.0319 0.0144 161.29 164.08
Number of ice days -0.0568 0.0320 150.72 151.47
Table 1. AIC values of the trend modelling in winter parameters. Null model is without trend. Trends with an
AIC at least two lower than the null model are marked in bold. For Number of frost days and Number of ice
days a log link was used.
weather conditions were characterized by a consecutive period of warmer winters. Warm winters also occurred
in the period before, but not as a long consecutive series. Temperatures from 2012 onwards were clearly higher
than before, and the number of frost and ice days was clearly lower than before (Fig. 5).
Discussion
Thermal conditions in hibernacula. Barbastella barbastellus used hibernation sites with a broader range
of temperatures than expected given findings from previous studies13,42. We predicted that Barbastella barbastel-
lus predominantly uses the colder available microsites, but 53% of the population in the deep underground sys-
tem used sites with a mean January temperature above 6.5 °C, in contradiction to temperature ranges reported
previously13 and to the expectation for a psychrophilic species. This indicates that, in line with other bat spe-
cies, there is also considerable individual variation in hibernation requirements in this species. Boyles, et al.32
similarly found that hibernating Indiana bats (Myotis sodalis) select mid-winter microsites with a wider range of
environmental conditions than is often stated. Our data on B. barbastellus confirm their conclusion that there is
no “optimal” temperature for bat hibernation. However, when we merge the numbers hibernating in the bunkers
and the underground system, about 2/3 of the population hibernates at colder temperatures.
Our data show that bunkers offer generally colder environments than the underground system, in accord-
ance with our prediction. There is, however, overlap in temperatures between sites used by B. barbastellus in
both systems. In 2017–2018 the microclimate in the bunkers only reached freezing conditions at the end of the
winter. In colder winters these conditions will be reached earlier in the season, making the bunkers less suitable
for hibernation. In warmer winters however, they are suitable, and extent the range of available microclimates
for hibernation of B. barbastellus. Additionally, for comparable cold mean temperatures, somewhat surpris-
ingly, bunkers offer a more stable environment than the underground system as shown by the Thermal Vari-
ability Index. In the above ground bunkers, the seasonal variability is higher, giving rise to lower mid-winter
temperatures. For a given mid-winter temperature, the short-term variability in the bunkers is lower than in the
underground system. Therefore, our prediction that thermal variability is higher in the above ground bunkers
than in the underground system is only partly true. It holds for seasonal variability, but not for short-term vari-
ability. When searching for cold hibernation conditions, B. barbastellus may find a more stable environment
in the bunkers than in the underground system. This can be explained by the different physical nature of both
types of hibernation structures.
In a deep underground system, conductive temperature transport through the walls and the ground cover
will be negligible. Deep parts of the system therefore will have a constant temperature throughout the year, as is
Scientific Reports | (2021) 11:1464 | https://doi.org/10.1038/s41598-020-80720-4 6
Vol:.(1234567890)www.nature.com/scientificreports/
Figure 4. Trends in climatic parameters between 1 November and 15 January over the study period. Red:
model fit line with a GLM model + /− standard error.
found in the Nietoperek system (Fig. 1). On the other hand, conduction through the walls will not be negligible
in a bunker, leading to a general decrease of the wall temperatures over the winter season (Fig. 1). However, in,
a deep underground system with multiple entries, like the underground system of Nietoperek, temperature will
also be determined by air flow, which in its turn is mainly determined by thermal convection60. The principle of
thermal convection in a multiple entry underground system is that air enters through a lower entry and escapes
(rises) through an upper entrance when it is warmer than the outside air. Therefore, in winter, cold air from the
outside entering through a lower entrance, heats up because of heat exchange with the walls during its passage
through the system and finally reaches an equilibrium when the air has the same temperature as the system
walls. The heated air then leaves the system through the upper entrances. Close to the entrance of the air flow,
temperatures are not yet equilibrated and will fluctuate, the rate of which depending on the speed of the air flow.
ow28, and therefore fluctuations can be considerable.
The chimney effect can create relatively high speeds of air fl
In an above ground bunker system there is no chimney effect, and air flow is determined by wind. Because of
the lack of a chimney effect and the smaller sized corridors with many turns (Supplementary Figure S.2), air
flow will be much lower in a bunker than in the underground system. Short term fluctuations therefore will be
less pronounced in bunkers, except for rooms with a direct opening to the outside. Therefore, bunkers can offer
a more stable environment at lower mean temperatures. Moreover, the bunkers offer a great variety of cracks
and fissures in which the bats can hide. This way, bats can further regulate their hibernation microclimate, hid-
ing away from the influence of the air flow. Indeed, during the 2018 census 74% of B. barbastellus found in the
bunkers were hidden in crevices, whereas in the underground system fewer crevices are available and nearly all
B. barbastellus hibernate open against the walls. Our findings are similar to other studies in similar small systems
where B. barbastellus was often found hibernating in c revices44,61.
Trends in hibernation microsite use. Winter severity has declined during the last two decades, with
higher mean and minimum temperatures and a lower number of frost and ice days. This is especially true from
2012 onwards where weather conditions have been characterized by a long consecutive period of warmer win-
ters.
The numbers of B. barbastellus in the underground system of the Natura 2000 site "Nietoperek" declined dur-
ing this period of milder winters. Numbers of B. barbastellus in the same underground system for the preceding
period from 1985 to 1996 were reported by Lesinski, et al.61, during which time the numbers of B. barbastellus
increased until 1990, and thereafter stabilised to within the range we see in the first decade of our study period.
This suggests that the observed decline within the last decade is likely to be a recent phenomenon. At the same
time, the numbers of B. barbastellus in the above ground bunkers around the underground system increased with
both time series being negatively correlated. In the first decade mild winters also occurred, but not in consecutive
Scientific Reports | (2021) 11:1464 | https://doi.org/10.1038/s41598-020-80720-4 7
Vol.:(0123456789)www.nature.com/scientificreports/
Figure 5. Climatic parameters for the period 1999–2011 and 2012–2019. Centre line, median; box limits,
25–75% quantiles; whiskers, 0.05–0.95% quantiles.
series as was observed from 2012 onwards. Therefore, a single mild winter is not sufficient to observe a reaction
in the population of B. barbastellus in Nietoperek, but rather a consecutive series of milder winters is required.
Bats, including B. barbastellus, often show site fidelity to their hibernation p laces15,16,29,62. Daan29 found that
even when bats switch places during hibernation, they still only use a select number of places each year. There-
fore, if the availability of suitable hibernation sites is expanded, part of the population might switch hibernation
locations, but part of the population will stay. This may explain our observation that numbers of B. barbastallus
only decreased gradually in the Nietoperek underground system. In the Nietoperek underground system the
yearly population decline was 8.85% and the yearly population increase in the bunkers was 8.93%. Dietz, et al.47
state an expected average life span for B. barbastellus ranging from 5.5 to 10 years, corresponding to an annual
mortality of 9.5 to 16.6%47. There is a striking correspondence between the lower value of this range and the
rate of change in the underground system and in the bunkers. Together with the aspect of site fidelity, it may
suggest that juveniles are predominantly responsible for the habitat shift by selecting the colder bunker sites that
now belong to the available range of habitats given the milder winter temperatures. This, however, needs to be
confirmed by further research.
Our prediction that in warm winters the underground system becomes too warm for hibernating B. barbastel-
lus, forcing them to search for alternative hibernation sites, is not supported by the temperature data. Rather, in
mild winters the range of suitable hibernation habitats for B. barbastellus is extended, and potentially even better
environments become available. Since only part of the population will select these new opportunities, a gradual
decline in the number of hibernating bats in the underground will only become detectable after a prolonged
series of warm winters, such as we are currently experiencing.
Seasonal variability and short‑term variability in temperature. Microsite selection in relation to
thermal variability has been addressed in several s tudies28,32,62–64. However, the distinction between long-term
variability and short-term variability in temperature has never been made, except by Boyles, et al.32. Most studies
assume that a higher seasonal variability, giving rise to lower mid-winter temperatures, implies a higher short-
term variability. Our study however shows that this distinction can be important when examining microsite
selection by hibernating bats. This is especially true when systems with different physical characteristics are
available to the bats. In our study region bats can choose between a multiple entry underground system and
above ground bunkers. In regions with more natural caves, a variation in types of caves can be available in which
a different relationship between seasonal variability and short-term variability exists, since the air flow patterns
will differ from cave to cave. For instance, single entry caves will behave completely different from multiple entry
caves.
Scientific Reports | (2021) 11:1464 | https://doi.org/10.1038/s41598-020-80720-4 8
Vol:.(1234567890)www.nature.com/scientificreports/
We investigated short-term variability in temperature in relation to microhabitat selection for a psychrophilic
species, Barbastella barbastellus. We are convinced that short-term variability in temperature can also be impor-
tant for other species. Martinkova, et al.63 showed that part of the thermophilic species Myotis myotis moves to
colder parts near the entrance of a cave in the Czech Republic towards the end of the winter season. M. myotis
in the colder parts then forms larger clusters. Barbastelle bats in our study sometimes hibernate in clusters, but
more than half of the population hibernates solitary, even at low temperatures. Similar movements at the end of
the season were reported by Daan and W ichers28 for Myotis Myotis, Myotis dasycneme, Myotis daubentonii and
Myotis mystacinus in the Netherlands.
When bats choose colder sites at the end of the winter to reduce their energy expenditure, a low short-term
variability can be beneficial. However, they also could use variation in temperature as a signal that conditions
igrate32. In that case,
outside the cave are such that successful foraging might be possible or that it is time to m
a high short-term variability can be advantageous. Therefore, making the distinction between seasonal vari-
ability and short-term variability in temperature can be a key to further understanding of microsite selection
by hibernating bats.
Conservation implications
Under climate change, winter conditions are predicted to get milder, with an increase in temperatures and a
decrease in the number of frost and ice days35–37. For bats hibernating in deep underground systems, a gradual
habitat shift such as we found here will be the first step in adapting to the new conditions. Microclimatic hetero-
geneity can buffer species against regional extirpations as has been shown for plants and insects65. Depending
on the availability of small scale objects, the population may find even better conditions for hibernation, since
this type of objects can offer more stable conditions at low temperatures. However, this situation is expected to
be temporary, because after some time these objects will also become too warm due to rising winter tempera-
tures. Bats can then shift to hibernating in trees, which means they stay in their summer habitat, but finally the
population will become locally extinct. However, our analysis shows that the presence of small scale objects in
the neighbourhood of an underground system, and by extension old grown forests with tree holes and loose
bark, can temporarily mitigate the first stages of climate change. It also emphasises the high conservation value
of such locations. Since hibernating bats are sensitive to human d isturbance66,67, small bunkers should be as
well protected as the underground system, and safeguarded from human visitors during the hibernation season.
Received: 14 October 2020; Accepted: 24 December 2020
References
1. Geiser, F. Metabolic rate and body temperature reduction during hibernation and daily torpor. Annu. Rev. Physiol. 66, 239–274.
https://doi.org/10.1146/annurev.physiol.66.032102.115105 (2004).
2. Speakman, J. R. & Thomas, D. W. In Bat Ecology (eds T. H. Kunz & B. M. Fenton) 430–490 (The University of Chicago Press, 2003).
3. Thomas, D. W., Dorais, M. & Bergeron, J.-M. Winter energy budgets and cost of arousals for hibernating little brown bats, myotis
lucifugus. J. Mammal. 71, 475–479. https://doi.org/10.2307/1381967 (1990).
4. Thomas, D. W., Cloutier, D. & Gagné, D. Arrhythmic breathing, apnea and non-steady state oxygen uptake in hibernating Little
Brown Bats (Myotis lucifugus). J. Exp. Biol. 149, 395–406 (1990).
5. Hock, R. J. The metabolic rates and body temperatures of bats. Biol. Bull. 101, 289–299 (1951).
6. McNab, B. K. The behavior of temperate cave bats in a subtropical environment. Ecology 55, 943–958 (1974).
7. Belkin, V. V., Panchenko, D. V., Tirronen, K. F., Yakimova, A. E. & Fedorov, F. V. Ecological status of bats (Chiroptera) in winter
roosts in eastern Fennoscandia. Russ. J. Ecol. 46, 463–469. https://doi.org/10.1134/s1067413615050045 (2015).
8. Richter, A. R., Humphrey, S. R., Cope, J. B. & Brack, V. Modified cave entrances - thermal effect on body-mass and resulting decline
of endangered indiana bats (Myotis sodalis). Conserv. Biol. 7, 407–415. https: //doi.org/10.1046/j.1523-1739.1993.070204 07.x (1993).
9. Arlettaz, R. et al. Physiological traits affecting the distribution and wintering strategy of the bat Tadarida teniotis. Ecology 81,
1004–1014. https://doi.org/10.1890/0012-9658(2000)081[1004:ptatda]2.0.co;2 (2000).
10. Clawson, R. L., Laval, R. K., Laval, M. L. & Caire, W. Clustering behaviour of hibernating Myotis Sodalis in Missouri. J. Mammal.
61, 245–253. https://doi.org/10.2307/1380045 (1980).
11. McManus, J. J. Activity and thermal preference of the little brown bat, Myotis lucifugus, during hibernation. J. Mammal. 55, 844–846
(1974).
12. Ingersoll, T. E., Navo, K. W. & de Valpine, P. Microclimate preferences during swarming and hibernation in the Townsend’s big-
eared bat, Corynorhinus townsendii. J. Mammal. 91, 1242–1250. https://doi.org/10.1644/09-mamm-a-288.1 (2010).
13. Webb, P. I., Speakman, J. R. & Racey, P. A. How hot is a hibernaculum? A review of the temperatures at which bats hibernate. Can.
J. Zool.-Rev. Can. Zool. 74, 761–765. https://doi.org/10.1139/z96-087 (1996).
14. Gaisler, J. Remarks on the thermopreferendum of palearctic bats in their natural habitats. Bijdragen tot de Dierkunde 40, 33–35
(1970).
15. Bogdanowicz, W. & Urbanczyk, Z. Some ecological aspects of bats hibernating in the city of Poznan. Acta Theriologica 28, 371–385
(1983).
16. Lesinski, G. Ecology of bats hibernating underground in Central Poland. Acta Theriologica 31, 507–521 (1986).
17. Nagel, A. & Nagel, R. How do bats choose optimal temperatures for hibernation?. Comp. Biochem. Physiol. A Physiol. 99, 323–326.
https://doi.org/10.1016/0300-9629(91)90008-Z (1991).
18. Siivonen, Y. & Wermundsen, T. Characteristics of winter roosts of bat species in southern Finland. Mammalia 72, 50–56. https://
doi.org/10.1515/mamm.2008.003 (2008).
19. Brack, V. Jr. Temperatures and locations used by hibernating bats, including Myotis sodalis (Indiana bat), in a limestone mine:
Implications for conservation and management. Environ. Manag. 40, 739–746. https: //doi.org/10.1007/s00267 -006-0274-y (2007).
20. Boyles, J. G., Johnson, J. S., Blomberg, A. & Lilley, T. M. Optimal hibernation theory. Mammal Rev. 50, 91–100. https://doi.
org/10.1111/mam.12181(2020).
21. Prendergast, B. J., Freeman, D. A., Zucker, I. & Nelson, R. J. Periodic arousal from hibernation is necessary for initiation of
immune responses in ground squirrels. Am. J. Physiol.-Regul. Integr. Comp. Physiol. 282, R1054–R1062. https://doi.org/10.1152/
ajpregu.00562.2001 (2002).
Scientific Reports | (2021) 11:1464 | https://doi.org/10.1038/s41598-020-80720-4 9
Vol.:(0123456789)www.nature.com/scientificreports/
22. Burton, R. S. & Reichman, O. J. Does immune challenge affect torpor duration?. Funct. Ecol. 13, 232–237. https://doi.org/10.104
6/j.1365-2435.1999.00302.x (1999).
23. Daan, S., Barnes, B. M. & Strijkstra, A. M. Warming up for sleep? Ground-squirrels sleep during arousals from hibernation.
Neurosci. Lett. 128, 265–268. https://doi.org/10.1016/0304-3940(91)90276-y (1991).
24. van Breukelen, F. & Martin, S. L. Molecular biology of thermoregulation - Invited review: molecular adaptations in mammalian
hibernators: unique adaptations or generalized responses?. J. Appl. Physiol. 92, 2640–2647. https://doi.org/10.1152/japplphysi
ol.01007.2001 (2002).
25. Kokurewicz, T. Sex and age related habitat selection and mass dynamics of Daubenton’s bats Myotis daubentonii (Kuhl, 1817)
hibernating in natural conditions. Acta Chiropterologica 6, 121–144 (2004).
26. Czenze, Z. J., Jonasson, K. A. & Willis, C. K. R. Thrifty females, frisky males: winter energetics of hibernating bats from a cold
climate. Physiol. Biochem. Zool. 90, 502–511. https://doi.org/10.1086/692623 (2017).
27. Boyles, J. G., Dunbar, M. B., Storm, J. J. & Brack, V. Jr. Energy availability influences microclimate selection of hibernating bats. J.
Exp. Biol. 210, 4345–4350. https://doi.org/10.1242/jeb.007294 (2007).
28. Daan, S. & Wichers, H. J. Habitat selection of bats hibernating in a limestone cave. Z. Fur Saugetierkunde-Int. J. Mammalian Biol.
33, 262–287 (1968).
29. Daan, S. Activity during natural hibernation in three species of vespertilionid bats. Netherlands J. Zool. 23, 1–71 (1973).
30. Kirkpatrick, L., Apoznanski, G., De Bruyn, L., Gyselings, R. & Kokurewicz, T. Bee markers: a novel method for non invasive short
term marking of bats. Acta Chiropterologica 21, 465–471. https://doi.org/10.3161/15081109acc2019.21.2.020 (2019).
31. Bagrowska-Urbanczyk, E. & Urbanczyk, Z. Structure and dynamics of a winter colony of bats. Acta Theriologica 28, 183–196
(1983).
32. Boyles, J. G., Boyles, E., Dunlap, R. K., Johnson, S. A. & Brack, V. Long-term microclimate measurements add further evidence that
there is no “optimal” temperature for bat hibernation. Mammalian Biol. 86, 9–16. https://doi.org/10.1016/j.mambio.2017.03.003
(2017).
33. Boyles, J. G. & McKechnie, A. E. Energy conservation in hibernating endotherms: why “suboptimal” temperatures are optimal.
Ecol. Model. 221, 1644–1647. https://doi.org/10.1016/j.ecolmodel.2010.03.018 (2010).
34. Webb, P. I., Speakman, J. R. & Racey, P. A. Population dynamics of a maternity colony of the pipistrelle bat (Pipistrellus pipistrellus)
in north-east Scotland. J. Zool. 240, 777–780. https://doi.org/10.1111/j.1469-7998.1996.tb05323.x (1996).
35. IPCC. Climate Change 2007: Impacts, Adaptation and Vulnerability. Contribution of Working Group II to the Fourth Assessment
Report of the Intergovernmental Panel on Climate Change. Eds. Parry, M., Canziani, M., Palutikof, O., van der Linden, J., Hanson,
P., Cambridge, C., (Cambridge University Press, 2007).
36. Lutenbacher, J., Dietrich, D., Xoplaki, E., Grosjean, M. & Wanner, H. European seasonal and annual temperature variability, trends,
and extremes since 1500. Science 303, 1499–1503 (2004).
37. Piniewski, M., Mezghani, A., Szcześniak, M. & Kundzewicz, Z. W. Regional projections of temperature and precipitation changes:
robustness and uncertainty aspects. Meteorol. Z. 26, 223–234. https://doi.org/10.1127/metz/2017/0813 (2017).
38. Humphries, M. M., Thomas, D. W. & Speakman, J. R. Climate-mediated energetic constraints on the distribution of hibernating
mammals. Nature 418, 313–316. https://doi.org/10.1038/nature00828 (2002).
39. Day, K. M. & Tomasi, T. E. Winter energetics of female Indiana bats Myotis sodalis. Physiol. Biochem. Zool. 87, 56–64. https://doi.
org/10.1086/671563 (2014).
40. Rebelo, H., Tarroso, P. & Jones, G. Predicted impact of climate change on European bats in relation to their biogeographic patterns.
Glob. Change Biol. 16, 561–576. https://doi.org/10.1111/j.1365-2486.2009.02021.x (2010).
41. Gottfried, I. et al. Long-term changes in winter abundance of the barbastelle Barbastella barbastellus in Poland and the climate
change: are current monitoring schemes still reliable for cryophilic bat species?. PLoS ONE 15, 18. https://doi.org/10.1371/journ
al.pone.0227912 (2020).
42. Rydell, J. & Bogdanowicz, W. Barbastella barbastellus. Mammalian Species, 1–8 (1997).
43. Lesinski, G. et al. The importance of small cellars to bat hibernation in Poland. Mammalia 68, 345–352. https://doi.org/10.1515/
mamm.2004.034 (2004).
44. Sachanowicz, K. & Zub, K. Numbers of hibernating Barbastella barbastellus (Schreber, 1774) (Chiroptera, Vespertilionidae) and
thermal conditions in military bunkers. Mammalian Biol. 67, 179–184. https://doi.org/10.1078/1616-5047-00026 (2002).
45. Greenaway, F. The barbastelle in Britain. British Wildlife 12, 327–334 (2001).
46. Sherwin, H. A., Montgomery, W. I. & Lundy, M. G. The impact and implications of climate change for bats. Mammal Rev. 43,
171–182. https://doi.org/10.1111/j.1365-2907.2012.00214.x (2013).
47. Dietz, C., Von Helversen, O. & Nill, D. Bats of Britain, Europe & Northwest Africa. (A &C Black Publishers Ltd., 2009).
48. Hutterer, R., Ivanova, T., Meyer-Cords, C. & Rodrigues, L. Bat migrations in Europe: a review of banding data and literature. Vol.
28 (Federal Agency for Nature Conservation in Germany, 2005).
49. Kokurewicz, T. et al. 45 years of bat study and conservation in Nietoperek bat reserve (Western Poland). Nyctalus 19, 252–269
(2019).
50. Cichocki, J. et al. In 23th Polish Chiropterological Conference. (ed W. Grzywinski) 9–10 (2014).
51. Cichocki, J. et al. In Proceedings of the 24th Polish Chiropterological Conference. (ed W. Grzywinski) 36–37 (2015).
52. Brack, V. & Twente, J. W. The duration of the period of hibernationof 3 species of Vespertilionid bats. 1. Field studies. Can. J.
Zool.-Rev. Can. Zool. 63, 2952–2954 (1985).
53. Zuur, A. F., Ieno, E. N., Walker, N. J., Saveliev, A. A. & Smith, G. M. Mixed effects models and extensions in ecology with R. (Springer,
2009).
54. Onkelinx, T., Devos, K. & Quataert, P. Working with population totals in the presence of missing data comparing imputation
methods in terms of bias and precision. J. Ornithol. 158, 603–615. https://doi.org/10.1007/s10336-016-1404-9 (2017).
55. Rubin, D. B. Multiple Imputation for Nonresponse in Surveys. (Wiley, 1987).
56. Rubin, D. B. Multiple imputation after 18+ years. J. Am. Stat. Assoc. 91, 473–489. https://doi.org/10.1080/01621459.1996.10476
908 (1996).
57. RCoreTeam. in Version 3.6.1 (URL https://www.R-project.org/: R Foundation for Statistical Computing, Vienna, Austria, 2019).
58. Mixed GAM Computation Vehicle with GCV/AIC/REML smoothness estimation v. 1.8–0 (2014).
59. Venables, W. N. & Ripley, B. D. Modern Applied Statistics with S. Fourth Edition. (Springer, 2002).
60. Tuttle, M. D. & Stevenson, D. E. in BCI Bat Conservation and Management Workshop. 19–35 (Bat Conservation International).
61. Lesinski, G., Fuszara, E., Fuszara, M., Jurczyszyn, M. & Urbanczyk, Z. Long-term changes in the numbers of the barbastelle Bar-
bastella barbastellus in Poland. Folia Zool. 54, 351–358 (2005).
62. Klug-Baerwald, B. J., Lausen, C. L., Willis, C. K. R. & Brigham, R. M. Home is where you hang your bat: winter roost selection by
prairie-living big brown bats. J. Mammal. 98, 752–760. https://doi.org/10.1093/jmammal/gyx039 (2017).
63. Martinkova, N., Baird, S. J. E., Kana, V. & Zima, J. Bat population recoveries give insight into clustering strategies during hiberna-
tion. Front. Zool. 17, 11. https://doi.org/10.1186/s12983-020-00370-0 (2020).
64. Tuttle, M. D. & Kennedy, J. In BCI Bat Conservation and Management Workshop. 73–82 (Bat Conservation International).
65. Suggitt, A. J. et al. Extinction risk from climate change is reduced by microclimatic buffering. Nat. Climate Change 8, 713–717.
https://doi.org/10.1038/s41558-018-0231-9 (2018).
Scientific Reports | (2021) 11:1464 | https://doi.org/10.1038/s41598-020-80720-4 10
Vol:.(1234567890)www.nature.com/scientificreports/
66. Thomas, D. W. Hibernating bats are sensitive to nontactile human disturbance. J. Mammal. 76, 940–946. https://doi.
org/10.2307/1382764 (1995).
67. Speakman, J. R., Webb, P. I. & Racey, P. A. Effects of disturbance on the energy expenditure of hibernating bats. J. Appl. Ecol. 28,
1087–1104. https://doi.org/10.2307/2404227 (1991).
68. Jurga, R. M. & Kędryna A. M. Festungsfront Oder-Warthe Bogen. Katalog (Wydawnictwo Donjon, 2006).
Acknowledgements
We would like to thank the Regional Nature Conservation Management in Gorzów Wielkopolski, especially
Mr. Jan Rydzanicz, Stanisław Bąkowski, Wincenty Piworun and Grzegorz Karcz, for licences to carry out winter
bat censuses. We are grateful to Mr Leszek Lisiecki (Museum of Fortifications and Bats in Pniewo, Międzyrzecz
Community), Mr Ryszard Skonieczek (Lubrza Community) and Beata Studzińska (Świebodzin) for good co-
operation and help in on-site bat conservation. We would like to thank following persons for invaluable help in
organising the country teams involved in the annual bat censuses at Nietoperek: Anita Glover & Henry Schofield
(The Vincent Wildlife Trust, U.K.), Mateusz Ciechanowski & Aneta Zapart (Gdańsk University, Poland), John
Haddow (Auritus Wildlife Consultancy, U.K.), Christiane Schmidt (Fachgruppe Fledermausschutz, Germany),
Fons Bongers (The Netherlands), Wout Willems (Natuurpunt, Belgium), Marcin Rusiński (ANSEE Consulting,
Poland), Tomasz Kliś (Lower Silesian Climbing School, Poland) and many volunteers from all over Europe for
who helped in field work. We also would like to thank Thierry Onkelinx for helpful statistical discussions and
John Haddow and two anonymous referees for their revision of the manuscript.
Author contributions
T.K., G.A., R.G., L.D.B., A.R. and L.K. collected the data; T.K. and G.A. organized the censuses, including licence
administration, T.K., R.G. and A.R. prepared the data for analysis; R.G, L.D.B. and L.K. analysed the data; L.D.B.
made the photographs, L.D.B., R.G., L.K. and T.K. wrote the manuscript; All authors reviewed the manuscript.
Funding
This research received no external funding.
Competing interests
The authors declare no competing interests.
Additional information
Supplementary Information The online version contains supplementary material available at https://doi.
org/10.1038/s41598-020-80720-4.
Correspondence and requests for materials should be addressed to T.K.
Reprints and permissions information is available at www.nature.com/reprints.
Publisher’s note Springer Nature remains neutral with regard to jurisdictional claims in published maps and
institutional affiliations.
Open Access This article is licensed under a Creative Commons Attribution 4.0 International
License, which permits use, sharing, adaptation, distribution and reproduction in any medium or
format, as long as you give appropriate credit to the original author(s) and the source, provide a link to the
Creative Commons licence, and indicate if changes were made. The images or other third party material in this
article are included in the article’s Creative Commons licence, unless indicated otherwise in a credit line to the
material. If material is not included in the article’s Creative Commons licence and your intended use is not
permitted by statutory regulation or exceeds the permitted use, you will need to obtain permission directly from
the copyright holder. To view a copy of this licence, visit http://creativecommons.org/licenses/by/4.0/.
© The Author(s) 2021
Scientific Reports | (2021) 11:1464 | https://doi.org/10.1038/s41598-020-80720-4 11
Vol.:(0123456789)You can also read


