The Past, Present and Future Climate of Central Otago: Implications for the District
←
→
Page content transcription
If your browser does not render page correctly, please read the page content below
Prepared by Bodeker Scientific for the Central Otago District Council

The Past, Present and Future
Climate of Central Otago:
Implications for the District
1
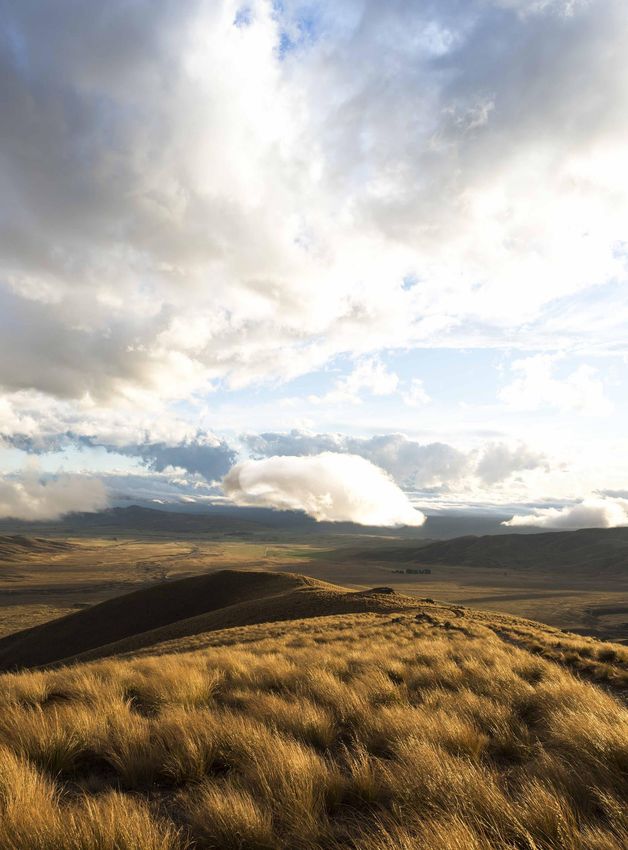
The past, present and future
climate of Central Otago:
Implications for the District

Prepared by Bodeker Scientific for Central
Otago District Council

Chris Cameron, Stefanie Kremser, Jared Lewis, Greg Bodeker and
Jono Conway

August, 2017

Photo Acknowledgements:
Front Cover: Philip Brookes

 2
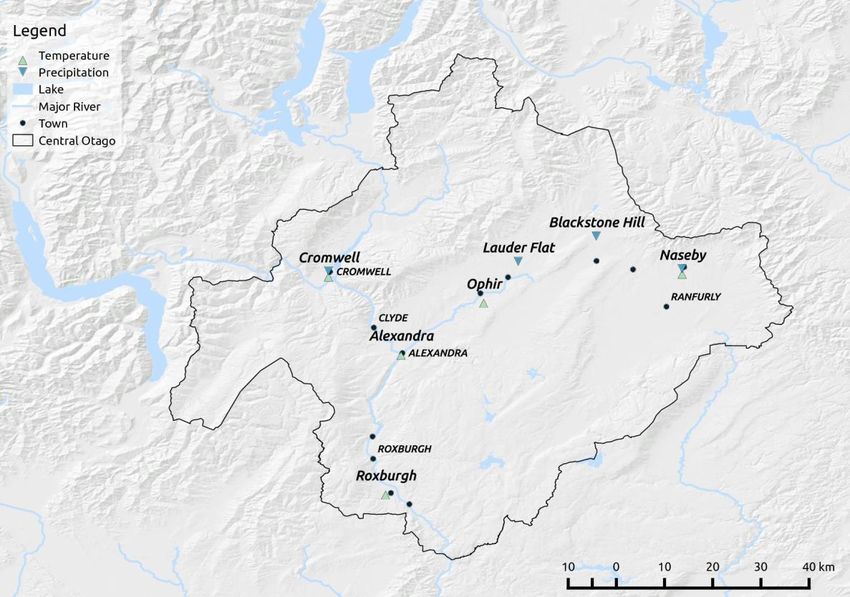
Table of Contents
1. Executive Summary....................................................................................................... 4
2. Background .................................................................................................................. 6
3. Introduction.................................................................................................................. 7
 3.1 The Paris Agreement on climate change .............................................................................. 7
 3.2 The role of snow in Otago ................................................................................................... 8
4. Methodology ................................................................................................................ 9
 4.1 Climate indices ................................................................................................................... 9
 4.2 Historic climate change ..................................................................................................... 10
 4.3 Projections of climate change............................................................................................ 10
 4.4 Snow model projections.................................................................................................... 11
5. Results........................................................................................................................ 13
 5.1 Historic change ................................................................................................................. 13
 5.1.1 Precipitation........................................................................................................................................ 13
 5.1.2 Temperature ....................................................................................................................................... 14

 5.2 Climate Projections ........................................................................................................... 15
 5.2.1 Precipitation........................................................................................................................................ 15
 5.2.2 Temperature ....................................................................................................................................... 18
 5.2.3 Snow volume projections ................................................................................................................... 23

6. Implications for the Central Otago District .................................................................. 25
 6.1 Irrigation and drought ....................................................................................................... 25
 6.2 Land use change ............................................................................................................... 25
 6.3 Emergency management................................................................................................... 26
 6.4 Sustainability .................................................................................................................... 26
 6.5 Infrastructure ................................................................................................................... 27
 6.6 Other................................................................................................................................ 27
7. References .................................................................................................................. 29
8. Appendices ................................................................................................................. 31
 Appendix A – Confidence and likelihood as defined by the IPCC............................................... 31
 Appendix B – Representative Concentration Pathways ............................................................ 32
 Appendix C – The need for a global response .......................................................................... 33
 Appendix D – Temperature projections ................................................................................... 34

 3
1. Executive Summary With global climate change, the Central Otago district is likely to warm by several degrees by the end of the 21st century. While annual total precipitation is not projected to change much across the district, the distribution and intensity of rainfall is likely to change, with a greater likelihood of more extreme rainfall events. The total snow volume that accumulates on Central Otago mountain ranges over the winter, and then melts in spring and summer, is projected to reduce significantly by the end of the century as a direct result of increasing temperatures and rising snowlines. By the end of the century, under the highest warming scenario, the district could expect: On average, about 18 to 53 fewer frost days per annum - a reduction of almost half depending on the location. Around 10-64 more summer days per annum (daily maximum temperature above 25°C) - about double the current number depending on location. An increase in the highest annual daily maximum temperatures of 3.7-5.8°C. Extreme rainfall events are likely to increase in intensity due to more moisture being held in a warmer atmosphere. A considerable reduction in mountain snowpacks and resultant water storage and, in the worst case, there would be very little mountain snow cover remaining by the end of the century. Where snow remains, snow-melt will occur earlier, leading to a significant reduction in the volume of water from snow melt being available through the spring melt season. Precipitation that would previously have fallen as snow and been stored in the snowpack will instead fall as rain and contribute more immediately to river flows and lake levels. Summers in Central Otago will get warmer with the highest maximum temperatures increasing between 4 and 5.8°C, depending on location, and the lowest minimum temperatures increasing between 1.5 and 2°C, depending on location. Winters in Central Otago will also get warmer with the lowest minimum temperatures increasing by more than 2°C and the highest maximum temperatures changing by about 3.8°C compared to the baseline period (2000 to 2009). In some locations, no frost days are projected to remain in autumn and spring by the end of this century. The potential impacts of these climate changes for the district include: ● Higher temperatures may allow for different crop types to be grown, and it is likely that crops could be sown earlier in the growing season and will reach maturity faster. ● Increased heat stress from heatwaves, with impacts for human health, particularly for vulnerable age groups (the very young and the very old), and for stock. ● Changes in the range and habitat of native flora and fauna, as well as the distribution of pest species. ● Changes in the timing of seasonal activities such as flowering, breeding, and migration. ● Increased temperatures heightening the risk associated with wild-fire, particularly for forested areas. 4
● Higher intensity extreme rainfall events may lead to increased likelihood of landslides and
 flooding.
● Extreme precipitation events during winter resulting in very high snowfall - with implications
 for road hazards and avalanche risk.
● A reduction in the number of winter frost days is likely to see a reduced hazard from ice on
 our roads.
● Roading is likely to be affected by higher summer temperatures, which may affect
 construction and cause heat damage (e.g., damage to bitumen).
● Flood events caused by extreme rainfall, snowfall or snowmelt runoff may increase the
 potential for greater damage to bridges and road approaches.
● Increased demand for potable water as temperatures rise.
● Greater pressure on stormwater networks due to increased incidence of more extreme rainfall
 events.
● Changes in the characteristics of snowfall and snowmelt will have implications for the
 management and capacity of hydroelectric power generation.
● Indirect effects from climate change pressures outside of the district - for example, sea level
 rise in Dunedin (and elsewhere) may increase demand for housing in Central Otago.

 5
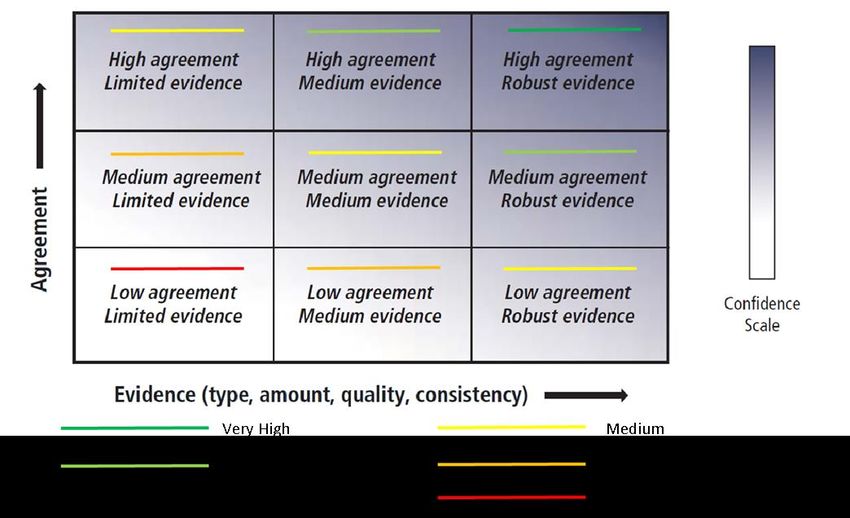
2. Background
Central Otago District Council (CODC, or ‘the Council’) is developing their 30-year Infrastructure
Strategy and 10-year Long Term Plan, with the next versions to come into effect on 1 July 2018.
CODC is seeking information regarding projected changes in climate within the district to inform those
plans. Until now, CODC has not adequately considered the impacts of climate change on their
activities, and wish to address this in the 2018 strategy and plan. Bodeker Scientific was engaged to
produce this report and provide both a synopsis of changes in the climate of the region to date and
projected climate changes so that possible implications for services provided by the Council, such as
water, storm-water, sewerage, local roading, and emergency response activities, can be determined.
Such information will also be used to inform high level considerations on possible land use change
and how these changes might impact demand for services.
There is a large body of research and resultant literature that details changes that have occurred in
New Zealand’s climate to date, as well as expected future changes. The most reliable source of such
information is the Intergovernmental Panel on Climate Change (IPCC). The research community has
very high confidence (see Appendix A for definitions of confidence and likelihood as defined by the
IPCC) that New Zealand’s climate is changing with long-term trends toward higher surface air and sea
surface temperatures, more hot extremes and fewer cold extremes, and changed rainfall patterns.
Because New Zealand is a long, narrow country surrounded by oceans, and oceans, because of their
large heat capacity, take much longer to warm up than land surfaces, changes in climate over New
Zealand have been less severe than over other locations at similar latitudes, such as Australia and
Southern Africa. It is virtually certain that warming will continue through the 21st century along with
other changes in climate. We have very high confidence that warming will drive rising snowlines,
and high confidence that there will be more frequent hot extremes and less frequent cold extremes.
Projections in rainfall are more difficult to simulate with confidence and so there is only medium
confidence that New Zealand will experience an increase in extreme rainfall and related flood risk. In
general, rainfall is expected to decrease in the northeast of the South Island and northern and eastern
North Island, and will likely increase over other parts of New Zealand but not everywhere. While
regional sea level rise will very likely exceed the rate seen over 1971-2010, this, of course, will have
no direct impact on Central Otago. Sea level rise may have an indirect impact as a result of Central
Otago being seen as a lower risk place to live.

 6
3. Introduction
The climate variables that we have focussed on for the purposes of this report are temperature and
precipitation (including snowfall and snowpack characteristics), as well as changes in the frequency
and duration of extreme events such as floods and droughts. Historical changes in these climate
variables over Central Otago have been diagnosed from analyses of climate data collected in the New
Zealand National Climate Database1. Projections of changes in these climate variables have been
extracted from regional climate model (RCM) projections conducted under the auspices of the Deep
South National Science Challenge. Analyses of changes in the frequency of extreme events has been
facilitated through the EPIC (Ensemble Projections Incorporating Climate model uncertainty)
approach (Lewis et al. 2017). EPIC generates large ensembles of projections of climate change from
a small number of RCM simulations to provide improved representation of uncertainties in the
projections. An ensemble of model simulations is a collection of simulations that all use the same
‘boundary conditions’, e.g. the same changes in greenhouse gas concentrations and other drivers of
changes in climate. However, each simulation differs because the initial conditions used to start the
model vary, and because of inherent uncertainties in our knowledge of how the climate works.
Essentially an ensemble of model simulations is a cluster of simulations whose spread captures all
sources of uncertainty in that particular simulation. EPIC allows the generation of such ensembles in a
highly cost effective way.
We have examined likely connections between any identified changes in the key climate variables
and potential changes in ice and frost occurrence, snowfall, snowpack and implications for changes in
land use. In defining the terms of reference for this report, CODC have requested a sufficient level of
detail to enable an assessment of the implications of climate change on the services that CODC
provides (water, stormwater, sewage, transport, emergency response etc.). To this end, we have
provided additional analyses and interpretation of the model output to specifically address these
requirements. We have also provided context for the projected changes using existing literature,
including material from IPCC reports.
This report was written in consultation with the council to ensure that the information provided is at a
level appropriate for inclusion in Council planning and decision-making.

3.1. The Paris Agreement on climate change
The Paris Agreement on climate change is an agreement within the United Nations Framework
Convention on Climate Change (UNFCCC) dealing with greenhouse gas emissions mitigation,
adaptation and finance, starting in 2020. The stated goal of the agreement is to limit increases in
global mean surface temperature to “well below” 2oC above pre-industrial levels, with an ambitious
additional goal of keeping warming below 1.5oC “if possible”. The content of the agreement was
negotiated by representatives of 196 parties at the 21st Conference of the Parties of the UNFCCC in
Paris and adopted by consensus on 12 December 2015. As of July 2017, 195 UNFCCC members
have signed the agreement, and 156 members, including New Zealand, have ratified it. In the Paris
Agreement, each country determines, plans and regularly reports the contribution it should make in
order to mitigate global warming - these were communicated at the time as “Intended Nationally
Determined Contributions” (INDCs). These INDCs are not legally binding as there is no mechanism to

 7

1 https://cliflo.niwa.co.nz/
force a country to set and adhere to a specific target by a specific date. According to a study
published in Nature in June 2016, current country pledges are insufficient to meet the Paris
Agreement goal of keeping global temperature rise well below 2°C (Rogelj et al, 2016). New
Zealand’s INDC is to reduce greenhouse gas emissions by 30 per cent below 2005 levels by 2030.
Local government in New Zealand has recognised the need for coordinated collaboration between
local and central government, together with other active agencies, to achieve New Zealand’s INDC.
Recently, around half of the Mayors and Chairs of Councils across New Zealand signed the Local
Government Leaders’ Climate Change Declaration2 and Local Government Climate Change Position
Statement3. This includes the Mayor of the CODC. A key component of the declaration and statement
is the requirement to take action at the local level to ensure that both adaptation to climate change
and mitigation of emissions is effectively progressed.

3.2. The role of snow in Otago
New Zealand relies on snowmelt to provide a more even seasonal distribution of water for irrigation
and power generation. Furthermore, snow and ice form a vital component of the tourism and
recreation industry in the form of ski fields and glaciers. Seasonal accumulation and melt of snow is
an important control on the hydrological cycle as the snowpack stores and regulates the release of
water. Water from snowfall is released into rivers days, months or decades after precipitation events.
Seasonally variable snow controls the long-term input and volume of glaciers (Fitzharris et al., 1999;
Sirguey, 2009; Cullen et al., 2016). Snowmelt contributes more than 10% to the total annual flow for a
number of large rivers in the South Island, including the Clutha River (Kerr, 2013), and often controls
seasonal variation in flow. The accumulation of snow during winter provides up to 20% of the water
storage needed for irrigation, and provides an important enhancement to base stream flow during the
spring growth season (Kerr, 2013). The year-to-year variability in the volume of snow accumulated in
snowpacks therefore creates uncertainty in the energy (hydro-power generation), agriculture and
tourism sectors. Long-term changes in snowpack volumes are also sensitive to climate change, and it
is expected that seasonal snowpack volumes will decrease in a warming climate (Hendrikx et al.
2012). More winter precipitation is anticipated to fall as rain, resulting in less accumulated snow and
therefore reduced contributions of snowmelt to river flows in spring.

 8

2 www.lgnz.co.nz/our-work/publications/local-government-leaders-climate-change-declaration-2017
3 www.lgnz.co.nz/our-work/publications/local-government-position-statement-on-climate-change
4. Methodology
4.1. Climate indices
When assessing the effects of climate change in a region, indices provide a useful means of
quantifying and communicating changes as they are derived to provide insights into potential impacts
of changes in the climate system. For this study, a number of indices were sourced from the Expert
Team on Climate Change Detection and Indices (ETCCDI4) to quantify and communicate estimates of
the impacts of climate change which would be of interest to Central Otago. The indices which were
used in this report have been summarised in Table 1.

 Temperature Indices

 FD Frost Days Number of days where daily minimum temperature is
 less than 0 °C

 SD Summer Days Number of days where the daily maximum
 temperature is greater than 25 °C

 TXx Highest Daily Maximum Maximum value of daily maximum temperature over
 Temperature the period

 TNx Highest Daily Minimum Maximum value of daily minimum temperature over
 Temperature the period

 TXn Lowest Daily Maximum Minimum value of daily maximum temperature over
 Temperature the period

 TNn Lowest Daily Minimum Minimum value of daily minimum temperature over
 Temperature the period

 Precipitation Indices

 CDD Length of dry spell Maximum number of consecutive days with daily
 precipitation amounts less than 1mm

 CWD Length of wet spell Maximum number of consecutive days with daily
 precipitation amounts greater than or equal to 1mm

 9

4 http://etccdi.pacificclimate.org/indices.shtml, - within the World Climate Research Programme
Rx1day Maximum 1-day Maximum precipitation over a 1-day period
 precipitation

 Rx5day Maximum consecutive 5- Maximum precipitation over a 5-day period
 day precipitation

 SDII Precipitation Intensity Simple Precipitation Intensity Index representing the
 sum of the daily precipitation amount on wet days
 (precipitation > 1 mm) divided by the number of wet
 days over a given period, in units of mm/day.

 R10mm Heavy rainfall days Number of days with precipitation greater than or
 equal to 10mm

 PRCPTOT Total precipitation Total precipitation on days with more than 1mm of
 rainfall

Table 1: List of temperature and precipitation indices which were used in this study to quantify and
communicate the projected changes in climate for Central Otago.

4.2. Historic climate change
Historic climate trends are examined for locations within the district which have long-term records of
either temperature or precipitation. Time series of measurements from selected stations have been
carefully analysed to detect gaps or step changes in the data record - for example, associated with a
change in instrument type, relocation of instruments, or changes to site characteristics. For each of
the indices, we have assessed if a significant trend has occurred over the length of the record, and
have also included a measure of the level of uncertainty associated with any apparent trend.
For precipitation, the stations used along with start dates in parenthesis; are Blackstone Hill (1920 -) ,
Naseby Forest (1923-), Cromwell (1949 - ), and Lauder Flat (1945 - ). These are based on stations
used by Mojzisek (2006), updated to 2015. For temperature, the stations and start dates are
Alexandra (1931 - ), Cromwell (1950 - ), Naseby (1923 - ), Ophir (1926 - ), and Roxburgh (1951 - ),
based on stations used by Brown (2006), updated to 2015.

4.3. Projections of climate change
Simulations conducted with a regional climate model (RCM) were used to generate daily fields of
temperature and precipitation at 5 km x 5 km resolution, from which the indices detailed in Table 1
were calculated. The gridded seasonal (3-monthly means) indices are used as training data for EPIC
to identify how they change with respect to changes in annual mean global mean surface
temperature. The EPIC method was adapted for this application so that it could be applied to time
series of temperature and precipitation indices, rather than time series of daily maximum and
minimum temperature.
Projections of climate changes over the next 10-30 years (the primary timescale of focus for CODC)
are more likely to be sensitive to influences on climate that do not result from accumulation of
greenhouse gases in Earth’s atmosphere; there are long-term processes active in the climate system
that can drive climate trends over periods of a decade or more. As we look further into the future,
these drivers of medium-term climate variability are overwhelmed by human-induced (anthropogenic)

 10
effects on climate such that the anthropogenic signal in the climate record becomes more apparent -
climate scientists like to talk about ‘the signal emerging from the noise’. The use of EPIC mitigates the
limitation of a small ensemble of RCM simulations, by incorporating a wide range of models and
model simulations. Projections were developed for 3 different Representative Concentration
Pathways (RCPs) to provide an indication of the impact of different potential climate change
pathways. RCPs provide a means for creating consistent climate projections by defining a possible
path of concentrations of greenhouse gases. The scenario with the lowest greenhouse gas
concentrations (RCP2.6) represents a best case scenario with concentrations peaking and declining
before 2100. In the highest scenario (RCP8.5) greenhouse gas emissions increase throughout the
century; this is often considered the ‘take no action’ scenario. RCP4.5 was also used as it provides a
pathway between RCP2.6 and RCP8.5. More detail regarding these scenarios is provided in
Appendix B.
Below we present results of the projected changes in the indices listed in Table 1 by the middle and
end of the century compared to the baseline period 2000 to 2009. The results are decadal averages
taken from 188 simulations.

4.4. Snow model projections
Simulations of the total volume of water stored in the winter snowpack (volume of snow water
equivalent) are produced for three mountain ranges in Central Otago (Figure 1) using a relatively
simple temperature-index snow model (Clark et al. 2009). The model calculates snow accumulation
and melt which depend on the precipitation rate and air temperature. The snow model accounts for (i)
reduced snow melt due to lower solar radiation in winter, (ii) reduced snow melt after fresh snow, and
(iii) enhanced melt during rain-on-snow events. The model requires hourly data of temperature and
precipitation for the region of interest. Here, daily output from a number of regional climate model
simulations for three RCP emissions scenarios are used to generate hourly gridded temperature and
precipitation data as described in Clark et al. (2009) for the Old Man Range, Dunstan Range and
Rough Ridge Ranges. The results presented here are based on six RCM simulations per mountain
range, where each simulation represents an equally probable temperature and precipitation time
series over the 2000 to 2100 period. Here we present the changes in the snow storage index
averaged over all six RCM simulations, for all three mountain ranges and all RCP emissions
scenarios (see below). The snow storage index describes the total volume of snow water equivalent
across a mountain range as a percentage of the average annual maximum volume of snow water
equivalent in the present-day climate (2000-2009).

 11
Figure 1: Central Otago Mountain ranges.

 12
5. Results
5.1. Historic change
Figure 2 shows a map of the district, indicating the location of stations used here to analyse trends in
historic temperature and precipitation. When examining the uncertainty of trends we use linear
regression to identify statistical significance at the 1σ level (i.e. there is a 68% probability that the
trend is significantly different from zero).

Figure 2: Location of stations which had long duration temperature and/or precipitation measurements.

5.1.1. Precipitation
For each of the precipitation indices we indicate where statistically significant trends are found over
the historic record covering the period 1953-2015. Some additional precipitation indices have been
used for the historic data as used by Mojzisek (2006), which capture many of the same elements
related to variation and extremes over time.
Total Precipitation
Total annual precipitation in Cromwell has shown a statistically significant increase of about 1mm per
year (total of approximately 60mm more now per annum). Blackstone Hill, Naseby Forest and Lauder
show no significant trends.
Precipitation Intensity
A statistically significant increase in average rainfall intensity is apparent for Naseby (up about 0.5
mm/day) and Lauder (up about 2mm/day), but no statistically significant trend is found for Blackstone
Hill or Cromwell.

 13
Length of a dry spell No statistically significant trend was apparent. Length of a wet spell No statistically significant trend was apparent. Maximum consecutive 5-day precipitation The maximum amount of rainfall over a five-day period has reduced at Lauder, by about 30mm in total. No statistically significant trends are apparent for Blackstone Hill, Cromwell or Naseby. Additional results where we have extended the data set of Mojzisek (2006) to 2015 show: The total number of rain days per annum in both Naseby and Lauder is now about 10 fewer days compared to 1953. No significant changes are apparent for Blackstone Hill or Cromwell. There are fewer consecutive wet days in Naseby, down by about half a day. No statistically significant changes are apparent for Blackstone Hill, Cromwell or Lauder. There are about 2 more ‘very wet’ days per annum at Lauder now. Blackstone Hill, Cromwell and Naseby have no statistically significant trends. Lauder and Naseby experience a greater proportion (both up by around 8%) of their total annual precipitation from ‘very wet’ days. No statistically significant change is detected for Blackstone Hill or Cromwell. There is a small but significant increasing change in the number of extremely wet days that have occurred at Lauder and Naseby (equating to about 1 day more in 2015 than experienced 65 years ago). Blackstone Hill and Cromwell have no statistically significant trends. Both Lauder and Naseby display a trend toward a greater proportion of their total annual precipitation from extremely wet days (each up by around 8%). Neither Blackstone Hill nor Cromwell have any detectable statistically significant trend. 5.1.2. Temperature For each of the temperature indices we indicate where significant trends in the annual values are found over the historic record covering the period from the 1920’s - 1950’s (depending on how far back the record stretches for each of the stations) up until 2015. Annual frost days Cromwell has had a statistically significant decrease in the number of frost days - about 0.2 fewer days per annum - or a total of about 16 less frost days. Ophir has shown the opposite trend, with a total increase of about 25 frost days over the period. Alexandra, Roxburgh, and Naseby showed no statistically significant trends. Annual summer days Alexandra, Cromwell and Naseby showed a statistically significant increase in this index, with 0.12 more summer days per annum each in 2015 (or a total of between 8-11 more summer days). Roxburgh and Ophir showed no statistically significant trends. Annual highest maximum temperature Alexandra, Cromwell and Naseby showed increases for this measure that were statistically significant, with their highest maximum temperatures each rising by about 1.5 oC. Again, Roxburgh and Ophir showed no statistically significant trends. 14
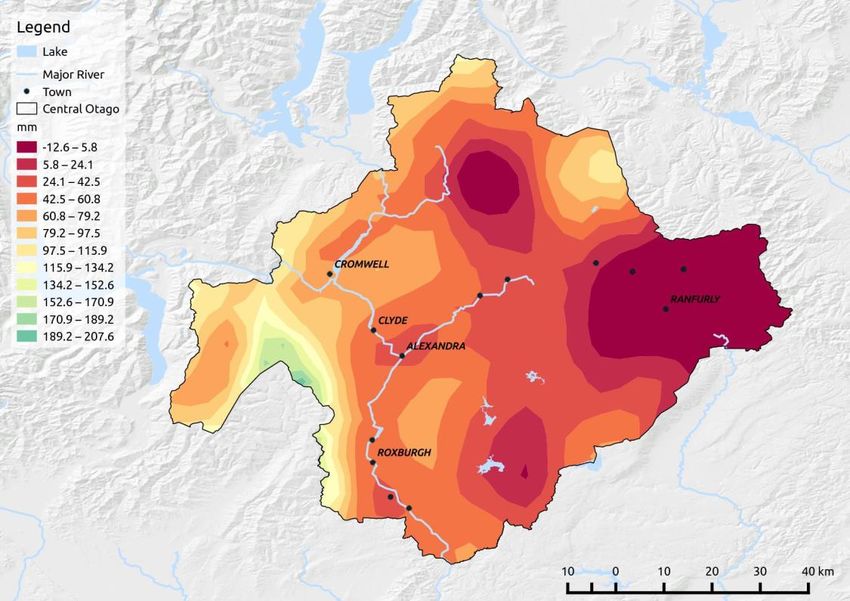
Annual highest minimum temperature
Cromwell and Roxburgh both show a statistically significant reduction for this measure - with total
decreases of around 0.7 and 2oC respectively. No significant trend is apparent for Alexandra, Naseby
or Ophir.
Lowest maximum temperature
This measure has increased with significance for Alexandra, Cromwell and Ophir, with temperatures
increasing by between 2.0-3.5oC. No significant trend is observed for Roxburgh or Naseby.
Annual lowest minimum temperature
Naseby, Alexandra and Cromwell have seen increases in the lowest minimum temperature of
between 0.01-0.02oC per annum, or a total increase over the period of around 0.6-0.9oC, which are
statistically significant. The other centres we examined show no statistically significant trends.
Annual growing degree days
When looking only at the index where the base temperatures is above 5 oC, we find that the total
number of days has increased with statistical significance for Naseby (up by 150 GDD in 2015),
Alexandra (an additional 120 GDD) and Cromwell (about 200 more GDD). Ophir shows a statistically
significant decrease in GDD (down by around 50 GDD), while Roxburgh, shows no significant trend.
Additional findings from Brown (2006) between the early 20th century and 2003 show:
 ● A significant increase in the daily temperature range, except for Roxburgh where no
 statistically significant trend was observed.
 ● An increase in the ‘growing season length’ for Alexandra.
 ● A decrease in the number of cold days (proportion of days below the 10 th percentile
 temperature) for Naseby, Ophir and Alexandra.
 ● An increase in the number of hot days (proportion of days above the 90 th percentile
 temperature) for Naseby and Alexandra.
 ● For Roxburgh a shift of the ‘date of first frost’ to later in the year, while the ‘date of the last
 frost’ has shifted to earlier in the year.
 ● While the ‘frost free’ period has increased for Roxburgh it has decreased slightly for Ophir.

5.2. Climate projections
In this section we describe the projected changes in key climate indices with respect to the 2000 to
2009 baseline period across the Central Otago District, obtained from the computer model
simulations. In the interests of keeping this report brief, and because it is unlikely that the RCP2.6
emissions scenario will be the path that reality will follow, we focus on analysing projected changes in
Central Otago’s climate for the middle and high greenhouse gas emissions scenarios (RCP4.5 and
RCP8.5).

5.2.1. Precipitation
The projected changes in precipitation by the end of this century under the highest greenhouse
emissions scenario (RCP8.5) are shown in Figures 3 and 4.
Salient features of projected changes are:
 ● Total annual precipitation is projected to increase by between 42 and 190 mm (on average)
 for the western areas of the district and the Alexandra/Cromwell regions.

 15
● Other than the dry and wet spell indicators, which do not show any statistically significant
 change over the course of this century, significant increases in precipitation are projected for
 the Old Man Range in all other precipitation indices.
 ● The number of heavy rainfall days are projected to increase by up to 7 days per annum over
 the west and south-western areas of the district.
Under the RCP4.5 emissions scenario, changes in precipitation are not statistically significant over
most of the district, except for the precipitation intensity index. For precipitation intensity, the models
simulate a significant increase over the Old Man Range by the end of the century.
Total Precipitation
Statistically significant changes in total annual precipitation are projected to occur over the Old Man,
Manuherikia, Lake Dunstan and Lindis River areas (Figure 3). The largest increase is projected to
occur over the Old Man range. The areas west of the Rock and Pillar mountain range are projected to
receive between 24 and 60 mm more precipitation annually (on average) by the end of this century
compared to the baseline period (2000-2009). Changes in total annual precipitation for the other parts
of the district are not statistically significant.

Figure 3: Changes in total annual precipitation (in mm) by the end of this century (2090 to 2099) for RCP8.5 emissions
scenario. Note that only the darkest colour indicates a decrease. The results presented here are the mean of all 188
simulations.

Precipitation Intensity
A statistically significant increase in average precipitation intensity of between 0.1 and 0.8 mm/day is
projected for most of the Central Otago district for the RCP8.5 scenario. The exception is the area
around Ranfurly as well as the north of the Manuherikia region, where it is more likely than not that
the precipitation intensity will decrease by about 0.2 to 0.6 mm/day by the end of this century under
the RCP8.5 scenario. Changes in precipitation intensity under the RCP4.5 scenario for the whole
century, and under the RCP8.5 scenario in mid-century, are largely insignificant. The exception is in

 16
the region of the Old Man Range where a statistically significant increase in precipitation intensity of
between 0.5 and 0.8 mm/day is projected by mid-century.
Maximum 1-day precipitation
Under the RCP4.5 scenario, and over the Old Man Range, the maximum 1-day precipitation is
projected to increase by about 6 mm (on average) by the middle of this century, rising to a total of 10
mm more by the end of this century. All other areas do not show a significant change in the maximum
1-day precipitation under the RCP4.5 scenario. Under the RCP8.5 scenario, where we expect greater
changes in our climate, the maximum 1-day precipitation over Central Otago is projected to increase
between 7 and 19 mm by the end of the century. The exception is the region south-east of
Wedderburn, Nasby and Ranfurly, where only a small statistically insignificant change is projected.
The largest increase in the maximum 1-day precipitation is projected to occur over the Hawkdun
ranges, with an increase of about 25 mm.
Maximum consecutive 5-day precipitation
It is likely that the maximum precipitation over a 5-day period will increase by about 5 to 12 mm
annually (on average) over most of the district by the end of this century for RCP8.5. Similar to the
other indices described above, the Old Man Range region is projected to receive up to 19 mm more
precipitation (on average) over a 5-day period by the end of this century. The projected changes in
the Ranfurly, Roxburgh, Alexandra and St Bathans Range regions are not statistically significant at
the 1σ level (i.e. where 68% of the simulations fall within that range).
Heavy rainfall days (more than 10mm)
Heavy precipitation days are projected to significantly increase over the western areas of the district
with about 3 to 7 more days per annum (on average) with precipitation of more than 10 mm/day
occurring by the end of this century under the RCP8.5 scenario (Figure 4). Again, the maximum
change in heavy rainfall days is projected to occur over the Old Man Range. The projected changes in
other regions of the district are statistically insignificant.

 17
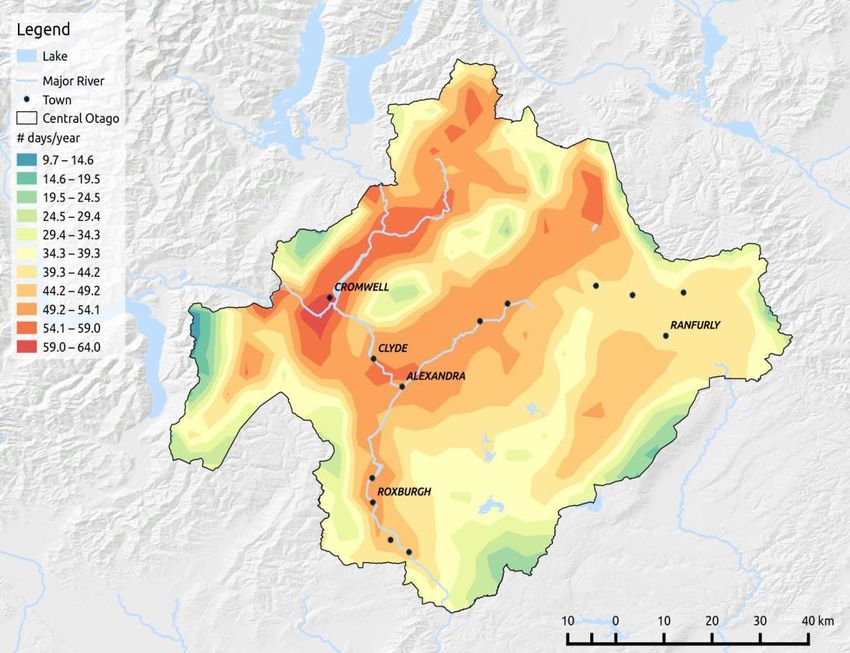
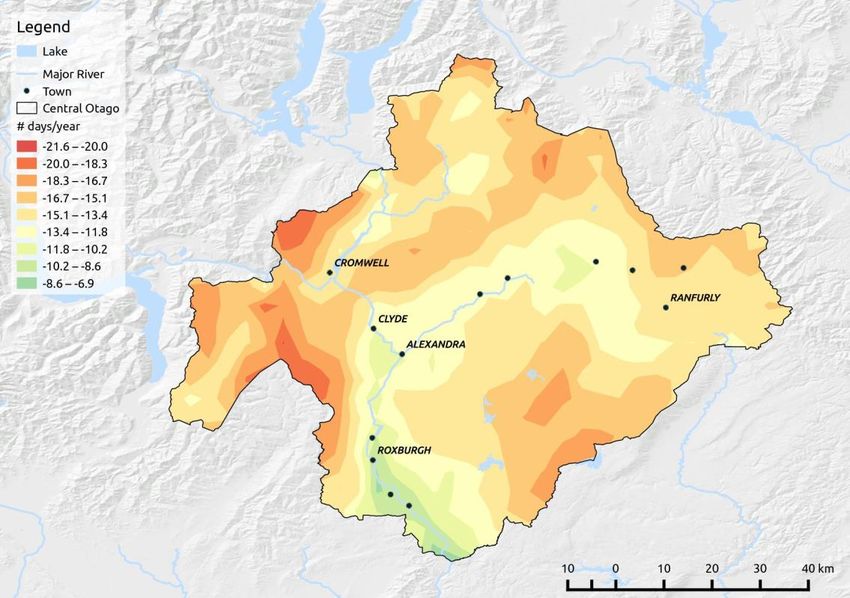
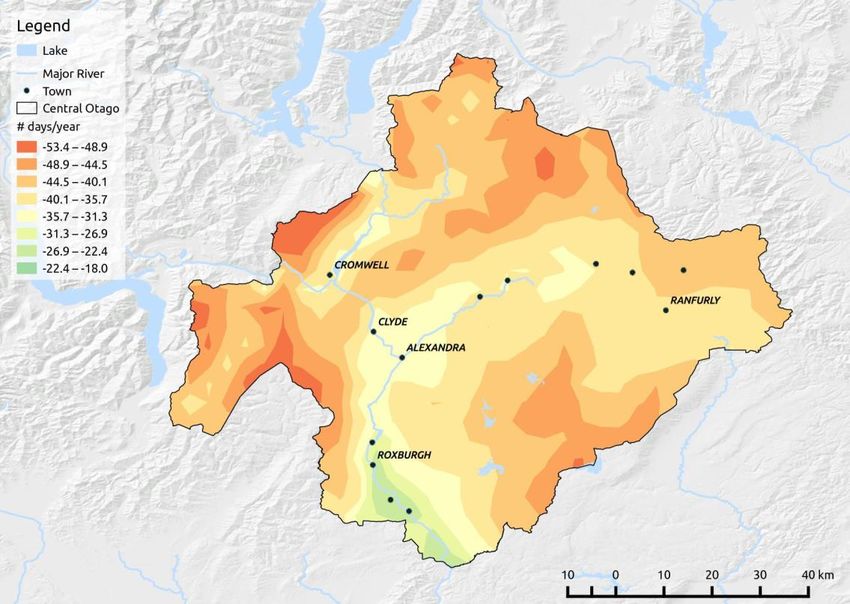
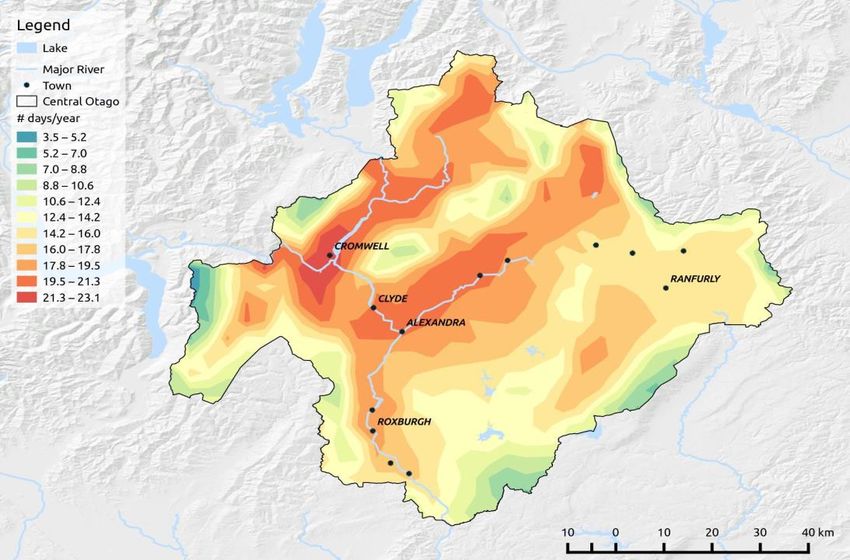
Figure 4: Changes in the number of heavy rainfall days (more than 10 mm) by the last decade of this century (2090 to 2099)
for RCP8.5 emissions scenario. Note that only the darkest red colours indicate a decrease. The results presented here are the
mean of all 188 simulations.

Length of dry spell/Length of wet spell
The model simulations do not project statistically significantly changes in the length of the dry and wet
spells by the end of the century for all emissions scenarios for the Central Otago district.

5.2.2. Temperature
The projected changes in temperature under the RCP8.5 scenario for selected indices through this
century are shown in Figures 5 and 6. The indices presented below are the decadal averages taken
from 188 model simulations for the emissions scenario of interest.
Salient features of projected changes in temperature by the end of the century, for Central Otago,
obtained from the simulations made under the highest greenhouse emissions scenario (RCP8.5) are:
 ● About 18 to 53 fewer frost days per annum compared to the baseline period (2000 to 2009).

 ● About 10 to 61 more days per annum with a maximum temperature above 25॰C.
 ● That on average, the highest maximum temperature occurring annually increases by 3.7-
 5.8॰C with the biggest change occurring in the Old Man Range area.

 ● That on average, the lowest minimum temperature reached annually increases by 1 to 3.2॰C,
 with the largest change projected in the Hawkdun Range area.

Summer Days (days exceeding 25॰C)
The model simulations project that the by the middle and end of this century the district is likely to
experience 3 to 23 and 10 to 64 more summer days, respectively, compared to the baseline period

 18
(2000-2009). The largest changes will occur around the Clutha, Lake Dunstan and Manuherikia areas
where the number of days with the maximum temperature exceeding 25॰C will increase by 48 to 64
days by the end of this century.

Figure 5: Change in the number of summer days per year (maximum temperature above 25॰C) for the 2040 to 2049 period
(top) and the last decade of this century (2090 to 2099) (bottom) for RCP8.5 emissions scenario. Note the colour scale changes
between panels. The results presented here are the mean of all 188 simulations.

 19
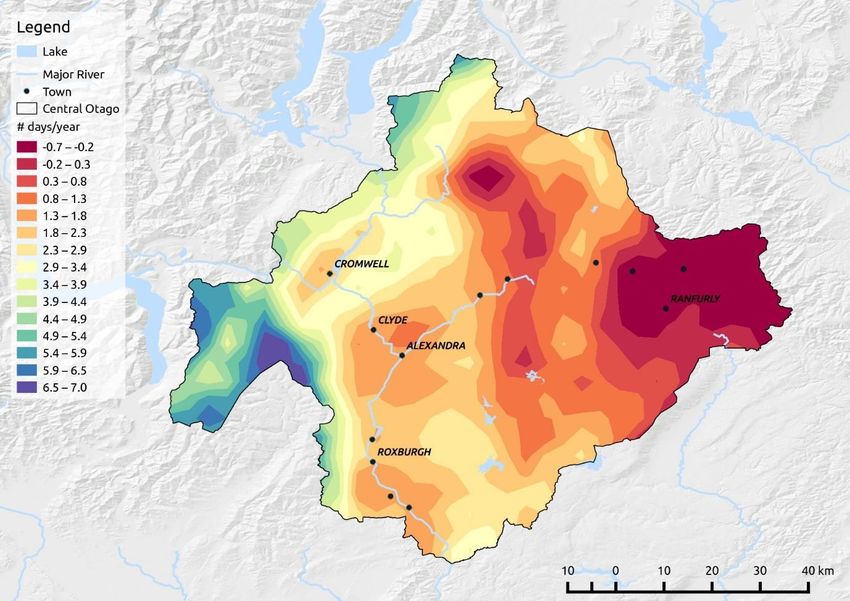
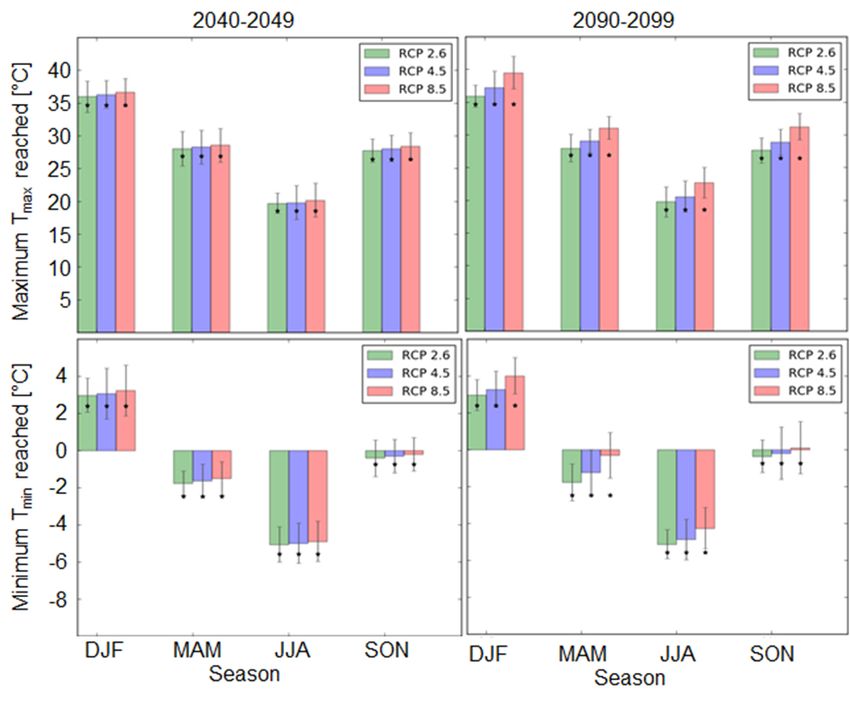
Frost Days
The number of frost days per year in the Central Otago district is likely to reduce by 7 to 22 days per
annum under RCP8.5 by mid-century and by 18 to 53 days per annum by the end of this century
compared to the baseline period (2000-2009). By mid-century, the regions around Manuherikia and
Clutha rivers are projected to experience 7 to 12 fewer frost days than in 2000-2009 while by the end
of this century these numbers will increase to 18 - 36 fewer frost days (Figure 6). The western part of
the district (Old Man Range area) will likely experience the biggest reduction in frost days with 17 to
22 fewer frost days by the middle and 41 to 53 fewer frost days by the end of this century. The south-
eastern areas of the district is projected to experience 15 to 18 fewer frost days by the middle of this
century and 41 to 49 fewer frost days by the end of this century.
Highest maximum temperature/Lowest maximum temperature
Overall, the Central Otago district is likely to become warmer over the course of this century with a
positive change in the highest and lowest maximum temperature reached over a ten-year period. The
highest maximum temperature reached in the district by the middle of this century is projected to be
between 1.6 and 2.6oC higher than in 2000-2009, and will likely increase by up to 5.8oC by the end of
this century under RCP8.5. The largest changes in maximum temperatures will occur over the Old
Man and Hawkdun Ranges. On average, the lowest maximum temperature reached by the middle of
this century is projected to increase by 0.2 to 0.4oC in the Manuherikia region and the southern parts
of the district. By the end of this century the lowest maximum temperatures in the Manuherikia region
and southern parts of the district are projected to increase by 1 to 1.6 oC. Overall, the change in the
highest maximum temperatures (extremes) are more pronounced in the projections than the changes
in the lowest maximum temperatures.
Highest minimum temperature/Lowest minimum temperature
Similar to the maximum temperatures, the minimum temperatures occurring in the district are likely to
increase, thereby contributing to the overall warming of the Central Otago district. On average,
highest minimum temperatures are projected to increase between 0.1 and 1.2oC (mid-century) and
0.7 to 3.0oC (end of the century) under RCP8.5 with the largest changes occurring in the Manuherikia
and Cromwell regions, as well as the northern parts of the district. The highest minimum temperature
is projected to increase between 0.7 and 1.2oC over the areas located on the eastern side of the
Rough Ridge Range by the end of this century. Slightly different patterns are projected for the
changes in the lowest minimum temperatures across the district, with the largest increase in the
lowest minimum temperatures of about 2.1 and 2.6oC (on average) occurring along the northern and
eastern boundaries of the district as well as over the Old Man Range region. The smallest changes
are projected to occur in areas lying south of Roxburgh with an increase of 0.7oC by the end of this
century.
Seasonality
The impact of climate change on maximum and minimum temperatures across the seasons for a
number of selected locations in Central Otago is presented below. The results represented below are
decadal means over all 188 simulations for the emissions scenario of interest and season and the
error bar represents 1 (i.e. 68% of the simulations fall within that projected range). The figures
corresponding to the findings described below can be found in Appendix D.

 20
Figure 6: Change in the number of frost days per year where the minimum temperature is below 0oC averaged over the 2040
to 2049 period (top) and the last decade of this century (2090 to 2099) (bottom) for RCP8.5 emissions scenarios. The results
presented here are the mean of all 188 simulations.

 21
Alexandra
The model simulations project that for the high emissions scenario, the maximum temperature
reached in summer and spring increases by about 4-5oC by the end of this century compared to the
start of the century, while autumn and winter will reach maximum temperatures that are about 3.8 oC
higher (Figure 7). The change in the maximum temperature in the mid-century period of about 0.9 and
2oC, depending on the emissions scenario, is not statistically significant at the 1 level. Statistically
significant changes in the minimum temperatures are projected to occur by the end of this century
under the high emissions scenarios. The lowest minimum temperature reached in the last decade of
the century is likely to increase by 2.8oC in autumn, and about 2oC in winter compared to the baseline
period (2000-2009). The lowest springtime minimum temperatures are largely unaffected by changes
in greenhouse gas concentrations. Overall, the summer in Alexandra is likely to get warmer by the
end of the century with the lowest minimum temperatures increasing by about 1.8 oC under RCP8.5.

Figure 7: Average maximum Tmax and average minimum Tmin reached over the 2040 to 2049 decade (left) and 2090 t0 2099
decade (right) for all three emissions scenarios for Alexandra. The black stars show the baseline values, i.e. the mean value
over 2000-2009 and the error bars represent 1 . If the black star falls outside the 1 range, the results indicate that the change
in temperature is statistically significantly different from the baseline value at the 1 level.

Roxburgh
Under the RCP8.5 emissions scenario, the highest maximum temperature in summer and spring that
will be reached by 2100 is projected to be 5oC higher than at the beginning of the century. The
changes in autumn and winter are smaller, with the highest maximum temperature reached over the
last decade being 4oC higher compared to the baseline period, (i.e. slightly bigger change than in
Alexandra). Interestingly, the change in winter minimum temperatures is less pronounced compared

 22
to Alexandra, with the lowest minimum temperature likely to increase by about 1.5 oC in winter, while
the lowest minimum temperature in autumn is projected to increase by more than 2oC under RCP8.5.
In spring time, the likelihood of frost days is negligible by the end of this century, with the lowest
minimum temperature being positive on average. Under the RCP4.5 emissions scenario, all changes
in the highest maximum temperature and lowest minimum temperatures are not statistically
significant.
Ranfurly
Similar to Alexandra, summer and winter time in Ranfurly are projected to get warmer over the course
of this century. While the changes in the mid-century period remain small, significant increases in
maximum and minimum temperature are projected to occur in the last decade of this century under
the high emissions scenario. The largest changes are projected to occur in autumn and winter, with
the highest maximum temperature reached increasing by about 5 oC. The changes in the other
seasons are similar to what is projected for Alexandra, an increase in the highest maximum
temperature of 4-5oC. The lowest minimum temperature increased by about 1.5oC in summer, while in
autumn and winter minimum temperatures are projected to increase by more than 2૦C by the end of
this century. Similar to Alexandra, the projected changes in minimum temperatures are not statistically
significant during spring.
Tarras
The highest maximum temperature in Tarras is projected to increase by up to 5 oC in summer and
spring, with lower increases to be expected in autumn and winter (up to 3.8oC higher) in the last
decade of this century and under the RCP8.5 emissions scenario. In contrast to Ranfurly and
Alexandra, the changes in the lowest minimum temperatures by the end of the century are statistically
significant during spring time for the high emissions scenario, with a projected increase of 1.5 oC.
During autumn and spring of the last decade of this century, the likelihood of frost days (where the
minimum temperature is less than 0oC) decreases under the high emissions scenario. During summer
and winter, the lowest minimum temperatures are projected to increase by about 2 oC under the high
emissions scenario.

5.2.3. Snow Volume Projections
Climate change is likely to have a large impact on mountain snowpacks in Central Otago. Especially
in the high emissions scenario (RCP8.5), very little snowpack and resultant water storage will remain
on the top of the mountain ranges within the Central Otago district by the end of this century. Some
of the key results obtained from the snow simulations are:
 ● Significant reduction in water storage in snowpacks and earlier onset of melt by the end of
 this century under the RCP8.5 scenario.
 ● By the end of the century and under the RCP8.5 scenario, the average maximum water
 storage in snowpacks on the three mountain ranges considered, i.e. Dunstan, Old Man
 Range, and Rough Ridge, is likely to reduce by more than 75% compared to the baseline
 period, 2000 to 2009.
 ● The melting of the snow will occur earlier in the season (mid-July compared to beginning of
 August) for RCP4.5 and 8.5 scenarios by mid and end of the century.
The mean snow storage index for the Old Man Range in Central Otago over three 10-year periods
(i.e. 2000-2009, 2040-2049 and 2090-2099) is shown figure 8. Similar results have been obtained for
the other two mountain ranges (not shown). The snow storage index describes the total volume of
water stored in the winter snowpack (volume of snow water equivalent) across a mountain range. It is
expressed as a percentage of the average annual volume of maximum snow water equivalent in the
baseline period (2000-2009). The average annual maximum snow water equivalent volume is derived
from model estimates of snowfall and snow melt at each grid cell using the model described in Clark

 23
et al. (2009). The daily mean values derived from the six model simulations over the decade of
interest for RCP2.6, RCP4.5 and RCP8.5 are shown in Figure 8 together with the 1 uncertainty
range (vertical bar) for mid-July.

Figure 8: Mean snow storage index obtained from the six model simulations over the decades as shown in the legend for the
Old Man mountain range for RCP2.6 (left), RCP4.5 (middle), and RCP8.5 (right) emissions scenarios. The indicative spread in
the model simulations for 21 July is shown on the far right of each panel (vertical bar).

Our results are consistent with work carried out by Jobst (2016) to investigate the impact of climate
change on river flow within the Clutha/Mata-Au catchment. In addition, his findings indicate that
climate change will lead to substantial increases in streamflow during winter and declines in summer,
driven by increasing winter precipitation and a reduction in snow storage. Projected change in the flow
regime for the Clutha River at Balclutha is shown in Figure 9 (from Jobst, 2016).

Figure 9: Modelled Clutha streamflow during the 2090s for moderate (orange shading), and high (grey shading), CO2
emissions scenarios compared with historic simulations (blue). The dashed line is the average of both emissions scenarios
(Jobst, 2016 - his figure 5.7(b)).

 24
6. Implications for the Central
 Otago District
This section describes a range of possible impacts and implications as a result of projected climate
changes in the district.

6.1. Irrigation and drought
Droughts are complex hydrologic phenomena subject to influence by numerous factors, including
temperature, wind speed, atmospheric humidity, and precipitation rates. Climate change is expected
to quicken the set-in speed and intensity of droughts (Trenberth et al., 2014). However, timing of
drought is also important: drought in late summer when plants have largely completed their growth
phase does not have the devastating impact of late winter/early spring drought that prevents
achievement of full productive potential (McGlone et al., 2010).
For Central Otago, increasing temperatures, combined with changes in rainfall patterns and a
dwindling snowpack, are more likely than not to increase the risk of drought. It is difficult to pinpoint
either the timing or location of such drought events, but given the dryness of the district, it is likely that
water users will seek continued expansion of irrigation activities. With many water permits across the
district expiring in 2021, and the regional council reviewing minimum flows in rivers and streams, it will
be important for the impact of evolving changes in the climate to be considered in water allocation
decision-making.

6.2. Land-use change
Changes in land use may include areas in cropping or used for various farming, residential or
industrial purposes. Such changes may be driven by climate changes that alter the elevation or
latitude at which certain activities can occur, as well as changes in snow cover (e.g., snow line
elevations or latitudes). For example, the warming climate may mean that grapes are able to be
grown in areas further south or at higher elevation than their current extent (although it is noted that
other factors such as rainfall and soil type are also critical in the viability of such crops). Afforestation
with exotic tree species may lead to reductions in catchment water yield, with negative impacts on
streamflow and freshwater biodiversity. Some specific changes that will have implications for land-use
are:
 ● Higher temperatures may allow for different crop types to be grown across the district.
 ● It is likely that crops could be sown earlier in the growing season and will reach maturity faster
 due to higher temperatures.
 ● Stock may be susceptible to increased heat stress.
 ● Changes in the range and habitat of native flora and fauna, as well as the distribution of pest
 species could also impact on land-use.
 ● Changes in the timing of seasonal activities such as flowering, breeding, and migration.
 ● Grapes thrive when plants are well watered for the first part of the growing seasons, but then
 deficit irrigated until harvest, so rainfall in spring and early summer provides needed water
 and reduces irrigation costs, rainfall later in the season can reduce fruit quality (Girona et al.,
 2006).

 25
6.3. Emergency Management
From a weather and climate perspective emergency management is chiefly concerned with extreme
events. A number of event types are considered here.
Flooding: An increased likelihood of extreme rainfall events leads to a parallel increase in the
likelihood of flooding. However, a range of other factors contribute to the overall impact of flooding,
including protection measures, catchment modification, land-use, presence or absence of snow, and
water extraction.
Snowfall: Extreme precipitation events may occur during winter storms, resulting in high snowfall
events. Very high snowfall has implications for road hazard, including avalanche risk. An increase in
motor vehicle accidents is one possible outcome from such conditions. A reduction in the volume of
water stored as snow over the winter months (due to higher temperatures) may also lead to increased
erosion as rainfall is able to more immediately runoff from hill country areas.
Freezing: A reduction in the number of frost days is likely to see a reduced hazard from ice on roads,
reducing the danger of motor vehicle accidents, and in the need for anti-icing road treatments such as
CMA (Calcium Magnesium Acetate).
Heatwave: From an emergency management perspective the primary concern relates to heat stress
and human health, which may put pressure on the health system to cope. Increased mortality has
been observed in heatwaves overseas, particularly for vulnerable age groups (the very young and the
very old).
Fire: Increased temperatures, combined with drought conditions, heighten the risk associated with
wild-fire. The primary risk is forest fire, and is increased in forested areas in close proximity to
settlements (e.g., Naseby).

6.4. Sustainability
The UN’s ‘Sustainable Development Goals 5’, include a wide range of sustainability concerns
(including economic and social) which from an environmental perspective capture the need for clean
water, clean energy, sustainable communities, resilient infrastructure, responsible consumption and
production, and the urgent need to take action on climate change. In the context of this report we are
interested in both sustainable land-use and behaviour change.
Sustainable land-use is about ensuring that land-use activities do not cause long-term, detrimental
effects that may be irreversible. For the Central Otago district, one of the main considerations is the
use of water to enhance land-productivity, whilst reducing natural river flows and contributing to water
quality issues. This has knock-on effects for native flora and fauna, both on the land which is irrigated,
and within the river catchments.
Behaviour change involves encouraging people to first recognise that an issue exists in the way that
current activities are undertaken, then modifying their activities accordingly. It includes the promotion
of activity that will lead to better management and enhanced outcomes for the environment. In the
Central Otago context, there are a number of sub-optimal behaviours that could be targeted,
including: impacts from stock and use of fertilisers (particularly in close proximity to waterways), waste
or biomass burning and its effect on air quality, or in the urban context the use of inefficient log
burners, coal, or diesel fired burners, or the burning of wet or treated wood. In addition, positive
behaviours could be encouraged, such as the use of native plant species to create riparian strips
along waterways, providing habitat for native fauna; education around the appropriate wood to be

 26

5 https://www.un.org/sustainabledevelopment/
used in wood burners; or encouraging organisations to shift from coal-fired boilers to wood-fired, or
another technology that is less environmentally harmful.

6.5. Infrastructure
Consideration of climate change is particularly important for designing climate-sensitive infrastructure
or assets which are likely to be around for many decades, and for resource use and land development
planning over similar timescales. The CODC manages a range of infrastructure categories across the
district that are critical to ensure the smooth operation of the district for both residents and visitors
alike. These include:
Roading: One of the main considerations for roading is frost occurrence, which is projected to
decrease significantly by the end of the century. However, higher temperatures may cause issues
with road construction and heat damage (e.g., to bitumen). An additional issue is the potential for
greater damage to bridges and roads in close proximity to rivers due to flood events caused by
extreme rainfall, snowfall or snowmelt runoff.
3-waters (potable, wastewater, stormwater): Demand for potable water is likely to increase as
temperatures rise, together with a likely increase in urban development. Stormwater management
may potentially become challenging with an increased incidence of extreme precipitation events. The
stormwater system may be more frequently exposed to higher volumes of water - which may exceed
current design standards - and this should be considered in the provision of pipes and other systems
for stormwater management. Options for more resilient, sustainable or environmentally friendly (e.g,
so called blue or green infrastructure systems) could be explored.
Waste: No specific issues regarding the impact of a changing climate have been identified for solid
waste. However, there may be implications for handling of sewage sludge with increased maximum
temperatures, and an increase in green-waste as a result of improved growing conditions is also a
possibility.
Parks: Management of parks areas may be affected by changes to the availability of water from
changes to river flows as a result of changing precipitation patterns, increasing temperatures and a
reduction in snowmelt.
Urban planning: As for parks, water availability is a key consideration. In addition, the potential
impacts on stormwater networks of more extreme rainfall events should be considered in new and
existing developments. The CODC should consider planning urban growth to minimize exposure to
fire, flood, and drought as well as to other natural hazards.

6.6. Other
Hydroelectricity: Changes in the characteristics of snowfall and snowmelt have particular
implications for hydroelectric power generation, which currently relies on these contributions to the
annual catchment flow pattern. A reduction in snow storage, combined with increased temperatures is
likely to lead to substantial increases in streamflow during the winter and reductions in streamflow in
summer months. However, superimposed on this annual pattern is a likely increase in variability on a
daily, weekly or monthly basis, as the probability of higher intensity storms grows.
Mammalian pests: Warmer and drier winters are thought to extend the breeding seasons of some
mammalian predators (e.g. rodents, goats, pigs and possums).
Social effects: Climate change impacts outside the district are likely to have significant indirect
impacts on Central Otago. These include the impact of sea level rise on coastal communities, both in
New Zealand and internationally - causing a migration of people inland. Other possible effects include
increased costs for transporting goods and services as fuel price rises take effect; and the changing
demographic profile meaning an increasingly ageing population as the impacts from climate change
ramp up.

 27
You can also read