Monitoring of Photovoltaic System Performance Using Outdoor Suns-VOC
←
→
Page content transcription
If your browser does not render page correctly, please read the page content below
ll

Article
Monitoring of Photovoltaic System
Performance Using Outdoor Suns-VOC
                                                                                     Alexander C. Killam, Joseph F.
                                                                                     Karas, André Augusto, Stuart G.
                                                                                     Bowden

                                                                                     alexander.killam@asu.edu (A.C.K.)
                                                                                     joseph.f.karas@asu.edu (J.F.K.)
                                                                                     augusto@asu.edu (A.A.)
                                                                                     sgbowden@asu.edu (S.G.B.)

                                                                                     HIGHLIGHTS
                                                                                     Extracted outdoor Suns-VOC
                                                                                     parameters fall within 1% of
                                                                                     indoor lab measurements

                                                                                     Weather station data proved as a
                                                                                     scalable alternative to individual
                                                                                     sensors

                                                                                     Suns-VOC parameters can be
                                                                                     extracted at low irradiance
                                                                                     periods (i.e., sunrise)

                                                                                     This method is resilient to
                                                                                     instances of partial shading or
                                                                                     cloud coverage

Photovoltaics have historically been warrantied for 25 years, but a recent push is
being made to extend lifespans to 50 years. Data must be collected on fielded
systems to better understand degradation mechanisms and impacts from different
climates. We show how Suns-VOC, a widely used method for indoor
characterization, can be used to collect data on fielded modules without impeding
power production. This methodology can be applied to systems of all sizes and
provide analysis of impeding faults and degradation.

                                                                                     Killam et al., Joule 5, 1–18
                                                                                     January 20, 2021 ª 2020 Elsevier Inc.
                                                                                     https://doi.org/10.1016/j.joule.2020.11.007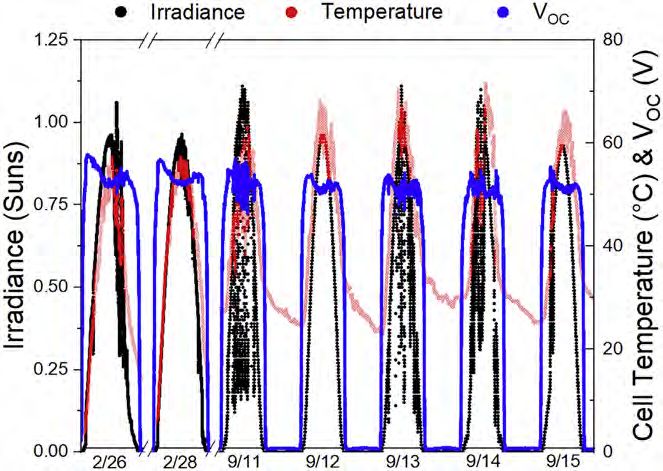
Please cite this article in press as: Killam et al., Monitoring of Photovoltaic System Performance Using Outdoor Suns-VOC, Joule (2020), https://
 doi.org/10.1016/j.joule.2020.11.007

                                                                                                                                       ll

Article
Monitoring of Photovoltaic System
Performance Using Outdoor Suns-VOC
Alexander C. Killam,1,2,* Joseph F. Karas,1,* André Augusto,1,* and Stuart G. Bowden1,*

SUMMARY                                                                                                 Context & Scale
In-field characterization of photovoltaics is crucial to understand per-                                Photovoltaics (PVs) have rapidly
formance and degradation mechanisms, subsequently improving over-                                       grown due to advancements in
all reliability and lifespans. Current outdoor characterization is limited                              efficiency and cost. PV is
by logistical difficulties, variable weather, and requirements to mea-                                  projected to increase to 48% of all
sure during peak production hours. We capitalize on Suns-VOC, which                                     renewable generation by 2050,
is widely used for laboratory measurements of single solar cells and                                    making it the fastest growing
discuss the barriers in extending the technique to outdoor systems.                                     source of energy generation.
We demonstrate the normalization of measurements using both back-                                       More emphasis has been placed
sheet temperature sensors and on-site weather stations. Despite                                         on reliability, as a path to reducing
weather variation, VOC, ideality factor, and pseudo fill factor all fall                                LCOE by improving degradation
within 1% of the laboratory measurements. It is also demonstrated                                       rates and system lifespans.
that monitoring the system VOC at 0.05 to 0.1 suns, during minimal po-
wer production, provides a figure of merit that can indicate early degra-                               We capitalize on Suns-VOC, which
dation of the system. Extensive simulations show that shading portions                                  is widely used for laboratory
of a system has minimal effect on measurements, allowing the tech-                                      measurements of single solar
nique to be used in all weather conditions.                                                             cells, and discuss the barriers in
                                                                                                        extending the technique to
INTRODUCTION                                                                                            outdoor systems of all sizes. The
                                                                                                        resulting data can provide a
Maintaining high performance fielded photovoltaic (PV) systems requires adequate
                                                                                                        thorough analysis of impeding
and informative characterization tools. In-field characterization methods are an
                                                                                                        faults and degradation. Because
essential part of performance monitoring,1 system diagnostics/detection, and attri-
                                                                                                        Suns-VOC is rather simple to
bution of premature component failure.2 Monitoring changes in power output has
                                                                                                        implement on fielded systems, it
historically been used to gauge levels of degradation, but it fails to provide insight
                                                                                                        can be a valuable tool for
on specific loss mechanisms.3,4 Indoor Suns-VOC has been used extensively to iden-
                                                                                                        collecting the data needed to
tify and quantify loss mechanisms as well as identify the early onset of losses such as
                                                                                                        better understand how
resistive shunts5 during reliability testing. In this work, we demonstrate the scalability
                                                                                                        degradation mechanisms and
of using outdoor Suns-VOC as a complementary or alternative characterization tech-
                                                                                                        climates impact different PV
nique for monitoring modules and arrays, requiring minimal hardware, and utilizing
                                                                                                        architectures. This work provides
the sun as the illumination source without impeding power production. The implica-
                                                                                                        a scalable pathway to provide the
tions of this work can be used to better understand the operation of systems of all
                                                                                                        industry with the information
sizes, ranging from small residential systems to larger powerplant sized systems.
                                                                                                        needed to achieve PV lifespans of
We also demonstrate that this method is robust for systems operating under partial
                                                                                                        beyond 50 years.
shading conditions.

At the end of 2019, 650 GW of PV was installed throughout the world, representing
over 2 billion panels operating in multiple climates with varying weather conditions.6
In 2024, projections show this number doubling. For many of these systems, the only
available performance metrics are based on power output measurements. Small,
distributed systems of heterogeneous design and configuration may not be well
characterized enough for inclusion in large fleet-scale performance datasets.7 Po-
wer-based performance metrics are clearly insufficient given variable weather condi-
tions and high DC to AC ratios, and they do not provide insight into specific

                                                                                           Joule 5, 1–18, January 20, 2021 ª 2020 Elsevier Inc.      1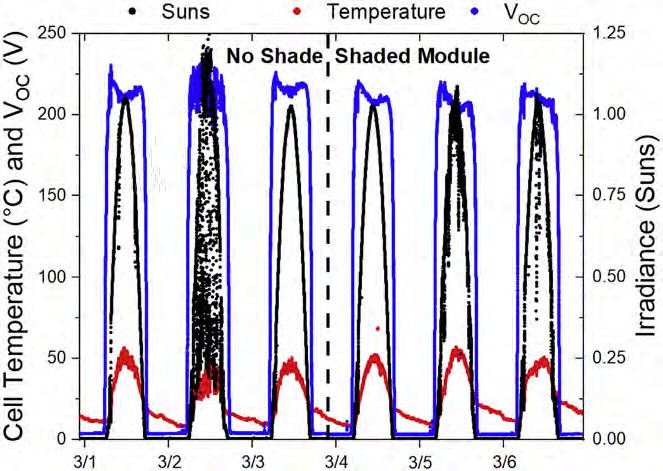
Please cite this article in press as: Killam et al., Monitoring of Photovoltaic System Performance Using Outdoor Suns-VOC, Joule (2020), https://
    doi.org/10.1016/j.joule.2020.11.007

             ll
                                                                                                                                          Article

Table 1. Detection of Common Degradation Mechanisms of Fielded PV Modules
Degradation Mechanism             Degradation      Resulting           Potential Characterization
                                  Cause            Performance         Method
Solder joint failure              Thermal          RS increase         RS from Suns-VOC9
Delamination/discoloration        Moisture,        ISC reduction, RS   Physical Inspection/RS
(resulting in corrosion)          Thermal, UV      increase            from Suns-VOC9
LID                               Irradiance       ISC & VOC           Suns-VOC10
                                                   reduction
LeTID                             Irradiance,      ISC & VOC           Suns-VOC11
                                  Tthermal         reduction
PID                               Voltage          ISC & RSH           Suns-VOC12
                                                   reduction

mechanisms for power decline. Small and large systems alike would benefit from
scalable, real-time performance metrics more robust to variable conditions that pro-
vide mechanistic insight into system performance, degradation, and failures.8

PV systems may suffer from various degradation mechanisms, influenced by cell and
module architecture, installation, and local weather and climate. Some common
degradation mechanisms, which can be evaluated and attributed with Suns-VOC or
the extracted series resistance (RS) from Suns-VOC,9 are listed in Table 1. Suns-
VOC, especially if complemented with other characterization, can provide attribution
of degradation mechanisms that affect system current-voltage (I-V) properties,
including short circuit current (ISC), open-circuit voltage (VOC), RS, shunt resistance
(RSH), etc.

Using Suns-VOC, many of the most common degradation mechanisms can be de-
tected. Most of the referenced work in Table 1 uses indoor Suns-VOC measurements
at the cell level. Outdoor Suns-VOC measurements on large systems have the poten-
tial to provide the same metrics as indoor Suns-VOC, enabling observations of these
same degradation mechanisms in fielded modules. Suns-VOC offers an alternative to
power-based performance data and is relatively simple to implement on systems of
all sizes. We believe that by implementing Suns-VOC on outdoor systems, the PV
community can begin collecting more datasets on systems of different sizes, cell
types, and climates, effectively providing the data needed for more thorough reli-
ability and degradation analyses.

Current techniques of acquiring data tend to only provide data at maximum power
points and can pose difficulties for scaling to larger plants. I-V curves are a common
method for in-field characterization of diode properties but can create logistical dif-
ficulties in large fields, such as disconnecting and reconnecting modules, or
acquiring enough measurements to provide an accurate statistical representation
of the overall system. These logistical difficulties interrupt power production during
measurements and prevent scalability. Novel techniques, such as characterization
using aerial imaging, provide scalable alternatives to the logistical complications
                                                                                                        1School of Electrical, Computer and Energy
of I-V measurements, but these methods are not able to measure circuit parame-
                                                                                                        Engineering, Arizona State University, Tempe, AZ
ters.13 Furthermore, power or I-V analysis is typically restricted to unshaded, clear                   85287, USA
sky periods, meaning that data from systems with persistent shade or poor                               2Lead   Contact
prevailing irradiance are either excluded from large fleet-scale analyses14 or requires                 *Correspondence:
statistical translations of data from shaded conditions to hypothetical clear sky con-                  alexander.killam@asu.edu (A.C.K.),
                                                                                                        joseph.f.karas@asu.edu (J.F.K.),
ditions.7 Here, we present a direct measurement, Suns-VOC, that is relatively simple                    augusto@asu.edu (A.A.),
to collect, can be collected at times of low irradiance, and is robust to partial                       sgbowden@asu.edu (S.G.B.)
shading.                                                                                                https://doi.org/10.1016/j.joule.2020.11.007

2       Joule 5, 1–18, January 20, 2021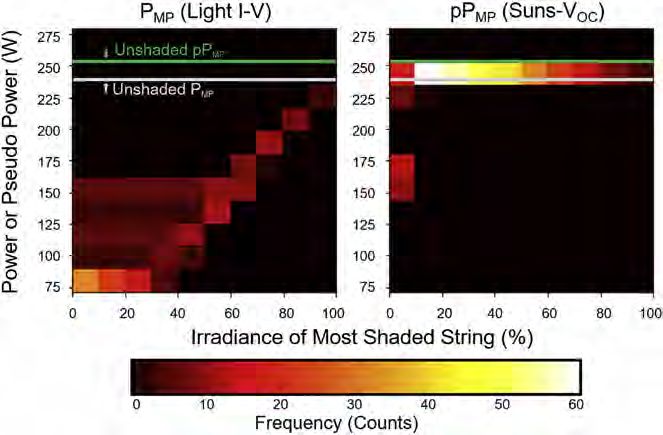
Please cite this article in press as: Killam et al., Monitoring of Photovoltaic System Performance Using Outdoor Suns-VOC, Joule (2020), https://
 doi.org/10.1016/j.joule.2020.11.007

                                                                                                                                      ll
Article

Figure 1. Light I-V and Suns-VOC Curves
Comparison of simulated light I-V and Suns-V OC for a typical silicon solar cell.

Suns-VOC has previously been demonstrated outdoors on modules and arrays,15–18
but without details regarding day-to-day variation and impacts from uncontrollable
weather. Variations include transient, diurnal, and seasonal effects like cloud
coverage,19 temperature changes,20 wind,21 angle-of-incidence changes,22 spectral
effects,23 albedo,24 and soiling.25 Robust characterization techniques must be able
to normalize data obtained in changing conditions. Temperature is the most crucial
variable in this study due to the drastic impact it has on PV’s VOC. Temperature vari-
ation is also the biggest difference between indoor and outdoor measurements, and
the ability to correct for temperature enables the use of the existing literature base in
Suns-VOC. In this work, we show how to use Suns-VOC in outdoor conditions, by
normalizing the temperature effects during measurements using both backsheet
and ambient temperature.

Irradiance effects, such as spectrum shifts, are of secondary importance since the
VOC varies with the logarithm of the light intensity, and the irradiance sensor has
the same characteristics as the array. Indeed, we show below that the gross effect
of shading has a minimal effect on the Suns-VOC measurements.

Suns-VOC allows the construction of a pseudo I-V curve (Figure 1), which is equivalent
to the standard I-V curve described above but without the effects of RS.5 The mea-
surement provides estimations of recombination-related parameters that limit the
fill factor (FF), which are difficult to discern from light I-V curves alone.26,27 Suns-
VOC provides the following parameters: the Suns-VOC curve maximum power point
and fill factor, i.e., pseudo max power and pseudo FF (pPMP and pFF), two-diode pa-
rameters fitted to the Suns-VOC curve (J01 and J02), and diode ideality factor (n) as a
function of cell operating point.

In addition to the parameters derived directly from the Suns-VOC curve in the previ-
ous paragraph, comparing the light I-V curve with the Suns-VOC curve (Figure 1) en-
ables the accurate measurement of RS, given by Equation 1:

                                                   DV
                                            RS =      ;                             (Equation 1)
                                                    I
where DV is the voltage difference between the corresponding Suns-VOC and the
light I-V curve, and I is the current. In this paper, we present VOC at 1 and 0.1

                                                                                                               Joule 5, 1–18, January 20, 2021       3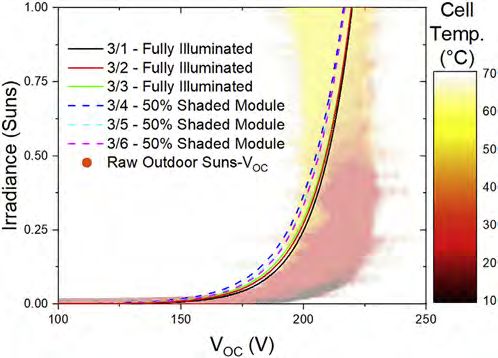
Please cite this article in press as: Killam et al., Monitoring of Photovoltaic System Performance Using Outdoor Suns-VOC, Joule (2020), https://
    doi.org/10.1016/j.joule.2020.11.007

             ll
                                                                                                                                         Article

Table 2. STC Ratings of BSM230 PV Modules
 Module Electrical Parameter                                                   Nominal Values

 PMP                                                                           230 (G 5%) W
 IMP                                                                           4.82 (G 5%) A
 VMP                                                                           48.05 (G 5%) V
 ISC                                                                           5.23 (G 5%) A
 VOC                                                                           58.6 (G 5%) V

suns, pPMP, and pFF, but other parameters might also be of interest, particularly for
attribution of degradation mechanisms.28

Indoor Suns-VOC uses a slowly varying-intensity light source to excite the cell over several
orders of magnitude of irradiance.29 The irradiance is measured in Suns, a convenience
unit to describe fractions of 1 kW/m2. Outdoors, the diurnal changes in the solar insola-
tion (including just before sunrise and just after sunset) provide the required changes in
light intensity. The most critical point in a Suns-VOC measurement corresponds to the
maximum power point (MPP) on the one-sun I-V power curve. Since the voltage across
the diode is the same in both cases, the excess carrier concentrations are roughly equiv-
alent, even though the Suns-VOC measurement is at open-circuit while the MPP is under
load. The equivalence in operating points means they have the same levels of recombi-
nation, and quantifying losses in the Suns-VOC measurement applies directly to the IV
curve. The illumination in suns required to capture information about MPP, Suns(MPP) is
related to one-sun ISC and IMP by Equation 2:

                                                     ISC  IMP
                                      SunsðMPP Þ =                                   (Equation 2)
                                                         ISC
Based on the CEC database,30 the Suns(MPP) for roughly 95% of commercial silicon
modules falls within the range of 0.05 to 0.1 suns. Therefore, the most valuable Suns-
VOC data are during low-illumination periods of up to 0.1 suns, where the impact on
system output is low. The Suns(MPP) is likely to change slightly over time, which is a
result of ISC and/or IMP degradation. A study of degradation rates of 12 different sil-
icon modules found most severe ISC and IMP degradation of 0.71% and 0.89% annu-
ally.31 These degradation rates correspond to a Suns(MPP) increase of approximately
0.002 suns per year, or 0.05 suns over 25 years, for most modules in the CEC data-
base. Therefore, Suns-VOC might need to be monitored slightly beyond Suns(MPP) to
account for possible future degradation.

The simplest implementation is to measure temperature-corrected array VOC from
0 suns to at least Suns(MPP) and tracking it over time. This allows for monitoring
the array before the start-up voltage for most inverters. Another simple implemen-
tation would be to track temperature-corrected DC voltage at maximum power
(VMP) against incident irradiance (Suns-VMP).32 This technique allows for data collec-
tion during normal MPP-tracked system operation but does not remove the RS contri-
bution from resulting pseudo I-V curves. Comparison of Suns-VMP and Suns-VOC
data allows RS estimation and more advanced degradation analysis.

The operating temperature of a PV module undergoes rapid changes during sun-
rise and sunset, which corresponds to the light intensities of interest. For accurate
temperature normalization, these temperature changes need to be accurately
monitored, with special consideration given to the spatial distribution of module
temperature. Non-uniform irradiance, wind conditions, and unmatched cell effi-
ciencies may cause non-uniform temperature distribution.33 The backsheet

4       Joule 5, 1–18, January 20, 2021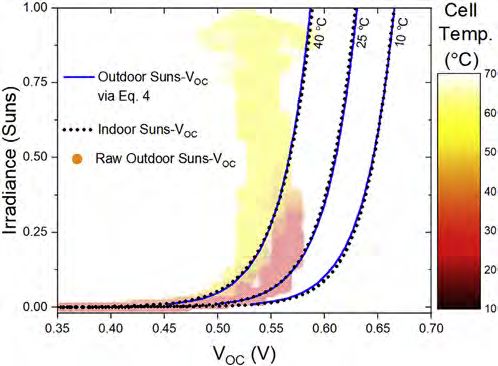
Please cite this article in press as: Killam et al., Monitoring of Photovoltaic System Performance Using Outdoor Suns-VOC, Joule (2020), https://
 doi.org/10.1016/j.joule.2020.11.007

                                                                                                                                      ll
Article

Figure 2. Simulated Shading Impacts on Light I-V and Suns-VOC Curves
Simulated light I-V and Suns-V OC curves of a 96-cell module using the equivalent solar cell circuit
under four different illumination conditions; 100% illumination, 50% shading for a single cell, 50%
shading for two cells within different strings, and 50% shading for three cells within different strings.

temperature was measured and used to calculate the cell temperature via
Equation 3.34 The VOC was then normalized to a specific temperature using Equa-
tion 4.35 Both Equations 3 and 4 are examined in more detail under the Experi-
mental Procedures section.

                                 TCell = TBacksheet + ðSuns 3 3 CÞ                      (Equation 3)

                                 Voc = b0 + b1  lnðSunsÞ + b2  T                       (Equation 4)

RESULTS AND DISCUSSION
Partial Shading Affects I-V but Not Suns-VOC
Partial to near-complete shading complicates the analysis of module and array I-V
curves. Bypass diodes create ‘‘stepped’’ I-V curves in partial shade; these stepped
curves are typically filtered out when performing long-term analysis on large I-V
curve datasets.36 Here, we use LTspice (Linear Technology Corp) circuit modeling
to demonstrate the stability of Suns-VOC curves obtained from varying partial shade
conditions that would otherwise generate erratic stepped I-V curves.37

A model was built of a 96-cell solar module comparable with those used in outdoor
experimentation, as shown in Table 2. Individual PV cells were simulated based on a
single-diode model, using RS and RSH values of 0.01 and 300 U, respectively.38 Both
I-V and Suns-VOC measurements were simulated with various shading scenarios. Fig-
ure 2 shows modeled light I-V and Suns-VOC curves for one-sun irradiance with 50%
partial shading affecting one, two, and three cells, each from a different string.

The difference between the I-V and Suns-VOC curves with zero shading is a manifes-
tation of RS. The steps found within the shaded simulations for the light I-V curve
represent the activation of the bypass diodes. Bypass diodes are used in modules
to prevent the formation of hot spots during periods of partial shade.39 The bypass
diodes only minimally impact the Suns-VOC curves. When comparing the fully illumi-
nated model to that of the three shaded cells, the pPMP dropped by 0.2%, whereas
the light I-V PMP dropped by 35.5%.

                                                                                                               Joule 5, 1–18, January 20, 2021       5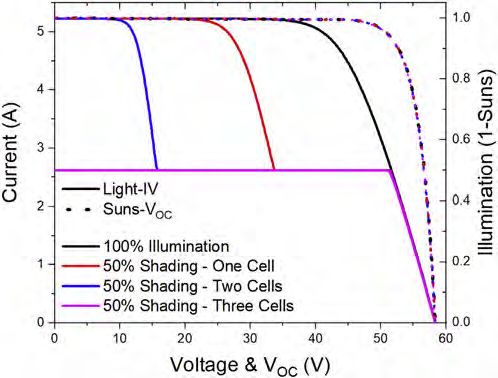
Please cite this article in press as: Killam et al., Monitoring of Photovoltaic System Performance Using Outdoor Suns-VOC, Joule (2020), https://
    doi.org/10.1016/j.joule.2020.11.007

             ll
                                                                                                                                         Article

Figure 3. Simulated Shading Impacts on PMP and pPMP
Frequency histogram displaying maximum power (light I-V) and pseudo maximum power (Suns-
V OC ) of a 3-string 96-cell module, under ~500 different partial shading conditions. String 1 and 2 are
independently shaded from 0% to 100% illumination. String 3 is maintained at 100% illumination.

To further explore the stability of Suns-VOC in widely varying partial shade condi-
tions, we extend the 96-cell module LTspice model to include many different partial
shade scenarios. These scenarios were created to demonstrate a wide range of
possible partial shade conditions but are not necessarily reflective of real-world par-
tial shading for a typical system. Figure 3 shows frequency histograms of the PMP
from I-V and pPMP from Suns-VOC, from roughly 500 different partial shade sce-
narios. Scenarios include shading affecting two of the three strings, from 0%
(completely shaded) to 100% (fully illuminated), whereas string three is held at fully
illuminated conditions. The x axis of Figure 3 corresponds to the shading level on the
most shaded of the three strings.

As seen on the left side of Figure 3, PMP varies substantially due to bypass diode activa-
tion and reduced light-generated current. For the given shading scenarios, the average
of PMP is 126 W with a standard deviation of 40.5 W. The right half of Figure 3 shows that
Suns-VOC pPMP falls within a much more tightly distributed range, with an average of
238 W and a standard deviation of 25.7 W. Suns-VOC provides a pPMP within approxi-
mately 5% of the unshaded pPMP when all strings are illuminated at values greater
than 5%. These results suggest that in systems that regularly operate in partial shade,
I-V curves, or time-series PMP data might rarely contain useful performance information.
Considering diffuse irradiance is typically well over 5% of total illumination,40 scenarios
of less than 5% absolute illumination anywhere on the module are rare, even during pe-
riods of major shading. While true pPMP requires uniform irradiance, a close estimate of
pPMP is obtained under almost all irradiance and shading conditions. Suns-VOC curves
frequently provide a value of pPMP within 5% of the true unshaded pPMP, providing a ba-
sis for robust time-series performance monitoring.

Outdoor Suns-VOC Is Equivalent to Indoor Suns-VOC Measurements
Outdoor Suns-VOC data for a single-cell module are shown in Figure 4, with transla-
tions to 10 C, 25 C, and 40 C via Equation 4. Indoor Suns-VOC measurements were
also conducted at these respective temperatures using a Sinton FCT-450 cell flash

6       Joule 5, 1–18, January 20, 2021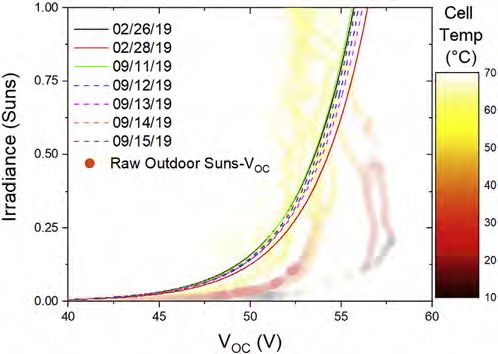
Please cite this article in press as: Killam et al., Monitoring of Photovoltaic System Performance Using Outdoor Suns-VOC, Joule (2020), https://
 doi.org/10.1016/j.joule.2020.11.007

                                                                                                                                      ll
Article

Figure 4. Temperature-Translated Outdoor Suns-VOC on Single-Cell Module
Temperature translation of outdoor Suns-V OC curves using Equation 4 compared with indoor Suns-
V OC at 10  C, 25  C, and 40  C.

tester; these curves are also displayed in Figure 4. Temperatures of 25 C are used for
standard test condition (STC) measurements, whereas 10 C and 40 C are used to
demonstrate translations to lower and higher operating temperatures. Measured
VOC datapoints are colored by cell temperature as determined from backsheet tem-
perature measurements and Equation 3. Normalizing the measured outdoor data via
Equation 4 to 10 C, 25 C, and 40 C yields an excellent agreement with the indoor
curves. Suns-VOC parameters for each outdoor temperature translation are shown
in Table 3, with the respective indoor parameters at the same temperature.

The pPMP values of the temperature-translated outdoor Suns-VOC curves are within
0.04% of the respective indoor Suns-VOC curves, indicating the validity of our out-
door measurement setup and VOC translations via Equation 4. Slightly larger per-
centage differences occur when translating to 10 C. This is likely due to the paucity
of data at such low temperatures for generating fit coefficients, considering the
average outdoor operating temperature was approximately 35 C. Translating
data to temperatures closer to the average operating temperature results in a
more accurate fit. The specified translation temperature is best chosen given the
average operating temperature of a given site or season.

The measurement error when comparing outdoor to indoor measurements must be less
than the percentage of expected degradation to ensure viability. Modules are typically
warrantied for 1% degradation of maximum power per year. The measurement error
for outdoor compared with indoor measurements equate to less than 0.04% error for

Table 3. Suns-VOC Parameters on a Single-Cell Module for Both Indoor and Normalized Outdoor
Measurements
                   RS (U-cm2)   VOC at 1 Sun (V)   VOC at 0.1 Suns (V)   n      pFF     pPMP (W)

 10 C    Indoor    2.89         0.665              0.603                 1.00   0.834   4.71
         Outdoor   2.72         0.665              0.599                 1.02   0.831   4.70

 25 C   Indoor    2.95         0.629              0.563                 1.11   0.821   4.39
         Outdoor   2.96         0.630              0.564                 1.12   0.820   4.39
 40 C   Indoor    3.01         0.589              0.519                 1.27   0.803   4.02
         Outdoor   3.02         0.587              0.520                 1.25   0.806   4.02

                                                                                                               Joule 5, 1–18, January 20, 2021       7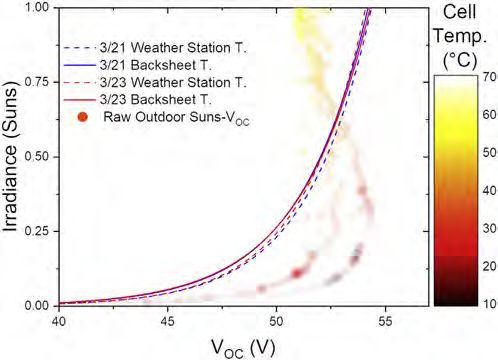
Please cite this article in press as: Killam et al., Monitoring of Photovoltaic System Performance Using Outdoor Suns-VOC, Joule (2020), https://
doi.org/10.1016/j.joule.2020.11.007
ll
Article
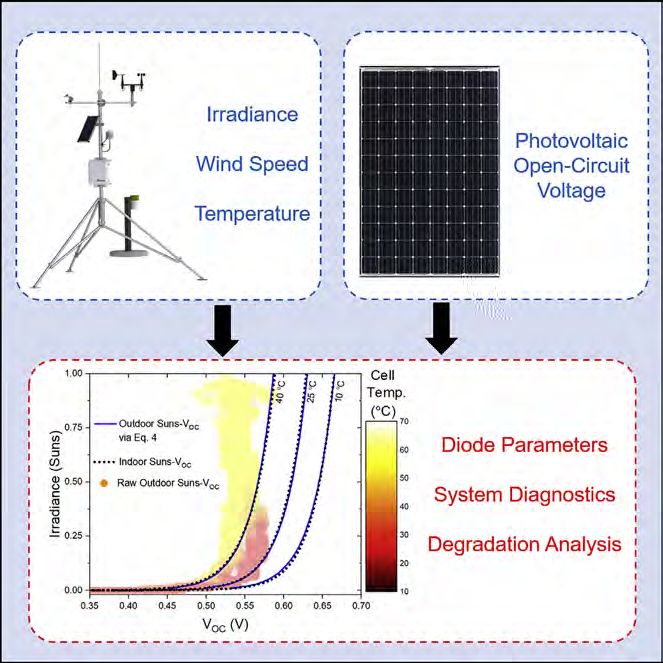
Figure 5. Raw Data for a 96-Cell Module
Solar irradiance, cell temperature, and measured V OC for a 96-cell PV module located in Tempe, AZ,
USA during February and September of 2019.
pPMP, when analyzing using 25 C and 40 C for temperature translations. Because the mea-
surement error is significantly less than the typical warrantied degradation, one should be
able to use these data to make a reasonable assumption regarding rates of degradation.
Implementing Outdoor Suns-VOC on Modules
Outdoor Suns-VOC on one 96-cell module is shown in Figure 5. The data include irra-
diance, cell temperature, and measured VOC from 2 days in northern hemisphere
winter (February) and 5 days in autumn (September).
Each day was analyzed independently to quantify the variation introduced by daily
and seasonal weather changes. Figure 6 shows each day’s data individually trans-
lated to 40 C. Assuming the module had negligible degradation over this 6-month
period, each day’s Suns-VOC curve should be similar. Daily pPMP values obtained
across these days are listed in Table 4 and are within 1.3% of each other. Daily var-
iations are roughly equal in magnitude to seasonal variations, indicating that the
methodology is robust to seasonal weather variation.
Implementing a characterization technique on a large system must not interfere
with normal power production. Potentially, Suns-VOC data can be collected only dur-
ing low irradiance periods at sunrise and sunset. Testing this hypothesis, the individ-
ual daily data displayed in Figure 6 were analyzed for both the full dataset and only
considering data collected during sunrise and sunset (irradiance values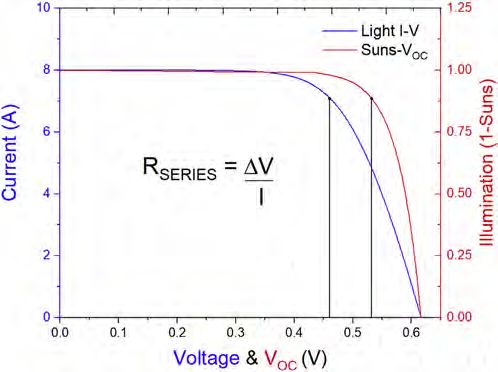
Please cite this article in press as: Killam et al., Monitoring of Photovoltaic System Performance Using Outdoor Suns-VOC, Joule (2020), https://
 doi.org/10.1016/j.joule.2020.11.007

                                                                                                                                      ll
Article

Figure 6. Temperature-Translated Outdoor Suns-VOC on 96-Cell Module
Outdoor Suns-V OC curves translated to 40  C for a 96-cell module; comparing seasonal and daily
changes.

translations may also play a role in these differences; operating temperatures during
low light intensity in the morning and evening are lower than the overall average
operating temperature. The discrepancies between using data from the full day
and only periods of low illumination are consistent from day to day, with relative
average changes of 0.5% for VOC, 0.9% for pFF, and 0.4% for pPMP. Methodology
should remain consistent to ensure parameters are analogous (e.g., low illumination
only). These results suggest that Suns-VOC data collected daily, during periods of
low illumination, resulted in stable metrics within a 1% range of variation. Analyzing
longer time periods, such as weekly or monthly, averages out any day-to-day noise.
True power measurements may have daily variances on the order of 10% to 20%,
where Suns-VOC measurements are much more tightly distributed.

The data analyzed thus far have all used multiple temperature sensors attached to
the backsheet and irradiance sensors positioned in plane, close to modules. This
method is unrealistic when considering larger systems, where replacing temperature

Table 4. Suns-VOC Parameters on a 96-Cell Module Using Full Day versus SR & SS Irradiance Data
                                       VOC at 0.1 Suns (V)         pFF             pPMP (W)

 2/26/2020           Full Day          48.58                       0.809           235.7
                     SR & SS           48.96                       0.807           237.2

 2/28/2020           Full Day          49.29                       0.809           238.9
                     SR & SS           49.59                       0.806           240.2
 9/11/2019           Full Day          48.67                       0.812           236.1
                     SR & SS           48.99                       0.800           237.1

 9/12/2019           Full Day          48.92                       0.811           237.4
                     SR & SS           49.21                       0.799           238.3
 9/13/2019           Full Day          48.88                       0.807           237.0

                     SR & SS           49.06                       0.800           237.7
 9/14/2019           Full Day          48.78                       0.811           236.5
                     SR & SS           49.01                       0.803           237.4
 9/15/2019           Full Day          48.83                       0.812           236.9
                     SR & SS           49.09                       0.806           237.8

                                                                                                               Joule 5, 1–18, January 20, 2021       9
Please cite this article in press as: Killam et al., Monitoring of Photovoltaic System Performance Using Outdoor Suns-VOC, Joule (2020), https://
doi.org/10.1016/j.joule.2020.11.007
ll
Article
Figure 7. Weather Station versus Local Sensors for Outdoor Suns-VOC
Suns-V OC curves translated to 40 C for a 96-cell module using measured backsheet temperature
and weather station data.
and irradiance sensors with on-site weather station data is an alternative. Tempera-
ture translations on a 96-cell module were compared using both backsheet temper-
ature sensors and local weather station data that included pyranometer plane of
array (POA) irradiance, wind speed, and ambient air temperature. Equation 5 uses
wind speed (WS), ambient temperature (Ta ), and irradiance (E) to determine the
backsheet temperature, where a and b are empirically determined coefficients.34
We use a = 3.56 and b = 0.0750, corresponding to an open-rack polymer back-
sheet configuration.
TBacksheet = E ea + bWS ðTa Þ (Equation 5)
2 days in March were used to compare measured backsheet temperature data with
data captured from an on-site weather station. The weather station was positioned
10 m away from the module, capturing data at a frequency of 1 min. Weather sta-
tion sensors were 2 m off the ground, where modules and their respective local
sensors were ground mounted. When analyzing Suns-VOC using weather station
data, the weather station POA irradiance was used instead of the local irradiance
sensor. The resulting Suns-VOC curves, translated to 40 C, are displayed in
Figure 7.
The results show slight inconsistencies during periods of low illumination, when us-
ing measured backsheet temperature compared with the weather station data. Us-
ing weather station data yields results in Suns-VOC curve translations within G1%
of the backsheet sensor translations. The largest differences occur in periods of
low illumination. This is suspected to be due to rapid changes in operating tem-
perature during low irradiance periods. Site-dependent determination of the
empirical coefficients (a and b) used in Equation 5 could potentially yield more ac-
curate results. Table 5 displays the Suns-VOC parameters, highlighting the slight
discrepancies.
Results demonstrate that VOC and pFF are in good agreement when comparing the
values obtained from measured backsheet temperature to those gathered exclu-
sively using weather station data. In situations regarding large PV power plants,
where implementation of individual temperature sensors is unrealistic, weather
10 Joule 5, 1–18, January 20, 2021Please cite this article in press as: Killam et al., Monitoring of Photovoltaic System Performance Using Outdoor Suns-VOC, Joule (2020), https://
doi.org/10.1016/j.joule.2020.11.007
ll
Article
Table 5. Suns-VOC Parameters on a 96-Cell Module Using Measured Backsheet Temperature
versus Weather Station Data
VOC at 1 Sun (V) pFF pPMP (W)
3/21/2020 Backsheet 54.20 0.802 227.3
Weather Station 54.36 0.807 229.4
3/23/2020 Backsheet 54.30 0.800 227.2
Weather Station 54.10 0.806 228.1
station data can be used to estimate the module’s operating temperature. Overall,
across variations in day and season, with or without limiting data to low irradiance
conditions, and using only on-site weather station data, Suns-VOC results in stable
metrics within a G 1%–2% range of variation.
Implementing Outdoor Suns-VOC on Arrays
A four-module array was analyzed in March 2020 for 6 days under split conditions.
The first 3 days monitored the array’s VOC under unshaded conditions. For the last
3 days, one single module was artificially shaded at approximately 50% illumination
by applying an opaque sheet on top of the surface of the module. Each module had
three temperature sensors, totaling twelve sensors for the array. The irradiance was
measured using a single irradiance sensor 1 m from the array. The measured irra-
diance, operating temperature, and VOC are displayed in Figure 8. The resulting
Suns-VOC curves of the array are displayed in Figure 9 for each day and translated
to 40 C. Each day was independently analyzed to determine the resilience of
shading effects on Suns-VOC.
There is good agreement of the resulting Suns-VOC curves between the 3 days of
each respective split. When comparing the unshaded results with the shaded mod-
ule results, there is a slight decrease in VOC. This agrees with LTspice simulations,
Figure 8. Raw Data for a 4-Module Array
Solar irradiance, operating temperature, and measured V OC, for a 4-module array with both full
illumination and 50% partial shading on a single module.
Joule 5, 1–18, January 20, 2021 11Please cite this article in press as: Killam et al., Monitoring of Photovoltaic System Performance Using Outdoor Suns-VOC, Joule (2020), https://
doi.org/10.1016/j.joule.2020.11.007
ll
Article
Figure 9. Temperature-Translated Outdoor Suns-VOC on 4-Module Array under Various Shading
Conditions
Outdoor Suns-V OC curves of a 4-module array under normal illumination conditions and a 4-module
array with one shaded module at 50% illumination conditions. March 1 st to March 3 rd are under
normal illumination conditions. March 4 th to March 6 th are under shaded illumination conditions.
which suggest a 2–3 V drop in VOC when applying 50%–60% shading. The Suns-VOC
parameters for each day are found in Table 6.
The extracted Suns-VOC parameters are almost identical for the 3-day splits. When
comparing unshaded with shaded conditions, there is a noticeable, but expected
drop in VOC. The average delta in VOC is 2.9 V, which equates to a 3 mV drop in
VOC for each cell in the shaded module. The ideality factor and pseudo FF are almost
the same. These results suggest that Suns-VOC is resilient to significant levels of par-
tial shading across arrays.
Implementing Outdoor Suns-VOC in the Real World
Outdoor characterization techniques must be able to accurately acquire data with
minimal costs, little to no impedance on power production, and simplistic imple-
mentation in order to be effective. Implementation of these techniques may vary
based on the system type and size, as small residential systems and large utility scale
systems each present their own unique constraints.
In the United States, the average residential system size is 5 kW. These systems
offer the advantage of having smaller string sizes, providing more resolution for
Suns-VOC measurements. The disadvantage is that residential systems do not
Table 6. Suns-VOC Parameters on a 4-Module Array with Full Illumination versus ~50% Shading
on a Single Module
Illumination Conditions Date VOC at 1 Sun (V) n pFF
100% illumination 3/1/2020 219.73 1.373 0.766
3/2/2020 219.41 1.373 0.766
3/3/2020 219.41 1.373 0.765
~50% shading on single module 3/4/2020 216.30 1.373 0.764
3/5/2020 216.86 1.373 0.764
3/6/2020 216.64 1.373 0.764
12 Joule 5, 1–18, January 20, 2021Please cite this article in press as: Killam et al., Monitoring of Photovoltaic System Performance Using Outdoor Suns-VOC, Joule (2020), https://
doi.org/10.1016/j.joule.2020.11.007
ll
Article
typically have on-site weather stations for measuring irradiance and temperature.
Therefore, irradiance sensor(s) and temperature sensor(s) will need to be installed
in strategic locations around the system. Multiple sensors may be needed if sys-
tems are installed with different tilt angles, though POA irradiance may be calcu-
lated from a single sensor.41 Regarding data acquisition (DAQ), many commer-
cially available data logger solutions currently exist. These data loggers can be
placed between the PV and inverter to log data such as current, voltage, power,
and peripheral weather sensors. These data loggers will acquire all the data
needed to perform Suns-VOC (open-circuit voltage) measurements before the in-
verter(s) reach their threshold voltage, as well as perform Suns-VMP measurements
after the inverter(s) have turned on. This configuration may not be adequate if the
inverter threshold voltage is too low, resulting in irradiance levels too low for Suns-
VOC measurements. A simple DC controlled relay can be used to alleviate the issue
caused by low inverter threshold voltages while an irradiance sensor can be used
as the control for the relay, allowing the solar output to bypass to the inverter once
the Suns-VOC measurement has been conducted. For more advanced design, data
loggers can be developed specifically for the purpose of conducting Suns-VOC
measurements on residential systems.
Utility scale systems offer more flexibility due to their larger system sizes and unique
designs that may vary from powerplant to powerplant. An advantage for utility scale
systems is that on-site weather stations are placed within the fielded modules. When
designing an integrated outdoor Suns-VOC system, one must consider the proximity
of the weather stations to specific strings. If a weather station is placed too far from
specific PV strings, irradiance and temperature data may not be an accurate repre-
sentation for the respective strings. This can be problematic in instances of varying
topography during low angle of incidences, such as sunrise and sunset, and during
periods of partial shade from cloud coverage.
These powerplants may also deploy their own unique SCADA (Supervisory Control
and Data Acquisition) systems to monitor and control their generation. Capturing
Suns-VOC data by use of the SCADA is unlikely because SCADA systems do not typi-
cally capture open-circuit voltage. However, SCADA systems may be used to cap-
ture Suns-VMP data, without any new hardware.
Acquiring the open-circuit voltage measurements for Suns-VOC will be largely
dependent upon the desired resolution. When string-level resolution is desired,
DAQ hardware can be placed within the combiner boxes. There are currently several
commercially available monitoring devices, primarily used to monitor string voltages
and currents. By placing the hardware within a combiner box, one DAQ can be used
to monitor several different strings at the same time.
For higher monitoring resolution, such as individual modules, we can apply similar
approaches to that of module-level power electronics (MLPE). DAQ hardware can
be placed in parallel between individual modules, collecting open-circuit voltages
at desired ranges of irradiance. An irradiance sensor can be used as a controller
for when data should be collected, subsequently placing the module back in series
with the string. This method is benefited by having localized irradiance measure-
ments and more control precision, but it requires the use of an extra sensor. Con-
trasted to an irradiance sensor, the DAQ can simply be programmed to collect
data by specific dates and times based on the respective sun positions. Using the
date and time would not require an additional sensor, but it would need to be pro-
grammed individually based on the geographic coordinates. Finally, the module’s
Joule 5, 1–18, January 20, 2021 13Please cite this article in press as: Killam et al., Monitoring of Photovoltaic System Performance Using Outdoor Suns-VOC, Joule (2020), https://
doi.org/10.1016/j.joule.2020.11.007
ll
Article
open-circuit voltage can be used for the DAQ shutoff threshold. This would be the
simplest method to implement, yet, it would provide a more inconsistent operation.
Degraded modules may take longer to reach this threshold voltage, consequently
impeding the power production of the respective string. The approach of applying
DAQ to individual modules can be used for both residential and utility installations,
though utility installations may only sample a statistical representation of modules.
Conclusion
We show that Suns-VOC can be applied outdoors on PV modules and arrays,
providing much of the same useful diagnostic information as commonly found in in-
door Suns-VOC, including diode parameters free from the effects of series resistance.
Collection of long-term PV performance data from light I-V curves is often impeded
by logistical difficulties, variable weather, and the requirement to sweep I-V curves
during major production hours of high, uniform irradiance. The results of this study
prove that high-quality diagnostic parameters from Suns-VOC can be performed dur-
ing low irradiance conditions, perhaps even before the system voltage reaches the
inverter start-up threshold. Suns-VOC parameters derived from periods of exclusively
using low irradiance, compared with using the entire range of irradiance, yield
consistent relative deltas of 0.5% in VOC at 0.1 suns, 0.9% in pFF, and 0.4% in
pPMP. If the data collection methodology is consistent, exclusively using low irradi-
ance periods is valuable for monitoring changes over time. Outdoor Suns-VOC is
also robust against partial shading, meaning that instances of interrow self-shading
will have minimal impacts on the Suns-VOC parameters. Measurements can be ex-
pected to be within 5% of true pPMP in nearly all partial shading conditions. In our
outdoor measurements, we observe differences in performance metrics from daily
and seasonal fluctuations produce maximum variations on the order G1%. Applica-
tions may include but are not limited to reliability studies, impeding fault detection,
and performance monitoring.
We demonstrate the accuracy of temperature-translated outdoor Suns-VOC
compared with indoor measurements. For best accuracy, module temperature
should be measured meeting requirements outlined by IEC 61583, and an appro-
priate cell temperature model should be applied. On-site weather station data
comprised POA irradiance, ambient temperature, and WS, has proved to be an
effective alternative to measuring the backsheet temperature and irradiance of
each module; pPMP results are within G1% of the respective backsheet temperature
results. With appropriate temperature translation, the parameters provided by Suns-
VOC curves taken in an outdoor setting may provide reliable degradation quantifica-
tion and attribution without interfering with normal system operation.
EXPERIMENTAL PROCEDURES
Resource Availability
Lead Contact
Further information and requests for resources and materials should be directed to
and will be fulfilled by the Lead Contact, Alex Killam (alexander.killam@asu.edu).
Materials Availability
This study did not generate new unique materials.
Data and Code Availability
The code generated during this study are available at Github, https://github.
com/akillam1/Monitoring-of-Photovoltaic-System-Performance-Using-Outdoor-Suns-
Voc
14 Joule 5, 1–18, January 20, 2021Please cite this article in press as: Killam et al., Monitoring of Photovoltaic System Performance Using Outdoor Suns-VOC, Joule (2020), https://
doi.org/10.1016/j.joule.2020.11.007
ll
Article
Materials
The Suns-VOC technique was applied outdoors, using 3-string, 96-cell monocrystal-
line silicon Plurigas Solar Energias model BSM230 modules. Datasheet STC
(AM1.5G, 25 C, 1,000 W/m2) ratings of the panels are found in Table 2. Panels
were ground mounted and arranged facing due south at a 33 tilt angle in Tempe,
Arizona, USA.
Data Acquisition
To monitor the data, we used an AMT Mega328P microcontroller. A Texas Instru-
ments ADS1115 provides the analog to digital data acquisition with 16 bits of reso-
lution. We collected data approximately every 5 s for the system’s VOC, temperature
sensors, and irradiance sensor. For experiments including the weather station, the
data collection frequency was changed to every 60 s. This change was made so
the data could be correlated with the weather station’s reporting frequency.
Decreasing the frequency of measurements may be conceivable, but less measure-
ments will be possible during periods of rapid irradiance changes (i.e., sunrise and
sunset). Therefore, a minimum 60 s frequency is advised to ensure accurate results
when translating the raw data.
Irradiance Sensor
To measure irradiance, we measured the ISC of a silicon solar cell positioned in plane
with the array. It had the advantage of minimizing spectral mismatch effects between
the sensor and array,42 and by using similar encapsulant and glass on the sensor cell,
we ensured similar irradiance changes from angle-of-incidence and soiling effects.
As noted previously, irradiance accuracy is of secondary importance in Suns-VOC
measurements, so the calibration here is more stringent than needed. Indoor cali-
bration against a reference cell gave a 99.97% coefficient of determination for the
linearity of the irradiance sensor over the range of 0 to 1.2 suns. We validated the
calibration outdoors against an NREL reference cell. The array is far from objects
and shadows to minimize differences between the sensor cell and array (e.g.,
shadows cast on the irradiance sensor while the array is unshaded). The temperature
dependence of the irradiance sensor is negligible due to the minor dependence of
temperature on the short circuit current. Data presented here includes both days
with intermittent scattered clouds and persistent overcast conditions.
Temperature Sensing and Normalization
To compensate for spatial nonuniformity, the module backsheet temperature was
taken as the average of five temperature sensors, taped to the back of the module.43
The module backsheet temperature is related to cell temperature via Equation 3,
whereas 3 C corresponds to a glass/cell/polymer module mounted in an open-
rack configuration.34 Suns is the incident irradiance, expressed as a fraction, where
1 sun is equivalent to 1,000 W/m2.
Measured VOC attained at different cell temperatures must be normalized to one
specific temperature for extraction of Suns-VOC parameters. Equation 4 shows the
relationship we use between VOC and irradiance, where coefficients b0 ; b1 , and b2
are fit parameters, and T is the specified translation temperature.44 b0 is the fully illu-
minated VOC at the specified temperature, b1 is proportional to the thermal voltage
at the specified temperature, and b2 is the temperature coefficient of VOC under fully
illuminated conditions, assumed to be linear for all irradiance conditions. A least
squares fitting algorithm was used to perform temperature translations with inde-
pendent translations performed for each day of collected data. Initial guesses for
each coefficient were as follows: the module’s nameplate VOC value was chosen
Joule 5, 1–18, January 20, 2021 15Please cite this article in press as: Killam et al., Monitoring of Photovoltaic System Performance Using Outdoor Suns-VOC, Joule (2020), https://
doi.org/10.1016/j.joule.2020.11.007
ll
Article
for b0 , the thermal voltage at the specified translation temperature multiplied by the
total number of cells was chosen for b1 , and 0.0022 multiplied by the number of
cells (change in VOC per C as calculated using empirical values for silicon) for b2 .
Initial guesses are performed to enable more accurate fits. Translated results and
discussion follows in section IV.
Extraction of Suns-VOC Parameters
The collected raw data are initially filtered to remove any outliers using Isolation
Forest Methodology.45 This dataset is then translated to the desired temperature
using procedures discussed in section D. The Suns-VOC parameters are then ex-
tracted from the temperature-translated data. Open-circuit voltages in this work
are reported at 1 and 0.1 suns and can be extracted by slicing the temperature-
translated data at the respective irradiance value. As discussed earlier, VOC at
0.1 suns corresponds to VMP but without the effects of RS. VOC at 0.1 suns can
be directly used as a figure of merit for system performance and monitored over
time. Alternately, it is possible to use the Suns-VOC to extract more familiar diode
parameters.
The derivative of VOC with respect to the logarithm of the irradiance gives the diode
ideality factor, as shown in Equation 6.
q d VOC
n= (Equation 6)
kT d lnðSunsÞ
While n be presented as a curve,46 the most relevant metric for performance analysis
is from 1 sun VOC to 0.1 suns (corresponding to MPP). Taking the slope from 0.1 to 1
suns also has the advantage of being less affected by noise than the tangent.
Further analysis gives pPMP and pFF, which are the MPP and FF, respectively, in the
absence of RS. The pPMP can be estimated, as shown in Equation 7, by equating suns
to the system ISC.
pPMP = ½ð1 sunsÞ 3 ISC 3 VOC max (Equation 7)
For high resolution Suns-VOC data, pFF can be calculated, as shown in Equation 8.
½ð1 sunsÞ 3 VOC max
pFF = (Equation 8)
VOCð0:1sunsÞ
However, outdoor field data usually have insufficient resolution to determine the
maximum accurately, so we use n from Equation 6 to calculate pFF using Equations
9 and 1047:
vOC lnð vOC + 0:72Þ
pFF = (Equation 9)
vOC + 1
q
vOC = VOC (Equation 10)
nkT
These two equations also assume a single ideality factor from VOC to MPP, and we can
use the previously calculated value of n.
The temperature-translated parameters of VOC at 1 and 0.1 suns, ideality factor,
and pFF track each other, as shown in Tables 3, 4, 5, and 6. For a given system
type, VOC at 0.1 suns can be tracked directly, with changes in VOC providing an
early indication of system problems. The pFF can be similarly tracked and has
the added advantage of comparison to the more familiar FF to identify losses
caused by RS.
16 Joule 5, 1–18, January 20, 2021Please cite this article in press as: Killam et al., Monitoring of Photovoltaic System Performance Using Outdoor Suns-VOC, Joule (2020), https://
doi.org/10.1016/j.joule.2020.11.007
ll
Article
ACKNOWLEDGMENTS
This material is based upon work primarily supported by the Engineering Research
Center Program of the National Science Foundation and the Office of Energy Effi-
ciency and Renewable Energy of the Department of Energy under NSF Cooperative
agreement no. EEC-1041895. Any opinions, findings and conclusions or recommen-
dations expressed in this material are those of the authors and do not necessarily
reflect those of NSF or DOE.
AUTHOR CONTRIBUTIONS
Conceptualization, A.C.K. and J.F.K.; Methodology, A.C.K. and J.F.K.; Formal Analysis,
A.C.K. and J.F.K., Investigation, A.C.K.; Resources, A.A. and S.G.B.; Data Curation,
A.C.K. and J.F.K.; Writing – Original Draft, A.C.K., J.F.K., and S.G.B.; Writing – Review
& Editing, A.C.K., J.F.K., A.A., and S.G.B.; Supervision, A.A. and S.G.B.; Funding Acqui-
sition, S.G.B.
DECLARATION OF INTERESTS
The authors declare no competing interests.
Received: April 30, 2020
Revised: October 3, 2020
Accepted: November 5, 2020
Published: December 4, 2020
REFERENCES
1. Rezk, H., Tyukhov, I., Al-Dhaifallah, M., and 8. Munoz, M.A., Alonso-Garcı́a, M.C., Vela, N., 15. Killam, A., and Bowden, S. (2017).
Tikhonov, A. (2017). Performance of data and Chenlo, F. (2011). Early degradation of Characterization of modules and arrays with
acquisition system for monitoring PV system silicon PV modules and guaranty conditions. suns Voc. IEEE 44th Photovoltaic Specialist
parameters. Measurement 104, 204–211. Sol. Energy 85, 2264–2274. Conference (PVSC), 2719–2722.
2. Firth, S.K., Lomas, K.J., and Rees, S.J. (2010). A 9. Deceglie, M.G., Silverman, T.J., Marion, B., and 16. Forsyth, M.K., Mahaffey, M., Blum, A.L.,
simple model of PV system performance and Kurtz, S.R. (2015). Real-time series resistance Dobson, W.A., and Sinton, R.A. (2014). Use of
its use in fault detection. Sol. Energy 84, monitoring in PV systems without the need for the Suns-Voc for diagnosing outdoor arrays
624–635. I-V curves. IEEE J. Photovoltaics 5, 1706–1709. amp; modules. IEEE 40th Photovoltaic
Specialist Conference (PVSC) 2014, 1928–1931.
3. French, R.H., Podgornik, R., Peshek, T.J., 10. Fertig, F., Krauß, K., and Rein, S. (2015). Light- 17. Guo, S., Schneller, E., Walters, J., Davis, K.O.,
Bruckman, L.S., Xu, Y., Wheeler, N.R., Gok, A., induced degradation of PECVD aluminium and Schoenfeld, W.V. (2016). Detecting loss
Hu, Y., Hossain, M.A., Gordon, D.A., et al. oxide passivated silicon solar cells. Phys. Status mechanisms of c-Si PV modules in-situ I-V
(2015). Degradation science: mesoscopic Solidi RRL 9, 41–46. measurement. In Reliability of Photovoltaic
evolution and temporal analytics of Cells, Modules, Components, and Systems IX
photovoltaic energy materials. Curr. Opin. 11. Chen, R., Tong, H., Zhu, H., Ding, C., Li, H., Society of Photo-Optical Instrumentation
Solid State Mater. Sci. 19, 212–226. Chen, D., Hallam, B., Chong, C.M., Wenham, Engineers (SPIE) Conference Series., pp.
S., and Ciesla, A. (2020). 83% efficient mono- 99380N.
4. Meyer, E.L., and van Dyk, E.E. (2004). Assessing PERC incorporating advanced hydrogenation.
the reliability and degradation of photovoltaic Prog. Photovolt. Res. Appl. 23, 1–9. 18. Walters, J., Guo, S., Schneller, E., Seigneur, H.,
module performance parameters. IEEE Trans. and Boyd, M. (2018). PV module loss analysis
Rel. 53, 83–92. 12. Wilterdink, H., Sinton, R., Hacke, P., Terwilliger, using system in-situ monitoring data. IEEE 7th
K., and Meydbray, J. (2016). Monitoring the World Conference on Photovoltaic Energy
5. Sinton, R.A., and Cuevas, A. (2000). A Quasi- recovery of c-Si modules from potential- Conversion (WCPEC) (A Joint Conference of
steady-state open-circuit voltage method for induced degradation using suns-voc curves. 45th IEEE PVSC, 28th PVSEC 34th EU PVSEC),
solar cell characterization. Proceedings of the IEEE 43rd Photovoltaic Specialists Conference pp. 2204–2208.
16th European Photovoltaic Solar Energy (PVSC), 2752–2755.
Conference, pp. 1–4. 19. Nann, S., and Riordan, C. (1990). Solar spectral
irradiance under overcast skies (solar cell
13. Tsanakas, J.A., Vannier, G., Plissonnier, A., Ha,
performance effects). IEEE Conference on
6. Jäger-Waldau, A. (2019). PV Status Report D.L., and Barruel, F. (2015). Fault diagnosis and
Photovoltaic Specialists 2, 1110–1115.
2019. EUR 29938 EN (Publications Office of the classification of large-scale photovoltaic plants
European Union). https://op.europa.eu/en/ through aerial orthophoto thermal mapping. 20. Nordmann, T., and Clavadetscher, L. (2003).
publication-detail/-/publication/dfa5cde5- Proceedings of the 31st European Photovoltaic Understanding temperature effects on PV
05c6-11ea-8c1f-01aa75ed71a1/language-en. Solar Energy Conference and Exhibition, pp. system performance. 3rd World Conference
1783–1788. onPhotovoltaic Energy Conversion, 2003.
7. Meyers, B., Deceglie, M., Deline, C., and Proceedings of, Osaka 3, 2243–2246.
Jordan, D. (2020). Signal processing on PV 14. Jordan, D.C., Deline, C., Kurtz, S.R., Kimball,
time-series data: robust degradation analysis G.M., and Anderson, M. (2018). Robust PV 21. Kaldellis, J.K., Kapsali, M., and Kavadias, K.A.
without physical models. IEEE J. Photovoltaics degradation methodology and application. (2014). Temperature and wind speed impact on
10, 546–553. IEEE J. Photovoltaics 8, 525–531. the efficiency of PV installations. Experience
Joule 5, 1–18, January 20, 2021 17Please cite this article in press as: Killam et al., Monitoring of Photovoltaic System Performance Using Outdoor Suns-VOC, Joule (2020), https://
doi.org/10.1016/j.joule.2020.11.007
ll
Article
obtained from outdoor measurements in 30. Blair, N., DiOrio, N., Freeman, J., Gilman, P., 40. Kurtz, S.R., Myers, D., Townsend, T., Whitaker,
Greece. Renew. Energy 66, 612–624. Janzou, S., Neises, T., and Wagner, M. (2018). C., Maish, A., Hulstrom, R., and Emery, K.
System advisor model (SAM) general (2000). Outdoor rating conditions for
22. King, D.L., Kratochvil, J.A., and Boyson, W.E. description (Version 2017.9.5). https://www. photovoltaic modules and systems. Sol. Energy
(1997). Measuring solar spectral and angle-of- nrel.gov/docs/fy18osti/70414.pdf. Mater. Sol. Cells 62, 379–391.
incidence effects on photovoltaic modules and
solar irradiance sensors. Conference Record of 31. Smith, R.M., Jordan, D.C., and Kurtz, S.R. 41. Loutzenhiser, P.G., Manz, H., Felsmann, C.,
the Twenty Sixth IEEE Photovoltaic Specialists (2012). Outdoor PV module degradation of Strachan, P.A., Frank, T., and Maxwell, G.M.
Conference, pp. 1113–1116. current-voltage parameters. Proceedings of (2007). Empirical validation of models to
the 2012 World Renewable Energy Forum., pp. compute solar irradiance on inclined surfaces
23. Dirnberger, D., Blackburn, G., Müller, B., and 1–7. for building energy simulation. Sol. Energy 81,
Reise, C. (2015). On the impact of solar spectral 254–267.
32. Sun, X., Chavali, R.V.K., and Alam, M.A. (2019).
irradiance on the yield of different PV
Real-time monitoring and diagnosis of
technologies. Sol. Energy Mater. Sol. Cells 132, 42. Dunn, L., Gostein, M., and Emery, K. (2012).
photovoltaic system degradation only using
431–442. Comparison of pyranometers vs. PV reference
maximum power point-the Suns-Vmp method.
cells for evaluation of PV array performance.
Prog. Photovolt. Res. Appl. 27, 55–66.
24. Andrews, R.W., and Pearce, J.M. (2013). The 38th IEEE Photovoltaic Specialists Conference
effect of spectral albedo on amorphous silicon 33. Zhou, J., Yi, Q., Wang, Y., and Ye, Z. (2015). (PVSC), pp. 2899–2904.
and crystalline silicon solar photovoltaic device Temperature distribution of photovoltaic
performance. Sol. Energy 91, 233–241. module based on finite element simulation. 43. Lu, Z.H., Song, Q., Li, S.Q., Yao, Q., and
Sol. Energy 111, 97–103. Othman, A. (2009). The effect of non-uniform
25. Mani, M., and Pillai, R. (2010). Impact of dust on illumination on the performance of
solar photovoltaic (PV) performance: research 34. King, D.L., Boyson, E.W., and Kratochvil, J.A. conventional polycrystalline silicon solar cell.
status, challenges and recommendations. (2004). Photovoltaic array performance model. Proceedings of the ISES World Congress 2007
Renew. Sustain. Energy Rev. 14, 3124–3131. http://www.mauisolarsoftware.com/MSESC/ (Vol. I - Vol. V), pp. 1445–1448.
xPerfModel2003.pdf.
26. Bowden, S.B., Yelundur, V.N., and Rohatgi, A. 44. Wang, M., Ma, X., Huang, W.-H., Liu, J., Curran,
(2002). Implied-Voc and suns-Voc 35. Wang, M., Liu, J., Burleyson, T.J., Schneller, A., Schnabel, E., Köhl, M., Davis, K.,
measurements in multicrystalline solar cells. E.J., Davis, K.O., French, R.H., and Braid, J.L. Brynjarsdóttir, J., Braid, J., and French, R.H.
Proceedings of the 29th IEEE Photovoltaic (2020). Analytic Isc–Voc method and power loss (2018). Evaluation of photovoltaic module
Special Conference, pp. 371–374. modes From outdoor time-series I–V curves. performance using novel data-driven I-V
IEEE J. Photovolt. 10, 1379–1388. feature extraction and suns-VOC determined
27. Bowden, S., and Rohatgi, A. (2001). Rapid and from outdoor time-series I-V curves. 2018 IEEE
accurate determination of series resistance and 36. Ma, X., Huang, W., Schnabel, E., Köhl, M., 7th World Conference on Photovoltaic Energy
fill factor losses in industrial silicon solar cells. Brynjarsdóttir, J., Braid, J.L., and French, R.H. Conversion (WCPEC) (A Joint Conference of
Proceedings of the of the 17th European (2019). Data-driven I–V feature extraction for 45th IEEE PVSC, 28th PVSEC & 34th EU PVSEC),
Photovoltaic Solar Energy conference, pp. photovoltaic modules. IEEE J. Photovolt. 9, pp. 778–783.
1802–1805. 1405–1412.
45. Liu, F.T., Ting, K.M., and Zhou, Z.-H. (2012).
37. Guo, S., Ma, F.-J., Hoex, B., Aberle, A.G., and
28. Karas, J., Sinha, A., Buddha, V.S.P., Li, F., Isolation-based anomaly detection. ACM
Peters, M. (2012). Analysing solar cells by circuit
Moghadam, F., Tamizhmani, G., Bowden, S., Trans. Knowl. Discov. Data 6, 1–39.
modelling. Energy Procedia 25, 28–33.
and Augusto, A. (2019). Damp heat induced
degradation of silicon heterojunction solar 38. Khanna, V., Das, B.K., and Bisht, D. (2013). 46. McIntosh, K., and Honsberg, C. (2000). The
cells With Cu-plated contacts. IEEE J. MATLAB/SIMELECTRONICS models based influence of edge recombination on a solar
Photovolt. 10, 153–158. study of solar cells. Int. J. Renew. Energy Res. 3, cell’s. Iv Curve. 16th European Photovoltaic
30–34. Solar Energy Conference. pp, 1651–1654.
29. Kerr, M.J., Cuevas, A., and Sinton, R.A. (2002).
Generalized analysis of quasi-steady-state and 39. Silvestre, S., Boronat, A., and Chouder, A. 47. Green, M.A. (1981). Solar cell fill factors:
transient decay open circuit voltage (2009). Study of bypass diodes configuration on general graph and empirical expressions. Solid
measurements. J. Appl. Phys. 91, 399–404. PV modules. Appl. Energy 86, 1632–1640. State Electron 24, 788–789.
18 Joule 5, 1–18, January 20, 2021You can also read