HERMES: an Infrastructure for Low Area Overhead Packet-switching Networks on Chip
←
→
Page content transcription
If your browser does not render page correctly, please read the page content below
FACULDADE DE INFORMÁTICA
                                                     PUCRS - Brazil
                                                       http://www.inf.pucrs.br

   HERMES: an Infrastructure for Low Area Overhead
        Packet-switching Networks on Chip

 Fernando Gehm Moraes, Ney Laert Vilar Calazans, Aline Vieira de
        Mello, Leandro Heleno Möller, Luciano Copello Ost

TECHNICAL REPORT SERIES
____________________________________________________________________________________

Number 034
October, 2003
Contact:
moraes@inf.pucrs.br
http://www.inf.pucrs.br/~moraes
F. G. Moraes works at the PUCRS/Brazil since 1996. He is a professor since
August 2003. His main research topics are digital systems design and fast prototyping,
digital systems physical synthesis CAD, telecommunication applications, hardware-
software codesign. He is a member of the Hardware Design Support Group (GAPH) at
the PUCRS.
N. L. V. Calazans works at the PUCRS/Brazil since 1986. He is a professor
since 1999. His main research topics are digital systems design and fast prototyping,
hardware-software codesign, telecommunication applications. He is the head of the
Hardware Design Support Group (GAPH) at the PUCRS.
A. V. de Mello is a research assistant at the GAPH Research Group in
PUCRS/Brazil since 2003. Ms. Mello holds a CS degree in Computer Science from
PUCRS. She is member of the GAPH group since 2000, where she received a federal
undergraduate research grant from CNPq (Brazil) from 2000 to 2003. Currently she
receives a research assistant grant from CNPq (Brazil).
L. H. Möller is a research assistant at the GAPH Research Group in
PUCRS/Brazil since 2003. Mr. Möller holds a CS degree in Computer Science from
PUCRS. He is member of the GAPH group since 2000, where he received a federal
undergraduate research grant from CNPq (Brazil) from 2000 to 2003. Currently he
receives a research assistant grant from CNPq (Brazil).
L. C. Ost is a Masters student at the CPGCC/PUCRS/Brazil since 2002. Mr. Ost
is member of the GAPH group since 2002, and receives a federal graduate research
grant from CNPq (Brazil) from 2002 to 2004.
Copyright Faculdade de Informática – PUCRS
Av. Ipiranga, 6681
90619-900 Porto Alegre – RS – Brazil
II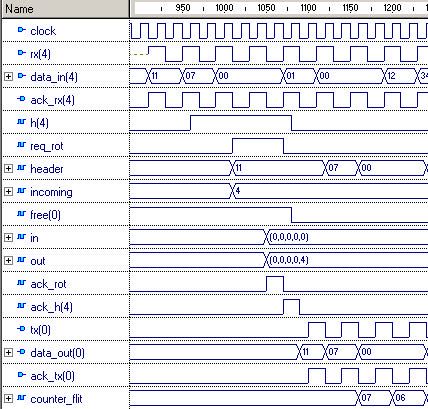
Abstract
   The increasing complexity of integrated circuits drives the research of new intra-chip
interconnection architectures. A network on chip draws on concepts inherited from distributed
systems and computer networks subject areas to interconnect IP cores in a structured and
scalable way. The main goal pursued is to achieve superior bandwidth when compared to
conventional intra-chip bus architectures. This paper reviews the state of the art in networks
on chip. It also describes an infrastructure called Hermes, targeted to implement packet-
switching mesh and related interconnection architectures. The basic element of Hermes is a
switch with five bi-directional ports, connecting to four other switches and to a local IP core.
The switch employs an XY routing algorithm, and uses input queuing. The main design
objective was to develop a switch with a very small size, enabling its immediate practical use.
The paper presents next the design validation of the switch and a mesh topology based on it,
through hardware simulation. A NoC case study has been successfully prototyped in hardware
as described in the paper, demonstrating the functionality of the approach. Some initial
quantitative data for the Hermes infrastructure is presented as well.

Keywords : network on chip, system on a chip, core based design, switches, intra-chip
interconnection.

                                                                                       III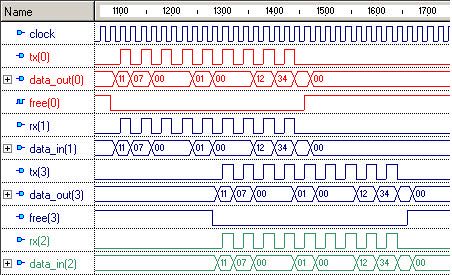
Table of Contents
1      INTRODUCTION ...............................................................................................................................................1
2      NOC BASIC CONCEPTS AND FEATURES ...............................................................................................2
3      STATE OF THE ART IN NOCS ......................................................................................................................3
4      NOCs PROTOCOL STACK..............................................................................................................................6
5      HERMES SWITCH.............................................................................................................................................7
    5.1     Control Logic ...............................................................................................................................................8
    5.2     Message buffering .......................................................................................................................................9
    5.3     Switch Functional Validation....................................................................................................................9
6      HERMES NETWORK ON CHIP ...................................................................................................................11
    6.4     NoC Functional Validation......................................................................................................................11
    6.5     Switch Peak Performance ........................................................................................................................12
7      PROTOTYPING AND RESULTS .................................................................................................................13
    7.6     Network latency and buffer sizing..........................................................................................................13
       7.6.1     Latency and buffer sizing without collision.................................................................................13
       7.6.2     Latency and buffer sizing with random traffic and collision ....................................................15
    7.7     Switch area growth rate ............................................................................................................................16
    7.8     Prototyping.................................................................................................................................................17
8      CONCLUSIONS AND FUTURE WORK ....................................................................................................19
9      REFERENCES ...................................................................................................................................................20

                                                                 List of Figures
Figure 1 – Example of physical interface between switches. ............................................7
Figure 2 - Switch Architecture. B indicates input buffers. ................................................8
Figure 3 – Example of three simultaneous connections in the switch (a), and the
respective switching table (b). ...........................................................................................9
Figure 4 – Partial block diagram of the switch, showing two of the five ports. Numbers
have correspondence to the sequence of events in Figure 5. ...........................................10
Figure 5 - Simulation of a connection between the Local port and the East port............10
Figure 6 – 3x3 Mesh NoC structure. C marks IP cores, Switch addresses indicate the
XY position in network. ..................................................................................................11
Figure 7 – Simulation of a packet transmission from switch 00 to switch 11 in the
topology of Figure 6. .......................................................................................................12
Figure 8 – Establishment of five simultaneously active connections in a single switch, to
illustrate the peak performance situation. ........................................................................13
Figure 9 - Total time, in clock cycles, to deliver 50 packets of 39 flits length for various
8-bit flit buffer sizes.........................................................................................................14
Figure 10 – Header flit latency for full buffers. In the first buffer, the header flit waits 14
clock cycles to be routed while in the second buffer it waits 30 clock cycles. ...............15
Figure 11 – Illustrating ASIC mapping growth rate for different switch size
configurations. .................................................................................................................17
Figure 12 – Illustrating FPGA mapping growth rate for different switch size
configurations. .................................................................................................................17
Figure 13 - ChipScope software snapshot, with data obtained directly from the
prototyping board.............................................................................................................18

IV
1 INTRODUCTION
Increasing transistor density, higher operating frequencies, short time-to- market
and reduced product life cycle cha racterize today’s semiconductor industry scenery [1].
Under these conditions, designers are developing ICs that integrate complex
heterogeneous functional elements into a single chip, known as a System on a Chip
(SoC). As described by Gupta et al. [2] and Bergamaschi et al. [3], SoC design is based
on intellectual property (IP) cores reuse. Gupta et al. [2] define core as a pre-designed,
pre-verified hardware piece that can be used as a building block for large and complex
applications on an IC. Examples of cores are memory controllers, processors, or
peripheral devices such as MAC Ethernet or PCI bus controllers. Cores may be either
analog or digital, or even be composed by blocks using technologies such as micro-
electromechanical or optoelectronic systems [1][4]. Cores do not make up SoCs alone,
they must include an interconnection architecture and interfaces to peripheral devices
[4]. The interconnection architecture includes physical interfaces and communication
mechanisms, which allow the communication between SoC components to take place.
Usually, the interconnection architecture is based on dedicated wires or shared
busses. Dedicated wires are effective for systems with a small number of cores, but the
number of wires around the core increases as the system complexity grows. Therefore,
dedicated wires have poor reusability and flexibility. A shared bus is a set of wires
common to multiple cores. This approach is more flexible and is totally reusable, but it
allows only one communication transaction at a time, all cores share the same
communication bandwidth in the system and its scalability is limited to few dozens IP
cores [5]. Using separate busses interconnected by bridges or hierarchical bus
architectures may reduce some of these constraints, since different busses may account
for different bandwidth needs, protocols and also increase communication parallelism.
According to several authors, e.g. [5] to [8], the interconnection architecture
based on shared busses will not provide support for the communication requirements of
future ICs. According to ITRS, ICs will be able to contain billions of transistors, with
feature sizes around 50 nm and clock frequencies around 10 GHz in 2012 [1]. In this
context, a network on chip (NoC) appears as a possibly better solution to implement
future on-chip interconnects. A NoC is an on-chip network [7] composed by cores
connected to switches, which are in turn connected among themselves by
communication channels.
The rest of this paper is organized as follows. Section 2 presents basic concepts
and features associated to NoCs. Section 3 presents an overview of current state of the
art in NoCs, with emphasis on implemented approaches. A minimal NoC
communication protocol stack is discussed in Section 4. Section 5 details the main
contribution of this work, the proposal of a NoC infrastructure centered on a switch
designed for packet-switching mesh and related interconnection architectures. An
example NoC implementation and its functional validation are described in Section 6. In
Section 0, some quantitative data regarding the Hermes1 infrastructure are depicted,
while Section 8 presents some conclusions and directions for future work.
1
In Greek mythology, Hermes is the messenger of Gods.
12 NOC BASIC CONCEPTS AND FEATURES
As described in [9][10], NoCs are emerging as a possible solution to the existing
interconnection architecture constraints, due to the following characteristics: (i) energy
efficiency and reliability [6]; (ii) scalability of bandwidth when compared to traditional
bus architectures; (iii) reusability; (iv) distributed routing decisions [7][8].
End to end communication in a system is accomplished by the exchange of
messages among IP cores. Often, the structure of particular messages is not adequate for
communication purposes. This leads to the concept of packet [11]. A packet is a
standard form for representing information in a form adequate for communication. One
packet may correspond to a fraction, one or more messages. In the context of NoCs,
packets are frequently a fraction of a message. Packets are often composed by a header,
a payload, and a trailer. To ensure correct functionality during message transfers, a NoC
must avoid deadlock, livelock and starvation [11]. Deadlock may be defined as a cyclic
dependency among nodes requiring access to a set of resources so that no forward
progress can be made, no matter what sequence of events happens. Livelock refers to
packets circulating the network without ever making any progress towards their
destination. It may be avoided with adaptive routing strategies. Starvation happens
when a packet in a buffer requests an output channel, being blocked because the output
channel is always allocated to another packet.
Two parts compose an interconnection network: the services and the
communication system. Rijpkema et al [9] define several services considered essential
for chip design, such as data integrity, throughput and latency. The implementation of
these services is often based on protocol stacks such as the one proposed in the ISO OSI
reference model. As mentioned in [7][5], when applied to NoCs the lower three layers
(physical, link, and network) are technology dependent. The communication system, on
the other hand, is what supports the information transfer from source to target. The
communication system allows that every core send packets to every other core in the
NoC structure. The NoC structure is a set of switches connected among them by
communication channels. The way switches are connected define the network topology.
According to the topology, networks can be classified in one of two main classes: static
and dynamic [12][13]. In static networks, each node has fixed point-to-point
connections to some number of other nodes. Hypercube, ring, mesh, torus and fat-tree
are examples of networks used to implement static networks. Dynamic networks
employ communication channels that can be (re)configured at application runtime.
Busses and crossbar switches are examples of dynamic networks.
The communication mechanism, switching mode, and routing algorithm are
functions of the network topology and are used to compose the services provided by
NoC.
The communication mechanism specifies how messages pass through the network.
Two methods for transferring messages are circuit switching and packet switching [13].
In circuit switching, a path named connection is established before packets can be sent
by the allocation of a sequence of channels between source and target. After
establishing a connection, packets can be sent, and any other communication on the
allocated channels is denied, until a disconnection procedure is followed. In packet
switching, packets are transmitted without any need for connection establishment
procedures.
2Packet switching requires the use of a switching mode, which defines how packets
move through the switches. The most important modes are store-and-forward, virtual
cut-through and wormhole [14]. In store-and-forward mode, a switch cannot forward a
packet until it has been completely received. Each time a switch receives a packet; its
contents are examined to decide what to do, implying per-switch latency. In virtual cut-
through mode, a switch can forward a packet as soon as the next switch gives a
guarantee that a packet will be accepted completely [10]. Thus, it is necessary a buffer
to store a complete packet, like in store-and-forward, but in this case with lower latency
communication. The wormhole switching mode is a variant of the virtual cut-through
mode that avoids the need for large buffer spaces. A packet is transmitted between
switches in units called flits (flow control digits – the smallest unit of flow control).
Only the header flit has the routing information. Thus, the rest of the flits that compose
a packet must follow the same path reserved for the header.
The routing algorithm defines the path taken by a packet between the source and
the target. According to where routing decisions are taken, it is possible to classify the
routing in source and distributed routing [11]. In source routing, the whole path is
decided at the source switch, while in distributed routing each switch receives a packet
and decides the direction to send it. According to how a path is defined to transmit
packets, routing can be classified as deterministic or adaptive. In deterministic routing,
the path is uniquely defined by the source and target addresses. In adaptive routing, the
path is a function of the network traffic [11][14]. This last routing classification can be
further divided into partially or fully adaptive. Partially adaptive routing uses only a
subset of the available physical paths between source and target.
3 STATE OF THE ART IN NOCS
This Section is intended to provide a big picture of the state of the art in network-
on-chip propositions, as currently found in the available literature. The results of the
review are summarized in Table 1. In this Table, each row corresponds to a NoC
proposition that could be found about which significant qualitative and quantitative
implementation data were made available. The NoC implementation data considered
relevant can be divided in three groups: (i) switch structural data, presented in the four
first columns; (ii) performance data, in the following three columns; (iii) prototyping
and/or silicon implementation data, in the last column. Although the authors do not pose
claims about the completeness of this review, they consider it rather comprehensive 2 .
Benini, De Micheli and Ye made important contributions to the NoC subject area
in their conceptual papers [6][7][15]. However, none of these documents contains any
NoC implementation details.
Each NoC defining parameter is described in detail below, together with an
evaluation of the relative merits of each reviewed NoC proposition. The last row of
Table 1 corresponds to the NoC infrastructure proposed here.
2
Data presented in Table 1 is the preliminary result of publication analysis only. The authors are
currently contacting the authors of each NoC proposition to obtain further data, and expect to provide a
more complete Table in the final version of the paper.
3Table 1 - State of the art in NoCs.
Topology/ Flit IP-switch Switch Estimated QoS Impleme
NoC Buffering Peak
Switching Size Interface Area Support ntation
Performance
ASIC
32 bits
Fat -tree / Input queue 2 layout
SPIN - 2000 data + 4 0.24 mm 2 Gbits/s per 2
deterministic + 2 shared VCI 4.6 mm
[8] [16] [17] bits CMOS 0.13µ switch
and adaptive output queue CMOS
control
0.13µ
2D Mesh ASIC
Scalable / Circuit-
aSOC – 2000 50,000 layout
Determined 32 bits None switching (no CMOS
[18] transistors wormhole)
by
0.35µ
application
2
0.59 mm
256 bits Guaranteed
Folded 2D CMOS 0.1µ
Dally - 2001 data + 4 Gbits/s per Throughput
Torus 4x4 / Input queue (6.6 % of No
[19] 38 bits wire (virtual
XY – Source control synchronous channels)
region)
290 bits
NocArc – Input queue
2D Mesh data +
2001 + output
(scalable) 10 bits
[5] queue
control
18 bits
Sgroi – 2001 data + 2
2D Mesh OCP
[20] bits
control
Octagon- Chordal Ring Variable
2001 - 8 nodes / data + 3 Circuit-
40 Gbits/s No
[21] [22] Distributed bits switching
and adaptive control
2D Torus 446 slices
16 bits 2 time-
Marescaux – (scalable) / Virtex /Virtex - 320Mbits/s per FPGA
data Virtual output multiplexed
2002 XY blocking, Custom II (4.8% area virtual channel Virtex/
+ 3 bits queue virtual
[23] hop-based, overhead at 40 MHz Virtex -II
control channels
deterministic for XCV800)
Circuit-
Rijpkema – 0.26 mm
2
80Gbits/s per switching ASIC
2002 2D Mesh 32 bits Input queue
CMOS 0.12µ switch (guaranteed layout
[9] [10]
throughput)
Eclipse - 2D Sparse
2002 hierarchical 68 bits Output queue No
[24] mesh
Variable ASIC
Proteo - control layout
Bi-directional
2002 VCI
Ring and data CMOS
[25] [26] [27]
sizes 0.35µ
8 bits
data + 2
Hermes – 2D Mesh Input queue 631 LUTs 500 Mbits/s per
bits FPGA
2003 (scalable) / (parameteriz OCP 316 slices switch at 25 No
control VirtexII
[28] XY able) VirtexII MHz
(paramet
erizable)
A basic choice common to most reviewed NoCs is the use of packet switching,
and this is not explicitly stated in the Table. The exception is the aSOC NoC [18],
where the definition of the route each message follows is fixed at the time of hardware
synthesis. Two connected concepts, network topology and switching strategy are the
subject of the first column in Table 1. The predominant network topology in the
literature is the 2D Mesh. The reason for this choice derives from its three advantages:
facilitated implementation using current IC planar technologies, simplicity of the XY
switching strategy and network scalability. Another approach is to use the 2D torus
topology, to reduce the network diameter [23]. The folded 2D torus [19] is an option to
reduce the increased cost in wiring when compared to a standard 2D torus. One problem
of mesh and torus topologies is the associated network latency. Two revised NoCs
propose alternatives to overcome the problem. The SPIN NoC [8][16][17] and the
switch proposed in [29] employ a fat-tree topology, while the Octagon NoC [21][22]
suggests the use of a chordal ring topology, both leading to a smaller network diameter,
with a consequent latency reduction. Concerning switching strategies, there is a clear
lack of published information on specific algorithms. This indicates that further research
is needed in this area. For instance, it is widely known that XY adaptive algorithms are
4prone to deadlock, but solutions exist to improve XY routing without causing deadlock
risk [30].
The second important quantitative parameter of NoC switches is the flit size. From
Table 1 it is possible to classify approaches in two groups, those focusing on future SoC
technologies and those adapted to existing limitations. The first group includes the
proposals of Dally [19] and Kumar [5], where switching channels are supposed to be
300-wire wide without significantly affecting the overall SoC area. This can be
achieved e.g. by using a future 60nm technology for building 22mm x 22mm chip with
a 10 x 10 NoC to connect 100 2mm x 2mm IPs [5]. However, this is clearly not yet
feasible today. The second group comprises works with flit size ranging from 8 to 64
bits, a data width similar to current processor architectures. The works providing a NoC
prototype, Marescaux [23] and the one proposed here, have the smallest flit sizes, 16
and 8 bits, respectively.
The next parameter in Table 1 is the switch buffering strategy. Most NoCs employ
input queue buffers. Since input queuing implies a single queue per input, this leads to
lower area overhead, justifying the choice. However, input queuing presents the well-
known head-of-line blocking problem [9]. To overcome this problem, output queuing
can be used [24], at a greater buffering cost, since this increases the total number of
queues in the switch. An intermediate solution is to use virtual output queuing
associated with time- multiplexed virtual channels, as proposed in [23]. Another
important parameter is the queue size, which implies the need to solve the compromise
among of the amount of network contention3 , packet latency and switch area overhead.
A bigger queue leads to small network contention, higher packet latency, and bigger
switches. Smaller queues lead to the opposite situation. Section 0 exploits quantitative
data regarding this compromise for the Hermes NoC.
The last structural parameter is the characteristic of the IP-switch interface. The
use of standard intra-chip communication interfaces is an evolving trend in industry and
academia. They are devised to increase design reuse, and are accordingly seen as a
needed feature to enable future SoC designs. A NoC with a custom IP-switch interface,
such as [23], is less apt to aggregate third party IPs to the design in a timely manner.
The two most prominent interface standards, VCI and OCP are each used by two of the
NoC proposals presented in Table 1. The Proteo [25][26][27] and SPIN [16][17] NoCs
declare to use VCI, while Sgroi [20] and Hermes [28] employ OCP.
The fifth column collects results concerning the size of the switch. It is interesting
to observe that two approaches targeted to ASICs [17][9], both with a 32-bit flit size,
have similar dimensions, around 0.25mm2 for similar technologies. In addition,
prototyped systems [23][28] did produce similar area results, in FPGA LUTs. These
data seem to indicate the need to establish a relationship between switch size and SoC
communication area overhead. It is reasonable to expect that the adoption of NoCs by
SoC designers be tied to gains in intra-chip communication performance. On the other
hand, low area overhead when compared with e.g. standard bus architectures is another
important issue. A SoC design specification will normally determine a maximum area
overhead allowed for intra-chip communication, as well as minimum expected
communication performance, possibly in an IP by IP basis. Switch size, flit size (i.e.
communication channel width) and switch port cardinality are fundamental values to
3
Network contention is a measure of the amount of network resources allocated to blocked packets.
5allow estimating the area overhead and the expected peak performance for intra-chip
communication. Adoption of NoCs is then tied to these quantitative assessments and to
the ease with which designers are provided to evaluate the NoC approach in real
designs.
Estimated peak performance, presented in the sixth column of Table 1, is a
parameter that needs further analysis to provide a meaningful comparison among
different NoCs. In this way, this column displays different units for different NoCs.
This column must accordingly be considered as merely illustrative of possible
performance values. Most of the estimates are derived from the product of three values:
number of switch ports, flit size, and estimated operating frequency. The wide variation
of values is due mostly to the last two values. No measured performance data could be
found in any reviewed publication. A first approach to the physical implementation
performance of the Hermes NoC is provided in Section 6.5. The value associated to the
NoC proposed in [19] should be regarded with care. The reason for this is that the data
reflects a technology limit that can be achieved by sending multiple bits through a wire
at each clock cycle (e.g. 20 bits at each 200 MHz clock cycle [19]).
Next comes the quality of service (QoS) support parameter. The most commonly
found form of guaranteeing QoS in NoCs is through circuit switching. This is a way of
guaranteeing throughput and thus QoS for a given communication path. The
disadvantage of the approach is that bandwidth can be wasted if the communication
path is not used at every moment during the time the connection is established. In
addition, since most approaches combine circuit switching with best effort techniques,
this brings as consequence the increase of the switch area overhead. This is the case for
NoC proposals presented in [22][19] and [10]. Virtual channels are one way to achieve
QoS without compromising bandwidth, especially when combined with time division
multiplexing (TDM) techniques. This last technique, exemplified in [23] avoids that
packets remain blocked for long periods, since flits from different inputs of a switch are
transmitted according to a predefined time slot allocation associated with each switch
output. It is expected that current and future SoC utilization will be dominated by
streaming applications. Consequently, QoS support is regarded as a fundamental feature
of NoCs by the authors.
Finally, it is possible to state that NoC implementation results are still very scarce.
None of the four ASIC implementations found in the literature gives hints if the design
corresponds to working silicon. In addition, three approaches are just sketched designs.
On the other hand, two NoCs have been reported to be prototyped in FPGAs, those
proposed in [23] and in [28].
4 NOCs PROTOCOL STACK
The OSI reference model is a hierarchical structure of seven layers that define the
requirements for communication among processing elements [20][31]. Each layer offers
a set of services to the upper layer, using functions available in the same layer and in the
lower ones. NoCs usually implement a subset of the lower layers, such as Physical, Data
Link, Network, and Transport. These layers are described below for the NoC context.
The physical layer is responsible to provide mechanical and electrical media
definitions to connect different entities at bit level [31]. In the present work, this layer
corresponds to the communication between switches, as exemplified in Figure 1 for the
6implementation proposed here. The physical data bus width must be chosen as a
function of the available routing resources and available memory to implement
buffering schemes. The output port in the example is composed by the following
signals: (1) Tx: control signal indicating data availability; (2) Data_out: data to be sent;
(3) Ack_tx: control signal indicating successful data reception. The input port in the
example is composed by the following signals: (1) Rx: control signal indicating data
availability; (2) Data_in: data to be received; (3) Ack_rx: control signal indicating
successful data reception.
Switch 1
Switch
tx rx
1
Output Port ack_tx n
ack_rx Input Port
data_out data_in
1
rx tx
Input Port 1
ack_rx ack_tx Output Port
n
data_in data_out
Figure 1 – Example of physical interface between switches.
The data link layer has the objective of establishing a logical connection between
entities and converting an unreliable medium into a reliable one. To fulfill these
requirements, techniques of flow control and error detection are commonly used [11].
This work implements in the data link layer a simple handshake protocol built on top of
the physical layer, to deal with flow control and correctly sending and receiving data. In
this protocol, when the switch needs to send data to a neighbor switch, it puts the data in
the data_out signal and asserts the tx signal. Once the neighbor switch stores the data
from the data_in signal, it asserts the ack_rx signal, and the transmission is complete.
The network layer is concerned with the exchange of packets. This layer is
responsible for the segmentation and reassembly of flits, point-to-point routing between
switches, and contention management. The network layer in this work implements the
packet switching technique.
The transport layer is responsible to establish a end-to-end communication from
source to target. Services like flow control, segmentation and reassembly of packets are
essential to provide a reliable communication [11]. In this work, end-to-end connections
are implemented in the IP cores connected to the NoC. The implementation of flow
control and other options is envisaged as future work.
5 HERMES SWITCH
The main objective of an on-chip switch is to provide correct transfer of messages
between IP cores. Switches usually have routing logic, arbitration logic and
communication ports directed to other switches or cores. The communication ports
include input and output channels, which can have buffers for temporary storage of
information.
The Hermes switch has routing controller logic and five bi-directional ports: East,
West, North, South, and Local. Each port has a buffer for temporary storage of
information. The Local port establishes a communication between the switch and its
local core. The other ports of the switch are connected to neighbor switches, as
presented in Figure 2. The routing control logic implements the arbitration logic and a
7packet-switching algorithm.
N
B
Control
B
B
W Logic E
B B
S L
Figure 2 - Switch Architecture. B indicates input buffers.
Among the switching modes presented in Section 2, wormhole was chosen
because it requires less memory, provides low latency, and can multiplex a physical
channel into more than one logical channel. Although the multiplexing of physical
channels may increase the wormhole switching performance [32], this has not been
implemented. The reason is to lower complexity and cost of the switch by using only
one logical channel for each physical channel.
As previously described, the wormhole mode implies dividing packets into flits.
The flit size for the Hermes infrastructure is parameterizable, and the number of flits in
a packet is fixed at 2(flit size, in bits) . An 8-bit flit size was chosen here for prototyping and
evaluation purpose. The first and the second flit of a packet are header information,
being respectively the address of the target switch, named header flit, and the number of
flits in the packet payload. Each switch must have a unique address in the network. To
simplify routing on the network this address is expressed in XY coordinates, where X
represents the horizontal position and Y the vertical position.
5.1 Control Logic
Two modules implement the control logic: routing and arbitration, as presented in
Figure 4. When a switch receives a header flit, the arbitration is executed and if the
incoming packet request is granted, an XY routing algorithm is executed to connect the
input port data to the correct output port. The algorithm compares the actual switch
address (xLyL) to the target switch address (xTyT) of the packet, stored in the header
flit. Flits must be routed to the local port of the switch when the xLyL address of the
actual switch is equal to the xTyT packet address. If this is not the case, the xT address
is first compared to the xL (horizontal) address. Flits will be routed to the East port
when xL< xT, to West when xL>xT and if xL=xT the header flit is already horizontally
aligned. If this last condition is true, the yT (vertical) address is compared to the yL
address. Flits will be routed to South when yLyT. If the chosen
port is busy, the header flit as well as all subsequent flits of this packet will be blocked.
The routing request for this packet will remain active until a connection is finally
established in some future execution of the above procedure in this switch.
When the XY routing algorithm finds a free output port to use, the connection
between the input port and the output port is established and the in, out and free
switching vectors at the switching table are updated. The in vector connects an input
port to an output port. The out vector connects an output port to an input port. The free
vector is responsible to modify the output port state from free (1) to busy (0). Consider
the North port in Figure 3(a). The output North port is busy (free=0) and is being driven
by the West port (out=1). The input North port is driving the South port (in=3). The
switching table structure contains redundant information about connections, but this
8organization is useful to enhance the routing algorithm efficiency.
2(N)
0 (E) 1 (W) 2 (N) 3 (S) 4 (L)
Free 0 1 0 0 1
1(W) 0(E)
In - 2 3 - 0
Out 4 - 1 2 -
3(S) 4(L)
(a) (b)
Figure 3 – Example of three simultaneous connections in the switch (a), and the respective switching table (b).
After all flits composing the packet have been routed, the connection must be
closed. This could be done in two different ways: by a trailer, as described in Section 2,
or using flit counters. A trailer would require one or more flits to be used as packet
trailer and additional logic to detect the trailer would be needed. To simplify the design,
the switch has five counters, one for each output port. The counter of a specific port is
initialized when the second flit of a packet arrives, indicating the number of flits
composing the payload. The counter is decremented for each flit successfully sent.
When the counter value reaches zero, the connection is closed and the free vector
corresponding position of the output port goes to one (free=1), thus closing the
connection.
A switch can simultaneously be requested to establish up to five connections.
Arbitration logic is used to grant access to an output port when one or more input ports
simultaneously require a connection. A dynamic arbitration scheme is used. The priority
of a port is a function of the last port having a routing request granted. For example, if
the local input port (index 4) was the last to have a routing request granted, the East port
(index 0) will have greater priority, being followed by the ports West, North, South and
Local. This method guarantees that all input requests will be eventually granted,
preventing starvation to occur. The arbitration logic waits four clock cycles to treat a
new routing request. This time is required for the switch to execute the routing
algorithm. If a granted port fails to route the flit, the next input port requesting routing
have its request granted, and the port having the routing request denied receives the
lowest priority in the arbiter.
5.2 Message buffering
When a flit is blocked in a given switch, the performance of the network is
affected, since the flits belonging to the same packet are blocked in other switches. To
lessen the performance loss, a buffer is added to each input switch port, reducing the
switches affected by the blocked flits. The inserted buffers work as circular FIFOs. In
Hermes, the FIFO size is parameterizable, and a size eight has been used for prototyping
purposes.
5.3 Switch Functional Validation
The Hermes switch was described in VHDL and validated by functional
simulation. Figure 4 presents some internal blocks of the switch and the signals of two
ports (Local and East). Figure 5 presents a functional simulation for the most important
signals of Figure 4. The simulation steps are described below, where numbering have
correspondences in Figure 4 and in Figure 5.
91 1 2
data_in rx ack_rx data_out tx ac
k_tx
Buffer out out
free
h ack_h data_av data data_ack
data_in all ports data_av all ports
3 in
6
ack_tx all ports L
h ack_h
Arbiter data all ports
req_rot ack_rot incoming
4 5 4 4
req_rot ack_rot incoming header
free
Routing Logic free all ports
in out
5 5
ack_tx all ports
h ack_h data_av data
in
data_ack
data_in all ports data_av all ports
E
Buffer free out out
data_in rx ack_rx data_out tx ack_tx
7 8
Figure 4 – Partial block diagram of the switch, showing two of the five ports. Numbers have correspondence to
the sequence of events in Figure 5.
§ The switch (xLyL=00) receives a flit by the local port (index 4), signal rx is
asserted and the data_in signal has the flit contents.
§ The flit is stored in the buffer and the ack_rx signal is asserted indicating that
the flit was received.
§ The local port requests routing to the arbitration logic by asserting the h signal.
§ After selecting a port, the arbitration logic makes a request to the routing logic.
This is accomplished by sending the header flit that is the switch target address
(value 11) and the source of the input request (signal incoming, value 4,
representing the local port) together with the request itself.
1
2
3
4
5
6
7
8
9
Figure 5 - Simulation of a connection between the Local port and the East port.
§ The XY routing algo rithm is executed, the switching table is written, and the
ack_rot signal is asserted indicating that the connection is established.
§ The arbitration logic informs the buffer that the connection was established and
the flit can now be transmitted.
§ The switch asserts the tx signal of the selected output port and puts the flit in the
data_out signal of this same port.
10§ Once the ack_tx signal is asserted the flit is removed from the buffer and the
next flit stored can be treated.
§ This second flit starts the counter indicating after how many clock cycles the
connection must be closed.
6 HERMES NETWORK ON CHIP
NoC topologies are defined by the connection structure of the switches. The
Hermes NoC assumes that each switch has a set of bi-directional ports linked to other
switches and to an IP core. In the mesh topology used in this work, each switch has a
different number of ports, depending on its position with regard to the limits of the
network, as shown in Figure 6. For example, the central switch has all five ports defined
in Section 5. However, each corner switch has only three ports.
0 1 2
0 00 10 20
C C C
1 01 11 21
C C C
2 02 12 22
C C C
Figure 6 – 3x3 Mesh NoC structure. C marks IP cores, Switch addresses indicate the XY position in network.
The use of mesh topologies is justified to facilitate placement and routing tasks as
stated before. The Hermes switch can also be used to build torus, hypercube or similar
NoC topologies. However, building such topologies implies changes in switch
connections and, more importantly, in the routing algorithm.
6.4 NoC Functional Validation
Packet transmission in the Hermes NoC was validated first by functional
simulation. Figure 7 illustrates the transmission of a packet from switch 00 to switch 11
in the topology of Figure 6. In fact, only the input and output interface behaviors of
switch 10 are shown in the simulation.
The simulation works as follows:
1. Switch 00 sends the first flit of the packet (address of the target switch) to the
data_out signal at its East port and asserts the tx signal in this port.
2. Switch 10 detects the rx signal asserted in its West port and gets the flit in the
data_in signal. It takes 10 clock cycles to route this packet. Next flits are routed
with a latency of 2 clock cycles.
3. Switch 10 output South port indicates its busy state in the free(3) signal. Signals
free(i) are elements of the free vector defined in Section 5.1.
4. Switch 10 puts the flit in data_out signal and asserts the tx signal of its South port.
Next, Switch 11 detects asserted the rx signal of its North port. The flit is captured
in the data_in signal and the source to target connection is now established.
5. The second flit of the packet contains the number of flits composing the payload.
6. After all flits are sent, the connection is closed and the free vector entries of each
switch involved in the connection return to their free state (6 and 7 in the Figure).
111 5
switch
00
6
switch
2
10
4
3 7
switch
11
Figure 7 – Simulation of a packet transmission from switch 00 to switch 11 in the topology of Figure 6.
The minimal latency in clock cycles to transfer a packet from a source to a target
switch is given by:
latency = (∑ R ) + P × 2
n
i =1 i
where n is the number of switches in the communication path (source and target
included), Ri is the time required by the routing algorithm at each switch (at least 10
clock cycles), and P is the packet size. This number is multiplied by 2 because each flit
requires 2 clock cycles to be sent.
6.5 Switch Peak Performance
The developed switch can establish only one connection at a time. However, a
single switch can simultaneously handle up to five connections. The operating
frequency was initially determined to be 25MHz for prototyping purposes. Each switch
has five ports and each port transmits 8-bit flits. Since each flit takes two clock cycles to
be sent, a switch presents a theoretical peak performance of 500Mbits/s ((25MHz/2) * 5
ports * 8 bits). This peak performance is indeed achieved in some moments as
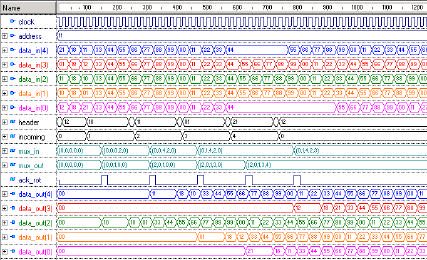
illustrated by the simulation results in Figure 8, and explained below.
1. Address of the switch being simulated.
2. Target address of each incoming packet in the simulated switch, five headers
arriving simultaneously.
3. Signal incoming indicates which port was selected to have its switching request
granted, while the signal header indicates which is the target switch address of the
selected packet.
4. First connection is established after 2.5 clock signals after the request: flits incoming
from port 1 (West) exit at port 2 (North). To understand semantics of mux_in and
mux_out signals, refer to Figure 3(b).
5. Second connection is established after 8 clock signals after the previous one: flits
incoming from port 2 (North) exit at port 4 (Local).
6. Third connection is established: flits incoming from port 3 (South) exit at port 1
(West).
7. Fourth connection is established: flits incoming from port 4 (Local) exit at port 0
(East).
128. Fifth connection is established: flits incoming from port 0 (East) exit at port 3
(South).
9. After this sequence of events, the switch is working at peak performance, taking 2
clock cycles to switch 5 8-bit flits, i.e. 500 Mbits/s at a clock rate of 25MHz.
1
2(N) 4(L)
2
1(W) 0(E)
3 3(S)
The five connections
4 5 6 7 8 9
as established in the
5
8 situation simulated
4 at the left.
6
7
Figure 8 – Establishment of five simultaneously active connections in a single switch, to illustrate the peak
performance situation.
7 PROTOTYPING AND RESULTS
The switch and NoC behavior has already been sketched in Sections 5 and 6. This
Section is intended to present additional quantitative data. Section 7.6 describes how to
define a good compromise between latency and buffer size for 8-bit flits. Next, Section
7.7 presents data about the switch area consumption for different buffer and flit sizes.
Finally, Section 7.8 provides results about FPGA prototyping.
7.6 Network latency and buffer sizing
A 5x5 mesh topology is employed to evaluate the network performance. The
Hermes NoC is modeled in VHDL, while the traffic generation and analysis is modeled
in the C language. This co-simulation is done using ModelSim and the FLI library [33],
which allows VHDL to communicate with C.
7.6.1 Latency and buffer sizing without collision
The goal of the first experiment is to define how to dimension the switch buffers
for the ideal situation where no packets collisions arise. As demonstrated later in this
Section, this minimum buffer size can be used as a good value, even for situations
where collisions arise. The experiment was conducted as follows. A file containing 50
packets with 39 flits addressed to a single target is connected to the Local port of one
switch, which serves as a traffic source. When a given flit enters the network, its
13timestamp4 is stored, and when it arrives at the target switch, the total flit transmission
time is stored in the output file. The plot of the simulation results is shown in Figure 9.
5800
Number of clock cycles to deliver 50
5600 buffer size = 2
5400
packets of 39 flits size
5200 buffer size = 3
5000
buffer size = 4
4800
4600 buffer size = 5
4400
buffer size = 6 or more
4200
4000
1 2 3 4 5
Number of Intermediate Switches (hops)
Figure 9 - Total time, in clock cycles, to deliver 50 packets of 39 flits length for various 8-bit flit buffer sizes.
The time spent to deliver packets grows linearly with the number of hops. For
buffer sizes of six or more positions, the time remains almost constant, growing 10
clock cycles per hop. This happens because each switch spends some clock cycles to
execute the arbitration and switching algorithms. If the buffer is too small, the switch
cannot receive new flits until the destination port is chosen. Therefore, the minimum
buffer size must be equal to the number of write operations that can be executed during
the arbitration and switching algorithms execution. In the Hermes NoC, these
algorithms consume 10 clock cycles and each write operation takes two clock cycles.
Considering that the header flit must be in the buffer to be processed, the minimum
buffer size is six. With this buffer size, the flits are delivered as in an ideal pipeline. If
the network works in this way, the formula below can be used to compute the total time
to deliver a set of packets:
Total time without collision = (ST + (NF-1) * 2) * NP
where:
- ST: number of clock cycles to execute the arbitration and routing algorithms, 10 in
the Hermes NoC;
- NF: number of flits, ‘-1’ since the first flit (header) is computed in ST, 39 in this
experiment;
- *2: each flit spends two clock cycles to be transmitted to the next switch;
- NP: number of packets, 50 in this experiment.
Replacing the values in the above equation, the total time spent to deliver 50
packets with 39 flits is 4300 clock cycles, exactly the value observed in Figure 9.
Buffers larger than the computed minimum size can be used to bring the
advantage of reduced contention, at the cost of some extra area. When dimensioning
buffers during the NoC implementation, the designer has to consider this trade-off
among area, latency, and throughput.
4
Timestamp corresponds to the present simulation time.
147.6.2 Latency and buffer sizing with random traffic and collision
The second experiment analyzes the NoC behavior in the presence of collisions,
using random traffic. At each of the 25 switches were connected a random traffic
generator and a process to store data concerning arriving flits. Each switch sends 20
packets with 20 flits to random targets. Two different buffer sizes were used: 8 and 16.
Results are presented in Table 2. Two relevant parameters to analyze are the average
time to deliver a packet (first line), corresponding to the packet latency, and the total
time to deliver all packets (last line), corresponding to the NoC throughput.
Table 2 – NoC latency and throughput evaluation with random traffic for buffer sizes 8 and 16. Three sets of
random data were used. Table data is expressed in clock cycles.
Buffer size = 8 Buffer size = 16
Traffic 1 Traffic 2 Traffic 3 Average Traffic 1 Traffic 2 Traffic 3 Average
Average 201 195 190 195 255 264 254 258
Std. Deviation 121 109 109 113 149 154 154 152
Minimum 51 51 51 51 51 51 51 51
Maximum 768 717 787 757 992 976 1.221 1.063
Total Time 3.035 2.816 3.114 2.988 2.800 2.728 2.873 2.800
Table 2 shows that the average time to deliver a packet increased 34% when
doubling the buffer size (195 to 258 cycles). This increased latency can be better
understood analyzing Figure 10. This figure presents a header flit (number 1) arriving in
two buffers with no empty space. In the smaller buffer, the header has to wait that 7 flits
be sent to the next switch before it can be treated, while in the bigger buffer the header
waits a longer time.
8-flit buffer
20
19
18
17
16
15
14
1
14 cycles
16-flit buffer
20
19
18
17
16
15
14
13
12
11
10
1
9
8
7
6
30 cycles
Figure 10 – Header flit latency for full buffers. In the first buffer, the header flit waits 14 clock cycles to be
routed while in the second buffer it waits 30 clock cycles.
The second line in Table 2 presents the standard deviation of the average time to
deliver 500 packets (25 switches x 20 packets). For buffer sizes 8 and 16, 95% of the
packets are delivered in less than 300 and 400 clock cycles respectively. However, some
packets stay in the network for a longer time (fourth line – maximum). This can arise if a
set of packets is transmitted to the same target or simply because of random collisions.
Further analyses of these data are under way, in order to develop adequate traffic
models and associated switching algorithms to reduce this figure.
As in a pipeline, with additional buffer capacity the latency increases (34% as
showed before) and the throughput is improved (6,3% - 2800 clock cycles against
2988). This improvement in throughput is due to the reduction in the network
contention, since blocked flits uses less network resources while waiting to be routed.
The above described simulations have been repeated a great number of times with
15different switch parameters. All these experiments produced only small improvements
in throughput for large improvements in the packet latency. This indicates that buffers
dimensioned with values near the minimum size for improving latency (6, in the case
stated before) represents a good trade-off between latency and throughput, with smaller
area (Section 7.7).
It is also interesting to compare the performance of NoCs against the shared bus
architectures. Consider an ideal bus, able to send one word (the same width of the NoC
flit) per clock cycle 5 . As the total number of words to be transmitted is 10,000 (500
packets with 20 words), it would be necessary 10,000 clock cycles to transmit all data.
Data concerning a real NoC (Table 2) show that it is necessary around 3,000 clock
cycles to transmit the same amount of data. In this situation, the (real) NoC is 3 times
faster than the (ideal) bus architecture. If real bus architectures are considered,
improvements of at least one order of magnitude in performance are expected.
The results in Table 2 were obtained with an XY switch algorithms. A fully
adaptive XY algorithm was also employed, but then deadlock situations were observed.
Deadlock- free adaptive switching algorithms are currently under implementation to
overcome limitations of the pure XY algorithm.
7.7 Switch area growth rate
The switch area consumption was estimated by varying two parameters: flit width
and buffer size. The Leonardo Spectrum tool was used to synthesize the Hermes switch
in two different technologies: Xilinx Virtex-II FPGAs and 0.35 µm CMOS ASIC.
Synthesis was conducted with maximum effort, maximum area compaction, and
hierarchy preservation (to allow collecting data about the individual modules
composing the system).
Figure 11 presents the area growth rate of ASIC mappings for different
configurations of the switch, in equivalent gates. It is clear from the plotted data that the
increase of the buffer size leads to a linear increase of the switch area for any flit size.
Also, the analysis of the raw data shows that the converse is also true, i.e. the increase
of the flit size leads to a linear increase of the switch area for any buffer size. Another
important result is that the switch area is dominated by the buffer area. For the smallest
synthesized configuration, 4- flit buffers and 4-bit flit size, the switch logic consumes
around 58% of the ASIC mapping area, and around 42%, refers to buffer area. When the
switch is configured with an 8- flit buffer and an 8-bit flit size, the buffer area amounts
to 69% of the switch area. If the buffer and flit size increase to 32, buffers occupy 96%
of the switch area.
In fact, the linear area growth shown in Figure 11 is a bit misleading, since this
happens only for buffer size steps in powers of 2. For example, the area growth rate is
almost null for buffers with dimension between 9 and 16 positions, for any flit size. This
happens because the synthesis tool can only deal with memories which sizes are a
natural power of two.
It would be expectable that the FPGA mapping behaves similar to the ASIC
mapping. However, Figure 12 presents a rather distinct behavior. The plot shows that
independently of the buffer size, the LUT count, used as FPGA area unit, is practically
5
In practice, this is not feasible since there are also arbitration and bus protocols.
16invariant up to 32 bits. The fluctuations are due to the non-deterministic synthesis
process. To really understand the area invariance it is necessary to delve into the FPGA
device architecture and on how synthesis tools map hardware into this architecture. In
this specific case, generic VHDL code was input to the Leonardo tool, and the tool was
instructed to perform LUT RAM inference. In Virtex families, each LUT can behave
either as a 4-input truth table or as a small 16-bit RAM, named LUT RAM. When it is
configured to be a LUT RAM, the component presents a 4-bit address input, to access
up to 16 1-bit memory positions. Therefore, just one bit can be read from a LUT RAM
at a time.
50000
40000
Number of Gates
30000
Flit: 32 bits
20000
Flit: 16 bits
Flit: 8 bits
10000 Flit: 4 bits
0
0 5 10 15 20 25 30
Buffer Size
Figure 11 – Illustrating ASIC mapping growth rate for different switch size configurations.
For instance, if one 8-bit word must be read from a set of LUT RAMs, it is
necessary to put eight LUT RAMs in parallel. Unfortunately, in this case, just one bit
out of the 16 available per LUT will be used. On the other hand, if a 16-word buffer is
used, only the same eight LUTs are needed. In the prototyping case study, the Leonardo
tool inferred the switch buffers using Dual Port LUT RAMs. Dual Port LUT RAMs is a
component that groups two LUTs. This is why the graphic is constant for buffer sizes
until exactly 32 positions.
1400
Flit: 32 bits
1300
1200
Number of LUTs
1100
1000
900 Flit: 16 bits
800 Prototyped NoC
700 Flit: 8 bits
600 Flit: 4 bits
500
400
0 5 10 15 20 25 30 35
Buffer Size
Figure 12 – Illustrating FPGA mapping growth rate for different switch size configurations.
7.8 Prototyping
The Hermes NoC was prototyped using the Memec Insight Virtex-II MB1000
development kit. This kit is composed by three boards, the main one containing a 1-
million gates Xilinx XC2V1000 456-pin FPGA device, memory and
17You can also read