Comparison of global observations and trends of total precipitable water derived from microwave radiometers and COSMIC radio occultation from 2006 ...
←
→
Page content transcription
If your browser does not render page correctly, please read the page content below
Atmos. Chem. Phys., 18, 259–274, 2018
https://doi.org/10.5194/acp-18-259-2018
© Author(s) 2018. This work is distributed under
the Creative Commons Attribution 3.0 License.

Comparison of global observations and trends of total precipitable
water derived from microwave radiometers and COSMIC
radio occultation from 2006 to 2013
Shu-Peng Ho1 , Liang Peng1 , Carl Mears2 , and Richard A. Anthes1
1 COSMIC    Program Office, University Corporation for Atmospheric Research, Boulder, Colorado, USA
2 Remote   Sensing Systems, Santa Rosa, California, USA

Correspondence: Shu-Peng Ho (spho@ucar.edu)

Received: 5 June 2017 – Discussion started: 16 August 2017
Revised: 10 November 2017 – Accepted: 21 November 2017 – Published: 10 January 2018

Abstract. We compare atmospheric total precipitable wa-           our data set of about 6.9 %, are a strong indication of the pos-
ter (TPW) derived from the SSM/I (Special Sensor Mi-              itive water vapor–temperature feedback on a warming planet
crowave Imager) and SSMIS (Special Sensor Microwave Im-           in regions where precipitation from extratropical storms is
ager/Sounder) radiometers and WindSat to collocated TPW           already large.
estimates derived from COSMIC (Constellation System for
Meteorology, Ionosphere, and Climate) radio occultation
(RO) under clear and cloudy conditions over the oceans from
June 2006 to December 2013. Results show that the mean            1   Introduction
microwave (MW) radiometer – COSMIC TPW differences
range from 0.06 to 0.18 mm for clear skies, from 0.79 to          Clouds are important regulators for Earth’s radiation and hy-
0.96 mm for cloudy skies, from 0.46 to 0.49 mm for cloudy         drological balances. Water vapor is a primary variable that
but non-precipitating conditions, and from 1.64 to 1.88 mm        affects cloud radiative effects and hydrological feedbacks.
for precipitating conditions. Because RO measurements are         In addition, the three-dimensional distribution of water va-
not significantly affected by clouds and precipitation, the bi-   por is a key factor for cloud formation and distribution (So-
ases mainly result from MW retrieval uncertainties under          den et al., 2002). Held and Soden (2000) and Soden and
cloudy and precipitating conditions. All COSMIC and MW            Held (2006) illustrated that water vapor amounts will in-
radiometers detect a positive TPW trend over these 8 years.       crease in response to global warming. Climate models pre-
The trend using all COSMIC observations collocated with           dict that the column-integrated amount of water vapor, or to-
MW pixels for this data set is 1.79 mm decade−1 , with a          tal precipitable water (TPW), will increase by ∼ 7 % per 1 K
95 % confidence interval of (0.96, 2.63), which is in close       increase in surface temperature (Wentz and Schabel, 2000;
agreement with the trend estimated by the collocated MW           Trenberth et al., 2005; Wentz et al., 2007). Therefore, accu-
observations (1.78 mm decade−1 with a 95 % confidence in-         rate observations of long-term water vapor under both clear
terval of 0.94, 2.62). The sample of MW and RO pairs used         and cloudy skies are important for understanding the role
in this study is highly biased toward middle latitudes (40–       of water vapor in climate as well as cloud formation and
60◦ N and 40–65◦ S), and thus these trends are not represen-      distribution, which is still one of the largest uncertainties
tative of global average trends. However, they are represen-      in understanding climate change mechanisms (IPCC, 2013).
tative of the latitudes of extratropical storm tracks and the     Trends in global and regional vertically integrated total at-
trend values are approximately 4 to 6 times the global av-        mospheric water vapor, or TPW, are important indicators of
erage trends, which are approximately 0.3 mm decade−1 . In        climate warming because of the strong positive feedback be-
addition, the close agreement of these two trends from inde-      tween temperature and water vapor enhancements. Accurate
pendent observations, which represent an increase in TPW in       observations of TPW are therefore important in identifying

Published by Copernicus Publications on behalf of the European Geosciences Union.
260           S.-P. Ho et al.: Comparison of global total precipitable water derived from microwave and COSMIC data

climate change and in verifying climate models, which esti-        et al., 2015; Wentz, 2015). Because the gb-GPS stations are
mate a wide range of TPW trends (Roman et al., 2014).              nearly always located on land, these validation studies use
   The TPW depends on temperature (Trenberth and Guille-           stations located on small and isolated islands (Mears et al.,
mot, 1998; Trenberth et al., 2005). Global TPW can be de-          2015). RSS results for TPW collocated with those derived
rived from satellite visible, infrared, and microwave sensors      from gb-GPS over these island stations show that their mean
(i.e., Wentz and Spencer, 1998; Fetzer et al., 2006; John and      differences vary from station to station and can be as large
Soden, 2007; Fetzer et al., 2008; Noël et al., 2004). However,     as 2 mm. The mean difference also varies with surface wind
no single remote sensing technique is capable of completely        speed, varying from 1 mm at low wind speeds to −1 mm
fulfilling the needs for climate studies in terms of spatial and   at high wind (20 m s−1 ) speeds. The difference is near zero
temporal coverage and accuracy. For example, while water           for the most common wind speeds (6 to 12 m s−1 ). Because
vapor retrievals from visible and infrared satellite sensors are   the uncertainty of the input parameters and change of an-
limited to clear skies over both land areas and oceans, pas-       tenna for each GPS receiver (Bock et al., 2013), the mean
sive microwave (MW) imagers on satellites can provide all          TPW(RSS) – TPW (gb-GPS) can vary from −1.5 to 1.5 mm
sky water vapor products, but only over oceans. These water        for a single MW radiometer (see Fig. 4 in Mears et al., 2015).
vapor products are mainly verified by comparing to reanal-         Wentz (2015) compared 17 years of Tropical Rainfall Mea-
yses, radiosonde measurements, or other satellite data (i.e.,      suring Mission (TRMM) Microwave Imager (TMI) TPW
Soden, and Lanzante, 1996; Sohn and Smith, 2003; Noël et           collocated with gb-GPS TPW over the region from 45◦ N to
al., 2004; Palm et al., 2010; Sohn and Bennartz, 2008; Wick        45◦ S. The mean TMI gb-GPS TPW bias was estimated to be
et al., 2008, hereafter Wick2008; Milz et al., 2009; Prasad        0.45 mm with a standard deviation (σ ) of 2.01 mm.
and Singh, 2009; Pougatchev et al., 2009; Knuteson et al.,            Unlike passive MW radiometers and infrared sensors, ra-
2010; Larar et al., 2010; Wang et al., 2010; Ho et al., 2010a,     dio occultation (RO) is an active remote sensing technique.
b). Results from these validation studies show that the quality    RO can provide all-weather, high-vertical-resolution (from
of water vapor data from different satellite sensors varies un-    ∼ 100 m near the surface to ∼ 1.5 km at 40 km) refractivity
der different atmospheric conditions. The change in reanaly-       profiles (Anthes, 2011). The basis of the RO measurement
sis systems and inconsistent calibration among data may also       is a timing measured against reference clocks on the ground,
cause uncertainty in long-term stability of water vapor esti-      which are timed and calibrated by the atomic clocks at the
mates. In addition, it is well known that radiosonde sensor        National Institute of Standards and Technology (NIST). With
characteristics can be affected by the changing environment        a GPS receiver onboard the LEO (low Earth orbit) satellite,
(Luers and Eskridge, 1998; Wang and Zhang, 2008). Ho et            this technique is able to detect the bending of radio signals
al. (2010b) demonstrated that the quality of radiosonde hu-        emitted by GPS satellites traversing the atmosphere. With the
midity measurements varies with sensor types, adding ex-           information about the relative motion of the GPS and LEO
tra difficulties in making a consistent validation of long-term    satellites, the bending angle profile of the radio waves can be
water vapor products.                                              used to derive all-weather refractivity, pressure, temperature,
   MW imagers are among the very few satellite instruments         and water vapor profiles in the neutral atmosphere (Anthes et
that are able to provide long-term (close to 30 years) all-        al., 2008).
weather time series of water vapor measurements using simi-           Launched in June 2006, COSMIC (Constellation Observ-
lar sensors and retrieval techniques (Wentz, 2015). The mea-       ing System for Meteorology, Ionosphere, and Climate) RO
sured radiances at 19.35, 22.235, and 37.0 GHz from SS-            data have been used to study atmospheric temperature and
MIS and 18.7, 23.8, and 37.0 GHz from WindSat are used             refractivity trends in the lower stratosphere (Ho et al., 2009a,
to derive TPW, total cloud water (TCW), wind speed, and            b, 2012) and modes of variability above, within, and be-
rainfall rates over oceans (Wentz and Spencer, 1998). These        low clouds (Biondi et al., 2012, 2013; Teng et al., 2013;
four variables are retrieved by varying their values until the     Scherllin-Pirscher et al., 2012; Zeng et al., 2012; Mears et
brightness temperatures calculated using a forward model           al., 2012). Wick2008 demonstrated the feasibility of using
match satellite-observed brightness temperatures. Because          COSMIC-derived TPW to validate SSM/I TPW products
MW radiation is significantly affected (absorbed or scat-          over the eastern Pacific Ocean using 1 month of data. Many
tered) by heavy rain, these four variables are only retrieved      studies have demonstrated the usefulness of RO-derived wa-
under conditions of no or light to moderate rain (Schlüssel        ter vapor to detect climate signals of El Niño–Southern Os-
and Emery, 1990; Elsaesser and Kummerow, 2008; Wentz               cillation (ENSO; Teng et al., 2013; Scherllin-Pirscher et al.,
and Spencer, 1998).                                                2012; Huang et al., 2013) and Madden–Julian Oscillation
   Recently, version 7.0 daily ocean products mapped to a          (MJO; Zeng et al., 2012) and improve moisture analysis of
0.25◦ grid derived from multiple MW radiometers were re-           atmospheric rivers (Neiman et al., 2008; Ma et al., 2011).
leased by Remote Sensing Systems (RSS) (Wentz, 2013).                 The objective of this study is to use COSMIC RO TPW
Many validation studies have been performed by RSS by              to characterize the global TPW values and trends derived
comparing the MW TPW retrievals with those from ground-            from multiple MW radiometers over oceans, including un-
based Global Positioning System (gb-GPS) stations (Mears           der cloudy and precipitating skies. COSMIC TPW from June

Atmos. Chem. Phys., 18, 259–274, 2018                                                www.atmos-chem-phys.net/18/259/2018/
S.-P. Ho et al.: Comparison of global total precipitable water derived from microwave and COSMIC data                          261

2006 to December 2013 is compared to co-located TPW de-           Table 1. Satellite instruments used in this study.
rived from MW radiometers over the same time period. Be-
cause RO data are not strongly sensitive to clouds and precip-           Satellite      Instrument     Operation period
itation, COSMIC TPW estimates can be used to identify pos-               DMSP F15       SSM/I          December 1999–present
sible MW TPW biases under different meteorological condi-                DMSP F16       SSMIS          October 2003–present
tions. We describe data sets and analysis methods used in the            DMSP F17       SSMIS          December 2006–present
comparisons in Sect. 2. The comparison results under clear               Coriolis       WindSat        February 2003–present
skies and cloudy skies are summarized in Sects. 3 and 4, re-
spectively. The time series analysis is in Sect. 5. We conclude
this study in Sect. 6.                                            riod are used in this study. Table 1 summarizes the starting
                                                                  date and end date for RSS SSM/I F15, SSMIS F16, SSMIS
                                                                  F17, and WindSat data. The all sky daily RSS ocean prod-
2     RSS version 7.0 data and COSMIC TPW data and                ucts for F15, F16, F17, and WindSat are downloaded from
      comparison method                                           http://www.remss.com/missions/ssmi.

2.1    RSS version 7.0 data ocean products                        2.2   COSMIC TPW products

The RSS version 7.0 ocean products are available for SSM/I,       The atmospheric refractivity N is a function of pressure P ,
SSMIS, AMSR-E, WindSat, and TMI. The inversion algo-              temperature T , water vapor pressure Pw , and water content
rithm is mainly based on Wentz and Spencer (1998), in which       W through the following relationship (Kursinski et al., 1997;
above a cutoff in the liquid water column (2.45 mm), water        Zou et al., 2012):
vapor is no longer retrieved. The various radiometers from
                                                                             P             Pw
the different satellites have been precisely intercalibrated      N = 77.6     + 3.73 × 10⁵ 2 + 1.4Wwater + 0.61Wice ,         (1)
at the radiance level by analyzing the measurements made                     T             T
by pairs of satellites operating at the same time. This was       where P is the pressure in hectopascals, T is the temperature
done for the explicit purpose of producing versions of the        in Kelvin, Pw is the water vapor pressure in hectopascals,
data sets that can be used to study decadal-scale changes in      Wwater is the liquid water content in grams per cubic meter,
TPW, wind, clouds, and precipitation; thus, special attention     and Wice is the ice water content in grams per cubic meter.
was focused on interannual variability in instrument calibra-     The last two terms generally contribute less than 1 % to the
tion. The calibration procedures and physical inversion al-       refractivity and may be ignored (Zou et al., 2012). However,
gorithm used to simultaneously retrieve TPW, surface wind         they can be significant for some applications under condi-
speed (and thereby surface wind stress and surface rough-         tions of high cloud liquid or ice water content, as shown by
ness), and the total liquid water content are summarized in       Lin et al. (2010), Yang and Zou (2012), and Zou et al. (2012).
Wentz (2013, 1997). This allows the algorithm to minimize         We will neglect these terms in this study, but because we are
the effect of wind speed, clouds, and rain on the TPW mea-        looking at small differences between MW and RO TPW in
surement.                                                         cloudy and precipitating conditions in this paper, we esti-
   The RSS version 7.0 daily data are available on a 0.25◦        mate the possible contribution of these terms to RO TPW
latitude × 0.25◦ longitude grid for daytime and nighttime         and the consequences of neglecting them here. Since both
(i.e., 1440 × 720 × 2 per day). Figure 1a–d show the RSS          of these terms increase N, neglecting them in an atmosphere
v7.0 monthly mean F16 SSMIS TPW (in millimeters), sur-            in which they are present will produce a small positive bias
face skin temperature (in Kelvin), liquid water path (LWP,        in water vapor pressure Pw and therefore total precipitable
in millimeters), and rain rate (RR, in millimeters per hour),     water when integrated throughout the entire depth of the at-
respectively, in 2007. Figure 1 shows that the variation in       mosphere.
and distribution of TPW over oceans (Fig. 1a) is, in general,        Typical values of cloud liquid water content range from
closely linked to surface skin temperature variations over the    ∼ 0.2 g m−3 in stratiform clouds to 1 g m−3 in convective
Intertropical Convergence Zone (ITCZ) (Fig. 1b), which is         clouds (Cober et al., 2001). Extreme values may reach
modulated by clouds and the hydrological cycle (Soden et al.,     ∼ 2 g m−3 in deep tropical convective clouds (i.e., cumu-
2002). The distribution of monthly TPW is consistent with         lonimbus). Ice water content values are smaller, typically
that of cloud water, where the highest TPW values (and LWP        0.01–0.03 g m−3 . Heymsfield et al. (2002) reported high ice
and RR) occur in persistent cloudy and strong convective re-      water content values ranging from 0.1 to 0.5 g m−3 in tropi-
gions over the tropical western Pacific Ocean near Indonesia.     cal cirrus and stratiform precipitating clouds, although values
   Because COSMIC reprocessed TPW data are only avail-            rarely reach as high as 1.5 g m−3 in deep tropical convective
able from June 2006 to December 2013 (i.e., COSMIC2013),          clouds (Leroy et al., 2017).
the SSM/I F15, SSMIS F16, SSMIS F17, and WindSat RSS                 For extremely high values of Wwater and Wice of 2.0 and
version 7.01 ocean products covering the same time pe-            0.5 g m−3 , the contributions to N are 2.8 and 0.3, respec-

www.atmos-chem-phys.net/18/259/2018/                                                   Atmos. Chem. Phys., 18, 259–274, 2018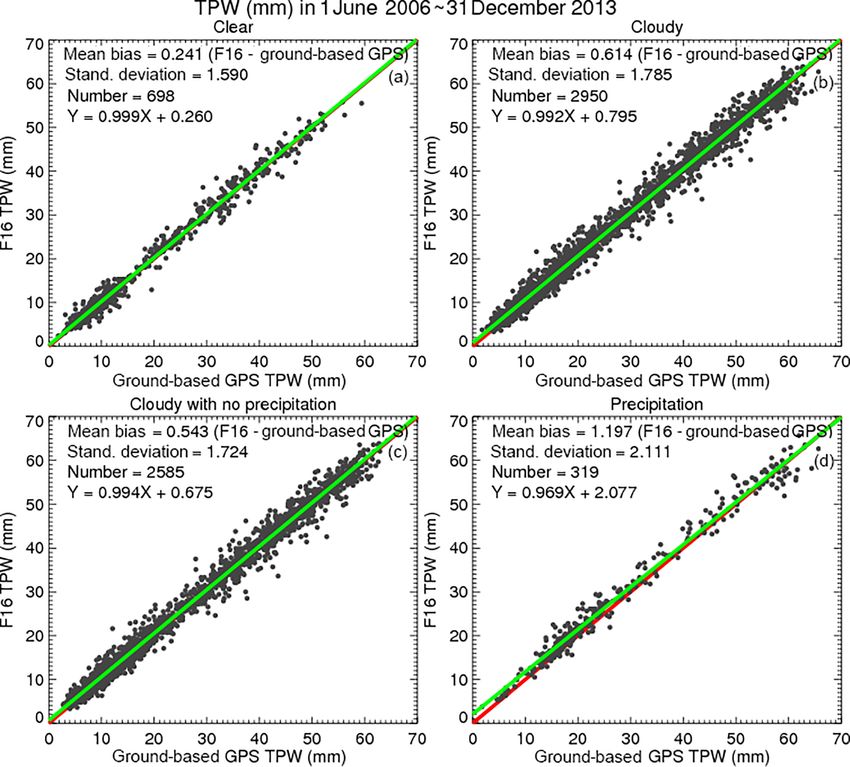
262           S.-P. Ho et al.: Comparison of global total precipitable water derived from microwave and COSMIC data

Figure 1. (a–e) The RSS v7.0 monthly mean F16 SSM/I (a) TPW (mm), (b) surface skin temperature (K), (c) liquid water path (LWP, mm),
and (d) rain rate (RR, mm h−1 ) and (e) distribution of matches of COSMIC RO and F16, F17, and WindSat estimations of TPW used in this
study.

tively. The values of N in the atmosphere decrease expo-             by neglecting the liquid and water terms in Eq. (1) will be
nentially upward, from ∼ 300 near the surface to ∼ 150 at            less than 1 %.
P = 500 hPa. Using the extreme values above at 500 hPa,                 To resolve the ambiguity of COSMIC refractivity asso-
Wwater may contribute from up to 1.6 % of N and Wice up              ciated with both temperature and water vapor in the lower
to 0.2 %. Thus, we may assume that in most cases the error           troposphere, a 1D-Var algorithm (http://cdaac-www.cosmic.
in N due to neglecting these terms will be less than 1 %. The        ucar.edu/cdaac/doc/documents/1dvar.pdf) is used to derive
effect on TPW will be even less since clouds do not generally        optimal temperature and water vapor profiles while tempera-
extend through the full depth of the atmosphere. Finally, the        tures and water vapor profiles from the ERA-Interim reanal-
∼ 200 km horizontal averaging scale of the RO observation            ysis are used as a priori estimates (Neiman et al., 2008; Zeng
footprint makes it unlikely that such extremely high values          et al., 2012).
of water and ice content will be present over this scale. We            Note that because RO refractivity is very sensitive to wa-
conclude that the small positive bias in RO TPW introduced           ter vapor variations in the troposphere (Ho et al., 2007), and

Atmos. Chem. Phys., 18, 259–274, 2018                                                   www.atmos-chem-phys.net/18/259/2018/
S.-P. Ho et al.: Comparison of global total precipitable water derived from microwave and COSMIC data                         263

is less sensitive to temperature errors, the RO-derived water     relative humidity below 0.1 km introduces an uncertainty of
vapor product is of high accuracy (Ho et al., 2010a, b). It       about ±0.03 mm in the water vapor–COSMIC comparisons
is estimated that 1 K of temperature error will introduce less    for all conditions. As shown in Sect. 4, this uncertainty is
than 0.25 g kg−1 of water vapor bias in the troposphere in the    small compared to the observed differences between the RO
1D-Var retrievals. Although the first-guess temperature and       and MW estimates.
moisture are needed for the 1D-Var algorithm, the retrieved          Pairs of MW and RO TPW estimates collocated within
water vapor profiles are weakly dependent on the first-guess      50 km and 1 h are collected. The location of RO observa-
water vapor profiles (Neiman et al., 2008).                       tion is defined by the RO tangent point at 4–5 km altitude.
   The horizontal footprint of a COSMIC observation is            Wick2008 used MW–RO pairs within 25 km and 1 h in time.
about 200 km in the lower troposphere and its vertical res-       To evaluate the effect of the spatial difference on the TPW
olution is about 100 m near the surface and 1.5 at 40 km.         difference, we also computed TPW differences for MW–
The COSMIC post-processed water vapor profiles ver-               RO pairs within 75, 100, 150, and 200 km. We found that
sion 2010.2640 collected from the COSMIC Data Analy-              the larger spatial difference increases the mean TPW bi-
sis and Archive Center (CDAAC) (http://www.cosmic.ucar.           ases slightly to ±0.25 mm and the standard deviations to
edu/) are used to construct the COSMIC TPW data. To fur-          ±1.91 mm, which is likely because of the high spatial vari-
ther validate the accuracy of COSMIC-derived water vapor,         ability in water vapor. Note that, although not shown, the
we have compared COSMIC TPW values with those derived             mean biases and standard deviations of the mean biases are
from ground-based GPS (i.e., International Global Naviga-         slightly larger over the tropics than over midlatitudes. This
tion Satellite Systems–IGS; Wang et al., 2007), which are         could be because of the combined effect of the larger spatial
assumed to be independent of location. Only those COSMIC          TPW variation in the tropical region than that in the midlati-
profiles whose lowest penetration heights are within 200 m        tudes (see Fig. 1a and Neiman et al., 2008; Teng et al., 2013;
of the height of ground-based GPS stations are included. Re-      Mears et al., 2015) and the fact that the MW TPW retrieval
sults showed that the mean global difference between IGS          uncertainty is also larger over stronger convection regions.
and COSMIC TPW is about −0.2 mm with a standard devia-            More results are detailed in Sect. 4.
tion of 2.7 mm (Ho et al., 2010a). Similar comparisons were          With a 0.25◦ × 0.25◦ grid, there are about 20 to 60 MW
found by Teng et al. (2013) and Huang et al. (2013).              pixels matching one COSMIC observation. The number of
                                                                  pixels varies at different latitudes. A clear MW–RO pair is
2.3   Preparation of COSMIC TPW data for comparison               defined as instances when all the TCW values for the col-
                                                                  located MW pixels are equal to zero. A cloudy MW–RO en-
In this study, only those COSMIC water vapor profiles pen-        semble is defined as instances when all the TCW values from
etrating lower than 0.1 km are integrated to compute TPW.         the collocated MW pixels are larger than zero. Partly cloudy
Approximately 70 to 90 % of COSMIC profiles reach to              conditions (some of pixels zero and some nonzero) are ex-
within 1 km of the surface (Anthes et al., 2008). Usually         cluded from this study. The cloudy ensembles are further
more than 30 % of COSMIC water vapor profiles reach be-           divided into precipitating and non-precipitating conditions.
low 0.1 km in the midlatitudes and higher latitudes and a lit-    MW–RO pairs are defined as cloudy non-precipitating when
tle bit less than 10 % in the tropical regions. To compensate     less than 20 % of MW pixels have rainfall rates larger than
for the water vapor amount below the penetration height, we       0 mm h−1 . Cloudy precipitating MW–RO pairs are defined
follow the following procedure:                                   when more than 20 % of the pixels have rainfall rates larger
  i. We assume that the relative humidity below the penetra-      than zero. Because microwave radiances are not sensitive to
     tion height is equal to 80 %. This is a good assumption,     ice, we treat cloudy pixels of low density like cirrus clouds
     especially over oceans near the sea surface (Mears et al.,   as clear pixels.
     2015).                                                          The matching pairs of RO and MW observations are not
                                                                  distributed uniformly over the world’s oceans. In fact, they
 ii. The temperatures below the penetration height are taken      are heavily concentrated in middle latitudes, as shown in
     from the ERA-Interim reanalysis.                             Fig. 1e. This biased distribution is caused by several factors,
                                                                  including the polar orbits of the satellites, which produce
 iii. We compute the water vapor mixing ratio below the           more observations in higher latitudes, and also the failure of
      penetration heights.                                        many COSMIC RO soundings to penetrate to 0.1 km in the
 iv. We integrate the TPW using COSMIC water vapor pro-           subtropics and tropics (due to super-refraction, which is of-
     files above the penetration heights with those water va-     ten present in these regions). Thus, the results presented here,
     por profiles below the penetration heights.                  especially the trends, are not representative of global aver-
                                                                  ages. However, the main purpose of this paper is to compare
  The COSMIC TPW estimates are not very sensitive to the          two independent satellite systems for obtaining TPW under
assumption of 80 % relative humidity below 0.1 km (step i         varying sky conditions. If the agreement is good, one has
above). The assumption of 80 % ± 10 % (i.e., 90 and 70 %)         confidence in both systems. In this case, SSM/I and Wind-

www.atmos-chem-phys.net/18/259/2018/                                                  Atmos. Chem. Phys., 18, 259–274, 2018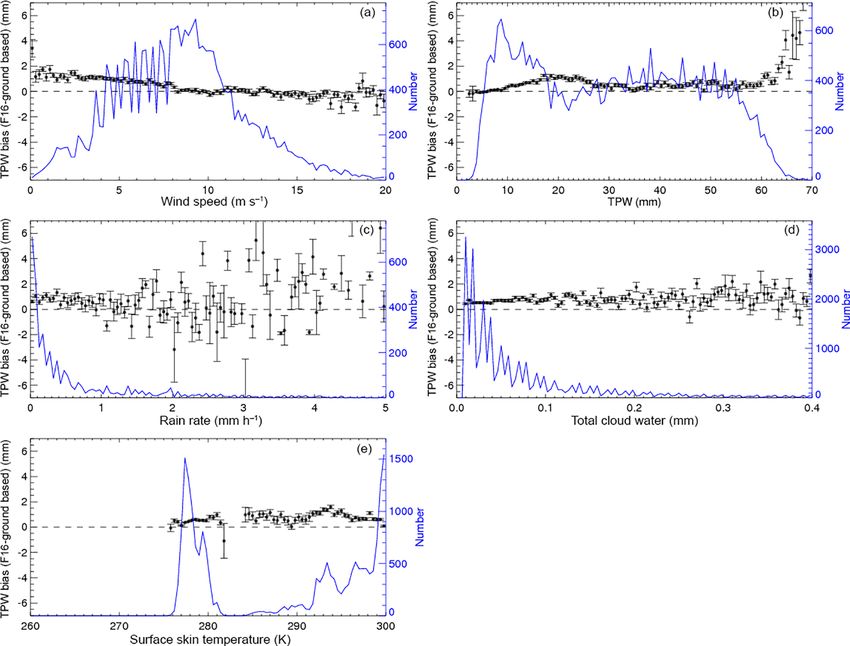
264 S.-P. Ho et al.: Comparison of global total precipitable water derived from microwave and COSMIC data
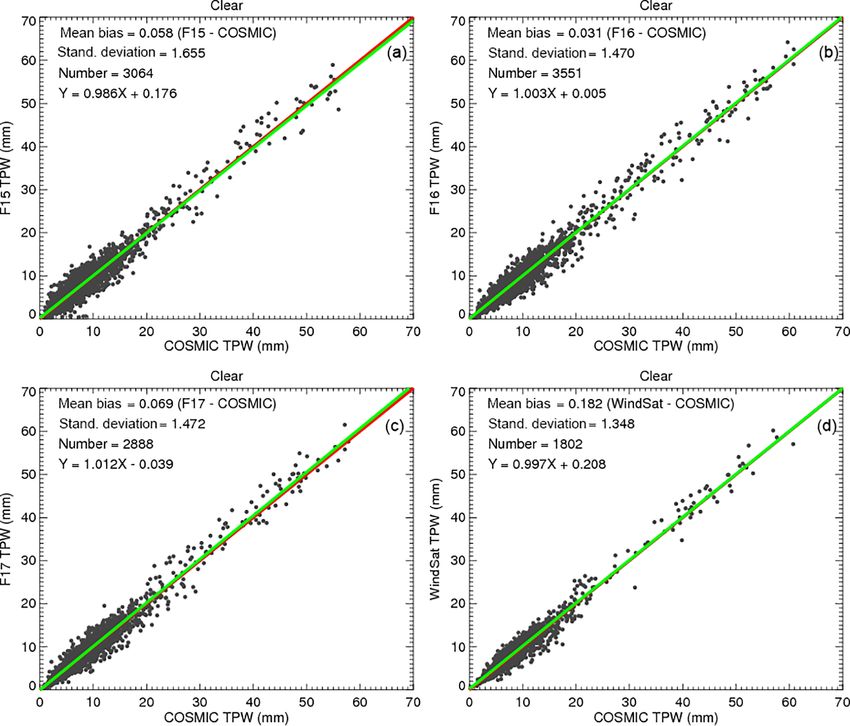
Figure 2. TPW scatter plots for the COSMIC and RSS version 7.0 pairs under clear conditions for (a) F15, (b) F16, (c) F17, and (d) WindSat.
Sat estimates of TPW will be verified and can then be used ter August 2006 were corrupted by the “rad-cal” beacon that
with confidence globally, including where RO observations was turned on at this time (Hilburn and Wentz, 2008). On
are sparse or do not exist. 14 August 2006, a radar calibration beacon (rad-cal) was ac-
tivated on F15. This radar interfered with the SSM/I, pri-
marily the 22V channel, which is a key channel for water
3 Comparison of MW and RO TPW with clear skies vapor retrievals. Although a correction method derived by
Hilburn and Wentz (2008) and Hilburn (2009) was applied,
In total there are 26 678 F15–RO pairs, 32 610 F16–RO the 22V channel is not fully corrected (Wentz, 2013). As a
pairs, 31 291 F17–RO pairs, and 21 996 WindSat–RO pairs result, there are still errors in the water vapor retrievals. F16
from June 2006 to December 2013. Figure 2a–d show scat- had solar radiation intrusion into the hot load during the time
ter plots for F15–COSMIC TPW, F16–COSMIC TPW, F17– period, while F17 and WindSat had no serious issues.
COSMIC TPW, and WindSat–COSMIC TPW under clear
skies. Figure 2a–d show that the MW clear sky TPW val-
ues from F15, F16, F17, and WindSat are all very con- 4 Global comparisons of MW and RO TPW with
sistent with those from co-located COSMIC observations. cloudy skies
As summarized in Table 2, under clear conditions where
SSM/I provides high-quality TPW estimates, the mean TPW 4.1 Comparison of MW, RO, and ground-based GPS
bias between F16 and COSMIC (F16–COSMIC) is equal to TPW
0.03 mm with a standard deviation σ of 1.47 mm. The mean
TPW differences are equal to 0.06 mm with a σ of 1.65 mm Figure 3a–c depict the scatter plots for F16–COSMIC pairs
for F15, 0.07 mm with a σ of 1.47 mm for F17, and 0.18 mm under cloudy, cloudy non-precipitating, and precipitating
with a σ of 1.35 mm for WindSat. The reason for a larger conditions from June 2006 to December 2013 over oceans.
standard deviation for F15 may be because the F15 data af- While there is a very small bias (0.031 mm) for clear pixels
Atmos. Chem. Phys., 18, 259–274, 2018 www.atmos-chem-phys.net/18/259/2018/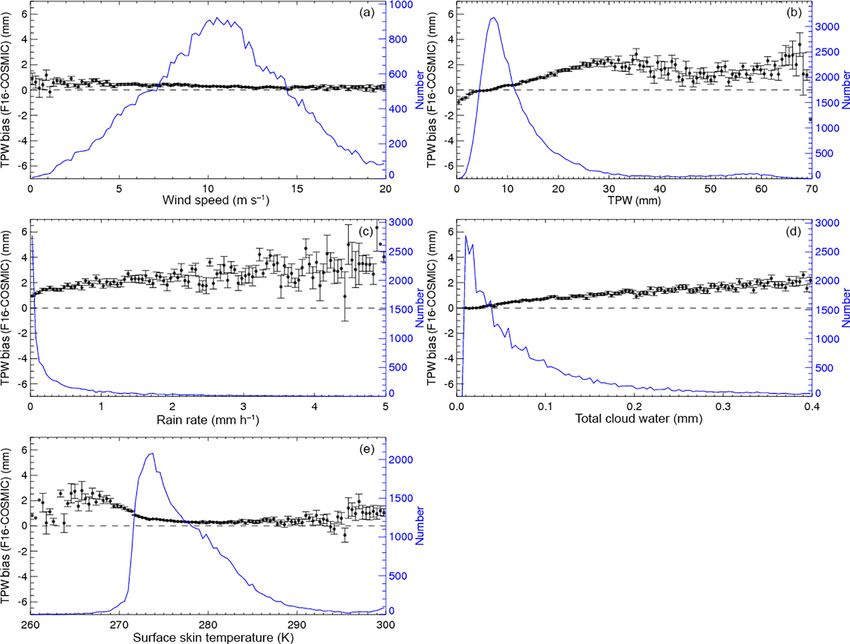
S.-P. Ho et al.: Comparison of global total precipitable water derived from microwave and COSMIC data 265
Table 2. Mean and standard deviation of differences (MW minus RO) in TPW (mm) between four MW radiometers and COSMIC RO under
various sky conditions. The sample numbers for each pair are shown in the third position of each column.
Sky condition Mean/σ /N
F15 F16 F17 WindSat
Clear 0.06/1.65/3064 0.03/1.47/3551 0.07/1.47/2888 0.18/1.35/1802
Cloudy 0.80/1.92/23 614 0.79/1.73/29 059 0.82/1.76/28 403 0.96/1.73/20 194
Non-precip. 0.49/1.69/17 223 0.46/1.46/21 854 0.47/1.49/21 371 0.49/1.36/13 004
Precip. 1.64/2.28/6391 1.83/2.05/7205 1.88/2.08/7032 1.85/2.00/7190
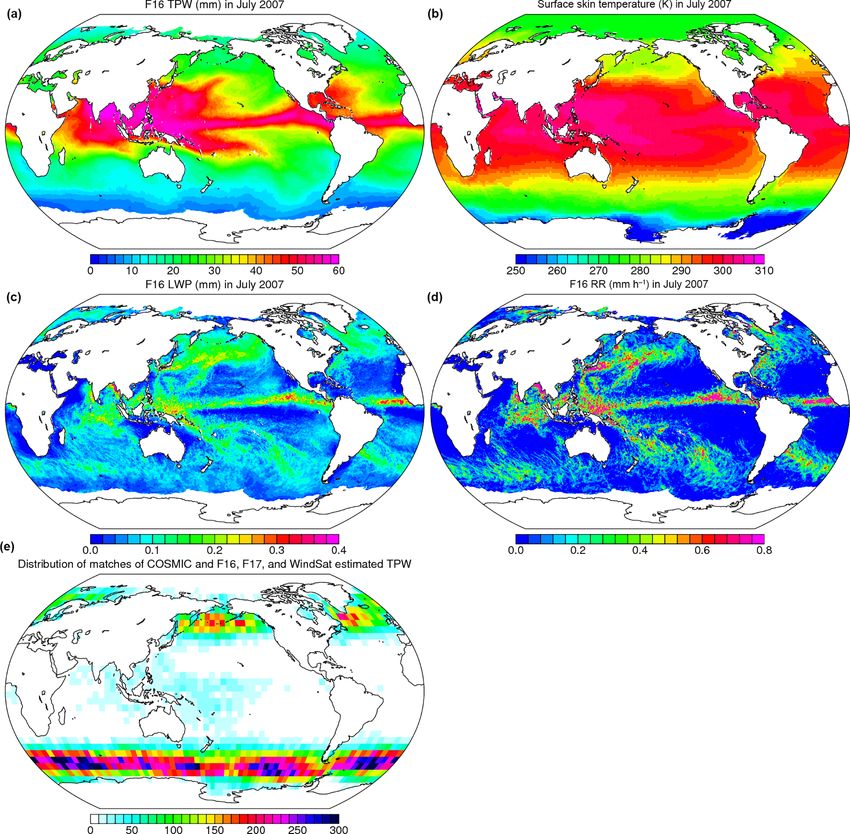
(Fig. 2b), there is a significant positive TPW bias (0.794 mm)
under cloudy conditions (Fig. 3a). This may explain the
close to 0.45 mm mean TMI gb-GPS TPW biases found by
Wentz (2015) in which close to 7 years of data were used.
Figure 3c depicts that the large SSM/I TPW biases under
cloudy skies are mainly from the pixels with precipitation
(mean bias is equal to 1.825 mm) although precipitation pix-
els are of about less than 6 % of the total F16–COSMIC
pairs. Because RO measurements are not significantly af-
fected by clouds and precipitation, the biases mainly result
from MW retrieval uncertainty under cloudy conditions. The
fact that the MW–COSMIC biases for precipitating condi-
tions (1.825 mm, Fig. 3c, and 1.64–1.88 mm in Table 2) are
much larger than those for cloudy but non-precipitating con-
ditions indicates that significant scattering and absorbing ef-
fects are present in the passive MW measurements when
it rains. The correlation coefficients for F15–RO, F16–RO,
F17–RO, and WindSat–RO pairs for all sky conditions are
all larger than 0.96 (not shown).
MW and gb-GPS TPW comparisons show differences
similar to the MW–RO differences under different sky con-
ditions. We compared F16 pixels with those from gb-GPS
within 50 km and 1 h over the 33 stations studied by Mears et
al. (2015) from 2002 to 2013. Figure 4a–d depict the scatter
plots for F16 gb-GPS TPW under clear, cloudy, cloudy non-
precipitating, and cloudy precipitating conditions, respec-
tively. The F16-gb-GPS mean biases are equal to 0.241 mm
(clear skies), 0.614 mm (cloudy skies), 0.543 mm (cloudy
non-precipitating), and 1.197 mm (precipitating), which are
similar to those estimated from MW–RO comparisons (Ta-
ble 2).
The results above show that the MW estimates of TPW are
biased positively compared to both the RO and the ground-
based GPS estimates, which are independent measurements.
The biases are smallest for clear skies and largest for pre-
cipitating conditions, with cloudy, non-precipitating biases
in between. Overall, the results suggest that clouds and es-
pecially precipitation contaminate the MW radiometer mea-
surements, which in turn affect the MW TPW retrievals.
Figure 3. TPW scatter plots for the COSMIC and RSS version 7.0
F16 SSM/I pairs under (a) cloudy, (b) cloudy but non-precipitating,
and (c) precipitating conditions.
www.atmos-chem-phys.net/18/259/2018/ Atmos. Chem. Phys., 18, 259–274, 2018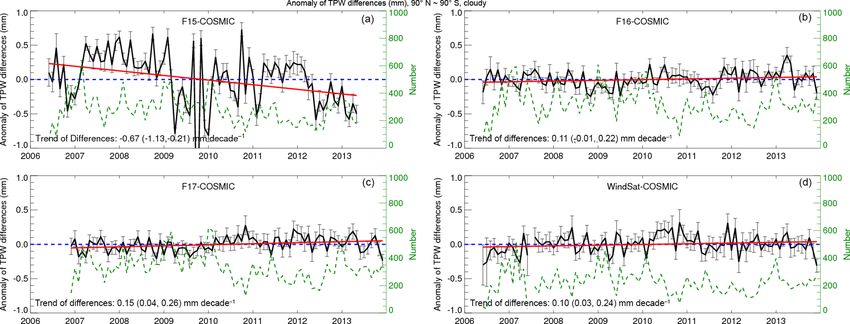
266           S.-P. Ho et al.: Comparison of global total precipitable water derived from microwave and COSMIC data

Figure 4. TPW scatter plots for the gb-GPS and RSS version 7.0 F16 SSM/I pairs from June 2006 to December 2013 under (a) clear,
(b) cloudy, (c) cloudy but non-precipitating, and (d) precipitating conditions.

4.2   Time series of MW, RO, and ground-based TPW                 magnitudes of the MW gb-GPS TPW differences under high
      biases under various meteorological conditions              rain rate and high total cloud water conditions are somewhat
                                                                  smaller than those of MW–RO pairs (varying from about 0.5
                                                                  to 2.0 mm), which may be because most of the MW gb-
To further examine how rain and cloud droplets affect the         GPS samples are collected under low rain rates (less than
MW TPW retrievals, we show how the F16–RO TPW biases              1 mm h−1 ).
vary under different meteorological conditions in Fig. 5. The
bias dependence on wind speed (Fig. 5a) is small. Unlike the
results from Mears et al. (2015), the mean TPW biases be-         5     An 8-year time series and trend analysis under all
tween F16 and COSMIC are within 0.5 mm with high winds                  skies
(wind speed larger than 20 m s−1 ). Figure 5b indicates that
the F16–COSMIC bias is larger, with a TPW greater than            5.1    Monthly mean TPW time series comparison
about 10 mm, which usually occurs under cloudy conditions.
The F16–COSMIC biases can be as large as 2.0 mm when the          To further examine MW TPW long-term stability and trend
rainfall rate is larger than 1 mm h−1 (Fig. 5c), which usually    uncertainty due to rain and water droplets for different in-
occurs with high total liquid cloud water conditions. The F16     struments, we compared time series of the MW and COS-
TPW biases can be as large as 2 mm when total cloud water is      MIC monthly mean TPW differences from June 2006 to De-
larger than 0.3 mm (Fig. 5d). Figure 5e shows that the larger     cember 2013. Figure 7a–d show the monthly mean F16–
F16–COSMIC TPW biases (2–3 mm) mainly occur over re-              COSMIC TPW differences from June 2006 to December
gions with a surface skin temperature less than 270 K (higher     2013 for clear, cloudy, cloudy non-precipitating, and pre-
latitudes; see Fig. 1b). The F15, F17, and WindSat TPW bi-        cipitating conditions. In general, the microwave TPW bi-
ases under different meteorological conditions are very sim-      ases under different atmospheric conditions are positive and
ilar to those of F16 (not shown).                                 stable from June 2006 to December 2013, as reflected in
   In Fig. 6 we compare RSS v7.0 F16 MW TPW to the                relatively small standard deviation values (Table 3). Except
gb-GPS TPW over various meteorological conditions. The            for F15, the standard deviations of the monthly mean TPW

Atmos. Chem. Phys., 18, 259–274, 2018                                                www.atmos-chem-phys.net/18/259/2018/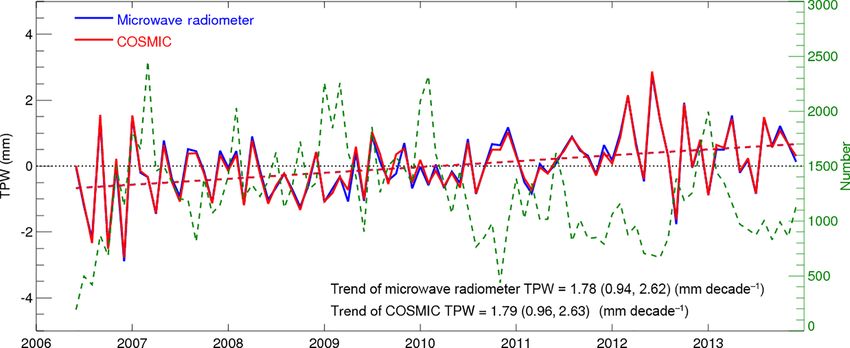
S.-P. Ho et al.: Comparison of global total precipitable water derived from microwave and COSMIC data                            267

Figure 5. Mean and standard of the mean for the F16–COSMIC TPW biases varying with (a) wind speed (m s−1 ), (b) TPW (mm), (c) rain
rate (mm h−1 ), (d) total cloud water (mm), and (e) surface skin temperature (K). The vertical black bracket superimposed on the mean
denotes the standard error of the mean. The green dashed line is the number of samples, indicated by the scale on the right.

Table 3. Mean and standard deviation (SD) of the mean in millimeters of the monthly time series of differences of MW minus RO TPW
under various sky conditions. The trend of the RO estimates of TPW (mm decade−1 ) and the 95 % confidence level are shown below the
mean and σ values in each row.

                Sky condition                              Mean and σ of monthly time series
                                                RO trend (95 % confidence levels indicated in parentheses)
                                                  F15                  F16                  F17              WindSat
                Clear                        0.07/0.56            0.05/0.28            0.08/0.27             0.23/0.38
                                      1.65 (0.47,2.84)   1.09 (−0.28,2.46)    0.21 (−1.22,1.65)    −0.12 (−1.89,1.66)
                Cloudy                       0.77/0.51            0.78/0.18            0.82/0.15             0.95/0.17
                                      1.49 (0.40,2.58)      2.02(0.87,3.16)     1.85 (0.64,3.06)      1.85 (0.68,3.01)
                Non-precipitating            0.46/0.48            0.45/0.17            0.48/0.15             0.47/0.19
                                    0.86 (−0.24,1.95)      2.02 (0.87,3.17)     2.37 (1.23,3.50)      2.12 (0.95,3.30)
                Precipitating                1.62/0.69            1.81/0.31            1.88/0.29             1.88/0.32
                                     2.52 (0.55,4.480    1.32 (−0.53,3.17)    0.26 (−1.59,2.10)     0.39 (−1.25,2.04)

anomaly range are less than 0.38 mm (Table 3). In contrast,          range from −0.12 mm decade−1 (WindSat, clear skies) to
the F15–COSMIC monthly mean σ values range from 0.48                 2.52 mm decade−1 (F15, precipitating conditions). The over-
to 0.69 mm with different conditions.                                all trend of TPW as estimated by RO (second line in each
   Table 3 also shows the trend in the RO estimates of               row of Table 3) is positive, as discussed in the next section.
TPW differences over the 8-year period of study. The trends          Table 3 shows that in general the trends are more strongly

www.atmos-chem-phys.net/18/259/2018/                                                      Atmos. Chem. Phys., 18, 259–274, 2018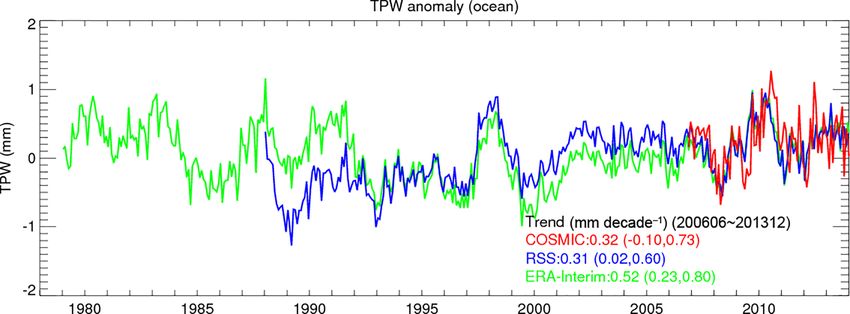
268            S.-P. Ho et al.: Comparison of global total precipitable water derived from microwave and COSMIC data

Figure 6. Mean and standard of the mean for the F16 gb-GPS TPW biases varying with (a) wind speed (m s−1 ), (b) TPW (mm), (c) rain rate
(mm h−1 ), (d) total cloud water (mm), and (e) surface skin temperature (K). The vertical black bracket superimposed on the mean denotes
the standard error of the mean. The green dashed line is the number of samples, indicated by the scale on the right.

Figure 7. The time series of monthly mean F16 – COSMIC TPW differences under (a) clear, (b) cloudy, (c) cloudy but non-precipitating, and
(d) precipitating conditions. The black line is the mean difference for microwave radiometer minus COSMIC; the vertical lines superimposed
on the mean values are the standard error of the mean. The number of the monthly MW radiometer–COSMIC pairs is indicated by the green
dashed line (scale on the right y axis).

Atmos. Chem. Phys., 18, 259–274, 2018                                                      www.atmos-chem-phys.net/18/259/2018/
S.-P. Ho et al.: Comparison of global total precipitable water derived from microwave and COSMIC data                                  269

Figure 8. The time series of deseasonalized TPW differences (microwave radiometer – COSMIC) under cloudy skies for (a) F15, (b) F16,
(c) F17, and (d) WindSat. The black line is the mean difference for microwave radiometer minus COSMIC; the vertical lines superimposed
on the mean values are the standard error of the mean. The number of the monthly MW radiometer–COSMIC pairs is indicated by the green
dashed line (scale on the right y axis). The trends are shown by a solid red line. The 95 % confidence intervals for slopes are shown in the
parentheses.

positive under cloudy and precipitating conditions compared             estimates is 1.78 mm decade−1 with a 95 % confidence in-
to clear conditions.                                                    terval of [0.94, 2.62]. This close agreement between com-
                                                                        pletely independent measurements lends credence to both es-
5.2   Deseasonalized trends of MW–RO TPW differences                    timates. The mean TPW over this period, calculated from all
                                                                        MW data in our data set was 26.04 mm; thus, the trend of
Figure 8 depicts the deseasonalized trends of the MW–                   1.78 mm decade−1 represents a trend of approximately 6.9 %
RO TPW differences for F15 (Fig. 8a), F16 (Fig. 8b), F17                per decade for our data set.
(Fig. 8c), and WindSat (Fig. 8d) under cloudy skies. Except                As discussed earlier, the trend of 1.78 mm decade−1 is
for F15, the deseasonalized trends of the MW–RO TPW dif-                heavily biased toward middle latitudes (40–60◦ N and 40–
ferences for the MW radiometers are close to zero, indicating           65◦ S) and is not representative of a global average. In fact,
little change over these 8 years. The trends of the biases as-          it is four to six times larger than previous estimates over
sociated with F15, F16, F17, and WindSat under all sky con-             earlier time periods. For example, Durre et al. (2009) esti-
ditions range from −0.09 to 0.27 mm decade−1 (details not               mated a trend of 0.45 mm decade−1 for the Northern Hemi-
shown).                                                                 sphere over the period 1973–2006. Trenberth et al. (2005)
    The reason for larger standard deviations of the MW mi-             estimated a global trend of 0.40 ± 0.09 mm decade−1 for the
nus RO differences for F15 (Tables 2 and 3 and Fig. 8a) is              period 1988 to 2001. Using SSM/I data, Wentz et al. (2007)
very likely because the F15 data after August 2006 were cor-            estimated an increase of 0.354 mm decade−1 over the period
rupted by the rad-cal beacon that was turned on at this time.           1997–2006. The 100-year trend in global climate models is
Adjustments were derived and applied to reduce the effects              variable, ranging from 0.55 to 0.72 mm decade−1 (Roman et
of the beacon, but the final results still show excess noise            al., 2014).
relative to uncorrupted measurements (Hilburn and Wentz,                   The very close agreement between RO and MW observa-
2008). RSS does not recommend using these measurements                  tions where they coexist gives credibility to both observing
for studies of long-term change. Thus, we consider the F15              systems and allows us to use global MW data to compute
data less reliable during the period of our study.                      global TPW trends over all oceanic regions, including where
    Figure 9 shows the deseasonalized time series of the                RO observations are sparse or absent. Figure 10 shows the
monthly mean TPW for all MW and RO pairs under all                      global map of TPW trends over oceans using all F16, F17,
sky conditions. The nearly 8-year trends for TPW esti-                  and WindSat data from 2006 to 2013. Figure 10 shows that
mated from both passive MW radiometers and active COS-                  the positive trends in TPW occur mainly over the central and
MIC RO sensors are positive and very similar in mag-                    northern Pacific, south of China and west of Australia, south-
nitude. The mean trend of all COSMIC RO TPW is                          east of South America, and east of America. Positive trends
1.79 mm decade−1 with a 95 % confidence interval of [0.96,              also exist in general over the middle latitudes (40–60◦ N and
2.63] mm decade−1 while the mean trend from all the MW

www.atmos-chem-phys.net/18/259/2018/                                                         Atmos. Chem. Phys., 18, 259–274, 2018
270 S.-P. Ho et al.: Comparison of global total precipitable water derived from microwave and COSMIC data
Figure 9. The deseasonalized time series of monthly mean TPW for all MW and COSMIC observations under all sky conditions. The red
and blue dashed lines are the best fit of deseasonalized COSMIC and MW TPW time series, respectively.
pose of producing versions of the data sets that can be used
to study decadal-scale changes in TPW, wind, clouds, and
precipitation. These water vapor products are mainly veri-
fied by comparing to reanalyses, radiosonde measurements,
or other satellite data. However, because the quality of these
data sets may also vary under different atmospheric con-
ditions, the uncertainty in long-term water vapor estimates
may still be large. In this study, we used TPW estimates de-
rived from COSMIC active RO sensors to identify TPW un-
certainties from four different MW radiometers under clear,
cloudy, cloudy and non-precipitating, and cloudy and precip-
itating skies over nearly 8 years (from June 2006 to Decem-
ber 2013). Because RO data have low sensitivity to clouds
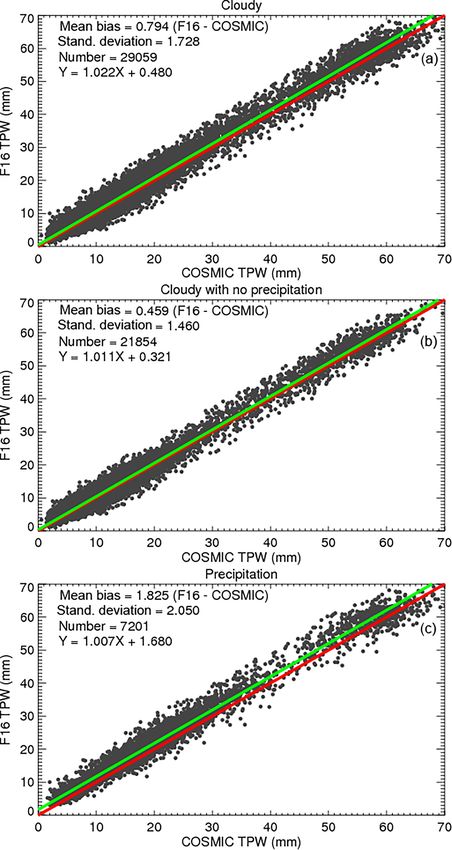
Figure 10. The global map of TPW trend in millimeters per decade and precipitation, RO-derived water vapor products are use-
over oceans using all F16, F17, and WindSat data from 2006 to ful for identifying the possible TPW biases retrieved from
2013. measurements of passive microwave imagers under different
sky conditions. We reach the following conclusions:
40–65◦ S) where most of our matching RO and MW data 1. Clear sky biases. The collocated COSMIC RO TPW
pairs occur. estimates under clear skies are highly consistent with
Mears et al. (2017) computed global average (60◦ S to the MW TPW estimates under clear sky conditions
60◦ N) TPW using a number of data sets from 1979 to (within ±0.2 mm and with a correlation coefficient
2014. Figure 11 shows the data from the ERA-Interim re- greater than 0.96). The mean TPW bias between F16
analysis (Dee et al., 2011), RSS MW, and COSMIC. (This and COSMIC (F16–COSMIC) is equal to 0.03 mm with
figure was obtained using the same data used to construct a standard deviation σ of 1.47 mm. The mean TPW dif-
Fig. 2.16 in Mears et al., 2017). Figure 11 shows close agree- ferences are equal to 0.06 mm with a σ of 1.65 mm
ment between RSS MW and COSMIC. The global mean for F15, 0.07 mm with a σ of 1.47 mm for F17, and
trend from June 2006 to December 2013 from the COS- 0.18 mm with a σ of 1.35 mm for WindSat. The con-
MIC observations is 0.32 mm decade−1 and for RSS MW it sistent F15–COSMIC, F16–COSMIC, F17–COSMIC,
is 0.31 mm decade−1 . and WindSat–COSMIC TPW under clear skies show
that COSMIC TPW can be used as reliable reference
data to identify and correct TPW among different MW
6 Conclusions and discussions imagers for other sky conditions.
RSS water vapor products have been widely used for cli- 2. Biases under cloudy skies. While there are very small
mate research. The newly available RSS v7.0 data prod- biases for clear pixels, there are significant positive
ucts have been processed using consistent calibration pro- MW TPW biases (∼ 0.80 mm) under cloudy conditions
cedures (Wentz, 2013). This was done for the explicit pur- when compared to RO TPW. The large SSM/I TPW bi-
Atmos. Chem. Phys., 18, 259–274, 2018 www.atmos-chem-phys.net/18/259/2018/S.-P. Ho et al.: Comparison of global total precipitable water derived from microwave and COSMIC data 271
Figure 11. Global mean TPW monthly anomaly (mm) relative to 1981–2010 mean for ocean regions 60◦ S–60◦ N from ERA-Interim
reanalysis (green), RSS microwave (blue), and COSMIC (red). (Based on data from Mears et al., 2017).
ases under cloudy skies result mainly from the pixels [0.88, 2.76]. These increases represent about a 6.9 % per
with precipitation. The mean bias is equal to 1.83 mm decade increase in the mean TPW of our data set. The
for COSMIC–F16 pairs, which is much larger than close agreement between completely independent mea-
the bias for cloudy, but non-precipitating conditions. surements lends credence to both estimates.
This indicates that the significant scattering and absorb-
ing effects are present in the passive MW measure- The trends of TPW in our data set, which are heavily bi-
ments when it rains. The F16 − gb-GPS mean biases ased toward middle latitudes (40–60◦ N and 40–65◦ S) are
are equal to 0.24 mm (for clear skies), 0.61 mm (for higher than previous global estimates over earlier time peri-
cloudy skies), 0.54 mm (for cloudy/non-precipitating ods by about a factor of 4 to 6. As also shown by the regional
skies), and 1.2 mm (for precipitating skies), which are distribution of TPW trends estimated from the MW observa-
consistent with those from F16–COSMIC comparisons. tions, the large positive trends in these latitudes, which are
3. Biases among different instruments. Using RO TPW the main latitudes of extratropical storm tracks, are a strong
estimates collocated with different MW instruments, confirmation of the water vapor–temperature feedback in a
we are able to identify possible TPW inconsistencies warming global atmosphere, particularly under cloudy con-
among MW instruments even they are not collocated. ditions.
The deseasonalized trends in MW–RO TPW differences Other studies have suggested that this positive feedback
for three MW radiometers (i.e., F16, F17, and WindSat) results in a nearly constant global mean relative humidity
are close to zero, indicating consistency among these ra- (Soden and Held, 2006; Sherwood et al., 2010). However,
diometers. However, the F15–COSMIC differences are it is difficult to directly relate our estimated TPW trends
larger and show a significant trend over the 8 years of to a constant RH hypothesis of Earth’s atmosphere under
the study. It is likely that F15 data after August 2006 global warming. The global mean surface temperature has
were corrupted by the rad-cal beacon that was turned on been rising at about the rate of 0.2 K decade−1 in the past
at this time. 20 years. A 0.2 K increase in temperature would produce
about a 1.4 % increase in saturation water vapor pressure
4. Trend of TPW under all skies. The 8-year trends based on the Clausius–Clapyron equation. To maintain a con-
of TPW estimated from both passive MW radiometer stant RH for this temperature increase, the actual water vapor
and active COSMIC sensors in our data set show in- pressure (and specific humidity) would also have to increase
creasing TPW, with slightly higher trends under cloudy by 1.4 %. In this study, we observe an increase in TPW in
conditions. The mean trend of COSMIC RO TPW our data set of about 1.78 mm decade−1 , which is a 6.9 % in-
collocated with MW observations in our data set is crease per decade in TPW. Our data set is dominated mainly
1.79 mm decade−1 with a 95 % confidence interval of by cloudy samples over middle latitudes (40–60◦ N and 40–
[0.96, 2.63] mm decade−1 . The corresponding mean 65◦ S). Thus, from these numbers alone we would expect
trend from all the MW estimates is 1.78 mm decade−1 an increase in mean RH under cloudy conditions by more
with a 95 % confidence interval of [0.94, 2.62]. The than 6 %, which is unlikely and well outside the range of
mean trend from all the MW estimates under cloudy changes in relative humidity in models (e.g., Fig. 2 in Sher-
conditions is 1.93 mm decade−1 with a 95 % confidence wood et al., 2010). However, the changes in the global mean
interval of [0.97, 2.89]. The mean trend from all the RH are not related in such a simple fashion to changes in the
COSMIC RO TPW estimates under cloudy conditions global mean temperature and precipitable water. For exam-
is 1.82 mm decade−1 with a 95 % confidence interval of ple, Fig. 10 depicts that there are very large differences in the
www.atmos-chem-phys.net/18/259/2018/ Atmos. Chem. Phys., 18, 259–274, 2018272 S.-P. Ho et al.: Comparison of global total precipitable water derived from microwave and COSMIC data
spatial distribution of TPW changes, which shows regional GPS radio occultations, Atmos. Chem. Phys., 12, 5309–5318,
variations of ±4 mm decade−1 . Thus, some regions are dry- https://doi.org/10.5194/acp-12-5309-2012, 2012.
ing and others are moistening. The variations in global mean Biondi, R., Ho, S.-P., Randel, W., Neubert, T., and Syndergaard,
surface temperature are also large, but very different from S.: Tropical cyclone cloud-top heights and vertical temperature
those of TPW, with the polar regions and continents warm- structure detection using GPS radio occultation measurements,
J. Geophys. Res., 118, 1–13, https://doi.org/10.1002/jgrd.50448,
ing up much faster than the atmosphere over the oceans. In
2013.
cold polar regions, an increase in temperature will result in Bock, O., Bosser, P., Bourcy, T., David, L., Goutail, F., Hoareau,
a smaller increase in saturation vapor pressure than the same C., Keckhut, P., Legain, D., Pazmino, A., Pelon, J., Pipis, K.,
increase in temperature in the tropics. The global evaporation Poujol, G., Sarkissian, A., Thom, C., Tournois, G., and Tzanos,
and precipitation patterns also vary greatly, as water vapor D.: Accuracy assessment of water vapour measurements from
transport is important in the global water vapor balance. All in situ and remote sensing techniques during the DEMEVAP
of this, as discussed by Held and Soden (2000), Soden and 2011 campaign at OHP, Atmos. Meas. Tech., 6, 2777–2802,
Held (2006), and Sherwood et al. (2010) means that the re- https://doi.org/10.5194/amt-6-2777-2013, 2013.
lationships between global mean temperature increase, TPW Cober, S. G., Isaac, G. A., and Strapp, J. W.: Characterizations of
changes, and the resulting change in global mean RH are not aircraft icing environments that include supercooled large drops,
simple. J. Appl. Meteorol., 40, 1984–2002, 2001.
Dee, D. P., Uppala, S. M., Simmons, A. J., Berrisford, P., Poli,
P., Kobayashi, S., Andrae, U., Balmaseda, M. A., Balsamo, G.,
Bauer, P., Bechtold, P., Beljaars, A. C. M., van de Berg, L., Bid-
Data availability. The RO data are from the COSMIC Data
lot, J., Bormann, N., Delsol, C., Dragani, R., Fuentes, M., Geer,
Analysis and Archive Center, Constellation Observing System
A. J., Haimberger, L., Healy, S. B., Hersbach, H., Hólm, E. V.,
for Meteorology, Ionosphere and Climate, University Corpora-
Isaksen, L., Kållberg, P., Köhler, M., Matricardi, M., McNally,
tion for Atmospheric Research. Atmospheric profiles are from
A. P., Monge-Sanz, B. M., Morcrette, J.-J., Park, B.-K., Peubey,
COSMIC Occultation Data, COSMIC Data Analysis and Archive
C., de Rosnay, P., Tavolato, C., Thepaut, J.-N., and Vitart, F.: The
(http://cdaac-www.cosmic.ucar.edu/cdaac/products.html). The all-
ERA-Interim reanalysis: configuration and performance of the
sky daily MW data are from Remote Sensing Systems (http://www.
data assimilation system, Q. J. Roy. Meteor. Soc., 137, 553–597,
remss.com/missions/ssmi).
https://doi.org/10.1002/qj.828, 2011.
Durre, I., Williams Jr., C. N., Yin, X., and Vose, R. S.:
Radiosonde-based trends in precipitable water over the North-
Competing interests. The authors declare that they have no conflict ern Hemisphere: An update, J. Geophys. Res., 114, D05112,
of interest. https://doi.org/10.1029/2008JD010989, 2009.
Elsaesser, G. S. and Kummerow, C. D.: Towards a fully parametric
retrieval of the non-raining parameters over the global ocean, J.
Acknowledgements. This work is supported by the NSF CAS Appl. Meteorol. Clim., 47, 1590–1598 2008.
AGS-1033112. We thank Eric DeWeaver (NSF) and Jack Kaye Fetzer, E. J., Lambrigtsen, B. H., Eldering, A., Aumann, H. H., and
(NASA) for sponsoring this work. Chahine, M. T.: Biases in total precipitable water vapor clima-
tologies from atmospheric infrared sounder and advanced mi-
Edited by: Qiang Fu crowave scanning radiometer, J. Geophys. Res., 111, D09S16,
Reviewed by: two anonymous referees https://doi.org/10.1029/2005JD006598, 2006.
Fetzer, E. J., Read, W. G., Waliser, D., Kahn, B. H., Tian, B.,
Vömel, H., Irion, F. W., Su, H., Eldering, A., Juarez, M. T.,
Jiang, J., and Dang, V.: Comparison of upper tropospheric wa-
ter vapor observations from the Microwave Limb Sounder and
References Atmospheric Infrared Sounder, J. Geophys. Res., 113, D22110,
https://doi.org/10.1029/2008JD010000, 2008.
Anthes, R. A.: Exploring Earth’s atmosphere with radio occulta- Held, I. M. and Soden, B. J.: Water vapor feedback and
tion: contributions to weather, climate and space weather, Atmos. global warming, Annu. Rev. Energ. Env., 25, 441–475,
Meas. Tech., 4, 1077–1103, https://doi.org/10.5194/amt-4-1077- https://doi.org/10.1146/annurev.energy.25.1.441, 2000.
2011, 2011. Heymsfield, A. J., Bansemer, A., Field, P. R., Durden, S. L.,
Anthes, R. A., Bernhardt, P., Chen, Y., Cucurull, L., Dymond, Stith, J. L., Dye, J. E., Hall, W., and Grainger, C. A.: Ob-
K., Ector, D., Healy, S., Ho, S.-P., Hunt, D., Kuo, Y.-H., Liu, servations and parameterizations of particle size distributions
H., Manning, K., McCormick, C., Meehan, T., Randel, W., in deep tropical cirrus and stratiform precipitating clouds: Re-
Rocken, C. R., Schreiner, W., Sokolovskiy, S., Syndergaard, S., sults from in situ observations in TRMM field campaigns,
Thompson, D., Trenberth, K., Wee, T.-K., and Zeng, Z.: The J. Atmos. Sci., 59, 3457–3491, https://doi.org/10.1175/1520-
COSMIC/FORMOSAT-3 Mission: Early Results, B. Am. Meteo- 0469(2002)0592.0.CO;2, 2002.
rol. Soc., 89, 313–333, https://doi.org/10.1175/BAMS-89-3-313, Hilburn, K. A.: Including temperature effects in the F15 RADCAL
2008. Beacon correction. RSS Technical Report 051209, Remote Sens-
Biondi, R., Randel, W. J., Ho, S.-P., Neubert, T., and Syndergaard, ing Systems, Santa Rosa, CA, available at: http://images.remss.
S.: Thermal structure of intense convective clouds derived from
Atmos. Chem. Phys., 18, 259–274, 2018 www.atmos-chem-phys.net/18/259/2018/S.-P. Ho et al.: Comparison of global total precipitable water derived from microwave and COSMIC data 273 com/papers/rsstech/2009_051209_Hilburn_F15_RADCAL.pdf on climate feedbacks, Geophys. Res. Lett., 34, L18605, (last access: December 2012), 2009. https://doi.org/10.1029/2007GL030736, 2007. Hilburn, K. A. and Wentz, F. J.: Mitigating the impact of RADCAL Knuteson, R., Bedka, S., Roman, J., Tobin, D., Turner, D., and beacon contamination on F15 SSM/I ocean retrievals, Geophys. Revercomb, H.: AIRS and IASI Precipitable Water Vapor Res. Lett., 35, L18806, https://doi.org/10.1029/2008GL034914, (PWV) Absolute Accuracy at Tropical, Mid-Latitude, and Arctic 2008. Ground-Truth Sites. Presented at the International TOVS Study Ho, S.-P., Kuo, Y.-H., and Sokolovskiy, S.: Improvement of Conference, 14–10 April 2010, Monterey, CA, USA, available at: the temperature and moisture retrievals in the lower tro- http://cimss.ssec.wisc.edu/itwg/itsc/itsc17/ (last access: Novem- posphere using AIRS and GPS radio occultation mea- ber 2016), 2010. surements, J. Atmos. Ocean. Tech., 24, 1726–1739, Kursinski, E. R., Hajj, G. A., Schofield, J. T., and Linfield, R. P.: https://doi.org/10.1175/JTECH2071.1, 2007. Observing Earth’s atmosphere with radio occultation measure- Ho, S.-P., Kirchengast, G., Leroy, S., Wickert, J., Mannucci, A. ments using the Global Positioning System, J. Geophys. Res., J., Steiner, A. K., Hunt, D., Schreiner, W., Sokolovskiy, S., 102, 23429–23465, 1997. Ao, C. O., Borsche, M., von Engeln, A., Foelsche, U., Heise, Larar, A. M., Smith, W. L., Zhou, D. K., Liu, X., Revercomb, H., S., Iijima, B., Kuo, Y.-H., Kursinski, R., Pirscher, B., Ringer, Taylor, J. P., Newman, S. M., and Schlüssel, P.: IASI spectral ra- M., Rocken, C., and Schmidt, T.: Estimating the Uncertainty diance validation inter-comparisons: case study assessment from of using GPS Radio Occultation Data for Climate Monitor- the JAIVEx field campaign, Atmos. Chem. Phys., 10, 411–430, ing: Inter-comparison of CHAMP Refractivity Climate Records https://doi.org/10.5194/acp-10-411-2010, 2010. 2002–2006 from Different Data Centers, J. Geophys. Res., 114, Leroy, D., Fontaine, E., Schwarzenboeck, A., Strapp, J. W., Ko- D23107, https://doi.org/10.1029/2009JD011969, 2009a. rolev, A., McFarquhar, G., Dupuy, R., Gourbeyre, C., Lilie, L., Ho, S.-P., Goldberg, M., Kuo, Y.-H., Zou, C.-Z., and Schreiner, Protat, A., Delanoë, J., Dezitter, F., and Grandin, A.: Ice crys- W.: Calibration of Temperature in the Lower Stratosphere from tal sizes in high ice water content clouds. Part 2: Statistics of Microwave Measurements using COSMIC Radio Occultation mass diameter percentiles in tropical convection observed during Data: Preliminary Results, Terr. Atmos. Ocean. Sci., 20, 87–100, the HAIC/HIWC project, J. Atmos. Ocean. Tech., 34, 117–136, https://doi.org/10.3319/TAO.2007.12.06.01(F3C), 2009b. https://doi.org/10.1175/JTECH-D-15-0246.1, 2017. Ho, S.-P., Kuo, Y.-H., Schreiner, W., and Zhou, X.: Using SI- Lin, L., Zou, X., Anthes, R., and Kuo, Y.-H.: COSMIC GPS cloudy traceable Global Positioning System Radio Occultation Mea- profiles, Mon. Weather Rev., 138, 1104–1118, 2010. surements for Climate Monitoring, in: States of the Climate in Luers, J. K. and Eskridge, R. E.: Use of radiosonde temperature data 2009, B. Am. Meteorol. Sci., 91, S36–S37, 2010a. in climate studies, J. Climate, 11, 1002–1019, 1998. Ho, S.-P., Zhou, X., Kuo, Y.-H., Hunt, D., and Wang, J.-H.: Global Ma, Z., Kuo, Y.-H., Ralph, F. M., Neiman, P. J., Wick, G. A., Evaluation of Radiosonde Water Vapor Systematic Biases using Sukovich, E., and Wang, B.: Assimilation of GPS radio oc- GPS Radio Occultation from COSMIC and ECMWF Analysis, cultation data for an intense atmospheric river with the NCEP Remote Sensing, 2, 1320–1330, 2010b. regional GSI system, Mon. Weather Rev., 139, 2170–2183, Ho, S.-P., Hunt, D., Steiner, A. K., Mannucci, A. J., Kirchen- https://doi.org/10.1175/2011MWR3342.1, 2011. gast, G., Gleisner, H., Heise, S., von Engeln, A., Marquardt, Mears, C., Wang, J., Ho, S.-P., Zhang, L., and Zhou, X.: Global C., Sokolovskiy, S., Schreiner, W., Scherllin-Pirscher, B., Ao, Climate Hydrological cycle, Total column water vapor, in: State C., Wickert, J., Syndergaard, S., Lauritsen, K. B., Leroy, of the Climate in 2011, B. Am. Meteorol. Soc., 93, S25–S26, S., Kursinski, E. R., Kuo, Y.-H., Foelsche, U., Schmidt, T., https://doi.org/10.1175/2012BAMSStateoftheClimate.1, 2012. and Gorbunov, M.: Reproducibility of GPS Radio Occul- Mears, C., Wang, J., Smith, D., and Wentz, F. J.: Inter- tation Data for Climate Monitoring: Profile-to-Profile Inter- comparison of total precipitable water measurements made comparison of CHAMP Climate Records 2002 to 2008 by satellite- borne microwave radiometers and ground-based from Six Data Centers, J. Geophys. Res., 117, D18111, GPS instruments, J. Geophys. Res.-Atmos., 120, 2492–2504, https://doi.org/10.1029/2012JD017665, 2012. https://doi.org/10.1002/2014JD022694, 2015. Huang, C.-Y., Teng, W.-H., Ho, S.-P., and Kuo, Y.-H.: Global Mears C., Ho, S.-P., Peng, L., and Wang, J.: To- Variation of COSMIC Precipitable Water over Land: tal Column Water Vapor, in: State of the Cli- Comparisons with Ground-based GPS Measurements and mate in 2016, B. Am. Meteorol. Sci., 98, S93–S98, NCEP Reanalyses, Geophys. Res. Lett., 40, 5327–5331, https://doi.org/10.1175/2017BAMSStateoftheClimate.1, 2017. https://doi.org/10.1002/grl.50885, 2013. Milz, M., Buehler, S. A., and John, V. O.: Comparison IPCC: Climate Change 2013: The Physical Science Basis. Contri- of AIRS and AMSU-B monthly mean estimates of up- bution of Working Group I to the Fifth Assessment Report of the per tropopsheric humidity, Geophys. Res. Lett., 36, L10804, Intergovernmental Panel on Climate Change (IPCC), edited by: https://doi.org/10.1029/2008GL037068, 2009. Stocker, T. F., Qin, D., Plattner, G.-K., Tignor, M., Allen, S. K., Neiman, P. J., Ralph, F. M., Wick, G. A., Kuo, Y.-H., Wee, T.-K., Boschung, J., Nauels, A., Xia, Y., Bex, V., and Midgley, P. M., Ma, Z., Taylor, G. H., and Dettinger, M. D.: Diagnosis of an in- Cambridge University Press, Cambridge, UK and New York, NY, tense atmospheric river impacting the Pacific Northwest: Storm USA, 1535 pp., https://doi.org/10.1017/CBO9781107415324, summary and offshore vertical structure observed with COSMIC 2013. satellite retrievals, Mon. Weather Rev., 136, 4398–4420, 2008. John, V. O. and Soden, B. J.: Temperature and humid- Noël, S., Buchwitz, M., and Burrows, J. P.: First retrieval ity biases in global climate models and their impacts of global water vapour column amounts from SCIA- www.atmos-chem-phys.net/18/259/2018/ Atmos. Chem. Phys., 18, 259–274, 2018
You can also read