Modeling, Monitoring, and Validating Green Roof and Green Facade Solutions with Semantic City Models Using Low Cost Sensors and Open Software ...
←
→
Page content transcription
If your browser does not render page correctly, please read the page content below
Article
Modeling, Monitoring, and Validating Green Roof
and Green Facade Solutions with Semantic City
Models Using Low Cost Sensors and Open
Software Infrastructures
Trang Thuy Vo 1 , Alexandru Nichersu 2 and Jochen Wendel 2, *
 1    Technische Universität Darmstadt, Institute of Applied Geosciences, 64287 Darmstadt, Germany;
      thuytrang.vo@tu-darmstadt.edu
 2    European Institute for Energy Research (EIFER), 76131 Karlsruhe, Germany; nichersu@eifer.org
 *    Correspondence: wendel@eifer.org; Tel.: +49-721-6405-1414

 Received: 11 January 2019; Accepted: 21 March 2019; Published: 28 March 2019

 Abstract: The usage of greenery systems as nature-based solutions to assist in urban cooling in
 summer time as well as urban warming in wintertime is considered a scientific validated approach in
 urban planning. The objective of this research is the investigation and quantification of the role of
 green roofs and green facade solutions concerning thermal behavior in buildings energy savings by
 using standardized semantic city models that allow the quantification of such measures on district
 and city scales. The implemented model uses standardized geospatial data based on the CityGML
 format, a semantic city model standard, for analysis and data storage. For storage of the thermal
 properties of the buildings, the behavior of its occupants as well as the sensor measurements the
 Energy ADE of the CityGML standard was used. A green roof/façades model was implemented
 to simulate the heat transfer in a building based on the heat balance principle of foliage, soil, and
 structural layers. This model allows analyzing the thermal influence of plant and substrate layers on
 the heat gains from incoming solar radiation into buildings and the heat losses. This implementation
 was validated for cooling solutions using monitoring data from real-time experiments during summer
 measurements at three locations in Germany. Results from this experiment correspond well with the
 findings of other relevant studies. A sensitivity analysis was conducted to test the impacts of climate,
 substrate and plants on the greenery layer performance.

 Keywords: green roofs; green facades; nature-based solutions; CityGML; energy Application Domain
 Extensions (ADE); low-cost sensors; open source webserver; sensitivity analysis

1. Introduction
      Today, more than half of the world’s population lives in cities or urban areas with an expected
increase to 68% by 2050 [1]. At the same time, urban areas with their high demand of energy and
other resources are, through often indirect, major emitters of greenhouse gases. According to the
European energy commission, buildings account for 40% of energy consumption and 36% of CO2
emissions in the European Union (EU) [2]. In recent years, significant efforts were made to improve
energy efficiency and to reduce energy consumption of building by improving their thermal envelope.
Structural efficiency and the reduction of air pollutants is a global political and scientific goal. Not only
urban residents but also urban nature is impacted by climate change in various ways due to the rapid
increase in the rate of urbanization and associated phenomena such as Urban Heat Islands (UHI) and
more frequent heat waves ([3,4]). One efficient and cost-effective possibility to mitigate these effects
of climate change it the application of nature-based solutions such as green roofs and green facades

Urban Sci. 2019, 3, 39; doi:10.3390/urbansci3020039                             www.mdpi.com/journal/urbansci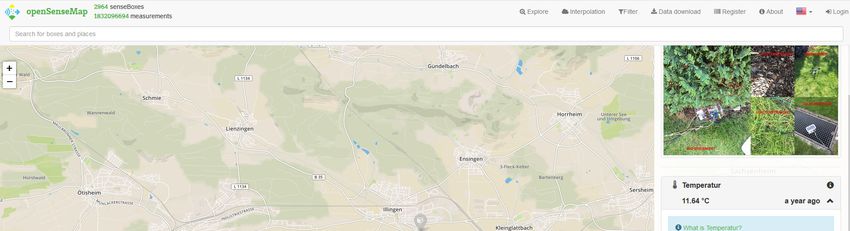
Urban Sci. 2019, 3, 39                                                                               2 of 20

in urban areas. These applications for buildings are considered as a solution to integrate greenery in
urban development that increases not only the energy efficiency of buildings but also shows positive
effects on ecology and the environment [5]. At the same time reducing heat-induced stress from UHI
on humans and animals, that influences their behavior, health, and well-being. The benefits that these
nature-based applications have on urban systems are a presented in numerous research studies, and
range from UHI mitigation [6–8], energy and noise reduction [9–11], filtering pollutants [12] to storm
water retention [13] and urban aesthetics [7]. In recent years, these systems are receiving more and
more attention and are being implemented by urban planners and architects and over 800 publications
alone in Germany on the topic of green façades have been published since 2006 [7].
      This research focuses on the modelling and monitoring of the effects of green roof and green façade
systems. These two applications of nature-based solutions differ in their application on urban structures
where green roofs are described as a Green Horizontal System (GHS) placed on top of the building
roof surface. These installations serve, beside aesthetical aspects such as providing a green view for
residents, energy consumption reduction, as well as multiple environmental benefits. The thermal
effects of green roofs, acting as an additional building envelop layer, on energy consumption of
buildings have been proven in the building sector by numerous previous research studies [14–16].
For example, Wong N.H. et al. [17] conducted a field experiment in Singapore which indicated that
the application of green roofs (e.g., rooftop garden) can save from 0.6–14.5% of the annual energy
consumption. In general, these benefits are due to thermal insulation, shading and evapotranspiration
processes [14,18,19].
      When greenery is applied vertically on building structures, they are referred to green façades and
are classified as a green vertical system (GVS) where plants climb or hang directly on the vertical surface
of buildings. Thereby, plants can be planted on the ground surface or in pots. Green façade applications
have been classified into traditional, double skin, and perimeter pots groups [20]. The concept of
GVS is considered a successful solution for urban greening, due to its capacity of extending greened
areas and to reduce the energy consumption of buildings [21]. Perez et al. [20] indicated that three
fundamental mechanisms should be investigated before building vertical greenery systems: shading
effect (due to an interception of solar radiation), thermal insulation (due to a presence of soil and
vegetation), and evapotranspiration by plants. Susorova et al. [22] developed a mathematical model to
simulate the thermal performance of a traditional green façade. The results showed that on sunny
days, a plant layer on a brick wall estimated to decrease its exterior surface temperature by 0.7–13.1 ◦ C
and reduce the heat flux through the building façade by 2–33 W/m2 .
      Monitoring of such nature-based solution is essential in order to quantify their effect on the
building itself as well as the surrounding urban climate. Traditional deployment of such monitoring
network for green roofs and green facades require substantial investments and are time consuming
to set up and maintain. In the past, traditional installations of monitoring hardware and networks
consisted of professional grade and proprietary hardware and software systems from the meteorological
and soil sciences research domains [23,24]. A need of a low-cost sensors/monitors networking is
essential as owing the benefits of revolutionary technologies in environmental monitoring such as air
quality monitoring [25]. Currently, assembly and deployment of these environmental sensors such air
temperature; air humidity and/or air quality require less effort [24].
      The objective of this research is to investigate and quantify the role of vegetation concerning
thermal behavior in buildings energy savings by using standardized semantic 3D city models and
sensor data as input that will allow the quantification of such measures not only on one single building
but also at district and city scales. To our knowledge, there is no existing model that demonstrates this
impact for both greenery systems using standardized geospatial data as input. Furthermore, most
studies and models developed are focusing only on one building with limited spatial scalability [22,26].
Thus, the study develops a model, which is able to simulate not only green roof but also the green
façade applications. Thereby, the usage of standardized data models, such as CityGML and its
Application Domain Extensions (ADE) will allow transferability and scalability to any geography
Urban Sci. 2019, 3, 39                                                                              3 of 20

region. Furthermore, an open access low-cost sensor system based on Arduino as well as data from
open weather data platforms is used to generate and validate the model.

2. Related Research and Methodologies
     This research draws upon three different research domains, namely the modelling of green
roof/façade systems, open sensor networks, and semantic 3D city models. Thereby providing a scalable
solution that can be applied to any geographic location at multiple scales.
     Current research on greenery modeling is focused on studying potential energy savings that green
roofs/green façades can contribute to the total energy demand of buildings. This thermal perspective
of the greenery system can be classified based on its main components such as structural, foliage,
substrate layers and the ambient air surrounding the system. The modelling of greenery systems
can be demonstrated by heat and mass energy balance algorithms ([27,28]). There are a variety of
green roofs/green façades models that have been developed to simulate energy performance in specific
buildings such as commercial ([29]) or high-rise buildings ([30]). However, these models lack a holistic
approach for simulating the green roof and green façade model together in one mode on multiple
building types.
     For example, Susorova et al. [22] developed a mathematical model to simulate the thermal
performance of a traditional green façade at the Illinois Institute of Technology in Chicago and
conducted an experiment to validate this model. This model offers a capacity to estimate thermal
performance of the green façade envelope on buildings, with respect to the effects of plant physiological
processes (evapotranspiration, radiative, and convective heat exchange) and weather conditions. Due
to an absence of a soil layer in this model, it cannot directly be used to simulate the thermal properties
of the green roof.
     Many studies have implemented field measurements to collect field data on the greenery models to
compute physics-based energy balance models and to validate the accuracy of the model [15,20,22,26].
The design and construction of experiments for simultaneously collecting weather conditions as well
as the temperature of the solid surfaces (e.g., plants, concrete) is a challenging process, which requires
a robust and flexible system for real-time monitoring support. Besides, the choice of location site with
ideal green infrastructure environments are difficult especially in the case of the green façades not
many buildings exists that allow the installation of monitoring experiments.
     In recent years, multiple open source platforms and citizen science projects have been developed
that not only promote but also provide different ready to use hardware and software solutions ([31–34]).
These solutions have not only been used as prototypes but have also been applied in research and
commercial applications such as for example senseBox [35] or the Air Quality Egg [36]. In 2015,
Pfeil et al. [37] for example introduced OpenSenseMap [38] an open source Webserver, developed
by GI@School lab at the Institute for Geoinformatics in Münster that enables conducting in low-cost
scalable situ experiments for gathering real-time measurements. Besides these sensor platforms, a
variety of open sensor Application Programming Interfaces (API) exists such as the Open Weather Map
API [39] or the Netatmo API [40] framework allowing the integration of weather and energy relevant
data from sensors that could be used for modelling and validation of the green roof and green façade
models. In this research the application of an open source electronic prototyping platform based on
Arduino [41] with a wide-spread online community at sharing and development is considered [42].
     For the storage and geolocation of input and output data from greenery models, 3D city models
are gaining increased popularity. More and more urban energy models are based on such 3D
representations that can range from single building to whole city applications [43–47]. Sensor data,
modelling and simulation results can be directly linked to spatial objects such as buildings or city
furniture. Furthermore, with multi-level of details (LoD) concepts and formats such as CityGML [48]
or ESRI Multipatch [49] it is possible to not only aggregate data by the building itself but at a finder
scale such as building surface or building installations (Figure 1). Figure 1 shows on overview of the
LoD concepts of 3D city models based on the CtiyGML standard.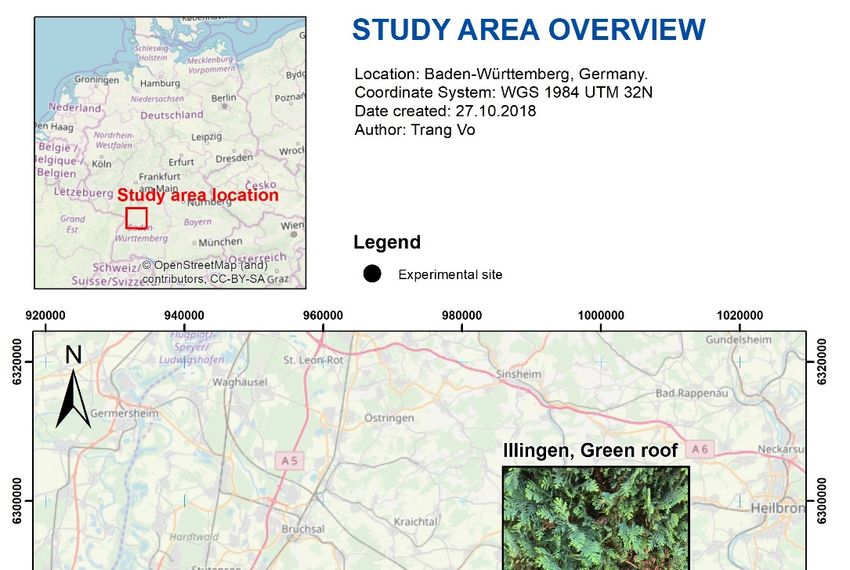
Urban Sci. 2019, 3, 39 4 of 20
Urban Sci. 2019, 3, 39 4
Figure 1. Different
Figure 1. levels of
Different levels of details
details (LoD)
(LoD) represented
represented in
in the
the CityGML
CityGML standard
standard (Source:
(Source: Karlsruhe
Karlsruhe
Institute of Technology (KIT), CityGML 2.0 Encoding standard).
Institute of Technology (KIT), CityGML 2.0 Encoding standard).
This research
researchincorporates
incorporates all all elements
elements presented
presented aboveabove
into theinto the experiment
experiment setup, thesetup, the
modelling
modelling and of
and simulation simulation
the greenofrooftheand
green roof
green and green
façade model façade
and themodel and theand
visualization visualization and
representation
representation of our
of the results. To the results. To our
knowledge, knowledge,
such suchtowards
an approach an approach towards
a holistic a holistic
greenery modelgreenery
has notmodel
been
has not been
presented presented
in the in the
literature literature before.
before.
3. Semantic
3. Semantic City
City Models
Models and
and Data
Data Infrastructure
Infrastructure
In our
In our attempts
attempts to to find
find aa suitable
suitable infrastructure that allows
infrastructure that allows reliable
reliable and
and accurate
accurate city,
city, neighborhood
neighborhood
and district
and districtscale
scaleenergy
energy studies
studies to performed,
to be be performed, we have
we have focused focused on open
on using usingstandards
open standards and
and services
services to service and store data. To that end we follow principles and an infrastructure
to service and store data. To that end we follow principles and an infrastructure first described in [47] first described
in [47]
and thenand then further
further detailed detailed
in [50].inThis
[50].data
Thisinfrastructure
data infrastructure uses semantic
uses semantic city models
city models to describe
to describe cities
cities from
from a spatial,
a spatial, semantical,
semantical, thematic,
thematic, andand topological
topological perspective.
perspective. It provides
It provides ususwith
withaa way way toto
calculate the impact of the surrounding environment on energy demand.
calculate the impact of the surrounding environment on energy demand. A simple example of this is A simple example of this is
shading, which
shading, which hashas anan influence
influence on on the
the amount
amount of of energy
energy surfaces
surfaces receive
receive from
from thethe sun.
sun.
For the spatial description of our city environments, we use CityGML. It is an XML-based open
data model widely used for storage and exchange of 3D city models which not only allows us to
quantify the
quantify theimpact
impactofof spatial
spatial factored
factored parameters
parameters (e.g.,(e.g., shading)
shading) in ourintest
our test model
model but alsobut the also the
thermal
thermal performance of the studied buildings and the impact of neighboring
performance of the studied buildings and the impact of neighboring buildings on one another. According buildings on one another.
According
to Futcher et to al.
Futcher et al.interactions
[51] these [51] these interactions
with other with otherand
buildings buildings and their
their shading shading
effects haveeffects have a
a significant
significant
effect on theeffect
annualon energy
the annual energy
demand. demand.
This further This further
facilitates thefacilitates the quantification
quantification of the studiedofphenomena
the studied
phenomena on statistically significant
on statistically significant spatial scales. spatial scales.
Like with any standard, when it was finally implemented, it was both both incomplete
incomplete and and obsolete,
obsolete,
so the developers of CityGML added an internal mechanism called the Application Application Development
Extension (ADE)
(ADE)to to allowallowfor modeling
for modeling of additional information
of additional not foreseen
information notbyforeseen
the initialbydevelopment.
the initial
This allowed an
development. international
This allowed anconsortium
international to consortium
develop an to extension
developdedicated
an extension to storing
dedicatedstandardized
to storing
standardized building energy information in the Energy ADE. This effort is presented in [52,53]stable
building energy information in the Energy ADE. This effort is presented in [52,53] with the first with
version
the first presented
stable version in 2018 at the 10th
presented in 2018meeting
at the in
10thof meeting
the OGCinCityGMLof the OGC working
CityGML group in Delft
working [54].
group
Currently
in the Currently
Delft [54]. extension contains
the extensionone core module
contains oneandcorefour topic modules,
module and four Building Physics,Building
topic modules, Energy
Systems,Energy
Physics, Material and Construction,
Systems, Material and and Occupant Behavior,
Construction, and Occupant whichBehavior,
are all described
which are in detail in [55].
all described
We decided
in detail in [55]. to make the code development of our work in an environment based on Python and
Structured QuerytoLanguage
We decided make the code (SQL). Python code
development of focuses
our work onincode readability while
an environment based SQL is used
on Python andin
Structured Query Language (SQL). Python code focuses on code readability while SQL is used in
almost all database products. As the team members of our developers’ group are mainly scientists
and engineers with mid-level programming expertise, using readable and well used programming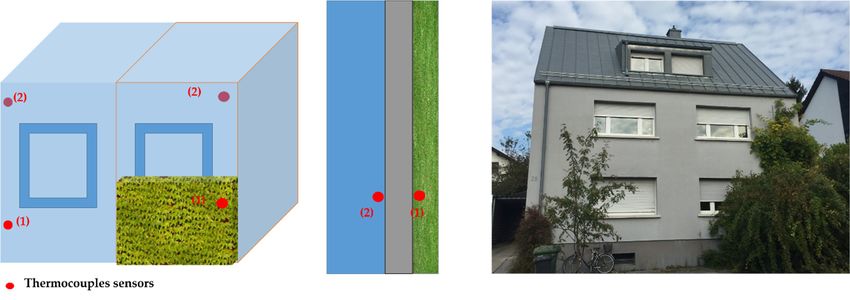
Urban Sci. 2019, 3, 39 5 of 20
almost all database products. As the team members of our developers’ group are mainly scientists and
Urban Sci. 2019, 3, 39 5
engineers with mid-level programming expertise, using readable and well used programming languages
facilitates the
languages skills set
facilitates thewe needset
skills towe
maintain
need towhen moving
maintain from
when one task
moving to another.
from one task The PostgreSQL
to another. The
allow us to input and store multiple data formats coming from open sensor
PostgreSQL allow us to input and store multiple data formats coming from open sensor APIs (weather data),APIs
our
own sensor installations and auxiliary data such as the 3D city model. The development
(weather data), our own sensor installations and auxiliary data such as the 3D city model. The of the models
was done in Python
development that provides
of the models was donedirect connectivity
in Python to the PostgreSQL
that provides databases
direct connectivity as well
to the as to all
PostgreSQL
spatial functionalists that are provided by the PostGIS [56] extension (Figure 2). For
databases as well as to all spatial functionalists that are provided by the PostGIS [56] extension visualization of
the results
(Figure a web
2). For mapping application
visualization that
of the results can directly
a web mapping access data from
application thatthe
canPostgreSQL database
directly access data
was developed.
from the PostgreSQL database was developed.
Figure 2.
Figure Datamodelling
2. Data modellingand
andprocessing
processinginfrastructure
infrastructure and
and workflow.
workflow.
To store
To store data,
data, we
we use
use the
the database
database version
versionofofCityGML,
CityGML,called
called3DCityDB
3DCityDB[57].
[57].This
Thisdata
datastructure,
structure,
which converts
which converts anan XML
XML described
described standard
standard to
to UML,
UML, reduces
reduces byby aa factor
factor of
of 10
10 the
the number
number of of tables
tables
required to stored data when compared to the original CityGML standard and greatly facilitates
required to stored data when compared to the original CityGML standard and greatly facilitates the the
use of
use of semantical
semantical city
city models
models data.
data. The
Thesimplification
simplification and
and the
the software
software product
product are
are presented
presented inin [46]
[46]
as are the advantages of using
as are the advantages of using it. it.
4. Setup of the Experiment
4. Setup of the Experiment
Three experiments were conducted to measure the thermal performance of greenery systems
Three experiments were conducted to measure the thermal performance of greenery systems
during summertime. The sites are located in the cities of Illingen, Vaihingen an der Enz, and Ettlingen,
during summertime. The sites are located in the cities of Illingen, Vaihingen an der Enz, and Ettlingen,
which are positioned in the western part of the state of Baden-Württemberg in Germany (Figure A1 in
which are positioned in the western part of the state of Baden-Württemberg in Germany (Figure A1 in
Appendix A). All study sites are situated in a peri-urban environment consisting mostly of single-family
Appendix A). All study sites are situated in a peri-urban environment consisting mostly of single-
houses at similar elevation levels between 180 m and 320 m mean sea level.
family houses at similar elevation levels between 180 m and 320 m mean sea level.
Two experiment setups, one for the green roof case study and on for the green façade case study are
Two experiment setups, one for the green roof case study and on for the green façade case study
illustrated in Figures 3 and 4. The experiments were conducted from 15 August 2017 until 9 September
are illustrated in Figures 3 and 4. The experiments were conducted from 15 August 2017 until 9
2017. The meteorological
September conditionsconditions
2017. The meteorological were similar
wereinsimilar
all sites, with
in all its typical
sites, with itstemperature climate
typical temperature
zone characteristics
climate of Southwestern
zone characteristics Germany.
of Southwestern Taken into
Germany. account
Taken into potential difficulties
account potential from previous
difficulties from
research experiments that were conducted in similar conditions that may influence
previous research experiments that were conducted in similar conditions that may influence the measurement the
values in built environment for in situ experiments guidelines for the placement
measurement values in built environment for in situ experiments guidelines for the placement standard weather
stations were
standard considered
weather stations[18,23,25,26].
were considered [18,23,25,26].
During the experimental campaign, calibration
During the experimental campaign, calibration and
and validation
validation were
were conducted
conducted to to evaluate
evaluate the
the
accuracy of environmental sensors and test power consumption capacity.
accuracy of environmental sensors and test power consumption capacity. Several sensors were Several sensors were
constructedto
constructed to measure:
measure:(1)(1)HDC100x:
HDC100x:airair temperature
temperature and and humidity;
humidity; (2) (2) BMP200:
BMP200: air pressure;
air pressure; (3)
(3) TSL45315: luminosity; (4) Aenometer: wind speed and (5) DS18B20: concrete
TSL45315: luminosity; (4) Aenometer: wind speed and (5) DS18B20: concrete and substrate temperature and substrate
temperature
(Table 1). (Table 1).
Urban Sci. 2019, 3,Urban
39 Sci. 2019, 3, 39 66 of 20
Urban
UrbanSci.
Sci.2019,
Urban3,
2019, 3,39
392019, 3, 39
Sci. 66
Urban Sci. 2019, 3, 39 6
Urban Sci. 2019, 3, 39 6
Figure 3. Experiment setup and sensor placement (green roof in Illingen, Germany).
Figure 3. Experiment setup and sensor placement (green roof in Illingen, Germany).
Figure 3. Experiment
Figure
Figure 3.Figure
3. Experiment
Experiment setup
setupand
3. Experiment
setup and
and sensor
setup
sensor
sensorplacement
and sensor
placement
placement (green
placement
(green
(green roof
(green
roof
roof inin
roof
in inIllingen,
Illingen,
Illingen,
Illingen, Germany).
Germany).
Germany).
Germany).
Figure 3. Experiment setup and sensor placement (green roof in Illingen, Germany).
Figure 4. Experiment setup and sensor placement (green façade in Ettlingen, Germany).
Figure 4. Experiment setup and sensor placement (green façade in Ettlingen, Germany).
Table 1. Measured parameters. The type of sensors measuring for individual parameters are listed
out. Figure
Table
4. Experiment setup and sensor placement (green façade in Ettlingen, Germany).
1. Measured parameters. The type of sensors measuring for individual parameters are listed
Figure out.Experiment
4.
Figure
Figure 4. Experiment
4.1.Experimentsetup
setupand
setup and
andsensor
sensor
sensorplacement
placement
placement (green
(green
(green façade
façade
façade in Ettlingen, Germany).
Table Parameters Units
Measured parameters. The Type
type ofofsensors
sensors forin
Resolution
measuring in Ettlingen,
Ettlingen,
Accuracy
individual Germany).
Germany).
Pictures
parameters are listed
Figure 4. Experiment setup and sensor placement (green façade in Ettlingen, Germany).
out. Air temperature
Parameters °C
Units HDC100x
Type of sensors -
Resolution ±0.2 °C
Accuracy
Table 1. Measured parameters. The type of sensors measuring for individual parameters are listed out. Pictures
Table
Table 1.1. Measured
Measured parameters.
parameters. The
The type
type of
of sensors
sensors measuring
measuring for
for individual
individual parameters
parameters are
are listed
listed
TableAir temperature
1. Measured °C The Type
parameters. typeHDC100x
ofofsensors measuring- for individual
±0.2 °C
parameters are listed
out. Parameters Parameters
out. Units
Units
Type of sensors
sensors Resolution
Resolution
Accuracy
Accuracy
Pictures
Pictures
out. Air temperature °C HDC100x
Air humidity % HDC100x -- ±0.2
±4%°C
Parameters
Parameters
Air temperature Units
◦ Type
Units Units of
of sensors
TypeType sensors Resolution
Resolution Accuracy
Accuracy
±0.2 ◦C Pictures
Pictures
Air humidityC
Parameters % HDC100x of sensors
HDC100x -
Resolution
- Accuracy
±4% Pictures
Air
Air temperature
temperature
Air temperature°C
°C °C HDC100x
HDC100xHDC100x -- - ±0.2
±0.2 °C
°C°C
±0.2
Air humidityAir humidity% % HDC100x HDC100x - - ±4%±4%
Air
Air humidity
Air humidity%
humidity % % HDC100x
HDC100x
HDC100x -- - ±4%
±4%
±4%
Air pressure hPa BMP280 - ±1 hPa
Air pressureAir pressure
hPa hPa BMP280
BMP280 - - ±1 hPa
±1 hPa
Air Air pressurehPa
Air pressure
pressure hPa hPa BMP280
BMP280
BMP280 -- - ±1±1
±1 hPa
hPa
hPa
Air pressure hPa BMP280 - ±1 hPa
Luminosity Luminosity
lux lux TSL45315
TSL45315 - - - -
Luminosity
Luminosity lux
lux TSL45315
TSL45315 -- --
Urban Sci. 2019,Luminosity
3, 39 lux TSL45315 - - 7
Luminosity lux TSL45315 - -
Wind speed m/s Aenometer 0.1 m/s ±1 m/s
Wind
Wind
Wind speed speed
speed
Wind m/s
m/s
m/s Aenometer
Aenometer
Aenometer 0.1
0.1 m/s
m/sm/s
0.1 m/s ±1
±1m/s
±1 m/s
m/s
Urban Sci. 2019,
Wind speed
3, 39
speed m/s
m/s Aenometer
Aenometer 0.1 0.1 m/s ±1 m/s
±1 m/s 7
Wind speed m/s Aenometer 0.1 m/s ±1 m/s
Solid
Solid temperature
temperature °C
°C DS18B20
DS18B20 -- ±0.5
±0.5 °C
°C
Solid temperature ◦C DS18B20 - ±0.5 ◦ C
Solid temperature °C DS18B20 - ±0.5 °C
Soil moisture % Soil hygrometer - -
Soil moisture % Soil hygrometer - -
Soil moisture % Soil hygrometer - -
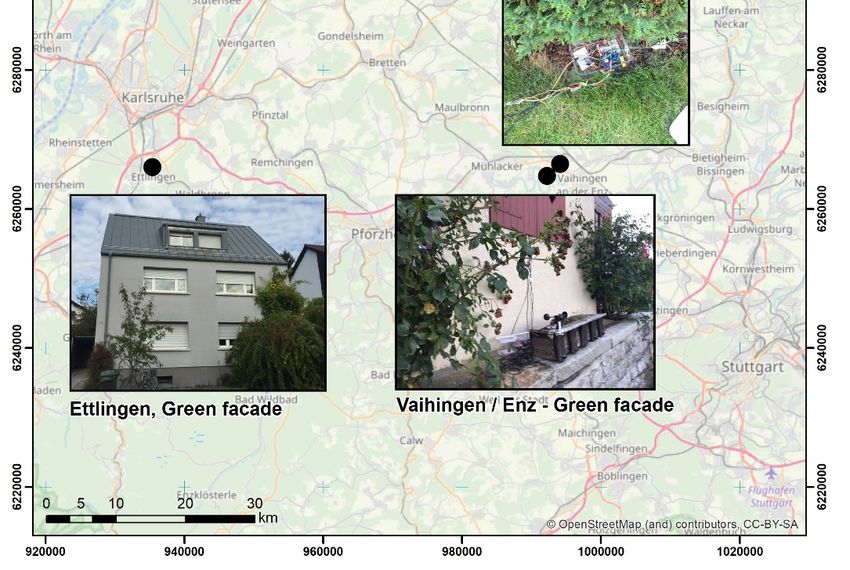
Two different data collection strategies were followed, as it was not possible in all locations to
collect and upload the data via WiFi. In the case if no WiFi network is present the data will be stored
locally on a SD card, when a WiFi network is present the data collected will be directly uploaded to
the OpenSenseMap webserver
Two different data displayed
collection in Figure
strategies A2 in Appendix
were followed, A and
as it was not provided asall
possible in anlocations
URL in the
to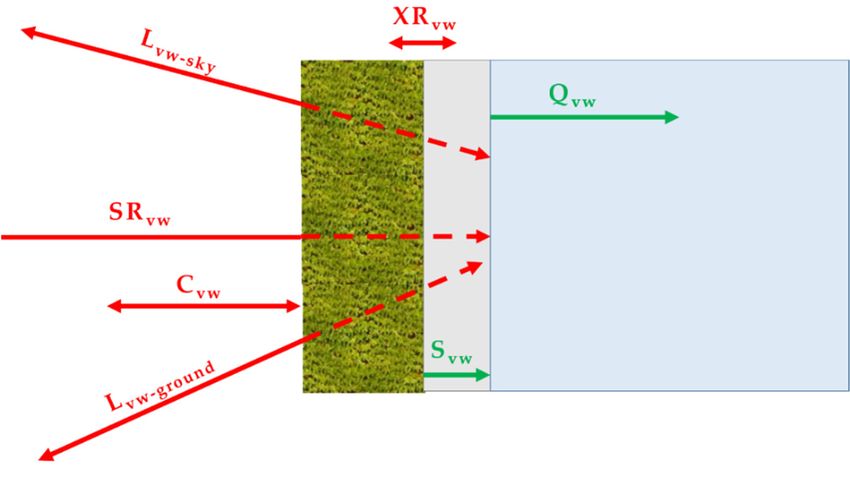
Urban Sci. 2019, 3, 39                                                                                7 of 20

      Two different data collection strategies were followed, as it was not possible in all locations to
collect and upload the data via WiFi. In the case if no WiFi network is present the data will be stored
locally on a SD card, when a WiFi network is present the data collected will be directly uploaded to
the OpenSenseMap webserver displayed in Figure A2 in Appendix A and provided as an URL in the
supplementary section of this paper.
      The main purpose of the experiment is to capture the thermal behaviors of the greenery system in
hot climate conditions. For each experiment, different types of plants were tested separately ranging
from Sedum spurium for the green roofs study case in Illingen, graphs for green façades in the study
case for Vaihingen, Enz, and Boston Ivy for the double-skin green façades study case in Ettlingen.
For each plant type, different plant characteristics were determined such as leaf stomatal conductance,
leaf area index etc. as listed in Table 2. The values are based on previous studies by [20,22,26,58].

      Table 2. Assumed values of plant and material parameters for the green roof and the green façade
      use cases.

                         Parameters                  Units          Green Roof         Green Facade
                 Heat capacity of soil              kJ/kg K             0.84                 -
                Specific heat of water              kJ/kg K             4.80                 -
                Specific heat of plants             kJ/kg K             4.80                 -
                Volume density of soil               kg/m3              2180                 -
              Volume density of water                kg/m3              998                  -
            Areal density of plant canopy            kg/m2              3.30                 -
       Volumetric proportion of soil solid phase        -               0.60                 -
            Volumetric water ratio of soil              -               0.40                 -
               Transmissivity of plants                 -               0.65                 -
             Leaf absorptivity coefficient              -                 -                0.45
               Average leaf dimension                  m                  -                0.10
               Average leaf area index                  -                 -                3.00
           Radiation attenuation coefficient            -                 -                0.70
            Typical stomatal conductance            mol/m2 s              -                0.20
                    Wall thickness                     m                0.30               0.40
                  Wall absorptivity                     -               0.80               0.90
                   Wall emissivity                      -               1.00               0.90
               Wall thermal resistance              m2 K/W              0.50               0.25
                     Wall density                    kg/m3              400                400
                     Specific heat                  kJ/kg K              0.2               0.20

     The vegetation of the experiment on the green roof consists mostly of Sedum spurium, a typical
vegetation type for this type of greenery system (about 10 cm thick). The substrate layer is about 30 cm
in thickness, which comprises of peat soil. The average measured soil humidity is about 40%. Several
parameters were defined based on existing literature (Table 2) [26]. The areal density of the canopy was
assumed by directly measuring at the field site. The volumetric water ratio of soil was derived based
on the measured soil humidity. Peri G et al. [59] summarized the values of radiative transmission
through the plants in the green roof based on existing literature. The transmissivity of plants was
assumed based on the LAI, which equals to 0.65 with the LAI of about 1.5. The thermal properties of
the structural layer were assumed based on the wall materials, which is full brick with an average
thickness of 30 cm. The density of materials is 400 kg/m3 and specific heat capacity is 0.2 kJ/kg K.
     The vegetation for the green façade study area is Boston ivy, a typical type of plants for traditional
green façade with an average thickness of 50 cm. Several parameters of plants and materials were
assumed based on existing literature and measurements [20,22,59]. For instance, the values of leaf
absorptivity and radiation attenuation were adopted from Susorova et al. [22]. The leaf area index and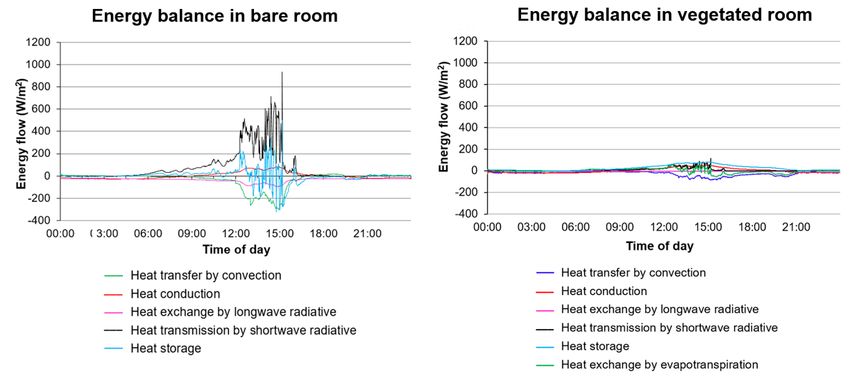
Urban Sci. 2019, 3, 39 8
The vegetation for the green façade study area is Boston ivy, a typical type of plants for
Urban Sci. 2019, 3, 39 8 of 20
traditional green façade with an average thickness of 50 cm. Several parameters of plants and
materials were assumed based on existing literature and measurements [20,22,59]. For instance, the
values of leaf
dimension absorptivity
were and radiation
directly measured at theattenuation
field site. ThewereLAI
adopted from Susorova
was measured et al. [22].
by counting theThe
arealeaf
of
area index
leaves and dimension
per ground were directly
and were defined as: measured at the field site. The LAI was measured by
counting the area of leaves per ground and were defined as:
leaf area m2
LAI = leaf area m2 ),
( (1)
LAI=ground area( m ),2 (1)
ground area m2
assumed based
The values of wall materials were assumed based on the wall materials, which are full brick with
the thickness of 40 cm with the wall absorptivity and emissivity
emissivity of
of 0.90.
0.90. The density and specific heat
materials were
capacity of the wall materials were also
also assumed
assumed asas 400
400 kg/m 3
kg/m and 0.20 J/kg
3 J/kg K,
K, respectively.
respectively.
5. Model Development
5.1. Green Façade
5.1. Green Façade Model
Model
The
The first
first model,
model, the
the green
green façade
façade model,
model, isis based
based onon Susorova
Susorova et
et al.
al. [22]
[22] which
which is
is aa 1-dimensional
1-dimensional
green
green facade model. This model offers a capacity to estimate the thermal performance of the green
facade model. This model offers a capacity to estimate the thermal performance of the green façade
façade
envelope on buildings, with respect to the effect of plant physiological processes (evapotranspiration,
envelope on buildings, with respect to the effect of plant physiological processes (evapotranspiration,
radiative, andconvective
radiative, and convectiveheat
heatexchange)
exchange) and
and weather
weather conditions.
conditions. DueDue
to antoabsence
an absence
of a of
soila layer
soil layer in
in this
this model, it cannot be directly used to simulate the thermal properties of the green
model, it cannot be directly used to simulate the thermal properties of the green roof. Therefore, theroof. Therefore,
the
aimaim of this
of this research
research is to
is to advance
advance thisexisting
this existinggreen
greenfaçade
façademodel
modelandand evaluate
evaluate its
its performance
performance
towards
towards the thermal performance of the green roof. The primary thermal exchange processes are
the thermal performance of the green roof. The primary thermal exchange processes are
described
described inin Figure
Figure 5.
5.
Figure 5.
Figure Vertical cross-section
5. Vertical cross-section of
of the
the green
green façade
façade model
model (after
(after [22]).
[22]).
The green façade model accounts for shortwave radiation transmission through the plant layer,
The green façade model accounts for shortwave radiation transmission through the plant layer,
long-wave radiative exchange between the plant and surrounding environment, convective heat transfer
long-wave radiative exchange between the plant and surrounding environment, convective heat transfer
to and from vegetation, and the radiative exchange (or evapotranspiration) of leaves. Furthermore,
to and from vegetation, and the radiative exchange (or evapotranspiration) of leaves. Furthermore, it
it comprises of the following heat transfer mechanisms: radiation, convection, evapotranspiration,
comprises of the following heat transfer mechanisms: radiation, convection, evapotranspiration, storage
storage and conduction. The energy balance of the green façade model is defined as:
and conduction. The energy balance of the green façade model is defined as:
SR+
SRvw + LR
vwLR + +CC
vwvw vw++XR
vw XRvw
vw =
=QQvwvw+ +
Svw , ,
Svw (2)
(2)
where SRvw refers
where SR to the shortwave radiation to/from the vegetated façade (W/m2), 2LRvw presents the
vw refers to the shortwave radiation to/from the vegetated façade (W/m ), LRvw presents
longwave
the radiation
longwave to/from
radiation thethe
to/from vegetated
vegetatedfaçade
façade(W/m
(W/m),2 ),CC
2 vw depicts the convection to/from the
vw depicts the convection to/from the
vegetated façade (W/m 22), XRvw refers to the radiative exchange between the bare façade/soil and plant
vegetated façade (W/m ), XRvw refers to the radiative exchange between the bare façade/soil and plant
layer (W/m
layer (W/m22),
), Q vw presents the heat conduction through the wall behind the vegetated façade (W/m2
Qvw presents the heat conduction through the wall behind the vegetated façade (W/m ),
2
),
and Svw refers to the heat stored in the wall behind the vegetated façade (W/m2 ). The heat storage is
only considered for structural layers due to lacking substrate layers.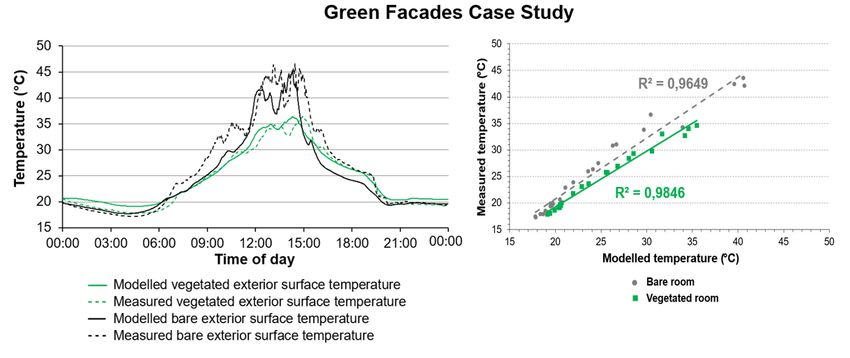
Urban Sci. 2019, 3, 39                                                                                   9 of 20

5.2. Green Roof Model
     The second model, the green roof model, is directly modified based on the existing green façade
model developed by Susorova et al. [22] with the distinction that we added the thermal behavior of the
substrate layer. According to Tabares-Velasco [60], the thermal storage in the foliage is often neglected
in vegetation or soil-vegetation models. This is due to the amount of the heat stored in plants, which
accounts for 1–2% of the net radiation, according to Gates [61]. In contrast, the thermal storage in
substrate and structural layers is more significant. For instance, He et al. [26] pointed out that the heat
storage in a green roof contributes to 5.36% of heat dissipation while a common roof accounts for 0.04%.
Even though this proportion is not significant compared to other thermal components (e.g., latent
heat), it is also necessary to be included it in heat exchange models because heat-insulated performance
varies based on U-values of different materials that can be defined as:
                                           dTsvw                                    dT

                       Svw = Lcpstr ρstr           +D(c psub ρsub +cpwater ρwater )( sub ),             (3)
                                            dt                                       dt

where L is the structural thickness (m), cpstr refers to the specific heat of structural material (J/kg K), ρstr
is the structural material density (kg/m3 ), D defines the subtract thickness (m) cpsub the specific heat of
substrate material (J/kg K), ρsub is the substrate material density (kg/m3 ), cpwater refers to the specific
heat of water (J/kg K), ρwater refers to the water density in substrate layer (kg/m3 ), and t the time (s).
      Therefore, the second term of the equation is neglected. In contrast, the soil layer in green roofs
act as a major component of thermal storage. Thus, both terms in the equation [3] need to be taken
in account.
      The thermal storage Svw is solved for the temperature behind the vegetation Tsvw or the substrate
layers Tsub at a resolution of 30 s. These values are calculated using a numerical bisection method,
which is inspired by Susorova et al. [22]. The ratio of water in the substrate layer contributes to the
humidity of the soil, which also contributes to the heat-insulated capacity of soil layer. The current
temperature is calculated based on the previous temperature and the modelled results are correlated to
the measured results to verify the accuracy of the developed model.

6. Results
     The experiments were conducted during the summer time from 15 August 2017 to September
10, 2017. The monitoring parameters include air temperature, relative humidity, air pressure, light
intensity, wind speed, wall temperature, and soil humidity.

6.1. Results from the Measurement Campaign

Structural Temperature
      The thermal behavior of the plant layers with respect to the energy savings in buildings are
evaluated based on the temperature difference of the wall behind the vegetation and the wall without
vegetation. Thus, the experiments were conducted not only to collect climate data but also the
temperature of the structural layers (wall), the substrate layers (soil) and the vegetation layers. The data
transmission via wireless communication can be viewed at the OpenSenseMap setup of the experiment
that is provided as a link in the supplementary section of this paper.
      For validation of our measurements we have compared it with local smart homes weather stations
nearby which are freely available through the open APIs of Weather Underground [62] and Netatmo
Weathermap [40]. Our values were consistent in most cases (except for wind speed data) for the time
span mentioned above, it is also the reason for which we replaced the wind measurements with values
from the smart homes weather station.
      From our measurement campaign after performing data analysis and treatment, we chose due to
consistency and for validation of our models the following data from 26 August 2017 to 30 August 2017.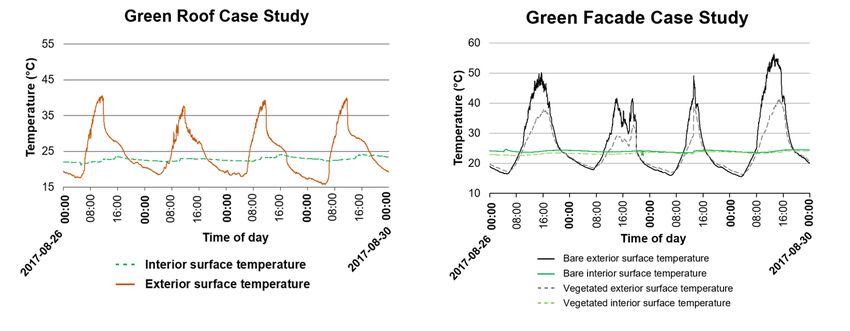
Urban Sci. 2019, 3, 39 10
Urban Sci. 2019, 3, 39 10 of 20
From our measurement campaign after performing data analysis and treatment, we chose due to
consistency and for validation of our models the following data from 26 August 2017 to 30 August 2017.
ItIt can
can be
beobserved
observed from
fromFigure
Figure6a,
6a, that 23◦ °C
that 23 C isisapproximately
approximately the theaverage
average hourly
hourly indoor
indoor
temperature of the green roof building. The temperature of the bare wall, which is strongly
temperature of the green roof building. The temperature of the bare wall, which is strongly influenced influenced
by
bythe
thesunlight
sunlightintensity,
intensity,varied
variedbetween
between40 40◦ °C
C atatdaytime
daytime(11:00–12:00
(11:00–12:00UTC)
UTC)and 15◦°C
and15 C atatnight
night
(02:00–03:00
(02:00–03:00UTC) UTC) on on
26 August 2017.2017.
26 August This phenomenon
This phenomenonexplainsexplains
the thermal
the performance of buildings
thermal performance of
with the presence of green roof layer.
buildings with the presence of green roof layer.
(a) (b)
Figure6.6 Temporal
Figure Temporaltrends
trendsofofthe
theindoor
indoorand
andbare wall
bare temperature
wall in (a)
temperature Green
in (a) roofroof
Green casecase
study (one
study
simulated
(one room);
simulated (b) Green
room); façade
(b) Green casecase
façade study (two(two
study simulated rooms)
simulated rooms)
In
In the
the case
case of the
the green
green façade
façadeininEttlingen,
Ettlingen,the
the experiment
experiment waswas conducted
conducted for for
twotwo rooms:
rooms: one
one without
without thethe green
green façade
façade (bare
(bare room)
room) andone
and onewith
withthe
thegreen
greenfaçade
façade(vegetated
(vegetated room). Consequently,
Consequently,
the
thethermocouples
thermocouplessensors
sensorswere
weresetsetup
upinside
insideand
andininfront
frontof
ofboth
bothrooms
roomstotocompare
comparetheir
theirthermal
thermal
properties.
properties.ItItcan
canbe
beobserved
observedfrom
fromFigure
Figure6b6bthat
thatmaximum
maximumtemperature
temperatureof ofthe
thebare
barewall
wallwas
wasabout
about
15◦°C
15 C higher
higherthan
thanthe
thetemperature
temperatureofofthethevegetated
vegetatedwall.
wall.Besides,
Besides,the
theindoor
indoortemperature
temperatureof ofthe
thebare
bare
room was higher than the vegetated room about 1 ◦ C, which proves the efficiency of the green layer on
room was higher than the vegetated room about 1 °C, which proves the efficiency of the green layer
the
on cooling effect.
the cooling effect.
6.2.
6.2.From
FromOur
OurModels
Models
We
Weintroduced
introducedthethemeasured
measuredclimate
climatedata
dataininour
ourgreen
greenroof
roofand
andfaçade
façademodels
modelstotocalculate
calculateleaf
leaf
temperature, heat transfer via the roof or facades of a building for the same time span as the validated
temperature, heat transfer via the roof or facades of a building for the same time span as the validated
measured
measureddata
datawith
withthe
thesame
sametemporal
temporalresolution
resolutionofofour
ourmeasurements
measurements(30 (30s).s).
7. Discussion
7. Discussion
7.1. Model Significance
7.1. Model Significance
The model developed in this research is just one component of the factors that can reduce the total
The model developed in this research is just one component of the factors that can reduce the
energy demand in a building. This work is part of an entire library, called aEneAs (Energy Assessment)
total energy demand in a building. This work is part of an entire library, called aEneAs (Energy
developed in EIFER, which has the scope of building modeling providing yearly demand values
Assessment) developed in EIFER, which has the scope of building modeling providing yearly demand
with significant accuracy at district, neighborhood and city level. The first model from this library,
values with significant accuracy at district, neighborhood and city level. The first model from this
implementing the Passiv Haus method within the same semantical city environment is presented
library, implementing the Passiv Haus method within the same semantical city environment is
in [47].
presented in [47].
However, even if greenery in cities is just one solution, it is currently providing multiple advantages
However, even if greenery in cities is just one solution, it is currently providing multiple advantages
as a nature-based solution, and in the context of smart cities greenery is seen as a solution with regards
as a nature-based solution, and in the context of smart cities greenery is seen as a solution with regards to
to heating, cooling, UHI mitigation, storm water retention, air particles filtering, noise reduction and
heating, cooling, UHI mitigation, storm water retention, air particles filtering, noise reduction and
aesthetics [30].
aesthetics [30].
As can be seen with the samples, we tested our model on small geographical extents, different
spatial scales, and buildings. In practice (due to data ownership, privacy, and many other reasons)Urban Sci. 2019, 3, 39 11
Urban Sci. 2019, 3, 39 11 of 20
As can be seen with the samples, we tested our model on small geographical extents, different
spatial scales, and buildings. In practice (due to data ownership, privacy, and many other reasons)
the parameters
the parameters required
required for
for detailed
detailed energy
energy assessment
assessment studies
studies are
are hard
hard to
to come
come byby at
at building
building level.
level.
Tobypass
To bypass this
thisissue,
issue,we
wemake
makestatistical
statistical assumptions
assumptions on on the
the energy
energy description
description parameters,
parameters, which
which
reduces the
reduces the accuracy
accuracy ofof the
the results
results at
at this
this spatial
spatial scale.
scale. However,
However, once
once this
this model
model gets
gets used
used onon aa
statisticallysignificant
statistically significantarea
areathethe results
results beginbegin to become
to become accurate.
accurate. Thiswithin
This effect effectparametric
within parametric
building
building modelling
modelling as well asas well as a comparison
a comparison with data
with data driven driven
models hasmodels has been by
been performed performed
[31]. Thisbystudy
[31].
This study indicates the best way to use our model, on larger areas that have statistical
indicates the best way to use our model, on larger areas that have statistical significance in the total significance
in the energy
urban total urban energy
demand. Indemand.
this way, In
thethis way, the assumptions
assumptions we made even we themselves
made even out.themselves out.
7.2. Model Validation
7.2.
Thermal performance
Thermal performance in the green modelmodel is the
the main
main interest
interest to to estimate
estimate the
the thermal
thermal efficiency
of the
of the greenery
greenery system
system onon buildings.
buildings. Therefore, weather
weather data from from the
the measuring
measuring campaign
campaign in in the
the
experiment was
experiment was used
used in
in the
the green
green models
models toto evaluate
evaluate the
the implementation
implementation of of the
the green
green facade
facade method
method
and to
and to validate
validate the
the green
green roof
roof developed
developedmodel
model
According to
According to the
the American
American Institute
Institute of
of Aeronautics
Aeronautics and and Astronautics
Astronautics (AIAA)
(AIAA) Guide
Guide [63],
[63], model
model
validation is
validation is needed
needed to
to demonstrate
demonstrate thethe magnitude
magnitude of of aa model
model capacitycapacity and
and to
to illustrate
illustrate its applicably
in the
in the real
real world.
world. It is performed to quantify the accuracy of the model by comparing comparing the the results
results with
with
the experimental data [64]. RMSE (root mean square error) was applied for
the experimental data [64]. RMSE (root mean square error) was applied for the validation test betweenthe validation test
between
the the measured
measured and modelled
and modelled valuesas:
values defined defined as:
s
2 2
X (y pred −y
(ypred -yref )ref ) (4)
RMSE=
RMSE = ∑ , , (4)
N
N
where yypred isisthe
where themodelled
modelled or or predicted
predicted value,
value, yref measured
yref the the measured or reference
or reference value,
value, and andnumber
N the N the
pred
number
of of samples.
samples.
Figure 77 depicts
Figure depicts the
the dependencies
dependencies between
between the
the measured
measured and and modelled
modelled leaf
leaf temperature
temperature for
for the
the
green roof
green roofcase
casestudy
studyonon2727 August
August 2017.
2017. The
The results
results showshow
thatthat
the the developed
developed green
green roof roof
modelmodel is
is able
able
to to predict
predict thetemperature
the leaf leaf temperature compared
compared to experimental
to experimental data the
data with R2the
with R2 ofand
of 0.98 0.98a root
and amean
root
mean square
square (RMSE) of 0.59of◦ C,
(RMSE) 0.59 °C, which
which provesproves theconfidence
the high high confidence
of the of the green
green model.model.
(a) (b)
Figure 7.
Figure 7. Comparison
Comparisonofofthe themeasured
measuredandand modelled
modelled leaf
leaf temperature
temperature at the
at the green
green roofroof
on aon a sunny
sunny day
day
27 27 August
August 2017.2017. (a) Presentation
(a) Presentation of temporal
of temporal changes
changes of theof the values
values and (b)and (b) Correlation
Correlation analysis
analysis of the
variables. The measured
of the variables. leaf temperature
The measured was analyzed
leaf temperature using a median
was analyzed using afilter approach
median filter with the kernel
approach with
size of 5.0. size of 5.0.
the kernelUrban Sci. 2019, 3, 39 12 of 20
Urban Sci. 2019, 3, 39 12
The
The green
green façade
façade model
model is is established
established for
for two
two rooms
rooms with
with different
different conditions
conditions (1) (1) aa bare
bare wall
wall
room
room without the green façade (bare room) and (2) a room with the green façade (vegetated room).
without the green façade (bare room) and (2) a room with the green façade (vegetated room).
The
The thermal
thermal performance
performance in in both
both rooms
rooms were
were estimated
estimated andand compared
compared to to understand
understand the the thermal
thermal
properties of the vertical greenery
properties of the vertical greenery layers.layers.
Figure
Figure8a 8aillustrates
illustratesthe
themeasured
measuredand andmodelled
modelledexterior
exteriorsurface
surfacetemperature
temperature forfor
both
both rooms
roomsonona
sunny
a sunny day
day30 30
August 2017.
August TheThe
2017. linear relationship
linear between
relationship these
between values
these was was
values calculated as proved
calculated that
as proved
the R 2 between measured and modelled values in bare room and vegetated room are 0.96 and 0.98
that the R between measured and modelled values in bare room and vegetated room are 0.96 and
2
respectively. The RMSE
0.98 respectively. of theofgreen
The RMSE façade
the green model
façade were were
model estimated and results
estimated in theinvalues
and results for both
the values for
rooms are 2.68 ◦ C and 1.30 ◦ C. In general, the validation of the model on the two rooms shows high
both rooms are 2.68 °C and 1.30 °C. In general, the validation of the model on the two rooms shows
accuracy and confidence
high accuracy of the results.
and confidence of the The model
results. Theis therefore
model isable to predict
therefore ablethe
tothermal
predict performance
the thermal
in the green façade
performance in thesystem.
green façade system.
(a) (b)
Figure 8. Comparison of the measured
Figure 8. measured andand modelled
modelled leaf
leaf temperature
temperature atat the
the green
green facade
facade on
on aa sunny
sunny
day
day 30
30August
August2017.
2017.(a)
(a)Presentation
Presentationofoftemporal
temporalchanges
changes ofof
the values
the and
values and(b)(b)
Correlation analysis
Correlation of
analysis
the variables.
of the variables.
The
The validated
validated model
model waswas implemented
implemented to to calculate
calculate the
the heat
heat exchange
exchange components
components in in the
the green
green
façade
façade system.
system. ItIt can
can be
be seen
seen from
from Figure
Figure 9,
9, that
that vegetation
vegetation has
has aa significant
significant influence
influence on
on the
the amount
amount
of
of heat
heat exchange.
exchange. ForFor instance,
instance, the
the heat
heat transmission
transmission by by shortwave
shortwave radiation
radiation into
into the
the vegetated
vegetated room
room
is
is about 5 times smaller than into the bare room. Furthermore, the heat conduction into the
about 5 times smaller than into the bare room. Furthermore, the heat conduction into the vegetated
vegetated
room 2
room were
were calculated
calculated with
with aa reduction
reduction ofof about
about 50
50 W/m
W/m2 at at the
the middle
middle of of the
the day
day (11:00–12:00
(11:00–12:00 UTC)
UTC)
compared
compared to the bare room. In addition, it can be concluded that the heat exchange by convection is
to the bare room. In addition, it can be concluded that the heat exchange by convection is
the
the largest
largest source
source of
of heat
heat loss
loss in
in the
thegreen
greenfaçade,
façade,which
whichaccounts
accountsforforabout
about50%.
50%. The
The values
values ofof heat
heat
exchange
exchange by byevapotranspiration
evapotranspirationisispositive,
positive,which
whichmeans
meansthethevegetation
vegetation contributes in in
contributes thethe
increase of
increase
heat conduction.
of heat conduction.Urban Sci. 2019, 3, 39 13 of 20
Urban
Urban Sci.
Sci. 2019,
2019, 3,
3, 39
39 13
13
(a)
(a) (b)
(b)
Figure 9.
Figure9.
Figure Comparison
9.Comparison of heat
Comparison of heat exchange
exchange between
between(a)
between (a)The
(a) Thebare
The bareroom
bare roomand
room and(b)
and (b)The
(b) Thevegetated
The vegetatedroom
vegetated roomon
room onaaa
on
sunny
sunny day
day 30
30 August
August 2017.
2017.
sunny day 30 August 2017.
7.3.
7.3.Sensitivity
7.3. Sensitivity Analysis
Sensitivity Analysis
Analysis
We
We performed
performed aaa sensitivity
We performed sensitivity analysis
sensitivity analysis on
analysis on the
on the heat conduction
the heat
heat conduction and
conduction and heat
and heatreduction
heat reductionthrough
reduction throughthe
through the
the
greenery
greenerysystems.
greenery systems. The
systems. The parameters
The parameters tested were
parameters tested
tested were climatic
were climaticvalues
climatic values(e.g.,
values (e.g.,solar
(e.g., solarradiation,
solar radiation,wind
radiation, windvelocity),
wind velocity),
velocity),
and
and plant
and plant types
plant types (using
types (using the
(using the LAI
the LAI parameter).
LAI parameter). The
parameter). The purpose
The purpose
purpose ofof this
of thisanalysis
this analysis is
analysis is to
is toevaluate
to evaluatethe
evaluate theeffectivity
effectivityof
the effectivity
vegetation
of while
of vegetation
vegetation varying
while
while thethe
varying
varying climate
the condition
climate
climate or or
condition
condition type of of
or type
type plants.
of plants.
plants.
7.3.1.
7.3.1. Sensitivity to Climate Conditions:
Conditions: SolarRadiation, Radiation, RelativeHumidity,Humidity, WindSpeed Speed
7.3.1. Sensitivity
Sensitivity toto Climate
Climate Conditions: Solar Solar Radiation, Relative
Relative Humidity, Wind Wind Speed
The
Thesensitivity
The sensitivity of
sensitivity of heat
of heat conduction
heat conduction
conduction and and reduction
and reductionthrough
reduction throughthe
through thegreen
the greenroof
green roofand
roof andgreen
and greenfaçade
green façadeto
façade totoclimate
climate
climate
parameters
parameters were
parameters were evaluated
were evaluated
evaluated for forsolar
for solarradiation,
solar radiation,
radiation, relative
relative
relative humidity
humidity
humidity andand
and wind
wind
wind velocity
velocity
velocity (Figures
(Figures
(Figures 10–13).
10–13).10–13).
The
The solar
The solar radiation
solar radiation has
radiation has a significant
has aa significant influence
significant influence on
influence onthe amount
on the of
the amount heat
amount of conduction
of heat into
heat conduction the
conduction into buildings
into thethe
with the difference of 20 W/mof 2
buildings
buildings with
with the
the difference
difference ofper
20 each22values
20 W/m
W/m per
per each ofvalues
each solar radiation.
values of
of solar The thermal
solar radiation.
radiation. The performance
The thermal
thermal of plant
performance
performance
layers
of
of plant
plantis layers
also
layersproven
is alsoby
is also the sensitivity
proven
proven by
by the of heat reduction
the sensitivity
sensitivity of
of heat betweenbetween
heat reduction
reduction the barethe
between room
the and
bare
bare roomvegetated
room and room to
and vegetated
vegetated
solar
room radiation.
room to to solar Due to
solar radiation. the
radiation. Due presence
Due to to the of plant
the presence
presence oflayers, the
of plant amount
plant layers,
layers, theof heat
the amount conduction
amount of of heat can be
heat conduction decreased
conduction can can be by
be
up to 100 W/m 2 when the solar radiation is 800 W/m 2 . From the results it is evident that the vegetation
decreased
decreased by by up
up to
to 100
100 W/m
W/m2 when
2
when thethe solar
solar radiation
radiation is is 800
800 W/m
W/m2.. From
2
From thethe results
results it
it is
is evident
evident thatthat
plays
the an effective
vegetation role
plays anin the zone
effective with
role ina high
the amount
zone with aof solar
high radiation.
amount
the vegetation plays an effective role in the zone with a high amount of solar radiation. of solar radiation.
(a)
(a) (b)
(b)
Figure 10.
Figure10.
Figure Sensitivity
Sensitivity of
10. Sensitivity of (a)
(a) the
the heat
heat conduction
conduction through
conduction throughthe
through thegreen
the greenroof
green roofand
roof and(b)
and (b)the
(b) theheat
the heatreduction
heat reduction
reduction
through the
throughthe
through green
thegreen façade
greenfaçade
façadetoto solar
tosolar radiation
solar radiation for
for relative
radiation for relative humidity
humidity of
of 50%
50% and
andwind
and windspeed
wind speedof
speed of111m/s.
of m/s.
m/s.You can also read