Commissioning of the Controlled and Automatized Testing Facility for Human Behavior and Control (CASITA) - MDPI
←
→
Page content transcription
If your browser does not render page correctly, please read the page content below
sensors
Article
Commissioning of the Controlled and Automatized
Testing Facility for Human Behavior
and Control (CASITA)
Ignacio Rodríguez-Rodríguez *            ID
                                              , Aurora González Vidal   ID
                                                                             , Alfonso P. Ramallo González   ID

and Miguel Ángel Zamora ID
 Departamento de Ingeniería de la Información y las Comunicaciones, Facultad de Informática,
 Universidad de Murcia, 30100 Murcia, Spain; aurora.gonzalez2@um.es (A.G.V.);
 alfonsop.ramallo@um.es (A.P.R.G.); mzamora@um.es (M.A.Z.)
 * Correspondence: ignacio.rodriguez1@um.es

 Received: 19 July 2018; Accepted: 24 August 2018; Published: 27 August 2018

 Abstract: Human behavior is one of the most challenging aspects in the understanding of building
 physics. The need to evaluate it requires controlled environments and facilities in which researchers
 can test their methods. In this paper, we present the commissioning of the Controlled and
 Automatized Testing Facility for Human Behavior (CASITA). This is a controlled space emulation
 of an office or flat, with more than 20 environmental sensors, 5 electrical meters, and 10 actuators.
 Our contribution shown in this paper is the development of an infrastructure-Artificial Intelligence
 (AI) model pair that is perfectly integrated for the study of a variety of human energy use aspects.
 This facility will help to perform studies about human behavior in a controlled space. To verify this,
 we have tested this emulation for 60 days, in which equipment was turned on and off, the settings of
 the conditioning system were modified remotely, and lighting operation was similar to that in real
 behaviors. This period of commissioning generated 74.4 GB of raw data including high-frequency
 measurements. This work has shown that CASITA performs beyond expectations and that sensors
 and actuators could enable research on a variety of disciplines related to building physics and
 human behavior. Also, we have tested the PROPHET software, which was previously used in other
 disciplines and found that it could be an excellent complement to CASITA for experiments that
 require the prediction of several pertinent variables in a given study. Our contribution has also been
 to proof that this package is an ideal “soft” addition to the infrastructure. A case study forecasting
 energy consumption has been performed, concluding that the facility and the software PROPHET
 have a great potential for research and an outstanding accuracy.

 Keywords: modelling; energy; buildings

1. Introduction
     Energy is one of the most important topics of study worldwide. Most governments have
implemented initiatives that aim at more energy-efficient societies because of an urgent need to
decelerate (1) energy resources exhaustion and (2) greenhouse gas emissions. Buildings are responsible
for up to 40% of the carbon emissions in developed countries [1]; it has been seen that their energy use
can be reduced substantially not only via renovation of their thermal envelope [2,3] but also via the
modification of users’ behavior [4].
     This opportunity to reduce energy use via changes in behavior has come at the same time as
a technological revolution. There now exist sophisticated information management systems to control
the different working points of building infrastructures. These systems have already been proved to

Sensors 2018, 18, 2829; doi:10.3390/s18092829                                          www.mdpi.com/journal/sensors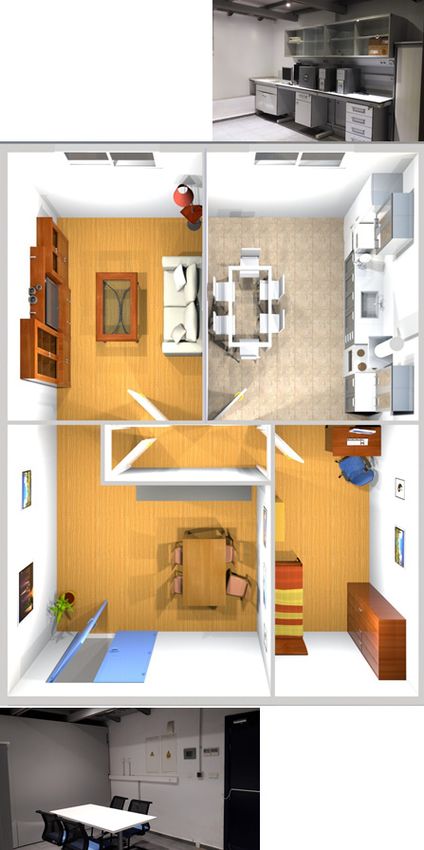
Sensors 2018, 18, 2829                                                                                 2 of 16

be effective solutions to the problem of high energy consumption associated with comfort spaces in
buildings, see for example [4–6].
      Energy consumption is a complex phenomenon in which many aspects play a role; only
a comprehensive way of studying it can fully cover its social, economic, and behavioral aspects.
The effectiveness of technological solutions for modifying human behavior seems to vary depending
on the study [7,8]. It is for this reason that more experimental research on human behavior is needed.
This is a topic that was being studied as early as 1960 when Newton et al. [9] outlined the difficulties of
understanding human behavior in buildings. Today, there have been advances in the understanding of
human behavior, such as the work of [10,11]. However, more testing is needed to continue improving
this field of research. A research facility that can serve as a testing arena for this kind of experimentation
with the control of all aspects of functioning systems in a building is highly valuable in this field.
      The analysis of energy efficiency in built environments has received growing attention in the last
decade [12–14]. One possible method to lower energy use could be to generate a management system
to tackle this challenge. A home automation system based on the internet of things (IoT) can monitor
and control intelligently the different infrastructures involved in a building’s energy consumption,
while being able to provide comfort, security and communication, energy efficiency, and promote
water, electricity, and fuel conservation. Hence, the research community is not only interested in the
understanding and modeling of human behavior, but also on the developing and testing of control
strategies for building automation based on IoT.
      With respect to the advances in sensing and control infrastructure, the growth on information
and communication technologies (ICT) offer an even greater potential in the near future [15], and has
opened a door for considering homes as environments with many more devices (such as sensors
controllers or actuators). A facility that serves to understand the interactions between humans and
buildings will need to have all those components to perform valid research.
      The internet of things represents a radical evolution of the current internet to a network of
interconnected devices that not only harvest information from the environment (sensing), but also allow
interacting, managing, and storing easily any kind of data [16–18]. Following an IoT approach, new home
automation systems could allow fulfilling the requirements posed by the social changes and new trends
in our way of life, facilitating the design of more human, personal, multifunctional, and flexible homes.
This change seems to be coming soon as the European Commission has established that 16 of the European
Union (EU) member states will implement a large-scale smart-meter rollout by 2020 [19].
      The efficiency and accuracy of any home automation system is possible as far as good predictions
can be achieved by developing models about the building status. Ergo, different variables have to be
taken into account regarding their impact on the energy consumption of buildings, while attempting
to consider them in an integral vision [20]. Making a suitable selection and analysis of them is not
obvious. Not only do environmental parameters such as humidity and temperature have to be studied,
others like human behavior, weather forecast, insulating materials, or thermal inertia should be also
considered in order to obtain patterns that will make it possible to anticipate changes in order to avoid
declines in comfortable conditions and rises in energy consumption.
      With this purpose, the available data about a building and its context have to be interpreted
to obtain valuable knowledge. Statistical and novel methods of data analysis allow researchers to
establish correlations between variables and to generate performance models of a building, which can
be used to ensure efficient responses by the automation system. Thus, in the context of data science,
many new and more powerful technologies are bringing alternatives, or even breakthroughs, in the
prediction of building energy consumption associated with thermal comfort [21].
      The facilities we present for the Controlled and Automatized Testing Facility for Human Behavior
(CASITA) have an IoT-based home automation system installed and operational, where experiments
can be done in order to test human behavior and IoT solutions. It is located at the Technology Transfer
Center of the University of Murcia, Murcia, Spain. This test lab has numerous sensors, actuators,
and controllers providing data, which are able to be used to generate accurate models in order to
Sensors 2018, 18, 2829 3 of 16
predict energy consumption and many other variables related to building physics. In addition to this,
Sensors
we have 2018, 18, the
coupled x FOR PEER REVIEW
software PROPHET as the soft component of the functioning of the infrastructure 3 of 16
for variable forecasting and completion. In this work, two models of energy consumption forecasting
models in order to predict energy consumption and many other variables related to building physics.
will be presented and discussed.
In addition to this, we have coupled the software PROPHET as the soft component of the functioning
For theinfrastructure
of the commissioning of this infrastructure,
for variable forecasting and a model of the
completion. energy
In this work,consumption
two models ofbasedenergy on the
novelconsumption
PROPHET forecasting
package has willbeen developed
be presented andwithin mathematical software R. It measures several
discussed.
variables For
andtheevaluates variables that are beneficial
commissioning of this infrastructure, a model for weather
of theforecasting, thereby based
energy consumption fillingonthethe
future
time series of outdoorpackage
novel PROPHET conditions to validate
has been developedthewithin
infrastructure.
mathematical software R. It measures several
variables
All and evaluates
the steps proposed variables
in this that are describe
paper beneficial how
for weather forecasting,
preliminary thereby
testing filling
on the the future
research facility
time series ofwhich
was performed, outdoor canconditions
be usedtotovalidate
designthe infrastructure.
efficient management systems for saving energy that
All the steps
are fully scalable and proposed
that can be in applied
this paper describe
with how preliminary
the same goal in other testing on thewith
buildings research facility
similar sensing
was performed, which can be used to design efficient management systems for saving energy that
and actuation levels. With this paper we contribute to the development of a facility that is pioneer
are fully scalable and that can be applied with the same goal in other buildings with similar sensing
according to the knowledge of the authors, as it sums up the IoT and hardware infrastructure to a soft
and actuation levels. With this paper we contribute to the development of a facility that is pioneer
facet according
consistenttoon thealgorithms
knowledgeofofprediction
the authors,included
as it sumsonupthe
thePROPHET library. infrastructure to a
IoT and hardware
This paper is structured as follows: Section 2 describes the infrastructure.
soft facet consistent on algorithms of prediction included on the PROPHET library. Section 3 describes the
commissioning andisa structured
This paper pilot study asto verifySection
follows: the validity of the
2 describes thedata and the analysis
infrastructure. Section methods
3 describesavailable
the
in CASITA. Section and
commissioning 4 shows
a pilotconclusions and
study to verify further
the validitywork,
of thefollowed
data and theby analysis
the references.
methods available
in CASITA. Section 4 shows conclusions and further work, followed by the references.
2. The Controlled and Automatized Testing Facility for Human Behaviour (CASITA)
2. The Controlled and Automatized Testing Facility for Human Behaviour (CASITA)
Currently, a smart building can be equipped with information and communication technology
Currently,
(ICT) systems, as cana smart
be seenbuilding
in [22],can be equipped
where a sensorwith information
network is deployed and communication technology
in a house. Another example
(ICT) systems, as can be seen in [22], where a sensor network is deployed in a house. Another example
is shown in [23].
is shown in [23].
Although CASITA has been used before in other studies [6,24–29], the commissioning and
Although CASITA has been used before in other studies [6,24–29], the commissioning and
description of the
description research
of the facility
research facilityhad
hadnot
notbeen
been published
published yet. yet.This This paper
paper aims
aims to provide
to provide the the
necessary documentation
necessary documentationto close thisthis
to close gap. CASITA
gap. CASITA (see Figure
(see Figure1)1)is isa case
a caseofofa asmart
smartspace
spacewith
withaawide
deployment of sensorsofand
wide deployment devices
sensors integrated
and devices as if itaswas
integrated if itawas
home/office
a home/office automation
automation system.
system.
In this highly
In this sensed
highly sensedhabitat,
habitat,data
datareferring
referring to human
humanbehavior
behavior and
and to to outdoor
outdoor and and indoor
indoor
environmental parameters are
environmental parameters are collected.collected.
Figure 1. Infographic of a possible setup of the Controlled and Automatized Testing Facility for
Figure 1. Infographic of a possible setup of the Controlled and Automatized Testing Facility for
Human Behavior (CASITA) and distribution of all devices (sensors, actuators and controllers).
Human Behavior (CASITA) and distribution of all devices (sensors, actuators and controllers).
Sensors 2018,18,
Sensors2018, 18,2829
x FOR PEER REVIEW 44of
of16
16
2.1. Hardware
2.1. Hardware
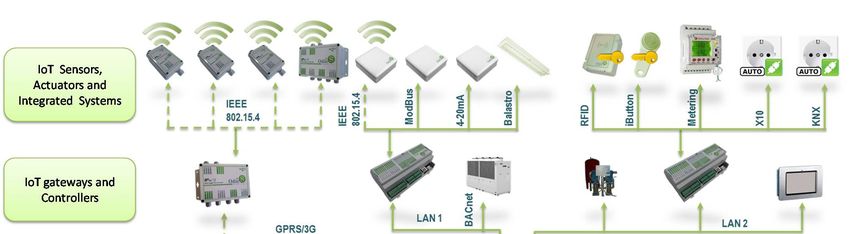
The home automation system installed in this reference scenario is composed by Programmable
The home automation system installed in this reference scenario is composed by Programmable
Logic Controllers (PLC), and a Supervisory Control And Data Acquisition (SCADA) system. This
Logic Controllers (PLC), and a Supervisory Control and Data Acquisition (SCADA) system.
system has been given the name Domosec Platform [30]. All the sensors and actuators have been
This system has been given the name Domosec Platform [30]. All the sensors and actuators have been
selected in accordance with the principles suggested on [31].
selected in accordance with the principles suggested on [31].
The PLC is able to monitor the sensor status and regulate the infrastructures connected to a
The PLC is able to monitor the sensor status and regulate the infrastructures connected to
platform, while the SCADA system collects data and intercommunicates with the PLC using the
a platform, while the SCADA system collects data and intercommunicates with the PLC using the
actuators. This platform has been designed and developed in-house and more information can be
actuators. This platform has been designed and developed in-house and more information can be
provided on request as it is open-source.
provided on request as it is open-source.
The indoor temperature, humidity, and luminosity are measured in several points of the space.
The indoor temperature, humidity, and luminosity are measured in several points of the space.
This makes possible to have an idea of how homogeneous the conditions are across the monitored
This makes possible to have an idea of how homogeneous the conditions are across the monitored
areas. Outdoor conditions are also registered by a weather station located on the top of the building.
areas. Outdoor conditions are also registered by a weather station located on the top of the building.
Human behavior and presence sensors using passive infrared technology are present. The
Human behavior and presence sensors using passive infrared technology are present. The control
control access system is based on Radio Frequency Identification (RFID) technology (more details
access system is based on Radio Frequency Identification (RFID) technology (more details about the
about the device deployment can be found in [6]. Systems and location are exposed in Figure 1.
device deployment can be found in [6]. Systems and location are exposed in Figure 1.
Due to the importance of outside weather in the studies that are being carried out in CASITA
Due to the importance of outside weather in the studies that are being carried out in CASITA
(for example, to measure adaptive thermal comfort), its framework also counts on an ad hoc weather
(for example, to measure adaptive thermal comfort), its framework also counts on an ad hoc weather
forecast algorithm based on Agencia Estatal de Meteorología (AEMET), the Spanish Meteorology
forecast algorithm based on Agencia Estatal de Meteorología (AEMET), the Spanish Meteorology
Agency [32], but post-processed further to improve accuracy. This will be explained further in the
Agency [32], but post-processed further to improve accuracy. This will be explained further in the
following sections.
following sections.
Regarding the actuators deployed in CASITA, there are two Heating, Ventilating and Air
Regarding the actuators deployed in CASITA, there are two Heating, Ventilating and Air
Conditioning (HVAC) systems installed in the ceiling that consist on an electric air-to-air heat pump
Conditioning (HVAC) systems installed in the ceiling that consist on an electric air-to-air heat pump
(TOSHIBA RAV-SM803AT-E and 2xTOSHIBA SM806BT-E, Toshiba Carrier Corporation, Tokyo,
(TOSHIBA RAV-SM803AT-E and 2xTOSHIBA SM806BT-E, Toshiba Carrier Corporation, Tokyo, Japan).
Japan). Therefore, the indoor temperature and humidity can be modified in CASITA at the user’s will.
Therefore, the indoor temperature and humidity can be modified in CASITA at the user’s will.
The system has two levels of air velocity (fan power) and a thermostatic proportional control. The
The system has two levels of air velocity (fan power) and a thermostatic proportional control.
primary energy of the system is electricity.
The primary energy of the system is electricity.
Lighting is provided via light-emitting diodes (LED) placed in the ceiling in accordance with
Lighting is provided via light-emitting diodes (LED) placed in the ceiling in accordance with
current Spanish regulations. However, they are easy to move as the ceiling space is formed by
current Spanish regulations. However, they are easy to move as the ceiling space is formed by
removable panels. All lighting can also be controlled via the SCADA using the internet. A schema of
removable panels. All lighting can also be controlled via the SCADA using the internet. A schema of
the hardware and communication architecture in CASITA is shown in Figure 2, and the connection
the hardware and communication architecture in CASITA is shown in Figure 2, and the connection of
of all this equipment can be seen in Figure 3.
all this equipment can be seen in Figure 3.
Figure 2. Hardware and communication architecture in CASITA.
Figure 2. Hardware and communication architecture in CASITA.
Sensors 2018, 18, 2829 5 of 16
Sensors 2018, 18, x FOR PEER REVIEW 5 of 16
Figure 3. Wiring of data loggers, Supervisory Control And Data Acquisition (SCADA), and other
Figure 3. Wiring of data loggers, Supervisory Control and Data Acquisition (SCADA), and other
devices in the main wiring cabinet of CASITA.
devices in the main wiring cabinet of CASITA.
The electrical consumption of lights, HVAC units, and other electrical appliances are
The electrical
continuously consumption
being monitored ofandlights, HVAC
collected units,
in the and other
SCADA of theelectrical
platform.appliances
Sensors canare continuously
report at any
being
givenmonitored
sampling and collected
period, which isinatthe SCADA
least of thebut
1 min long, platform. Sensors
some of them can to
are able report
reportat atany given
higher
sampling period,
frequencies, which
e.g., is at least 1reporting
high-frequency min long,ofbut some of
electrical them
grid are able
to verify to report Next
harmonics. at higher
tablefrequencies,
(Table 1)
summarizes
e.g., measured
high-frequency features
reporting of and actuators
electrical gridthat can beharmonics.
to verify found in CASITA.
Next table (Table 1) summarizes
measured features and actuators that can be found in CASITA.
Table 1. Description of the sensors and actuators available in CASITA.
Table 1. Description of the sensors and actuators available in CASITA.
Features Sensor Deployments Allow Measurement of a Wide Set of Data
Features
Weather data Sensor Deployments
Temperature and humidity. Allow Measurement of a Wide Set of Data
Weather forecast
Weather data Up toTemperature
4 days. and humidity.
Indoor conditions
Weather forecast In fourUpdifferent
to 4 days.locations, temperature and humidity.
Indoor conditions In four
A control different
access locations,
system in the temperature and humidity.
test lab entrance and volumetric
Occupancy and activity A control access system in the test lab
detectors in each room let predict in an accurate way entrance and the
volumetric
tracking of
Occupancy and activity detectors in each room let predict in an accurate way the tracking of
human presence.
human presence.
For this
Forpurpose, and and
this purpose, to monitor
to monitoreach component
each component separately,
separately,non-
Energy consumption:
Energy consumption: intrusive load monitoring techniques have been considered
non-intrusive load monitoring techniques have been considered [33]. We
[33].
distinguish:
We distinguish:
Electrical
Electrical devices
devices Computers
Computers and and
otherother appliance
appliance areare monitored.
monitored.
Lighting
Lighting Differentiating
Differentiating each room.each room.
Heating, Ventilation, and Each air-conditioned machine is quantified but is much bigger than
Each air-conditioned machine is quantified but is much bigger than
Air Conditioning
Heating, Ventilation,(HVAC)
and the previous consumptions, which makes it energetically undesirable.
the previous consumptions, which makes it energetically
Air Conditioning (HVAC) It is Possible to Modify the Test Lab Features, Comfort and Energy
Actuators undesirable.
Consumption, Adapting the Next Actuators
It is Possible to Modify the Test Lab Features, Comfort and Energy
Actuators
Access Test lab canAdapting
be completely locked, rendering it impossible to enter.
Consumption, the Next Actuators
Control of the energy supplies The plugs can be disabled completely.
Access Test lab can be completely locked, rendering it impossible to enter.
It is possible to force a shutdown or a start. The temperature set point
Control of the HVAC
Control of the energy machines
and fan
The plugs canvelocity mode completely.
be disabled can be chosen.
supplies Each air supply duct ends in a motorized ventilation grille (one per
Ventilation
Control grilles
of the HVAC room), which
It is possible canabe
to force opened ororclosed
shutdown depending
a start. on the nature
The temperature of its
set point
machines and fanusevelocity
in the area.
mode can be chosen.
Each air supply duct ends in a motorized ventilation grille (one per
Ventilation
With grilles
this infrastructure, room), choices
different which can canbebeopened
combinedor closed depending
in order onathe
to reach nature
goal of its
of sufficient
use in the area.
comfort, reduced energy consumption, combination thereof, or other objectives.
Sensors 2018, 18, 2829                                                                               6 of 16

2.2. Software: The PROPHET Package
      The PROPHET package is an utility to model time series and that serves as the perfect soft
counterpart of the infrastructure shown in this paper. PROPHET is an R library that has been recently
developed and seems to give promising results in other disciplines [34–39]. It is a modular regression
model with interpretable parameters that can be intuitively adjusted with domain knowledge about
the time series [40].
      PROPHET conducts an automatic procedure for forecasting time-series data. The implemented
algorithm uses Stan modelling language (allows to share the same core procedure between Python
and R implementations) for optimization in order to fit a non-linear additive model and generate
uncertainty intervals.
      The additive regression model has four main components: a piecewise linear or logistic growth
curve trend. Prophet detects changes in trends by selecting changepoints from the data, a yearly
seasonal component modeled using Fourier series, a weekly seasonal component using dummy
variables, and a user-provided list of important holidays. PROPHET is robust enough to address
missing data, shifts in the trend, and typically handles outliers well.
      It allows the prediction of a horizon of observations for a given time series that fulfills some
characteristics that are common to the time series generated by human actions, where factors such as
holidays could be known in advance.
      In order to create the model, a decomposable time series model with three main model components
will be used: trend, seasonality, and holidays. This is shown in Equation (1),

                                        y(t) = g(t) + s(t) + h(t) + εt ,                                (1)

where:

•     y(t): time series of interest.
•     g(t): represents non-periodic components (using piecewise linear or logistic growth curve trend).
      PROPHET implements two trend models that cover many applications: a saturating growth
      model and a piecewise linear model with automatic change point selection.
•     s(t): trend factor that represents periodic changes. Time series often have multi-period seasonality
      as a result of the human behaviors they represent. To fit and forecast these effects, we must specify
      seasonality models that are periodic functions of t. This part relies on Fourier series to provide
      a flexible model of periodic effects.
•     h(t): effects of holidays (a list provided by the user). Holidays and events provide large,
      somewhat predictable shocks to many time series and often do not follow a periodic pattern,
      so their effects are not well modeled by a smooth cycle.
•     εt : error which will be assumed to follow a normal distribution.

     This formulation is similar to a generalized additive model (GAM), a class of regression models
with non-linear smoothers applied to the regressors. This approach has the advantage in that it
decomposes easily and accommodates new components as necessary; for instance, when a new source
of seasonality is identified. Thus, PROPHET frames the forecasting problem as a curve-fitting exercise
which differs from the traditional models used for time series that account for the temporal dependence
structure in the data: ARIMA This formulation provides several functional advantages with respect to
ARIMA formulations: flexibility regarding seasonality with multiple periods, measurements do not
need to be regularly spaced and missing values are handled, fitting is very fast, and the parameters of
the forecasting model are easily interpretable [41].

3. Commissioning and Example of Data Analysis
     For the commissioning of CASITA, we developed a test that involves the use of all of the main
systems (sensors, meters, and actuators) that are found in CASITA. With this test, we verified the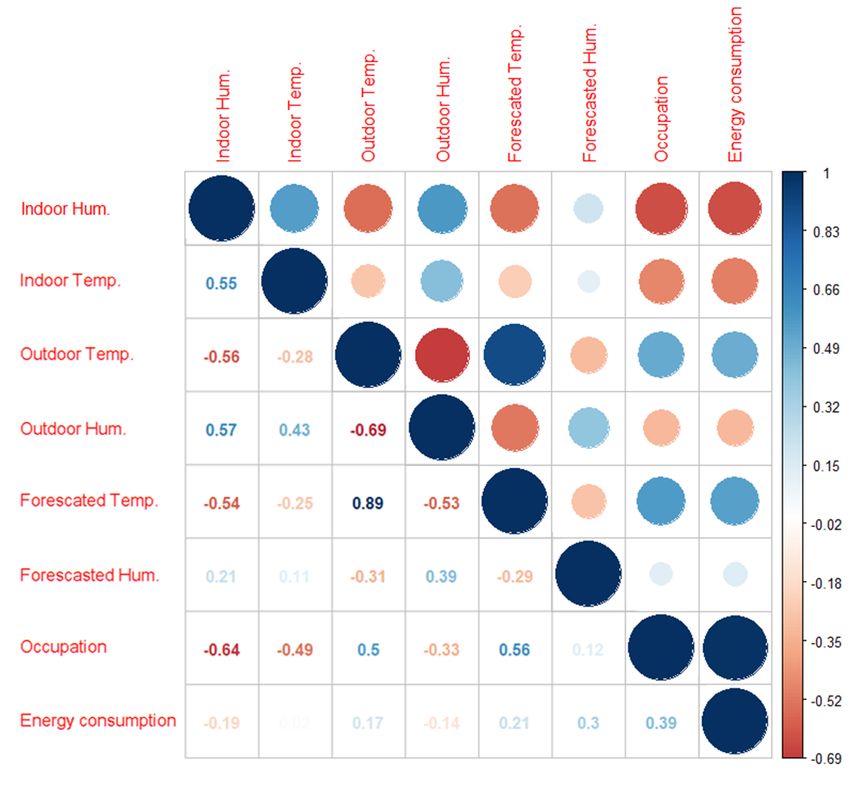
Sensors 2018, 18, x FOR PEER REVIEW 7 of 16
Sensors 2018, 18, 2829 7 of 16
validity of the installations. We also made a valid test of a software package that has not been
previously
validity of theused for this purpose
installations. We alsoto forecast
made a valid energy
test ofconsumption.
a software packageTo dothat this,has
two models
not were built
been previously
withfor
used thethis
collected
purpose data.
toTheir subsequent
forecast improvement To
energy consumption. became a topic
do this, two of discussion
models wereas the with
built inclusion
the
of the weather forecast as a variable or not had to be determined.
collected data. Their subsequent improvement became a topic of discussion as the inclusion of the
weatherTheforecast
weather asforecast
a variablewasorobtained
not had to from an official source (AEMET). The experiment consisted
be determined.
of generating
The weather simulated
forecast data of office from
was obtained use during
an official60 days
source from using the
(AEMET). Theactuators,
experiment turning
consistedon and
of
off equipment, and interfering with the conditioning system. This was
generating simulated data of office use during 60 days from using the actuators, turning on and offdone in an emulated manner
to test the actuators
equipment, and remote
and interfering with the controllers
conditioning of CASITA
system.(all Thisthis
waswasdonedesigned, run, andmanner
in an emulated measured to
from an office 40 km away) and because it allowed us to access the ground
test the actuators and remote controllers of CASITA (all this was designed, run, and measured from truth. To ensure that other
researchers
an office 40 km interested
away) in andusing CASITA
because would us
it allowed know appropriately
to access the ground what this facility
truth. To ensurehas that
to offer, all
other
of the datainterested
researchers for this commissioning
in using CASITA is available
would know uponappropriately
request. what this facility has to offer, all of
The experiment was conducted from
the data for this commissioning is available upon request. 10 June to 14 August 2017. In this period, up to
4 workers were working
The experiment in a normalfrom
was conducted schedule
10 June from to 9:00 to 17:00.
14 August It isIn
2017. presumed
this period,thatupthey
to 4developed
workers
theirworking
were usual functions
in a normalin an office environment,
schedule from 9:00 to 17:00. working It isatpresumed
their desks,thatbutthey also sometimes
developed theirworking
usual
in pairs or holding meetings all together. We do not consider metabolic
functions in an office environment, working at their desks, but also sometimes working in pairs or activity of the workers or
their humidity
holding meetingsemission. Some
all together. Weworkers had the metabolic
do not consider possibilityactivity
to work from
of the home, or
workers so their
the number
humidity of
people at the office fluctuated between 1 and 4 people; at other times, the
emission. Some workers had the possibility to work from home, so the number of people at the office place was empty (without
air conditioning).
fluctuated betweenThe occupancy
1 and 4 people; was registered
at other times, from
the presence
place wasdetectors and door-opening
empty (without sensors,
air conditioning).
as well
The as energy
occupancy wasconsumption
registered from andpresence
distribution of theand
detectors operating grilles sensors,
door-opening and HVAC machines
as well that
as energy
were activated by employees on-demand. All data were collected hourly,
consumption and distribution of the operating grilles and HVAC machines that were activated by even outside of the working
schedule (24
employees h). The operating
on-demand. All data temperature
were collected of the HVAC
hourly, machines
even outside was fixed
of the to 20 °C.schedule
working Representative
(24 h).
variables of this experiment can be seen in Figure 4. ◦
The operating temperature of the HVAC machines was fixed to 20 C. Representative variables of this
experiment can be seen in Figure 4.
Figure 4. Representation of temperature and power for seven days of data in CASITA.
Figure 4. Representation of temperature and power for seven days of data in CASITA.
ItItisispossible
possibleto
toappreciate
appreciatethat
thatduring
duringthe
theworking
workingtime,
time,energy
energyconsumption
consumptionisistriggered
triggeredby bythe
the
operation
operationofofoffice
officeequipment
equipmentair
airconditioning,
conditioning,which
whichlowers
lowersthe
theenvironmental
environmentaltemperature.
temperature.In Inthe
the
graph,
graph,daysdaysare
aredifferentiated
differentiatedby
byhigher
higheror
orsmaller
smalleroccupancy
occupancyand andaalocal
localbank
bankholiday,
holiday,wherewhereno no
one
onewas
wasworking
workingatatCASITA.
CASITA.Once
Oncethe
theoccupation
occupationisiszero
zero(in
(inaaworking
workingday
dayatat17:00),
17:00),ititisiseasy
easytoto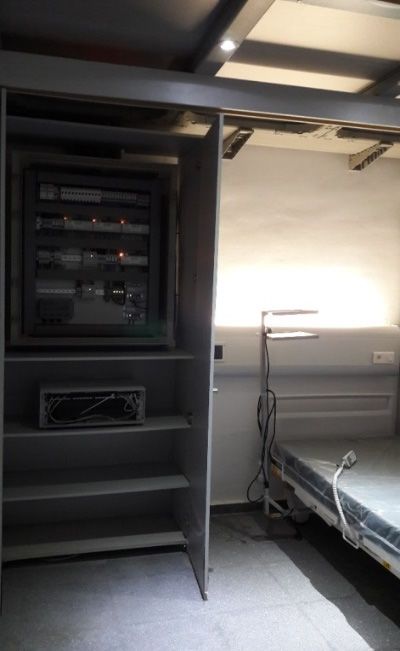
Sensors 2018,
Sensors 18,18,
2018, 2829
x FOR PEER REVIEW 8 of 1616
8 of
identify the fast rise of the indoor temperature due to the high temperatures outside. When night
identify the fast rise of the indoor temperature due to the high temperatures outside. When night falls,
falls, the indoor temperature changes more slowly due to the lowering of the external temperature.
the indoor temperature changes more slowly due to the lowering of the external temperature.
The aim of this verification is two-fold. First, we will evaluate the commissioning of CASITA,
The aim of this verification is two-fold. First, we will evaluate the commissioning of CASITA,
and second, as we have access to the ground truth of the test, we will verify the performance of
and second, as we have access to the ground truth of the test, we will verify the performance of
PROPHET in the field of energy use prediction. We believe that if the results were positive, PROPHET
PROPHET in the field of energy use prediction. We believe that if the results were positive, PROPHET
could be used synergistically with CASITA for further research. We have aimed for a data-driven
could be used synergistically with CASITA for further research. We have aimed for a data-driven
approach that does not take into account the physical properties of the building itself since it has been
approach that does not take into account the physical properties of the building itself since it has been
shown to be appropriate in similar scenarios [42]. Our models are used for predicting a horizon of
shown to be appropriate in similar scenarios [42]. Our models are used for predicting a horizon of
energy consumption. This makes it different from other approaches [43], whose goal is the punctual
energy consumption. This makes it different from other approaches [43], whose goal is the punctual
prediction of a particular moment.
prediction of a particular moment.
3.1.Verification
3.1. Verification of of Accessible
Accessible National
National Weather
Weather Forecasting
Forecasting inin CASITA
CASITA Using
Using PROPHET
PROPHET
ToTo make
make sure
sure that
that CASITA
CASITA offers
offers well-tested
well-tested weather
weather data
data and
and weather
weather forecasts,
forecasts, a stand-alone
a stand-alone
parallel study was
parallel study was performed. performed.
Forthe
For thestart,
start,it it
waswas necessarytoto
necessary study
study the
the relationship
relationship betweenthe
between the weatherforecast
weather forecastobtained
obtained
from the AEMET web page and the real outdoor conditions of our test lab. If
from the AEMET web page and the real outdoor conditions of our test lab. If the correlation between the correlation between
them was strong, it would be feasible to anticipate and predict the real
them was strong, it would be feasible to anticipate and predict the real outdoor conditions. outdoor conditions.
InInthe
thecase
caseofof anan observed
observed discrepancybetween
discrepancy betweenprediction
predictionand andreal
realdata,
data,steps
stepswere
weretaken
takenthat
that
allowed us to understand that error and to create a correction algorithm that reduces
allowed us to understand that error and to create a correction algorithm that reduces it substantially, it substantially,
adding
adding value
value toto
thethe CASITA
CASITA research
research facility.
facility. This
This is seen
is seen in in Figure
Figure 5. 5.
Figure 5. (a) Error mean between weather forecast (temperature) and outdoor temperature. (b) Error
Figure 5. (a) Error mean between weather forecast (temperature) and outdoor temperature. (b) Error
mean between weather forecast (humidity) and outdoor humidity.
mean between weather forecast (humidity) and outdoor humidity.
When
Whenone onesignal
signalwas
wassubtracted
subtracted from from another,
another, an error signal
signal was
was obtained
obtained(see(seeFigure
Figure5),5),in
inwhich
whichthe themean
meansquare
square error
error perper hour
hour of of
thisthis signal,
signal, organized
organized by month,
by month, shows
shows that that the value
the value of the
ofdiscrepancy
the discrepancy is predictable;
is predictable; this makes
this makes it possible
it possible to conclude
to conclude that that the weather
the weather forecast
forecast always
always has a
has a similar
similar lacklack of precision
of precision perper hour,
hour, whichcan
which canbebemodeled.
modeled. We We considered this an an effect
effectofofthe
the
geographical surroundings of CASITA that are different to those of the location of the
geographical surroundings of CASITA that are different to those of the location of the closest weather closest weather
station
stationofofAEMET
AEMET (Fuente Álamo).
(Fuente Álamo).
With
With this implemented,
this implemented, it it
is is
easy
easytotointroduce
introduce this
thiscorrection
correction into the
into theweather
weatherforecast,
forecast,and
andassess
assess
the
theachieved
achievedimprovement
improvement that
that is is
related
related toto
the real
the realoutdoor
outdoor conditions
conditions measured.
measured. AsAs can bebe
can seen
seeninin
Figure
Figure 6,6,
the root-mean-square
the root-mean-square error
error(RMSE)
(RMSE) hashasdecreased
decreased substantially,
substantially,(especially in in
(especially August).
August).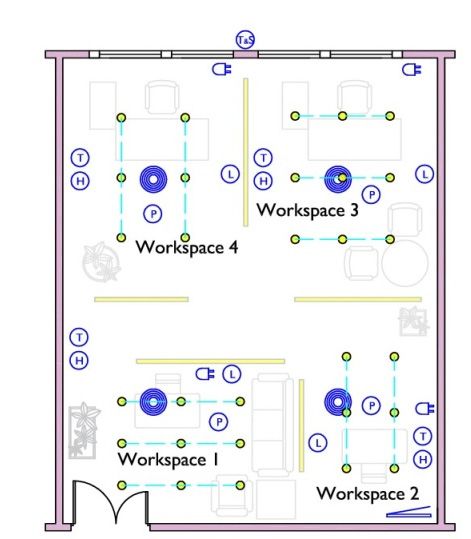
Sensors 2018, 18, 2829 9 of 16
Sensors 2018, 18, x FOR PEER REVIEW 9 of 16
Sensors 2018, 18, x FOR PEER REVIEW 9 of 16
Figure
Figure 6. 6. 6. Root-mean-square
Root-mean-square error (RMSE) achieved after having into account the error mean evolution.
Figure Root-mean-squareerror
error(RMSE)
(RMSE) achieved after
achieved after having
having into
into account
account theerror
the error mean
mean evolution.
evolution.
3.2.
3.2. Validating
Validating
3.2. Influence
ValidatingInfluence ofofthe
Influenceof the Variables
theVariables Using
Variables Using PROPHET
Using PROPHET
PROPHET
A Apreliminary
A preliminary study
preliminarystudy of
studyof the
of the data
the data was
data was done to
was done
done to ensure
to ensurethat
ensure thatthere
that therewere
there werenono
were nomissing
missing
missing values
values
values or
or or
misleading
misleading results
results that
thatcould
could crash
crash a
a computer
computer code
code for
for data
data analysis
analysis and
and toto perform
perform
misleading results that could crash a computer code for data analysis and to perform preliminary preliminary
preliminary
sanity
sanity checks.
sanity
checks. The
checks.The corrplot
Thecorrplot routine
corrplotroutine was
routine was applied
was applied to relevant
applied to
to relevantvariables
relevant variablesofof
variables ofenergy
energy
energy use.
use. And
And
use. And the
thethe results
results
results
can
can bebe
can
be seen
seen
seen ininthe
in the following
thefollowing (see
following(see Figure
Figure 7).
(seeFigure 7).
7).
Figure 7. 7.Cross
Figure Crosscorrelation
correlationbetween
between influential variablesin
influential variables inenergy
energyconsumption.
consumption. Done
Done with
with a native
a native
routine in R: corrplot.
routine in R: corrplot.
Figure 7. Cross correlation between influential variables in energy consumption. Done with a native
routine in R: corrplot.
Once
Once thecalculation
the calculationwas
wasdone,
done, it
it was
was learned
learned that
thatthe
thecorrelation
correlationbetween
betweenconditions outout
conditions of the
of the
building
building and inside are not very strong, which demonstrates that the conditioning systems work well,
Once the calculation was done, it was learned that the correlation between conditions out ofwell,
and inside are not very strong, which demonstrates that the conditioning systems work the
and
and thethe spaceisisnot
space notsensitive
sensitive tofluctuations
fluctuations on
on the
the weather outside. Indoor conditions areare
clearly
building and inside are not verytostrong, weather
which demonstrates outside.
that Indoor conditions
the conditioning systems work clearly
well,
affected by the HVAC operation, which is directly in relation to occupancy. In other words, the more
affected
and by theisHVAC
the space operation,
not sensitive which is directly
to fluctuations in relation
on the weatherto occupancy.
outside. In other
Indoor words,
conditions theclearly
are more
affected by the HVAC operation, which is directly in relation to occupancy. In other words, the more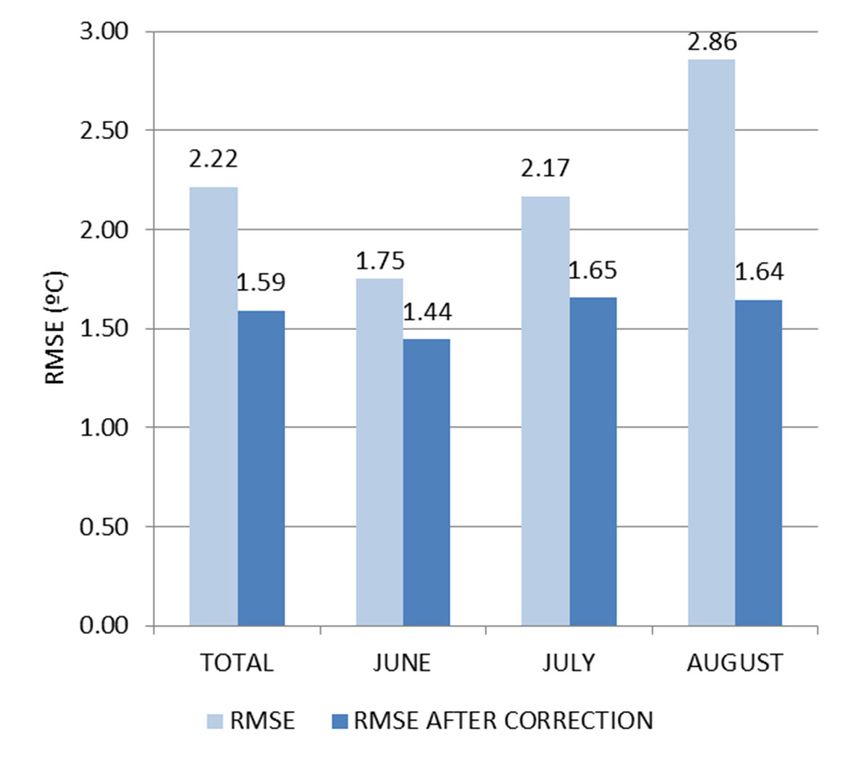
Sensors 2018, 18, 2829                                                                             10 of 16

people are working, the harder the air-conditioning devices are working; this is an expected result that
demonstrates the validity of the data.
     In one part of this preliminary study, we performed a validation exercise that uses the software
package PROPHET. It is an open source code that runs in R and performs predictions of time series for
many kinds of variables due to its large popularity in other disciplines; we thought it was interesting
to test its performance in building physics.
     Focusing on the variable that aimed to be forecasted, after studying the results it is possible to
conclude that there is a correlation between energy consumption and indoor temperature and humidity.
If one sees the results, outdoor temperature is an important variable, instead outdoor humidity is not
that significant as one could expect. The same interpretation could be made regarding the weather
forecast; temperature is relevant, and humidity is not. Occupation is revealed to be the more influential
variable, as the presence of people is an essential requirement to have energy consumption.
     In order to make a model of the energy consumption, there are some variables which show this to
be influential:

•     Occupation;
•     Indoor conditions: temperature and humidity;
•     Outdoor temperature;
•     Forecasted temperature.

     The energy consumption in buildings has several characteristics appropriate for the PROPHET
algorithm and thus should perform well for energy prediction. These are:

•     Strong multiple human-scale seasonality (such as day of the week and the time of year);
•     Important holidays that occur at irregular intervals that are known in advance; and
•     A certain random component.

     Together with previous observations about energy consumption, in our problem the domain
knowledge was defined by the inclusion of external regressors that were selected after observing
the results:
      Model 1: Forecasting energy consumption in a 24-h predictive horizon.
•     Previous energy consumption.
•     Previous occupation and future values of this variable with a known pattern and schedule.
      Model 2: Forecasting energy consumption in a 24-h predictive horizon.
•     Previous energy consumption.
•     Previous occupation and future values of this variable with a known a pattern and schedule.
•     Outdoor temperature values with temperature predictions filling the time series to be predicted.

     These models and their differences are explained in Figure 8. In Model 1 we forecast energy
consumption only with previous values of this variable and previous occupation, completed with future
occupation. Model 2 introduces, in addition, previous outdoor temperature measurements and the
forecast are helped with future temperature values obtained from the national meteorological agency.
     It was decided to perform the energy prediction using a sampling period of one hour, this was
because that granularity captures most of the dynamics of the building without compromising the volume
of data. An extra seasonality component was added that relates to the daily periodic of any energy-related
variable linked to human behavior. The implementation was run on the R environment [41].
     In order to make a first approximation, a prediction was performed for 12 August at 9:00,
(start of working hours) with a predictive horizon of 24 h. In the following paragraphs, we studied
two predictive models. These models are compared with the real measured energy consumption.
Sensors 2018, 18, 2829 11 of 16
Sensors 2018, 18, x FOR PEER REVIEW 11 of 16
Sensors 2018, 18, x FOR PEER REVIEW 11 of 16
Figure8.8. Schema
Figure Schema of
ofModel
Model1 1and
andModel
Model2. 2.
Figure 8. Schema of Model 1 and Model 2.
In the following points, two scenarios were tested, which contrasted with two different
In theInfollowing
situationsthe points,
thatfollowing
provide the two
two scenarios
points, different were tested,
regressors
two scenarios whichwhich
previously
were tested, contrasted
mentioned. with two
contrasted withdifferent situations
two different
that provide
situationsthe
After thattwo
running different
providethe regressors
the models, previously
it was
two different possible
regressors mentioned.
to askmentioned.
previously for the next 24-h prediction.
AfterAfter
Figures running 10 the
9 andrunningshowmodels,
the
the24-h itpredictions
was possible
models, it was to ask for
performed
possible tothe
with thenext
ask for24-h
fitter theprediction.
model line) Figures
(blue24-h
next and 9 and 10
the true
prediction.
showvalues
Figures (black
the 24-h9 and dots),
10 showwhile
predictions thepredictions
performed
the 24-h last
withpeak represents
theperformed
fitter model the
with forecasted
(blue
the andenergy
line)model
fitter the consumption
true
(blue values
line) on dots),
and (black
the true
12 August,
values with
(black a previously
dots), while given
the occupation
last peak schedule.
represents the forecasted energy
while the last peak represents the forecasted energy consumption on 12 August, with a previously consumption on
12 August, with
given occupation schedule.a previously given occupation schedule.
Figure 8. Twenty-four hour predictions performed with the fitter model (blue line) and the true values
Figure 9. Twenty-four
(black
Figuredots) hour
with Model
9. Twenty-four 1.predictions
hour performed
predictions performedwith thefitter
with the fittermodel
model (blue
(blue line)
line) andand the true
the true values
values
(black(black
dots)dots)
withwith
Model 1.
Model 1.Sensors 2018,
Sensors 18,18,
2018, 2829
x FOR PEER REVIEW 1212
of of
1616
Sensors 2018, 18, x FOR PEER REVIEW 12 of 16
Figure
Figure
Figure 9.Twenty-four
10.
10. Twenty-fourhour
Twenty-four hour
hour predictions
predictionsperformed
predictionsperformedwith
with
performed the
withthefitter
the model
fitter model
fitter (blue line)
(blue
model and
line)
(blue andthe
line) true
the
and truevalues
the values
true
(black dots)
(black with
dots) Model
with 2. 2.
Model
values (black dots) with Model 2.
Althoughboth
Although
Although bothgraphs
both graphsseem
graphs seemtotobebevery
seem verysimilar,
similar,the
similar, theforecasted
forecastedhourshoursofofthe
thepredictions
predictionsslightly
slightly
differ
differ
differ for
for
for the
the
the twomodels.
two
two models.These
models. Theseresults
resultsserve
serveasasproof
proofthat
thatboth
bothmodels
modelshave havea agood
goodapproximation
approximation
approximation
to to real measurements,
to real measurements, but that
measurements, but that there there
there are are some
are some slight
some slight differences.
slight differences. It seems
differences. It Itseems that
seemsthatthat Model
Model
Model 2 2is
2iscloser
iscloser
closertoto
to reality.
reality.
reality. A comparison
A comparison
A comparison between
between
between the
thethereal
realrealmeasures,
measures,
measures, and
andand the
thethe forecasts
forecasts
forecasts with
with
with Model
Model
Model 1 and
1 and
1 and Model
Model
Model 2,
isis
2, 2,
is shown
showninin
shown Figure
inFigure 11.
Figure11.
11.
Figure 11. Energy consumption-real measures vs prediction (Model 1/Model 2).
Figure11.
Figure 10.Energy
Energyconsumption-real
consumption-realmeasures
measuresvsvsprediction
prediction(Model
(Model1/Model
1/Model2).2).Sensors 2018, 18, 2829 13 of 16
Sensors 2018, 18, x FOR PEER REVIEW 13 of 16
After
After this
this example,
example, andand in order
in order to evaluate
to evaluate this this in a more
in a more comprehensive
comprehensive and general
and general way, a way,
cross a
cross validation was made to extract some conclusions of the different
validation was made to extract some conclusions of the different approaches. The cross validation approaches. The cross
validation
assumes thatassumes that these
these models could models could be generalized
be generalized and that their and that their
accuracy accuracy of estimated.
of predictions predictions
estimated. In this iterative process, each hour is predicted using the rest
In this iterative process, each hour is predicted using the rest of the available data, obtaining a measureof the available data,
of the error. This is done in Model 1 and Model 2 per hour several times. In addition, a visualisation ofIn
obtaining a measure of the error. This is done in Model 1 and Model 2 per hour several times.
a addition, a visualisation
given prediction is shown ofina given
Figureprediction is shown
12. It is then possible into
Figure 12. Itthe
estimate is mean
then possible
absolutetoerror
estimate
(MAE) the
mean absolute error (MAE) for each case under study by measuring
for each case under study by measuring the difference between the subsequent real measures and the difference between the
subsequent real measures and the predicted values. As we can see in Figure
the predicted values. As we can see in Figure 12, combining the MAE per hour makes it possible to 12, combining the MAE
perthat
see hour makes
both haveitsimilar
possible to see that
behavior. Theboth
MAE have similar
results in behavior.
being higher Thein MAE results inhours
the working being and
higherarein
the working hours and are maximal at 9:00 when the HVAC starts; this is
maximal at 9:00 when the HVAC starts; this is when the variability of the energy consumption is high when the variability of the
energy
and rapid.consumption is high
As is easily seen and rapid.
in Figure As is2easily
12, Model presentsseen in Figure
a better 12, Model
performance for2 nearly
presents
theaentire
better
performance for nearly the entire day. Hence, the MAE is smaller and
day. Hence, the MAE is smaller and the accuracy of the model has been improved by adding outdoor the accuracy of the model has
been improved by adding outdoor temperature
temperature and temperature forecast in the prediction phase. and temperature forecast in the prediction phase.
Figure 12. Mean absolute error (Model 1/Model 2).
Figure 11. Mean absolute error (Model 1 / Model 2).
The
Theimprovement
improvement achieved can
achieved also
can alsobebeshown
shownininterms
termsofofRMSE,
RMSE,offering
offeringananincrease
increaseofofaccuracy.
accuracy.
Global reduction of RMSE has been quantified in 4.54%, from the data exposed in Table
Global reduction of RMSE has been quantified in 4.54%, from the data exposed in Table 2. 2.
Table
Table2.1.Evolution
EvolutionofofRMSE
RMSEvalues
valuesover
over2424
h.h.
RMSE
RMSE RMSE RMSE RMSE RMSE
Hour RMSE Improvement Hour RMSE Improvement
Hour Model
Model 1 Model 2Improvement Hour ModelModel
1 Model 2 Improvement
Model2 Model2
01 1
192.93 176.80 8.36% 13 378.35 1 384.33 −1.58%
02
01 200.24 176.80
192.93 182.96 8.63%
8.36% 14 13 381.95
378.35 381.93
384.33 0.00%
−1.58%
03 210.39 191.86 8.81% 15 358.22 358.05 0.05%
02
04 200.24
222.05 182.96202.28 8.63%
8.90% 16 14 358.66
381.95 352.96
381.93 0.00%
1.59%
03
05 210.39
231.73 191.86
212.67 8.81%
8.23% 17 15 358.22
349.19 358.05
342.75 0.05%
1.84%
06 243.96 222.99 8.59% 18 356.19 344.36 3.32%
04 222.05 202.28 8.90% 16 358.66 352.96 1.59%
07 251.60 230.77 8.28% 19 249.11 247.70 0.57%
05
08 231.73
262.76 212.67239.10 8.23%
9.00% 20 17 258.60
349.19 255.62
342.75 1.84%
1.15%
09
06 275.33
243.96 250.72
222.99 8.94%
8.59% 21 18 269.52
356.19 265.63
344.36 1.44%
3.32%
10 427.56 432.00 −1.04% 22 160.57 149.72 6.75%
07
11 251.60
381.20 230.77
377.35 8.28%
1.01% 23 19 249.11
172.48 247.70
159.43 0.57%
7.57%
08
12 262.76
376.05 239.10374.41 9.00%
0.43% 24 20 181.99
258.60 167.22
255.62 1.15%
8.12%
09 275.33 250.72 8.94% 21 269.52 265.63 1.44%
4. Conclusions
10 and Future
427.56 432.00Work −1.04% 22 160.57 149.72 6.75%
11 work
This 381.20 377.35
describes 1.01%
the commissioning 23 facility
of a new testing 172.48 159.43
that has been given7.57%
the name
of Controlled and Automatized Testing Facility for Human Behavior (CASITA). The facility8.12%
12 376.05 374.41 0.43% 24 181.99 167.22 includes
a large variety of sensors, meters, and actuators that allow the research to focus on fundamental aspectsSensors 2018, 18, 2829 14 of 16
of the interactions of humans with built environments. The new contribution is that we have conceived
this facility as a pair between the hardware and the software package PROPHET that provides the soft
components (algorithms and analysis tools) to make the facility complete.
The first testing of this facility consisted of an occupation experiment that was performed to
facilitate the posterior analysis of the software package PROPHET. The results of this software used
in publications in other fields convinced us that it could be an excellent addition to CASITA for
experiments that involved prediction (as there are many).
Building energy consumption models with new techniques are a of considerable interest to
the scientific community. Our test experiment was to evaluate the functionalities of CASITA,
and to ascertain the improvement of the PROPHET algorithms. Once the correlations were studied,
two models were presented. After a brief explanation about a new tool for modeling and forecasting,
the PROPHET package of the R software, some parameter settings and a comparison between the
models became topics of discussion. The results indicate that introducing outdoor temperature into
the model that uses the forecasted temperature provided by AEMET (an official source of weather
forecast) improves the accuracy of its predictions.
The variables chosen in this work can be found in any residential or commercial building. As far
as a sensor network that would be deployed, the same data can be collected and the models replicated.
Therefore, the approach in this paper proposes an improved general model for forecasting energy
consumption in buildings. A good approximation to this problem could enable one to plan for
energy requirements, achieve energy and economic savings, and contribute to a more effective energy
consumption policy.
In essence, the results show that CASITA is an excellent research facility that can be used for the
testing of human modeling algorithms, IoT platforms, control strategies, and many more applications.
With respect to the prediction algorithms tested here, both models are acceptable and achieve a good
level of representativeness.
In addition, it is necessary to note that the algorithms tested have good accuracy but that they have
not been compared with other methods, as the main aim of this work was commissioning CASITA and
evaluating PROPHET as a side tool for it. We believe that the testing of its suitability was sufficient.
In future works, other scenarios will be tested. Weather forecasting will be added again along
with other possible forecasted variables. We also plan to introduce human components into the
equation, which would be interesting and will exploit the capabilities of CASITA well. In another vein,
the PROPHET package became a tool whose benefits need to be studied further in this and other fields.
Author Contributions: Conceptualization, I.R.-R. and M.Á.Z.; Methodology, I.R.-R. and A.G.V.; Software, A.G.V.;
Validation, I.R.-R., A.G.V. and A.P.R.G.; Investigation, I.R.-R., A.G.V., A.P.R.G. and M.Á.Z.; Resources, M.Á.Z.;
Writing-Original Draft Preparation, I.R.-R. and M.Á.Z.; Writing-Review and Editing, A.P.R.G.; Supervision, I.R.-R.
and A.P.R.G.; Funding Acquisition, M.Á.Z.
Funding: This work has been sponsored by the Spanish Ministry of Economy and Competitiveness through
387 the PERSEIDES (ref. TIN2017-86885-R) and CHIST-ERA (ref. PCIN-2016-010) projects; by MINECO grant
BES-2015-071956 and by the European Comission through the H2020-ENTROPY-649849 EU Project.
Acknowledgments: Ramallo-González would like to thank the program Saavedra Fajardo (grant number
220035/SF/16) funded by Consejería de Educación y Universidades of CARM, vía Fundación Séneca-Agencia de
Ciencia y Tecnología de la Región de Murcia.
Conflicts of Interest: The authors declare no conflict of interest. The funders had no role in the design of the
study; in the collection, analyses, or interpretation of data; in the writing of the manuscript; and in the decision to
publish the results.Sensors 2018, 18, 2829 15 of 16
References
1. Perez-Lombard, L.; Ortiz, J.; Pout, C. A review on buildings energy consumption information. Energy Build.
2008, 40, 394–398. [CrossRef]
2. Schnieders, J. CEPHEUS–Measurement Results from More Than 100 Dwelling Units in Passive Houses.
Available online: https://www.researchgate.net/publication/237709858_CEPHEUS_-_Measurement_
results_from_more_than_100_dwelling_units_in_passive_houses (accessed on 19 July 2018).
3. Schnieders, J.; Hermelink, A. CEPHEUS results: Measurements and occupants’ satisfaction provide evidence
for Passive Houses being an option for sustainable building. Energy Policy 2006, 34, 151–171. [CrossRef]
4. Mogles, N.; Walker, I.; Ramallo-González, A.P.; Lee, J.; Natarajan, S.; Padget, J.; Gabe-Thomas, E.; Lovett, T.;
Ren, G.; Hyniewska, S.; et al. How smart do smart meters need to be? Build. Environ. 2017, 125, 439–450.
[CrossRef]
5. Terroso-Saenz, F.; González-Vida, A.; Ramallo-González, A.P.; Skarmeta, A.F. An open IoT platform for the
management and analysis of energy data. Future Gener. Comput. Syst. 2017. [CrossRef]
6. Moreno, V.; Úbeda, B.; Skarmeta, A.F.; Zamora, M.A. How can we tackle energy efficiency in IoT basedsmart
buildings? Sensors 2014, 14, 9582–9614. [CrossRef] [PubMed]
7. Darby, S. Making it obvious: Designing feedback into energy consumption. In Energy Efficiency in Household
Appliances and Lighting; Springer: Berlin/Heidelberg, Germany, 2001; pp. 685–696.
8. Karatasou, S.; Laskari, M.; Santamouris, M. Models of behavior change and residential energy use: A review of
research directions and findings for behavior-based energy efficiency. Adv. Build. Energy Res. 2014, 8, 137–147.
[CrossRef]
9. Newton, D.; James, R.; Bartholomew, D. Building energy simulation—A user’s perspective. Energy Build.
1988, 10, 241–247. [CrossRef]
10. Haldi, F.; Robinson, D. The impact of occupants’ behaviour on building energy demand. J. Build. Perform. Simul.
2011, 4, 323–338. [CrossRef]
11. Rouleau, J.; Ramallo-González, A.; Gosselin, L. Towards a comprehensive tool to model occupant behaviour
for dwellings that combines domestic hot water use with active occupancy. In Proceedings of the 15th IBPSA
Conference, San Francisco, CA, USA, 7–9 August 2017.
12. Agarwal, Y.; Balaji, B.; Gupta, R.; Lyles, J.; Wei, M.; Weng, T. Occupancy-driven energy management for
smart building automation. In Proceedings of the 2nd ACM Workshop on Embedded Sensing Systems for
Energy-Efficiency in Building, Zurich, Switzerland, 2 November 2010; pp. 1–6.
13. Pettersen, T.D. Variation of energy consumption in dwellings due to climate, building and inhabitants.
Energy Build. 1994, 21, 209–218. [CrossRef]
14. Lindberg, R.; Binamu, A.; Teikari, M. Five-year data of measured weather, energy consumption, and time-dependent
temperature variations within different exterior wall structures. Energy Build. 2004, 36, 495–501. [CrossRef]
15. Keller, J.; Heiko, A. The influence of information and communication technology (ICT) on future foresight
processes—Results from a Delphi survey. Technol. Forecast. Soc. Chang. 2014, 85, 81–92. [CrossRef]
16. Weiser, M. The computer for the 21st century. Sci. Am. 1991, 265, 94–104. [CrossRef]
17. Atzori, L.; Iera, A.; Morabito, G. The internet of things: A survey. Comput. Netw. 2010, 54, 2787–2805.
[CrossRef]
18. Perera, C.; Zaslavsky, A.; Christen, P.; Georgakopoulos, D. Sensing as a service model for smart cities
supported by internet of things. Trans. Emerg. Telecommun. Technol. 2014, 25, 81–93. [CrossRef]
19. European Commission. Benchmarking Smart Metering Deployment in the EU-27 with a Focus on Electricity;
Publications Office of the European Union: Luxembourg, 2014.
20. Voss, K.; Sartori, I.; Napolitano, A.; Geier, S.; Gonçalves, H.; Hall, M.; Heiselberg, P.; Widén, J.;
Candanedo, J.A.; Musall, E. Load matching and grid interaction of net zero energy buildings. In Proceedings
of the EUROSUN 2010 International Conference on Solar Heating, Cooling and Buildings, Graz, Austria,
28 September–1 October 2010.
21. Zhao, H.; Magoules, F. A review on the prediction of building energy consumption. Renew. Sustain. Energy Rev.
2012, 16, 3586–3592. [CrossRef]
22. Han, D.M.; Lim, J.H. Design and implementation of smart home energy management systems based on
zigbee. IEEE Trans. Consum. Electron. 2010, 56, 1417–1425. [CrossRef]You can also read