The Origin of Sand and Its Colour on the South-Eastern Coast of Spain: Implications for Erosion Management - MDPI
←
→
Page content transcription
If your browser does not render page correctly, please read the page content below
water
Article
The Origin of Sand and Its Colour on the
South-Eastern Coast of Spain: Implications for
Erosion Management
Francisco Asensio-Montesinos 1 , Enzo Pranzini 2 , Javier Martínez-Martínez 3 , Irene Cinelli 2 ,
Giorgio Anfuso 1 and Hugo Corbí 4, *
 1   Department of Earth Sciences, Faculty of Marine and Environmental Sciences, University of Cádiz, CASEM,
     11510 Puerto Real, Cádiz, Spain; francisco.asensio@uca.es (F.A.-M.); giorgio.anfuso@uca.es (G.A.)
 2   Department of Earth Science, University of Florence, Via Micheli 4, 50121 Florence, Italy;
     enzo.pranzini@unifi.it (E.P.); irene.cinelli@hotmail.it (I.C.)
 3   Spanish Geological Survey (IGME), Calle Ríos Rosas, 23, 28003 Madrid, Spain; javier.martinez@igme.es
 4   Department of Earth Sciences and the Environment, University of Alicante, Apdo. Correos 99,
     San Vicente del Raspeig, 03080 Alicante, Spain
 *   Correspondence: hugo.corbi@ua.es

 Received: 21 December 2019; Accepted: 25 January 2020; Published: 30 January 2020

 Abstract: Sand colour can give important information about mineral composition and, consequently,
 sediment source areas and input systems. Beach appearance, which is mostly linked to sand colour,
 has a relevant economic function in tourist areas. In this paper, the colour of 66 sand samples,
 collected along both natural and nourished beaches in the western Mediterranean coast of Spain,
 were assessed in CIEL*a*b* 1976 colour space. The obtained results showed relevant differences
 between natural and artificially nourished beaches. The colour of many nourished beaches generally
 differs from the native one because the origin of the injected sand is different. The native sand
 colour coordinates’ range is: L* (40.16–63.71); a* (−1.47–6.40); b* (7.48–18.06). On the contrary,
 for nourished beaches’ the colour range is: L* (47.66–70.75); a*(0.72–5.16); b* (5.82–18.82). Impacts of
 beach nourishment on the native sand colour were studied at San Juan beach, the most popular
 one along the study area. Nourishment works were performed after severe erosion, usually linked
 to anthropic activities/structures and storm events, but also to increase beach width and hence
 benefit tourism.

 Keywords: Alicante; beach nourishment; CIEL*a*b*; coastal management; Costa Blanca; mineralogical
 characterization; sediment colour; tourism; western Mediterranean

1. Introduction
     Coastal sedimentological studies allow the understanding of both natural processes and
anthropogenic interventions, e.g., coastal dynamics and required management actions. Beach sediments
characteristics play an essential role in coastal ecology but also in the choice of a pleasant site by beach
users [1]. The most important characteristics of the sediment are texture (grain size and sorting),
mineralogy, colour and morphology of grains (roundness and sphericity). These characteristics should
be preserved during anthropogenic actions since their modifications can cause undesired impacts. First,
sediment colour and texture directly influence the perception of beach users [2] and coastal scenery
characteristics [3]: beach sediment colour is one out of the 18 natural parameters considered in the
probably most commonly used landscape assessment method, i.e., the Coastal Scenic Evaluation [4].
This methodology, applied in >1000 coastal sites around the world [5], including the study area of
this paper [6], is based on enquires that revealed that golden or white sand is better valued than dark

Water 2020, 12, 377; doi:10.3390/w12020377                                       www.mdpi.com/journal/water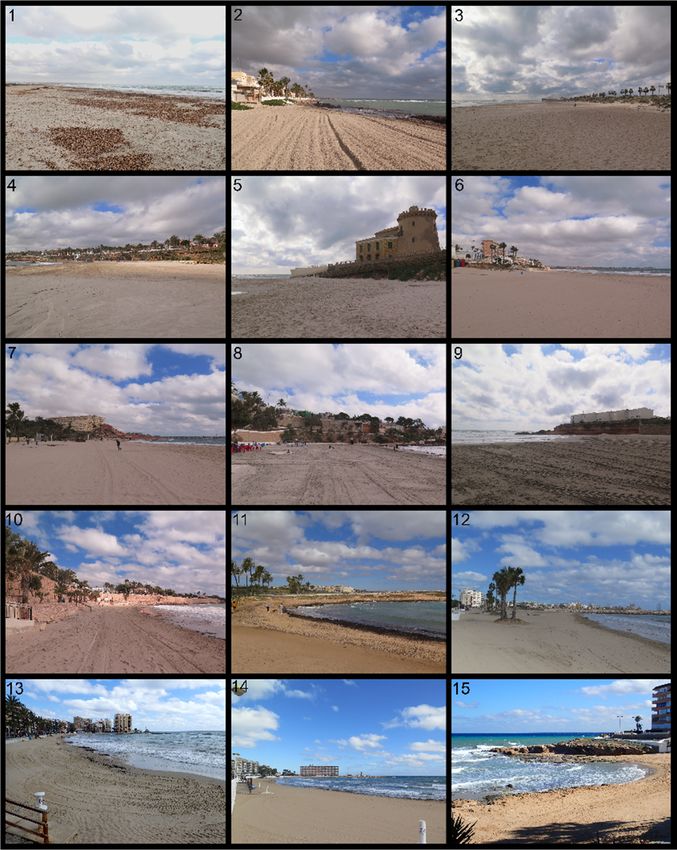
Water 2020, 12, 377                                                                                   2 of 25

sand. In this way, beach users also prefer sandy sediments to gravel or pebble ones [4]. Second, beach
nourishment can cause ecological and physical impacts on the coast. For example, nourishment works
can degrade different beach habitats and affect several marine species [7]. Addition of new sand
volumes can involve a change in sand colour, which can modify sand temperature with consequences
on biological processes of different species, e.g., the sex of marine turtles [1]. Finally, beach nourishment
can also modify beach characteristics such as beach profile and/or water colour. Consequently, the
modification of beach colour due to sediment injection can cause discontent between local beach users
and the economic impacts to the local economy [8,9]. Sardinia (Italy) constitutes an example of this
socioeconomic problem, where a court case was opened stimulated by stakeholders because a natural
white beach was replaced by a black one [10]. On the contrary, nourishment works can sometimes
improve the natural sand colour making the beach more attractive to tourists, this way incrementing
the economic value [11].
      Previous studies carried out along the study area of this paper, were focused on biological,
mineral, and textural characteristics [12–17]. However, no attention was focused on the chromatic
analysis of native sand and its modification after beach nourishment. Such studies on beach colour are
relatively recent and they have important implications for coastal conservation and beach management.
Sand colour characteristics can be used to create a catalogue of sand compatibility and improve
nourishment works [3,9,18]. This catalogue should be useful to identify the origin of sediments, as
well as to detect the occurrence and level of oil contamination, e.g., after the beach oiling in NW Spain
linked to the sinking of the Prestige [19]. In Tuscany (Italy), compatibility studies in sand colour [20]
have been carried out to avoid future management issues. Further, the chromatic analysis of sand
in combination with the study of other sedimentological parameters such as the granulometry or
mineralogical composition can be used for didactic activities or as an interesting geo-sedimentary
resource to outreach geoscience among the general public [21–23].
      The colour of solid objects mainly depends on three factors: the light source, the observer, and
especially the characteristics of the material surface [24]. The colour of a stimulus can be assessed in
the CIEL*a*b* colour space, recommended by the Commission Internationale de l’Eclairage [25] and is
appropriate for sediment colour comparison [26]. On the one hand, the coordinate L* is the Lightness
component, and it ranges between 0 and 100 (from black to white, respectively). It is directly associated
with the visual sensation of luminosity. On the other hand, the coordinates a* and b* are denominated
“Chromaticity”. The a* coordinate defines the deviation of the achromatic point corresponding to
Clarity, to red if a* >0 and to green if a* 0, and to blue if b* is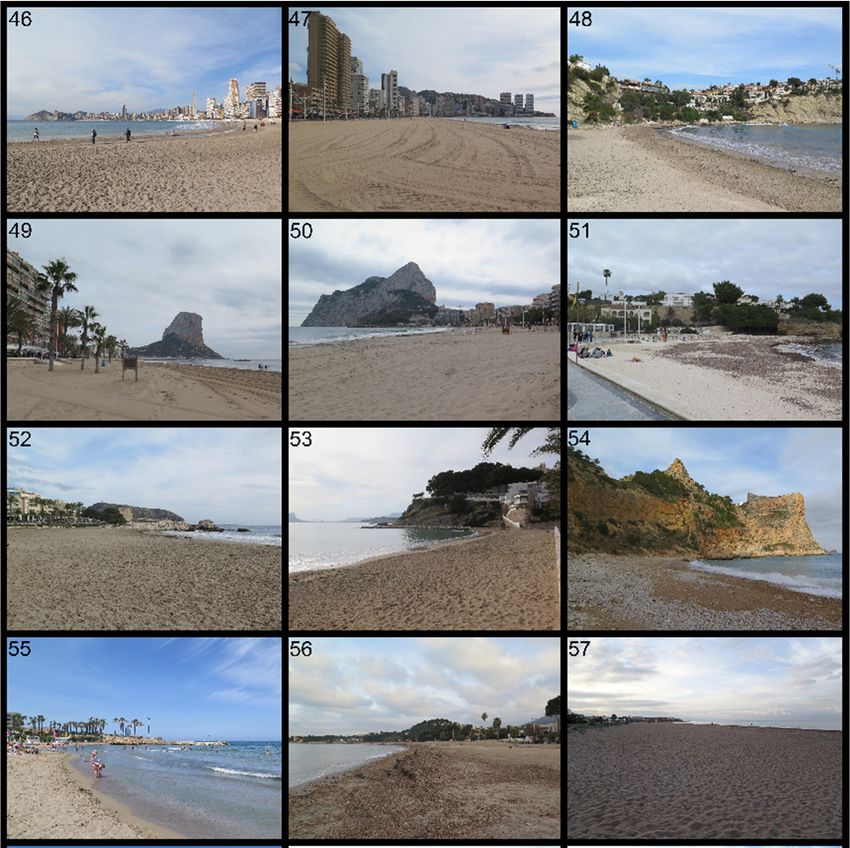
Water 2020, 12, 377 3 of 25
Water (natural
sand 2020, 12, 377
or nourished), to nourish beaches attempting to employ natural-like sand colour,3and of 26
even to detect future changes in the sand colour or the presence of contaminants.
2. Materials and Methods
2. Materials and Methods
2.1. Study Area
2.1. Study Area
The studied area covers about 200 kilometres of coastline of the western Mediterranean (SE
Spain)The(Figure
studied1). area
It covers
includes about 200 kilometres
60 beaches from Sanof coastline
Pedro delof the western
Pinatar Mediterranean
(Murcia Province)(SE to Spain)
Dénia
(Figure 1). It includes 60 beaches from San Pedro del Pinatar (Murcia Province)
(Alicante Province, Figure 1, Table 1). The studied coast has very diverse habitats: dunes in the to Dénia (Alicante
Province,
south [30], Figure
high1,cliffs
Table of1).
theThe studied
Betic coast has
Cordillera very
in the diverse
north coasthabitats: dunes[31],
of Alicante in the
as south
well as [30], high
beaches
cliffs of the
located onBetic Cordillera
the Nueva in theIsland
Tabarca north coast
[23]. of Alicante
From [31], as well
a geological as beaches
standpoint, thislocated on the
coastline Nueva
is divided
Tabarca
into threeIsland [23]. From
different a geological
domains: standpoint,
the southern sectorthis coastline
mainly is divided
belongs to the into three
Bajo different
Segura basin domains:
[32,33],
the
thesouthern
northernsector mainly to
one pertains belongs to the Bajo
the Prebetic zoneSegura
of the basin [32,33],
External Zonestheofnorthern
the Beticone pertains
Range [34],to the
while
Prebetic zone of the External Zones of the Betic Range [34], while the Island of
the Island of Tabarca is related to the Internal Zones of the Betic Range [35]. The different geologicalTabarca is related to
the Internal Zones of the Betic Range [35]. The different geological contexts
contexts in which the beaches are included establish broadly three different source areas of in which the beaches are
included
sediments, establish
whichbroadly
constitute three
andifferent
intrinsicsource
factor areas of sediments,
that determines whichsand
natural constitute an intrinsic
composition and factor
hence
that determines natural
the native beach colour. sand composition and hence the native beach colour.
Figure1.1.Location
Figure Location map showing
map the position
showing of the 66
the position of studied
the 66 samples. Detailed information
studied samples. according
Detailed information
to site numbering
according is showed in
to site numbering is Table
showed1. Currents in Currents
in Table 1. Alicante area, observation
in Alicante period: 2006–2020
area, observation period:
(source: www.puertos.es,
2006‒2020 accessed in January
(source: www.puertos.es, accessed2020).
in January 2020).
Different
Differentnatural
naturalelements
elementsreinforce
reinforcethe
thetourist
touristattraction
attractionof
ofthe
thestudied
studiedcoastal
coastalscenery,
scenery,such
suchas
as
cliffs, rocky shores, golden sand, dunes, turquoise water colour, and other coastal landscape
cliffs, rocky shores, golden sand, dunes, turquoise water colour, and other coastal landscape features
such as islands,
features such aslagoons,
islands, caves,
lagoons,rock ridges,
caves, rockand irregular
ridges, headlands.
and irregular However,However,
headlands. most of the studied
most of the
sites have been affected by infrastructures such as groins, seawalls, houses/buildings,
studied sites have been affected by infrastructures such as groins, seawalls, houses/buildings, parking, and
nourishment
parking, andworks among others.
nourishment worksSuch human
among actuations/structures
others. are mostly linked to the
Such human actuations/structures aretourism
mostly
linked to the tourism demand and strong urban growth in the area and they have been especially
frequent during recent years [36]. These anthropic structures were recently observed [6] and took
into consideration 26 parameters—18 physical and 8 human—that delineate coastal scenery,
according to Coastal Scenic Evaluation (CSE) Methodology [4,37], applied in different countries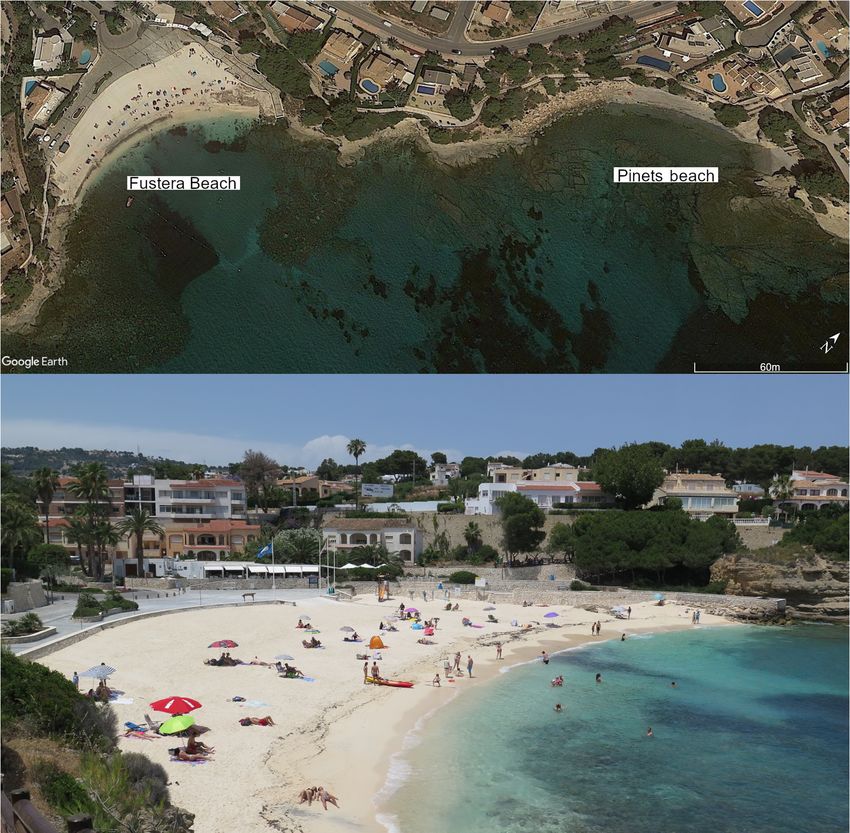
Water 2020, 12, 377                                                                                                         4 of 25

demand and strong urban growth in the area and they have been especially frequent during recent
years [36]. These anthropic structures were recently observed [6] and took into consideration 26
parameters—18 physical and 8 human—that delineate coastal scenery, according to Coastal Scenic
Evaluation (CSE) Methodology [4,37], applied in different countries [5,8,38,39]. This semi-objective
method utilizes weighting parameters and fuzzy logic mathematics to obtain the scenery Decision
Value parameter (D). This value allows the coastal areas to be classified into 5 classes, from Class I
(extremely attractive/natural sites) to Class V (very unattractive/urbanized sites).

        Table 1. Location and main characteristics of studied beaches: Map number (Figure 1), beach name,
        municipality, beach typology and sand condition with their information source.
  No.         Beach                 Municipality            Typology     Sand Condition         Source
  1           Torre Derribada       San Pedro del Pinatar   Rural        Nourished              [40]
  2           El Mojón              Pilar de la Horadada    Village      Nourished              [41]; Environmental services a
  3           Las Higuericas        Pilar de la Horadada    Village      Native                 [42]
  4           El Puerto             Pilar de la Horadada    Urban        Nourished              [41]; Environmental services a
  5           El Conde              Pilar de la Horadada    Urban        Native                 [42]
  6           Mil Palmeras          Pilar de la Horadada    Urban        Nourished              Environmental services a
  7           La Glea               Orihuela                Village      Native                 [42]
  8           Cabo Roig             Orihuela                Urban        Nourished              [41]; Coastscape 1956 b
  9           La Estaca             Orihuela                Urban        Native                 [42]
  10          Punta Prima           Orihuela                Urban        Nourished              [41,42]
  11          Cala Ferri            Torrevieja              Rural        Native                 [41]
  12          Los Náufragos         Torrevieja              Urban        Nourished              [41]; Coastscape 1956 b
  13          Playa del Cura        Torrevieja              Urban        Nourished              [41]
  14          Los Locos             Torrevieja              Urban        Native                 [41]
  15          Cala Cervera          Torrevieja              Urban        Native                 [41]
  16, 17      La Mata               Torrevieja              Village      Native                 [41]
  18          Torrelamata           Torrevieja              Urban        Native                 [41]
  19          Les Ortigues          Guardamar del Segura    Remote       Native                 [41]
  20          Els Vivers            Guardamar del Segura    Rural        Native                 [41]
  21          Els Tossals           Guardamar del Segura    Remote       Native                 [41,42]
  22          El Pinet              Elx                     Rural        Native                 [41,42]
  23          Playa Lisa            Santa Pola              Urban        Nourished              [41]
  24          Bernabeu II           Santa Pola              Urban        Nourished              [41]; Coastscape 1956 b
  25          Calas del Cuartel     Santa Pola              Rural        Nourished              [43,44]
  26          El Carabassí          Elx                     Remote       Native                 [41,42]
  27          Arenales del Sol      Elx                     Urban        Native                 [41,42]
  28          El Altet              Elx                     Remote       Native                 [41,42]
  29          El Saladar            Alicante                Urban        Native                 [41,42]
  30          San Gabriel           Alicante                Urban        Native                 Coastscape 1956 b
  31          El Postiguet          Alicante                Urban        Nourished              [41]
  32          La Albufereta         Alicante                Urban        Nourished              [41,42]
  33          Cala Palmera          Alicante                Rural        Native                 [41]
  34, 35      San Juan              Alicante                Urban        Nourished              [41]
  36          Muchavista            El Campello             Urban        Nourished              [41]
  37–39       Carrer La Mar         El Campello             Urban        Nourished              [41,45]
  40          Bon-Nou               La Vila Joiosa          Rural        Native                 [41]
  41          Playa Centro          La Vila Joiosa          Urban        Nourished              Coastscape 1956 b ; [45]
  42          El Torres             La Vila Joiosa          Rural        Native                 [41]; Coastscape 1956 b
  43          Cala Finestrat        Finestrat               Urban        Nourished              [46]
  44–46       Ponent                Benidorm                Urban        Nourished              [47]
  47          Llevant               Benidorm                Urban        Nourished              [48]
  48          Port Blanc            Calp                    Rural        Native                 -
  49          Arenal Bol            Calp                    Urban        Nourished              [42]
  50          La Fossa              Calp                    Urban        Native                 [41]
  51          Cala Fustera          Benissa                 Village      Nourished              [49]
  52          L’Ampolla             Teulada                 Village      Native                 [41]
  53          El Portet             Teulada                 Village      Nourished              [50]
  54          El Moraig             Benitatxell             Rural        Native                 [34]
  55          L’Arenal              Xàvia                   Urban        Nourished              [51]
  56          Marineta Cassiana     Dénia                   Village      Nourished              [15,41]
  57          Punta del Raset       Dénia                   Village      Nourished              [41,42]
  58          Les Marines           Dénia                   Village      Nourished              [42]
  59          Les Bovetes           Dénia                   Village      Native                 [42]
  60          Molins i Palmeres     Dénia                   Village      Native                 [42]
  61          Racó de L’Alberca     Dénia                   Village      Native                 [42]
  62          Porta O (Sud)         Alicante                Rural        Native                 [34,52]
  63          Porta O (Nord)        Alicante                Rural        Native                 [34,52]
  64          Port Vell             Alicante                Rural        Native                 [34,52]
  65          Tabarca               Alicante                Rural        Native                 [34,52]
  66          Platja Gran           Alicante                Remote       Native                 [34,52]
        aEnvironmental services of the municipality (Pilar de la Horadada); b Coastscape 1956: Comparison among images
        of the American Flight, B (1956–1957 years.) and current images.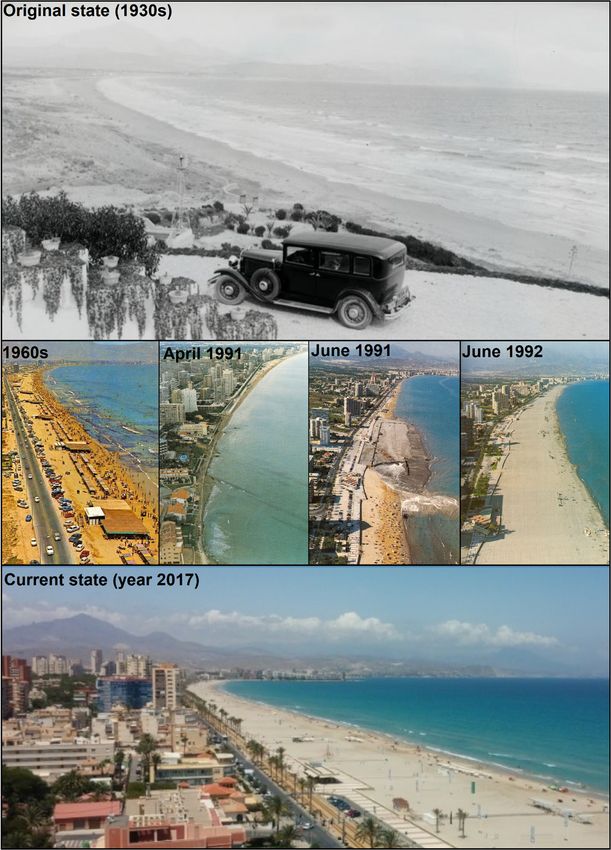
Water 2020, 12, 377                                                                                 5 of 25

2.2. Sampling Design
     A total of 66 sand samples were gathered in 16–19 February 2019, at sixty Mediterranean beaches
(Table 1). Each sample was collected in the middle of the backshore (i.e., in the dry beach) and
contained approximately 300 g of sand. First, the surface sand was removed and then, the sample
was gathered in the first 20 cm of depth. On the longest beaches such as “La Mata”, “San Juan”,
“Carrer la Mar”, and “Ponent”, several samples (2–3) were collected (Table 1). In this paper, only
sandy beaches were investigated. For this reason, the north-eastern region has some coastal sectors not
sampled due to the presence of cliffs or beaches mainly composed of gravel and boulders (Figure 1).
Complementary information about the existence of anthropic actions on the sampled beaches was
collected from both press news and coastal management actions by involved municipalities (Table 1).

2.3. Sand Colour Measurement and Analysis
     The colour of sand samples was determined in the laboratory of the University of Florence (Italy)
using the CIEL*a*b* 1976 colour space [25]. It required about 100 g of sand per sample to measure the
colour. Moreover, mineralogical composition was quantified under a binocular microscope (Nikon
SMZ 1500, Nikon Corp., Japan) from the Earth Sciences laboratory of the Alicante University (Spain).
For this analysis a representative sample (about 200 sand grains) was analysed and classified taking
into account three main groups of components: quartz, (i.e., leucocratic component), rock fragments,
and shell fragments (i.e., melanocratic components), then the values were recalculated to 100% in order
to synthesize and examine the results.
     Principal Component Analysis (PCA) was carried out in order to establish multivariate
relationships between samples as well as connections among them considering the CIEL*a*b*
coordinates as input data.
     Equations (1)–(3) were applied to quantify the chromatic change in a representative nourished
beach (sample No. 35, Table 1). For this, a native sample was required and measured in the CIEL*a*b*
colour space with the rest of the 66 samples.

                                        Hue (h) = arctan(b*/a*)                                        (1)

                                      Chroma (C*) = (a*2 + b*2 )1/2                                    (2)

      The distance between colours is given by the Euclidean distance:

                                 ∆E*ab = [(∆L*)2 + (∆a*)2 + (∆b*)2 ]1/2                                (3)

     Sedimentological analysis (particle size distribution) was performed via dry sieving at 1 phi
interval in order to have a more detailed database. For this characterization, initially, each sample
contained 200 g of sand. The software used for data analysis was “Gradistat” [53] and granulometric
parameters were calculated according to Folk and Ward (1957) [54].

3. Results and Discussion

3.1. Typology of Beaches
      Table 1 shows the main beaches under study, and their typology according to the Bathing Area
Registration and Evaluation (BARE) classification system [55]. This classification is based on the level
of urbanization, accessibility, etc., and establishes four basic types: remote, rural, village, and urban.
Remote areas are mainly defined by difficulty of access. They may be adjacent to rural areas and,
occasionally, village environments. Usually, remote beaches are not supported by public transport
and have very limited (0–5) or no temporary summer housing [55]. Rural areas are located outside
the urbanized environment. They are not accessible by public transport and present virtually no
facilities. Housing is limited in number, generally ranging from 0 to 10. Rural beaches do not have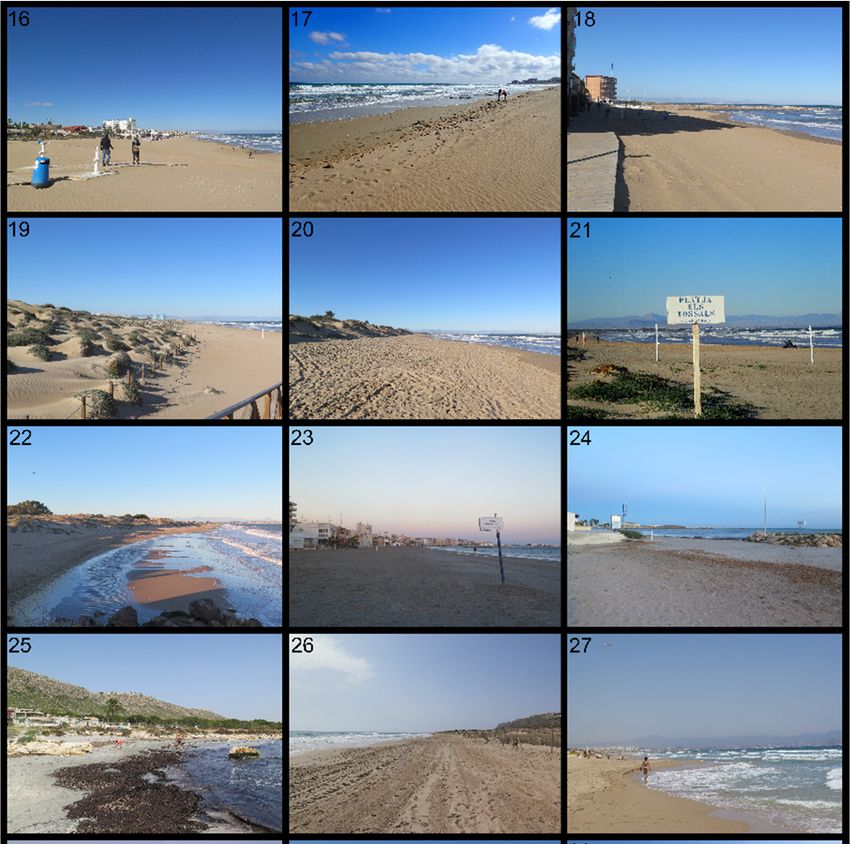
Water 2020, 12, 377                                                                                                  6 of 25

permanent community focal centres (e.g., schools, shops, cafes and bars) and they have little or no
beachfront development [55]. Village areas are located outside the focal urban environment and
related to a small and permanent population. Village beaches may be reached by public or private
transport [55]. Urban areas have large populations with well-established public services and a well-
marked central business district. In the proximity of urban areas can be found commercial activities
such as fishing/boating harbours and marinas. Urban beaches are located within or adjacent to the
urban area and are generally freely open to the public [55].
     The selected study case is an excellent example of coastal development under high touristic
pressure, with many coastal sites showing very urbanized conditions (34 studied beaches classified as
Urban in Table 2) and the rest of the cases are located in urbanized environments (13 Village beaches) or
they show the presence of houses (14 Rural beaches). Only a very few coastal sites (5) can be classified
as natural beaches, i.e., beaches with few anthropic interventions. They were classified as Remote.

      Table 2. Sector analysis approach (Sand condition and beach typology). Consider that the Chi-square
      Test was performed to see the level of significance among them.

                               Remote             Rural             Village           Urban             Total
              Nourished        0                  2                 6                 24                32
              Native           5                  12                7                 10                34
              Total            5                  14                13                34                66
                  Chi-square Test: α = 0.05; df = 3; X2 = 17.94; p-value = 0.00045; X2 3, 0.05 = 7.814; sig = yes.

       As a consequence of the urban and touristic pressure that affects the study area, some beaches
have been modified by anthropogenic activities, but others have preserved their original state,
i.e., only receive sand through natural processes. For this reason, a new classification was made
according to sand condition: “Nourished” and “Native” (Table 1).
       Nourished beaches are common in the study area [41,49–51,56–58], causing anthropogenic
modifications in the original appearance of the coast [59]. Construction of dams on land that retain
sediments, massive construction of buildings near the coast, creating new harbours and breakwaters,
beach nourishment, as well as sand movements from beach to beach are some examples. These coastal
modifications that have been carried out since approximately the middle of the 20th century [60], have
changed the native sand colour among other sediment characteristics. Figures A1–A5 show the current
state (February 2019) of the sampled sites. Sand colour observed in these images is a result of multiple
factors acting simultaneously: the camera used, hour, luminosity of the moment (e.g., sunny or shaded),
beach surface characteristics, etc. All these extrinsic determinants modify the perception of the real
intrinsic sand colour, which is mainly a consequence of the mineralogical composition. For these
reasons it is necessary to apply an objective methodology to quantify the chromatic appearance of
samples, i.e., in a laboratory with a quasi-uniform colour space method (CIEL*a*b*).

3.2. Sand Colour Analysis
     An interesting diversity of colours emerged along the study area (Figure 2, Table A1) mainly due
to two factors: the different origin of sediments (intrinsic factor) and the anthropic modifications that
have been carried out since approximately the middle of the 20th century (extrinsic factor).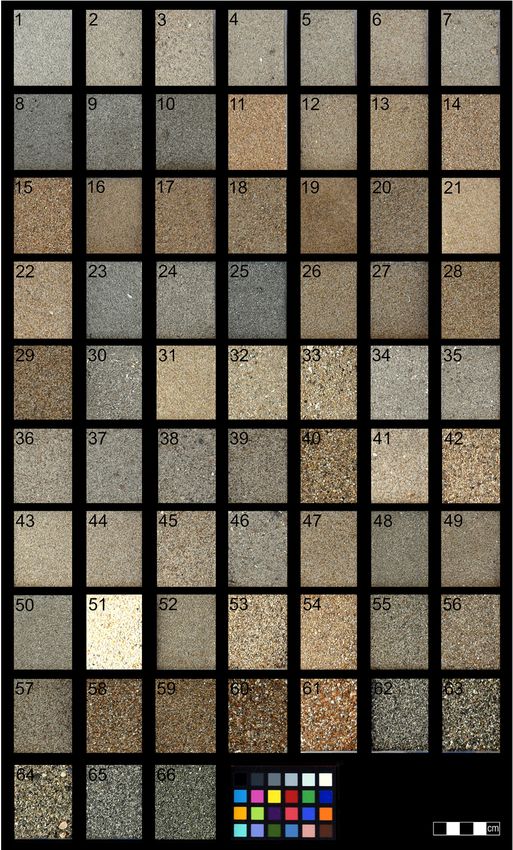
quasi-uniform colour space method (CIEL*a*b*).

3.2. Sand Colour Analysis
      An interesting diversity of colours emerged along the study area (Figure 2, Table A1) mainly
due 2020,
Water to two
          12, 377factors: the different origin of sediments (intrinsic factor) and the anthropic
                                                                                             7 of 25
modifications that have been carried out since approximately the middle of the 20th century
(extrinsic factor).

     Figure 2. Sand samples from the 66 coastal sites. One shoot in sunlight including X-rite colour table
     and centimetric scale.

     Regarding
     Regarding the
                thecolour
                    colourparameters (the(the
                            parameters     L*, a*
                                               L*,and
                                                    a* b* values)
                                                        and       expressed
                                                             b* values)     in Figurein3a,b,
                                                                         expressed           the following
                                                                                        Figure    3a,b, the
considerations can be argued:
following considerations can be argued:

3.2.1. The L* Value
     Four groups are differentiated according to the measured Lightness value: (i) samples with L* >60
(seven samples); (ii) samples with intermediate values (50 < L* < 60); (iii) samples with L* ≈ 48 (four
samples); and (iv) samples with L*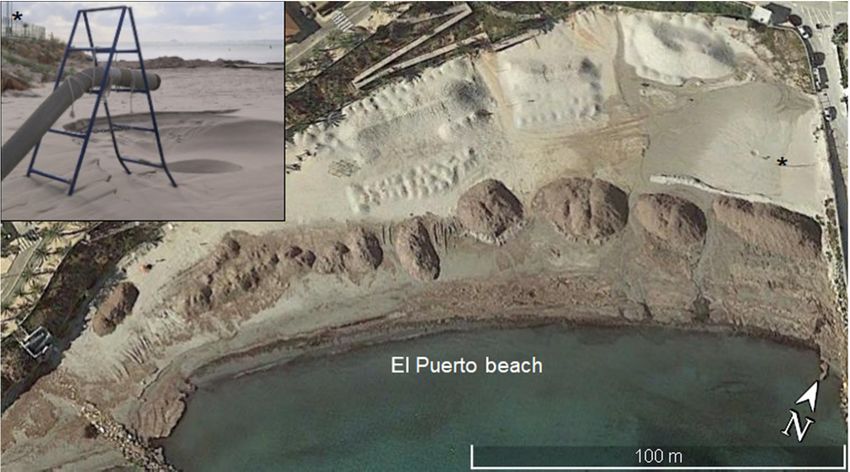
Neogene-Quaternary sediments mainly related to continental and coastal deposits [61]. Also, this
 area is characterized by unaltered coastal stretches. The northern beaches related to the External
 Zones of the Betic range are grouped in the second group. They are the most modified beaches and
 only a few of them are natural (Figure 3a). The dark colour of the northernmost beaches (included
 in the third group) is related to the contributions of different rivers and streams (e.g., Girona River
Water 2020, 12, 377                                                                                                       8 of 25
 and “Barranc de L’Alberca”). However, the darkest sands correspond to those included in                                      the
 fourth group. These samples are included in the geological context of the Tabarca Island (Figure
 3a). In
high       this island
       content    of darkthe outcrops
                           rock          are mainly
                                 fragments    that comes materials   from
                                                              from the       Internal
                                                                          black         Zonesand
                                                                                 dolomites      of the  Betic range.
                                                                                                   diabases,    which The    low
                                                                                                                       outcrop
 Lightness
along          of these
        the island        natural beaches is justified by the high content of dark rock fragments that comes
                      [23,52].
 fromTwothe samples
             black dolomites      and diabases,
                        differ significantly    fromwhich     outcroptrend
                                                        the general      along   the island
                                                                               defined       [23,52].
                                                                                         above.  On the one hand, sample
No. 62 differs from the rest of the samples located in Tabarca Island due to theabove.
       Two     samples     differ  significantly     from    the   general    trend  defined     influenceOnofthethe one  hand,
                                                                                                                     yellowish
 sample No. (Miocene
calcarenites     62 differsage)
                              fromthat
                                     theoutcrop
                                          rest of the    samples
                                                    at this  pointlocated      in Tabarca
                                                                     of the island          Island
                                                                                     [23,34].  On the dueother
                                                                                                           to the  influence
                                                                                                                hand,   sample of
 the  yellowish     calcarenites   (Miocene     age)   that  outcrop   at  this  point  of the island
number 51 shows the highest Lightness value (i.e., 70.75, Table 3, Figure 3a) because this sand is from [23,34].  On  the   other
 hand,
an  inlandsample    number 51 shows the highest Lightness value (i.e., 70.75, Table 3, Figure 3a) because
              quarry.
 this sand is from an inland quarry.
3.2.2. The a* and *b Plane
 3.2.2. The a* and *b Plane
      The parameters a* and b* (Table A1) are positively correlated among them (R2 = 0.89; p-value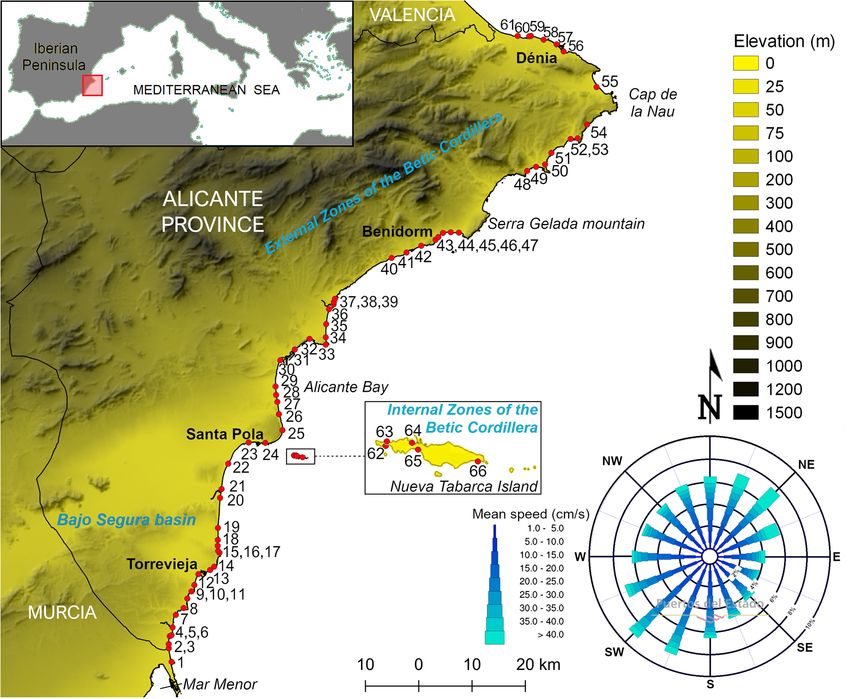
Water 2020, 12, 377                                                                                             9 of 25

than leucocratic ones, especially at Tabarca Island (Figure 4). Their abundance varies along the study
area from 27.74% to 91.92% (Table 3). Finally, bioclasts (i.e., small fragments of shells, sea urchins,
calcareous algae, corals, etc.) were also counted and their proportion in the study area is very low,
almost insignificant. Due to the dark aspect of bioclasts and their low abundance, they were included
in the melanocratic fraction.
     Concerning the abundance of leucocratic and melanocratic components, 14 samples contained less
than 50% of leucocratic components, while the rest (52) contained ≥50% of melanocratic components
(Figure 4). Table 3 shows median, mean, as well as minimum and maximum values of the colour data
(CIEL*a*b*) and mineralogical composition, i.e., percentage of leucocratic and melanocratic components.

                              Table 3. Summary of colour and mineralogical parameters.

                       L*       a*      b*       Leucocratic Components          Melanocratic Components
        Min.          40.16   −1.470    5.82                 8.08                            27.74
        Median        56.44   3.400    13.04                39.30                            60.70
        Mean          55.48   3.452    13.04                38.23                            61.77
        Max.          70.75   6.400    18.82                72.26                            91.92
Water 2020, 12, 377                                                                                           10 of 26

      Figure       Sampleposition
       Figure 4. Sample     position   according
                                   according       toLightness
                                              to the   the Lightness
                                                                (L*) and(L*)  and percentage
                                                                         percentage             of melanocratic
                                                                                    of melanocratic  components.
      components.    Colour
       Colour (yellow,      (yellow,
                        green,        green,
                               and blue)     and blue)
                                          indicates      indicates the
                                                    the geological     geological
                                                                    domains       domains
                                                                             to which       to which
                                                                                      the studied    the studied
                                                                                                  beaches  belong
      beaches   belong
       (respectively,   (respectively,
                      The               The Bajo
                          Bajo Segura basin,      Segura
                                              The Betic    basin, Zones,
                                                        External   The Betic  External
                                                                         and the       Zones,
                                                                                 Tabarca Islandand  thebelongs
                                                                                                which   Tabarcato
       the Betic
      Island     Internal
             which        Zones).
                     belongs to the Betic Internal Zones).

 3.4.Statistical
3.4.  StatisticalAnalysis
                  Analysis
      In order
     In  order to
                tofind
                    findcorrelations among
                          correlations among the the
                                                  different colour
                                                      different     and mineralogical
                                                                 colour                  parameters,
                                                                          and mineralogical            the Pearson
                                                                                                 parameters,   the
 correlation statistic coefficient was obtained    (Table A2).  On   the one  hand,  the highest
Pearson correlation statistic coefficient was obtained (Table A2). On the one hand, the highest    correlation was
 found among
correlation  wasa*found
                   and b*among
                           parameters
                                   a* and   = 0.89;
                                        (R2b*        p-value(R
                                              parameters      =22.2 × 10⁻¹⁶
                                                                 = 0.89;     ). On the
                                                                          p-value      other
                                                                                    = 2.2 × 10hand,   L* parameter
                                                                                               −16). On  the other
 shows   a  good   correlation   with  the  leucocratic    component      (R 2 = 0.62; p-value = 2.187 × 10⁻⁸ ).
hand, L* parameter shows a good correlation with the leucocratic component (R2 = 0.62; p-value =
2.187 × 10⁻⁸). Quartz grains normally present light colours and their high proportion in samples
determines sand clarity. In this way, the content of quartz grains is inversely proportional to the a*
and b* colour parameters as was previously concluded for the Belgian coast [9].
     Principal Component Analysis (PCA) is a multivariate-statistical technique used for reducing
the dimensionality of data. The resulting analysis is shown in a two-dimensional plot composed of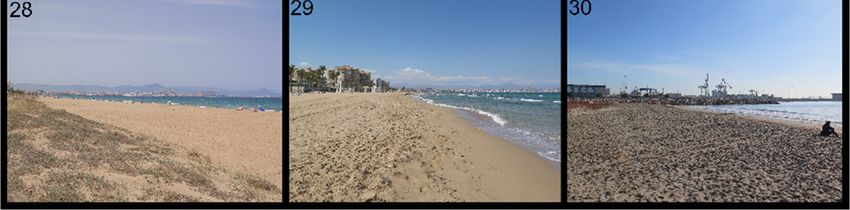
Water 2020, 12, 377                                                                                                    10 of 25

Quartz grains normally present light colours and their high proportion in samples determines
sand clarity. In this way, the content of quartz grains is inversely proportional to the a* and b* colour
parameters as was previously concluded for the Belgian coast [9].
     Principal Component Analysis (PCA) is a multivariate-statistical technique used for reducing the
dimensionality of data. The resulting analysis is shown in a two-dimensional plot composed of two
axes or components, PC1 and PC2 (Figure 5). PC1 explained 63.57% of the total variance and PC2
32.83%. The cumulative proportion of the second principal component was 96.39% (the data were
previously normalized). In the graph, the three colour variables (L*, a*, and b*) are represented with
arrows and each one of the 66 investigated sites is located in the graph according to its relation with the
variables, a technique applied previously in another sand colour study with important implications
for beach nourishment and coastal management [26]. The resulting distribution of the samples in the
graph is due to both their geographical location mainly related to the geological context and anthropic
actions carried out on the deposit (i.e., nourishment works). Four groups of beaches were identified
in the graph of Figure 5 according to their geographical location (“neighbouring beaches”): (i) the
southernmost beaches (n = 7); (ii) the northernmost beaches (n = 4); (iii) beaches of Santa Pola (n = 3);
and (iv) beaches of Tabarca Island (n = 5).
     Moreover, very interesting groupings can be observed according to sand condition consulted in
the bibliography        (Table 1). A group of natural samples (+10) from different municipalities11isof shown
      Water 2020, 12, 377                                                                                         26
towards the arrows of the colour variables (a* and b*, Figure 5). On the left side of the graph (Figure 5)
there (Figure  5) therethose
       are generally      are generally
                               beaches those  beaches
                                        identified     identified
                                                   as natural  or as naturalalterations
                                                                  without     or withoutinalterations
                                                                                            colour ofinsand.
                                                                                                          colour
                                                                                                               Theof sand
      sand.  The   sand   composition  of the northern  beaches  was also considered   as native  (Table
composition of the northern beaches was also considered as native (Table 1) where sediment supplies       1) where
      sediment supplies mainly arrive from the river and nearby streams. The sand of Tabarca beaches is
mainly arrive from the river and nearby streams. The sand of Tabarca beaches is also native and its
      also native and its source area is the island itself and seabed. In the central sector of Figure 5 there
source   area is the island itself and seabed. In the central sector of Figure 5 there are beaches located
      are beaches located in the central-northern part of the study area. Some of them correspond to
in themodified
        central-northern
                  beaches by part   of the study
                               nourishment   works area.   Some of them
                                                   and emplacement           correspond
                                                                       structures,          to modified
                                                                                   e.g., harbours   (No. 38,beaches
                                                                                                             39, 41, by
nourishment      works
      46, 48, 53, 57).     and emplacement     structures,  e.g., harbours   (No.  38, 39, 41,  46,  48, 53, 57).

      Figure  5. Principal
           Figure            Component
                    5. Principal Component   Analysis
                                                Analysis(PCA)
                                                          (PCA) graph:  representation
                                                                graph: representation of of sand
                                                                                         sand     samples
                                                                                               samples     according
                                                                                                       according  to to
      colour  variables
           colour        (L*, a*,
                    variables  (L*,and
                                    a*, b*).
                                        and See
                                             b*). Table A1 for
                                                  See Table  A1numerical   information
                                                                 for numerical          of each
                                                                               information       variable.
                                                                                            of each        Green
                                                                                                    variable.     colour:
                                                                                                              Green
      nativecolour: native
              samples;   redsamples;
                              colour: red   colour:
                                        altered     altered(information
                                                 samples    samples (information
                                                                         obtainedobtained   from bibliography
                                                                                   from bibliography           data, 1).
                                                                                                        data, Table
            Table 1).

      3.5. Grain Size Parameters
           The sediment studied from the 66 samples was classified mainly as coarse sand (78.8%), very
      coarse sand (12.6%), and medium sand (6.5%). Beaches in the southernmost part of the study area
Water 2020, 12, 377 11 of 25
3.5. Grain Size Parameters
The sediment studied from the 66 samples was classified mainly as coarse sand (78.8%), very
coarse sand (12.6%), and medium sand (6.5%). Beaches in the southernmost part of the study area were
composed essentially of fine sand, while from the central part to the north, different types of beaches
can be observed with rocky shores, gravel, pebbles, with fine, medium and coarse sand. Table A1
shows some of the grain size parameters of each sample.
3.6. Colour Modification due to Human Activities
As a consequence of the urban and touristic pressure, artificial beaches were created and deep
modifications in the native coastal deposits were carried out. The sand used to nourish the beaches
came from different sources: (i) submerged sandbanks (e.g., San Juan beach, No. 34–35), sometimes
near to the mouth of harbours; (ii) from other beaches (e.g., El Puerto beach, No. 4); and even (iii) from
a quarry inland (Fustera Beach, No. 51).
At the beginning of the 1990s one of the largest beach modifications in the province of Alicante was
carried out in San Juan beach (Figure 6). Thanks to a sample of sand from the late 1980s it was possible
to compare the native colour of the sand with the current one of the nourished beach, whose sand
grains come from the littoral bottoms in front of the Serra Gelada Mountain (Benidorm, Alicante) [57].
Table 4 shows the colorimetric parameters of two samples from different years (1989/2019) and gathered
in the same coastal sector of the beach. Difference of colour values between these two samples was
estimated [62].
Table 4. Coordinates in CIEL*a*b* colour space and their differences at the San Juan beach.
Sample L* a* b* ∆L* ∆a* ∆b*
San Juan II (2019 year.) 57.76 3.03 10.86
3.85 1.15 5.84
San Juan (1989 year.) 61.61 4.53 16.70
Equations (1) and (2) show the mathematical expression for quantifying the chromatic change in
terms of Hue differences (∆h) and Chroma differences (∆C*). The parameter Total Colour Difference
(∆E*, Equation (3)) is also used. The above calculations show that the colour of the beach after
nourishment works can change even when sediments come from near submerged areas. The colour
change is registered in all the chromatic parameters L*, a*, and b* (Table 4), and differences of −0.4◦
(h), −6 (C*), and 7.15 (∆E*) are evidenced by different equations. All these values reflect a significant
aesthetical change of the coastal deposit after the nourishment. On the one hand, the negative values
of ∆h and ∆C* mean that the new appearance of the altered San Juan beach is duller and more brown
than the native aspect. Therefore, the new beach colour is more distant from the ideal golden or
light sand appreciated by beach users [6]. On the other hand, the high ∆E* value indicates that
the chromatic change is clearly perceptible by local beach users, this occurs when the Total Colour
Difference parameter exceeds three units (∆E* > 3) [63]. Another similar example is the Varadero beach
(Cuba) where beach nourishment works performed several times in the past decades with nearshore
sands changed the original beach colour that was the second lightest one out of 100 in Cuba, now
occupying only the fiftieth position in rank [26].
San Juan beach is a clear example showing how the construction on the coast imposes a
barrier to wind dynamics that can even cause the disappearance of beaches with the consequent
requirement of nourishment works (Figure 6). In addition, river channelling and sediment retention
in upstream reservoirs, which contribute to the erosion of beaches [64,65], have played a significant
role in the reduction of the sediment input to this representative beach of south-eastern Spain.
Historical bathymetric measures in reservoirs of the study area confirm this issue (Centre for
Hydrographic Studies). Indeed, San Juan beach has been the subject of geological outreach activities
to promote the Geoheritage of the area, which has also very didactic geological and sedimentaryWater 2020, 12, 377 12 of 25
outcrops [66]. In the didactic activities undertaken [67], the sedimentological analyses of the sand
(colour, sorting and presence of bioclasts) has been used to understand and reflect on the differences
between the natural and the nourishment sediments of the beach, and how important it is to attempt
to archive equivalent sands to the original in beach nourishment works.
Water 2020, 12, 377 13 of 26
Figure 6.
Figure 6. San
San Juan
Juan beach.
beach. From
From the
the original condition to
original condition to the
the present
present one
one [57,68–70].
[57,68‒70].
The study case of “Cala Fustera” (No. 51, Table A1, Figures 7 and A4) constitutes another
example of significant coastal alteration after nourishment works. In this case, the previous sand
deposit was replaced in 2017 by artificial quarry sand. Figure 7 shows visually differences in the
colour of the coast of the Fustera Beach (now composed of quarry sand) with respect to the native
colour in this coastal area, which can be seen at the Pinets beach. This original deposit is mainly
composed of rocky shore with Posidonia oceanica banquettes (that are the characteristics that FusteraWater 2020, 12, 377 13 of 25
The study case of “Cala Fustera” (No. 51, Table A1, Figures 7 and A4) constitutes another example
of significant coastal alteration after nourishment works. In this case, the previous sand deposit was
replaced in 2017 by artificial quarry sand. Figure 7 shows visually differences in the colour of the
coast of the Fustera Beach (now composed of quarry sand) with respect to the native colour in this
coastal area, which can be seen at the Pinets beach. This original deposit is mainly composed of rocky
shore with Posidonia oceanica banquettes (that are the characteristics that Fustera Beach should have).
Unfortunately, no sand sample from the native Fustera Beach deposit was available. However, colour
differences
Water 2020, 12,have
377 been assessed assuming that the original aspect of the beach was similar to the14sand
of 26
colour of adjacent beaches. In this case, the chromatic change parameters take values of ∆h = 0.01,
∆C* = 8.13
beach was and ∆E =to20.55,
similar the indicating
sand colour
thatoftheadjacent beaches.
new beach In this
appearance case, whiter
is much the chromatic change
and bright than
parameters take
the original aspect. values of Δh = 0.01, ΔC* = 8.13 and ΔE = 20.55, indicating that the new beach
appearance is much whiter and bright than the original aspect.
Figure
Figure 7. Fustera Beach
7. Fustera Beach nourished
nourished in
in 2017
2017 with
with quarry
quarry sand
sand (No.
(No. 51,
51, Table
Table A1),
A1), and
and Pinets
Pinets beach,
beach,
non-altered site. The contrast between the artificial beach vs the natural one is obvious (2018 year.).
non-altered site. The contrast between the artificial beach vs the natural one is obvious (2018 year.).
The bottom of the figure shows Fustera Beach in summer
The bottom of the figure shows Fustera Beach in summer 2017.2017.
A third example of sand colour modification due to management actions is the case of El Puerto
A third example of sand colour modification due to management actions is the case of El
beach (sample No. 4) located in Pilar de la Horadada, Alicante. In this case, sand from the El Puerto
Puerto beach (sample No. 4) located in Pilar de la Horadada, Alicante. In this case, sand from the El
beach (a site next to a harbour from where sand is usually dredged, Figure 8) was transferred to other
Puerto beach (a site next to a harbour from where sand is usually dredged, Figure 8) was
beaches such as “El Mojón” or “Mil Palmeras”. Figure 8 shows the contact between the old and new
transferred to other beaches such as “El Mojón” or “Mil Palmeras”. Figure 8 shows the contact
coastal deposit. The colour difference of the added sand can be justified because the southern beaches
between the old and new coastal deposit. The colour difference of the added sand can be justified
are grouped at the top of Figure 5 with important differences in a* and b* parameters.
because the southern beaches are grouped at the top of Figure 5 with important differences in a*
and b* parameters.Water 2020, 12, 377 14 of 25
Water 2020, 12, 377 15 of 26
Figure 8. El
Figure 8. El Puerto
Puerto beach.
beach. One
One of
of the
the places
places where
where sand
sand is
is dredged,
dredged, mixed
mixed and
and distributed
distributed to
to other
other
beaches
beaches [71,72].
[71,72]. Image
Image source: Google Earth
source: Google Earth Pro
Pro (18
(18 March
March 2017).
2017).
4. Conclusions
4. Conclusions
This research is a new contribution to the diverse geological heritage of the southeast of the Iberian
This research is a new contribution to the diverse geological heritage of the southeast of the
Peninsula. Sand colour of natural beaches is influenced by the geological context in which they are
Iberian Peninsula. Sand colour of natural beaches is influenced by the geological context in which
located: External and Internal zones of the Betic Cordillera, and the Bajo Segura basin. These three
they are located: External and Internal zones of the Betic Cordillera, and the Bajo Segura basin.
main source areas of sediments determine natural sand composition and thus, the native beach colour.
These three main source areas of sediments determine natural sand composition and thus, the
Because of this, the resulting colour of each beach is the consequence of their mineralogical composition
native beach colour. Because of this, the resulting colour of each beach is the consequence of their
linked to the source and hydrographic basin. In this sense, natural beaches related to the geological
mineralogical composition linked to the source and hydrographic basin. In this sense, natural
context of the Bajo Segura basin are clearer than the rest due to the high content in quartz grains,
beaches related to the geological context of the Bajo Segura basin are clearer than the rest due to the
especially the southernmost ones. On the contrary, the darkest beaches are located in Tabarca Island,
high content in quartz grains, especially the southernmost ones. On the contrary, the darkest
whose rocky outcrops mainly belong to the Internal zones of the Betic Cordillera. Therefore, although
beaches are located in Tabarca Island, whose rocky outcrops mainly belong to the Internal zones of
geology is the basis of the native beach colour, human factors can modify sand characteristics, as in the
the Betic Cordillera. Therefore, although geology is the basis of the native beach colour, human
case of several studied beaches, especially those related to the geological context of the External Zones
factors can modify sand characteristics, as in the case of several studied beaches, especially those
of the Betic Cordillera.
related to the geological context of the External Zones of the Betic Cordillera.
To measure the colour in sandy sediments it is adequate to apply CIEL*a*b* methodology
To measure the colour in sandy sediments it is adequate to apply CIEL*a*b* methodology to
to objectively quantify the chromatic appearance of each sample. In the study area, generally
objectively quantify the chromatic appearance of each sample. In the study area, generally
nourished/altered beaches differ from the native ones. The alteration of the sand colour by anthropic
nourished/altered beaches differ from the native ones. The alteration of the sand colour by
actions transformed the natural colour increasing green and blue tones (a* and b* colour components)
anthropic actions transformed the natural colour increasing green and blue tones (a* and b* colour
and Lightness (positive values in L*). Despite this, a big group of natural beaches was identified with
components) and Lightness (positive values in L*). Despite this, a big group of natural beaches was
the highest a* and b* values (towards red and yellow tones). Colour and mineralogical parameters are
identified with the highest a* and b* values (towards red and yellow tones). Colour and
related among them, such as the Lightness and the content of leucocratic components. Many beaches
mineralogical parameters are related among them, such as the Lightness and the content of
with native sand present a high content of melanocratic components (>60%), while most of the
leucocratic components. Many beaches with native sand present a high content of melanocratic
nourished beaches normally show less than 60% of such components. Principal Component Analysis
components (>60%), while most of the nourished beaches normally show less than 60% of such
shows good groupings associated with the mineralogical composition (related to the geographical
components. Principal Component Analysis shows good groupings associated with the
location) and anthropic vs natural beaches. The position of the samples in the PCA graph is very useful
mineralogical composition (related to the geographical location) and anthropic vs natural beaches.
to compare the sand colour from different beaches and also to interpret the limited information about
The position of the samples in the PCA graph is very useful to compare the sand colour from
nourishment works carried out in the past.
different beaches and also to interpret the limited information about nourishment works carried out
The 66 investigated samples differ in colour parameters and the beaches that receive more tourists
in the past.
have been nourished and tend to be clearer (e.g., “Ponent”, “El Postiguet”, “San Juan”). Results show
The 66 investigated samples differ in colour parameters and the beaches that receive more
that a few nourished beaches, e.g., “Playa del Cura”, “Llevant”, “Arenal Bol”, “El Postiguet”, and
tourists have been nourished and tend to be clearer (e.g., “Ponent”, “El Postiguet”, “San Juan”).
“Ponent”, have a similar colour to the nearby native ones. The rest of the nourished beaches have lower
Results show that a few nourished beaches, e.g., “Playa del Cura”, “Llevant”, “Arenal Bol”, “El
Postiguet”, and “Ponent”, have a similar colour to the nearby native ones. The rest of the nourished
beaches have lower values of a* and b* colour parameters, moving towards green and blue tones,Water 2020, 12, 377 15 of 25
values of a* and b* colour parameters, moving towards green and blue tones, e.g., “Punta Prima”,
“Marineta Cassiana”, “Playa Lisa”, “Bernabeu II”, “Calas del Cuartel”, etc. Despite this, native clear
samples generally presented higher values in the a* and b* parameters, this giving a more golden visual
appearance, e.g., Ferri Beach, Cervera Beach, “Los Locos”, “Les Ortigues”, “La Mata” or “Bon-nou”
among others. Today, the beach colour is not taken into consideration in some nourishment works, at
least in the study area where “El Puerto” in the south or Fustera Beach in the north are clear examples.
This study showed with analytical data a post-nourishment change in sand colour, a common
consequence also produced in other coastal sites such as Italy, Belgium or Cuba. Such changes may not
be appreciated by national and international tourists as well as by old local beachgoers. The CIEL*a*b*
colour space used to characterise sediment colour and Lightness is a useful tool to avoid significant
changes in sand colour that can affect coastal scenery, beachgoers preferences, and the biological
processes of some species. Native sediment colour is a natural characteristic of the coastal landscape
and for this reason it should be maintained, at least in rural beaches and natural parks. It is essential
to preserve the most natural coastal areas such as the dunes of Guardamar or the Island of Nueva
Tabarca, considered by the Spanish Geological Survey as places of geological interest, mainly due to
their geomorphological, sedimentological and stratigraphic particularities. In urban beaches, where
all is artificial, a change of sand colour can be accepted in order to improve the beach attractiveness.
Regarding future research prospects on the colour of beach sand, it would be interesting to analyse the
sand properties against time in order to detect possible changes in the coastal environment.
Sand is a limited and increasingly valuable resource. Its use and relocation generates strong
environmental, economic, and social impacts, especially on the coast. For this reason, it is preferable
to opt for dune restoration and the elimination of unnecessary structures/constructions (on the coast
or inland) that promote beach erosion instead of proposing nourishment projects that involve large
economic investments and that may affect different coastal and marine habitats as well as associated
species. Finally, the method used in this paper is easy to apply and can be very useful to carry
out appropriate erosion management actions by means of beach nourishment works in the future.
Consequently, the current conclusions are of particular interest to future actions to preserve the natural
environments and original characteristics of native deposits.
Author Contributions: Conceptualization, F.A.-M. and H.C.; methodology, E.P., I.C. and H.C.; software, F.A.-M.;
formal analysis, E.P.; investigation, F.A.-M. and H.C.; resources, E.P.; data curation, F.A.-M.; writing—original draft,
F.A.-M., J.M.-M. and H.C.; writing—review and editing, E.P. and G.A.; visualization, J.M.-M.; supervision, H.C.;
funding acquisition, H.C. and G.A. All authors have read and agreed to the published version of the manuscript.
Funding: This research received no external funding.
Acknowledgments: Special thanks go to Laura Piqueras for her technical support in the laboratory. The authors
would also like to thank Jesús Soria for providing us with a 30-year-old sand sample (native) from San Juan beach.
Conflicts of Interest: The authors declare no conflict of interest.
Appendix A
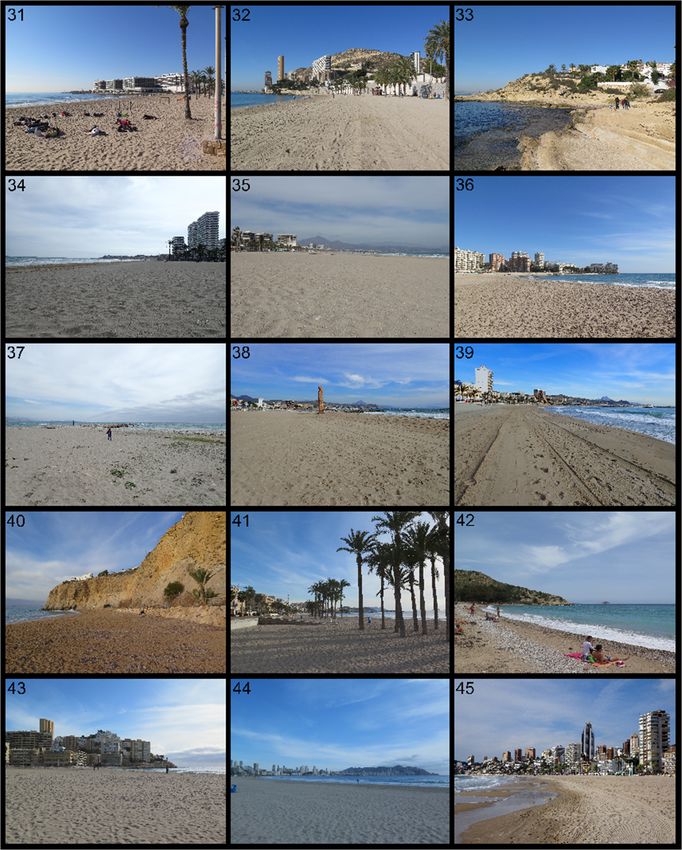
As complementary material, photographs of each of 66 sampling points (Figures A1–A5) and
other relevant numerical data (Tables A1 and A2) are attached.Water 2020, 12, 377 17 of 26
Appendix
Water 2020, 12, 377 16 of 25
FigureA1.
Figure A1.Beaches
Beachesinvestigated:
investigated: from
from“Torre
“TorreDerribada”
Derribada”(No.
(No.1)
1)to
to“Cala
“CalaCervera”
Cervera”(No.15).
(No.15).Water 2020, 12, 377 17 of 25
Water 2020, 12, 377 18 of 26
Figure A2.Beaches
FigureA2. Beachesinvestigated:
investigated:from
from“La
“LaMata
MataI”I”(No.
(No.16)
16)toto“San
“SanGabriel”
Gabriel”(No.30).
(No.30).Water 2020, 12, 377 18 of 25
Water 2020, 12, 377 19 of 26
Figure A3. Beaches
FigureA3. Beaches investigated:
investigated: from
from “El
“El Postiguet”
Postiguet” (No.
(No. 31) to “Ponent II”
II” (No.45).
(No.45).Water 2020, 12, 377 19 of 25
Water 2020, 12, 377 20 of 26
FigureA4.
Figure A4.Beaches
Beachesinvestigated:
investigated:from
from“Ponent
“PonentIII”
III”(No.
(No.46)
46)to
to“Molins
“Molinsi iPalmeres”
Palmeres”(No.60).
(No.60).Water 2020, 12, 377 20 of 25
Water 2020, 12, 377 21 of 26
Figure A5.Beaches
FigureA5. Beachesinvestigated:
investigated:from
from“Racó
“Racóde
deL’Alberca”
L’Alberca”(No.
(No.61)
61)toto“Platja
“PlatjaGran”
Gran”(No.66).
(No.66).
Table A1. Coordinates in CIEL*a*b* colour space of the 66 investigated samples and percentage of
sand grains by quartz (leucocratic component), rock fragments and shell fragments (melanocratic
components). The three granulometry parameters most commonly used are included. See Figure 1
for number location.
Colour Parameters Mineralogy Grain Size Parameters (µm)
No. Leucocratic Melanocratic
L*(D65) a*(D65) b*(D65) Mean Mode Median D50
Comp. (%) Comp. (%)
1 62.2 1.43 7.94 72.26 27.74 151.1 152.5 151.1
2 61.65 2.26 10.95 57.92 42.08 185.2 152.5 161.2
3 62.16 3.25 12.24 57.14 42.86 190.8 152.5 166.7
4 62.41 2.95 12.17 50.59 49.41 152.5 152.5 152.5
5 63.38 2.6 12 51.14 48.86 153.6 152.5 153.6Water 2020, 12, 377 21 of 25
Table A1. Coordinates in CIEL*a*b* colour space of the 66 investigated samples and percentage of
sand grains by quartz (leucocratic component), rock fragments and shell fragments (melanocratic
components). The three granulometry parameters most commonly used are included. See Figure 1 for
number location.
Colour Parameters Mineralogy Grain Size Parameters (µm)
No.
L*(D65) a*(D65) b*(D65) Leucocratic Comp. (%) Melanocratic Comp. (%) Mean Mode Median D50
1 62.2 1.43 7.94 72.26 27.74 151.1 152.5 151.1
2 61.65 2.26 10.95 57.92 42.08 185.2 152.5 161.2
3 62.16 3.25 12.24 57.14 42.86 190.8 152.5 166.7
4 62.41 2.95 12.17 50.59 49.41 152.5 152.5 152.5
5 63.38 2.6 12 51.14 48.86 153.6 152.5 153.6
6 64 4.03 14.52 53.91 46.09 193.2 152.5 169.8
7 63.71 3.68 13.32 52.97 47.03 194.7 152.5 170.6
8 57.06 1.48 8.37 50.00 50.00 149.2 152.5 149.2
9 59.06 1.71 9.27 41.63 58.37 182.9 152.5 159.3
10 56.7 2.01 10.08 43.10 56.90 153.8 152.5 153.8
11 54.4 5.66 16.49 30.35 69.65 194.3 152.5 171.0
12 57.02 3.32 13.36 29.62 70.38 150.9 152.5 150.9
13 57.14 4.45 15.51 38.56 61.44 177.8 152.5 155.7
14 57.19 5.53 16.01 25.10 74.90 233.8 302.5 269.0
15 55.07 6.04 17.7 31.66 68.34 239.5 302.5 276.3
16 57.33 4.39 16.07 28.90 71.10 150.1 152.5 150.1
17 55.44 5.41 16.9 30.21 69.79 198.7 152.5 176.0
18 55.54 4.95 16.29 39.02 60.98 189.6 152.5 162.3
19 54.95 5.53 18.06 29.87 70.13 154.5 152.5 154.5
20 54.9 4.59 14.89 33.84 66.16 224.7 302.5 253.3
21 57.95 4.44 15.9 39.57 60.43 149.7 152.5 149.7
22 55.43 4.3 14.02 44.49 55.51 199.9 302.5 180.0
23 53.78 0.72 6.41 48.78 51.22 149.3 152.5 149.3
24 55.9 2.02 9.76 48.47 51.53 151.3 152.5 151.3
25 52 0.81 5.82 51.38 48.62 151.4 152.5 151.4
26 55.78 4.3 15.19 40.08 59.92 152.6 152.5 152.6
27 57.15 4.21 14.65 45.45 54.55 188.7 152.5 164.4
28 54.48 5.27 16.21 32.74 67.26 236.2 302.5 272.4
29 52.14 5 15.57 30.29 69.71 296.0 302.5 296.0
30 58.52 2.6 11.6 52.22 47.78 181.8 152.5 157.8
31 56.76 3.48 15.12 35.58 64.42 174.9 152.5 155.3
32 57.11 3.11 14.46 40.27 59.73 232.5 152.5 258.9
33 53.53 4.38 16.76 14.22 85.78 469.5 605.0 537.2
34 58.41 2.83 9.85 48.12 51.88 193.0 152.5 166.2
35 57.76 3.03 10.86 46.32 53.68 187.6 152.5 159.4
36 58.41 3.73 12.57 56.28 43.72 234.0 302.5 269.8
37 57.58 2.87 10.23 40.33 59.67 199.2 152.5 177.3
38 56.79 3.09 11 46.15 53.85 232.7 302.5 266.0
39 56.07 3.73 12.72 45.43 54.57 239.4 302.5 276.6
40 54.26 5.55 17.54 8.08 91.92 904.3 605.0 682.0
41 56.43 3.3 11.88 52.26 47.74 232.2 302.5 265.3
42 51.92 4.86 14.65 15.00 85.00 386.1 302.5 331.9
43 58.55 2.94 13 46.82 53.18 183.6 152.5 159.8
44 58.85 3.58 12.84 58.72 41.28 176.9 152.5 156.3
45 56.44 4.1 13.71 42.91 57.09 258.2 302.5 291.0
46 56.75 2.93 11.02 46.75 53.25 191.0 152.5 163.7
47 56.93 4.64 15.44 42.53 57.47 196.5 152.5 174.4
48 53.62 2.48 12.06 28.23 71.77 151.5 152.5 151.5
49 56.59 4.07 14.47 34.01 65.99 182.5 152.5 158.8
50 57.23 2.71 13.07 33.33 66.67 180.5 152.5 157.5
51 70.75 3.55 18.82 39.04 60.96 275.2 302.5 280.9
52 51.88 2.16 10.81 22.85 77.15 176.0 152.5 155.8
53 55.07 2.61 11.94 36.22 63.78 290.1 302.5 292.3
54 54.77 5.41 16.44 10.00 90.00 624.0 605.0 615.2
55 51.72 2.4 10.95 24.42 75.58 237.1 302.5 273.7
56 56.55 1.29 8.57 66.79 33.21 189.6 152.5 167.6
57 52.02 3.15 12.39 50.43 49.57 185.1 152.5 161.4
58 47.66 5.16 15.32 29.44 70.56 292.6 302.5 292.6
59 47.78 5.37 15.66 35.96 64.04 299.4 302.5 299.4
60 46.91 5.69 15.19 19.90 80.10 572.2 605.0 559.0
61 48.01 6.4 15.7 23.75 76.25 470.3 605.0 538.1
62 45.95 1.16 8.14 12.81 87.19 380.3 302.5 330.7
63 40.16 2.37 11.21 16.67 83.33 593.4 605.0 593.4
64 46.03 2.26 12.73 21.33 78.67 464.1 605.0 534.1
65 46.13 −0.03 7.48 31.05 68.95 348.9 302.5 304.4
66 45.54 −1.47 8.93 19.70 80.30 605.0 605.0 605.0Water 2020, 12, 377 22 of 25
Table A2. Bivariate Pearson correlation matrix for the analyzed parameters. Relevant correlations
marked in bold.
L* a* b* Leucocratic Components Melanocratic Components
L* 1 0.058 0.119 0.624 −0.624
a* 1 0.890 −0.302 0.302
b* 1 −0.402 0.402
Leucocratic components 1 −1
Melanocratic components 1
References
1. Pranzini, E.; Vitale, G. Beach Sand Colour: The Need for a Standardised Assessment Procedure. J. Coast. Res.
2011, 61, 66–69. [CrossRef]
2. Roca, E.; Riera, C.; Villares, M.; Fragell, R.; Junyent, R. A combined assessment of beach occupancy and
public perceptions of beach quality: A case study in the Costa Brava, Spain. Ocean. Coast. Manag. 2008, 51,
839–846. [CrossRef]
3. Pranzini, E.; Simonetti, D.; Vitale, G. Sand colour rating and chromatic compatibility of borrow sediments. J.
Coast. Res. 2010, 26, 798–808. [CrossRef]
4. Ergin, A.; Karaesmen, E.; Micallef, A.; Williams, A.T. A new methodology for evaluating coastal scenery:
Fuzzy logic systems. Area 2004, 36, 367–386. [CrossRef]
5. Rangel-Buitrago, N. Coastal Scenery: Evaluation and Management; Springer: Cham, Switzerland, 2018.
6. Asensio-Montesinos, F.; Anfuso, G.; Corbí, H. Coastal scenery and litter impacts at Alicante (SE Spain):
Management issues. J. Coast. Cons. 2019, 23, 185–201. [CrossRef]
7. Peterson, C.H.; Bishop, M.J. Assessing the environmental impacts of beach nourishment. Bioscience 2005, 55,
887–896. [CrossRef]
8. Anfuso, G.; Williams, A.T.; Hernández, J.C.; Pranzini, E. Coastal scenic assessment and tourism management
in western Cuba. Tour. Manag. 2014, 42, 307–320. [CrossRef]
9. Cárdenes, V.; Rubio, A. Measure of the color of beach nourishment sands: A case study from the Belgium
coast. Trabajos de Geología 2015, 35, 7–18. [CrossRef]
10. Pranzini, E. Protection studies at two recreational beaches: Poetto and Cala Gonone beaches, Sardinia, Italy.
In Beach Management; Williams, A.T., Micallef, A., Eds.; Earthscan publishers: London, UK, 2009; pp. 287–306.
11. Houston, J.R. The economic value of beaches-a 2013 update. Shore Beach 2013, 81, 3–11.
12. Aragonés, L.; López, I.; Villacampa, Y.; Serra, J.C.; Saval, J.M. New methodology for the classification of
gravel beaches: Adjusted on Alicante (Spain). J. Coast. Res. 2014, 3, 1023–1034. [CrossRef]
13. Corbí, H.; Asensio-Montesinos, F.; Ramos-Esplá, A.A. The littoral bottoms of Benidorm Island (western
Mediterranean Sea): Eco-sedimentological characterization through benthic foraminifera. Thalassas 2016, 32,
105–115. [CrossRef]
14. López, I.; López, M.; Aragonés, L.; García-Barba, J.; López, M.P.; Sánchez, I. The erosion of the beaches on the
coast of Alicante: Study of the mechanisms of weathering by accelerated laboratory tests. Sci. Total Environ.
2016, 566, 191–204. [CrossRef] [PubMed]
15. Pagán, J.I.; Aragonés, L.; Tenza-Abril, A.J.; Pallarés, P. The influence of anthropic actions on the evolution
of an urban beach: Case study of Marineta Cassiana beach, Spain. Sci. Total Environ. 2016, 559, 242–255.
[CrossRef] [PubMed]
16. López, M.; Baeza-Brotons, F.; López, I.; Tenza-Abril, A.J.; Aragonés, L. Mineralogy and morphology of sand:
Key parameters in the durability for its use in artificial beach nourishment. Sci. Total Environ. 2018, 639,
186–194. [CrossRef] [PubMed]
17. Pardo-Pascual, J.E.; Sanjaume, E. Beaches in Valencian Coast. In The Spanish Coastal Systems; Springer: Cham,
Switzerland, 2019; pp. 209–236.
18. Pranzini, E. Il colore della sabbia: Percezione, caratterizzazione e compatibilità nel ripascimento artificiale
delle spiagge. Studi Costieri. 2008, 15, 101–122.
19. Fernández-Fernández, S.; Bernabeu, A.M.; Rey, D.; Rubio, B.; Vilas, F. Determinación del color como
herramienta de detección de contaminación por fuel en playas arenosas. Geogaceta 2011, 50, 165–168.You can also read