D2.1: Report on EU implementation of nZEBs - CRAVEzero
←
→
Page content transcription
If your browser does not render page correctly, please read the page content below

D2.1: Report on
 EU implementation of nZEBs

 COST REDUCTION AND MARKET
 ACCELERATION FOR VIABLE
 NEARLY ZERO-ENERGY BUILDINGS
 Effective processes, robust solutions, new business models and reliable life cycle costs,
 supporting user engagement and investors’ confidence towards net zero balance.

 CRAVEzero - Grant Agreement No. 741223
 WWW.CRAVEZERO.EU

                             Co-funded by the Horizon 2020 Framework Programme of the European Union
This document has been prepared for the European Commission however it reflects the views only of the authors, and the Com-
          mission cannot be held responsible for any use which may be made of the information contained therein.

 0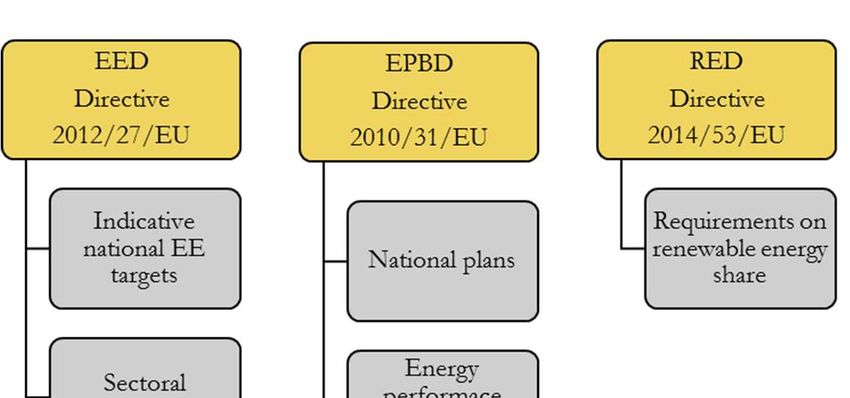
D2.1:                 Report on EU implementation of nZEBs

Authors:
Federico Garzia1, Roberta Pernetti1

Contributors:
Tobias Weiss2, David Venus2, Armin Knotzer2, Marine Thouvenot3, Bjorn Berggren4

1 euracresearch
2 AEE INTEC
3 Bouygues Construction

4 Skanska

April 2018

Disclaimer Notice: This document has been prepared for the European Commission however it reflects the views only of the
authors, and the Commission cannot be held responsible for any use which may be made of the information contained therein.

                                                                                                                        1
FOREWORD Cost optimal and nearly zero-energy performance existing technologies and practices, most experts levels are principles initiated by the European Un- agree that a broad-scale shift towards nearly-zero en- ion’s (EU) Energy Performance of Buildings Di- ergy buildings requires significant adjustments to rective, which was recast in 2010. These will be current building market structures. Cost-effective in- significant drivers in the construction sector in the tegration of efficient solution sets and renewable en- next few years because all new buildings in the EU ergy systems, in a form that fits with the develop- from 2021 onwards are expected to be nearly zero- ment, manufacturing, and construction industry pro- energy buildings (nZEB). cesses, as well as with planning, design, and procure- While nZEB realized so far have shown that the ment procedures, are the significant challenges. nearly-zero energy target can be achieved using CRAVEzero will focus on proven and new approaches to reduce the costs of nZEBs at all stages of the life cycle. The primary goal is to identify and eliminate the extra costs for nZEBs related to processes, technolo- gies, building operation, and to promote innovative business models taking into account the cost-effectiveness for all the stakeholders. © Copyright by the Horizon 2020 Framework Programme of the European Union Published by eurac research, Italy Disclaimer Notice: This document has been prepared for the European Commission however, it reflects the views only of the authors, and the Commission cannot be held responsible for any use which may be made of the information contained therein. 2
EXECUTIVE SUMMARY
The EPBD, as recast in 2010 (EPBD                               for the implementation of the nZEB definition: all
2010/31/EU), together with the Energy Effi-                     new public buildings starting from 1st January
ciency Directive (EED 2012/27/EU) and the Re-                   2019 and all private buildings starting from 1st Jan-
newable Energy Directive (RED 2014/53/EU)                       uary 2021 must reach the nZEB target, according
represent the key regulatory framework adopted at               to the federal definition. Figure 1 summarises the
EU level to promote and support the market up-                  main measures promoted by the three directives
take of nearly zero-energy buildings (nZEB) in Eu-              that affect the path towards nZEB in Europe.
rope. The article 9 of the EPBD set the timeline

Figure 1: Key elements of European Directives (EED, EPBD, and RED)

The EPBD did not provide minimum or maximum harmonized requirements for nZEBs, but required only
the implementation of very high energy performance, where the energy demand has to be covered to a very
significant extent by energy from renewable sources. Therefore, the analysis of definitions and the fixed
requirements shows how the countries chose different approaches to the matter, defining different system
boundaries. In most of the cases, such as the CRAVEzero countries, the requirements are set at single building
level and include in the definition of nZEB targets both new and renovated ones. At the same time, the
definition is established for both private, and public buildings. Concerning the balance period for calulating
the building energy performance and normalization factors, the Member States present a general
homogeneity: in most countries, the balance period is one year, and the normalization factor is the conditioned
area.

                                                                                                                   3
Cost-optimality
The EPBD stated that the achievement of high performances in nZEBs must go with the cost-optimality
assessment. The idea is that the building design, from envelope to technical systems, has to take into account
energy efficient solutions with minimal life cycle cost.
EU construction market
To understand better the field of application of the As stated in the project ZEBRA 2020, the lack of
EPBD, an overview on construction market and structured financing schemes and the need of in-
the building sector in Europe is provided. The ob- crease professional knowledge about best prac-
jective of CRAVEzero project is to identify and to tices among designers and craftsmen are currently
propose solutions to reduce the extra costs associ- the main barriers for the transition to nZEB im-
ated with the nZEB construction (Figure 2). plementation.
Extra costs for nZEB construction
Average cost of new constructions Extra costs for nZEB construction
100%
80%
60%
40%
20%
0%
RO AT BE CZ DK FR DE IT LT NO PL SK ES SE
Figure 2: Extra costs for nZEBs construction versus average cost of new constructions (Pascual et al., 2016).
Focus at national level (EEWärmeG). In several reports to the European
To carry out a comparative analysis among coun- Commission, the German federal government ex-
tries, an analysis of regulatory framework at the na- pressed the intention to define the future nZEB-
tional level is needed. This report focuses on level based on “KfW efficiency houses”, a
CRAVEzero countries, Austria, Germany, France, subsidies scheme for buildings that exceed current
Italy, and Sweden, were selected. requirements. KfW standards for new buildings
Austria - The document “national plan” included are not expressed by absolute values, but by com-
minimum standards for four energy indicators, paring the performances with a corresponding ref-
which are used to define nZEBs: space heating de- erence building, calculated with the indicated max-
mand, primary energy demand, CO2 emissions and imum U-values.
total energy efficiency factors. The OIB guideline
6 includes requirements for renewable energy France - The Thermal Regulation RT2012 ex-
share, for both new construction and major reno- presses requirements for primary energy con-
vation of a building. sumption. Total primary energy consumption is
defined for heating, cooling, hot water production,
Germany - The current regulatory framework, lighting, ventilation, and any auxiliary systems. RT
which deals with energy efficiency and renewables 2012 requires the use of a renewable energy source
in buildings, is structured in three parts: Energy for individual houses. Five ways to meet this re-
Saving Act (EnEG), Energy Saving Ordinance quirement are provided.
(EnEV), Renewable Energy Heat Act
4Italy - The decree D.M. 26 of June 2015 set the calculate the nZEB requirements in Italy and Ger-
requirements for new construction and nZEB. many. It is a single-family house representative of
Such as in the case of Germany, the decree the EU stock (FP7 project Inspire). As regards
introduced the reference building for defining the technical systems, different configurations have
maximum limit of primary energy. The reference been adopted to show the effect of each technol-
building is assumed as a building with the same ge- ogy on the primary energy demand, keeping con-
ometry and specific values for the envelope ther- stant the U-values (as indicated in the require-
mal transmittance as well as HVAC system effi- ments). The four different cases simulated in
ciency. PHPP are:
Sweden - The Swedish Building Code (BBR) is in • Case 1: the building has a heat pump for heat-
charge to define building energy performance; cur- ing and domestic hot water (COP=3), but no
rently, the BBR 25 (BFS 2017:5) is in force. The mechanical ventilation. We adopted an air
Swedish regulation set the requirements for build- change rate at pressurization test (n50) of 4 vol-
ing energy consumption, defining as an indicator umes per hour. This is a standard value where
the “specific energy use”. The Swedish regulation no particular focus on airtightness level.
does not indicate any requirement on a minimum • Case 2: the building has mechanical ventilation
renewable energy share. with a heat recovery system.
• Case 3: same building with the maximum air
Comparative analysis change rate for Passive House Standard and
The comparative analysis of the requirements for high air tightness (0.6 1/h).
nZEBs among CRAVEzero countries, was carried
• Case 4: the same as case 2, whereas the heat
out by simulating the performances of a reference
pump is replaced by a gas condensing boiler.
building in PHPP (Passive House Planning Pack-
age). The reference building was modeled to
In Figure 3Figure 17 primary energy requirements of the primary energy demand. A building design
of Austria, France and Sweden are compared with with special attention to airtightness permits a fur-
those reached by Italy and Germany with their ref- ther reduction of 9.8% of primary energy. The case
erence building in two configurations: case 2 (heat number four represents a building with a gas con-
pump, ventilation with heat recovery) and case 4 densing boiler and a ventilation system. The pri-
(gas condensing boiler, ventilation with heat re- mary energy demand, in this case, is 28.7% higher
covery). Figure 4 shows how the installation of a than with a heat pump.
ventilation system results in a reduction of 10.1%
Primary energy demand Primary energy for different tech. systems
[kWh/(m2a)] [kWh/(m2a)]
HP Condensing boiler Italy Germany
200
200
150
150
100
100
50 50
0 0
Austria Germany France Italy Sweden Case 1 Case 2 Case 3 Case 4
Figure 3: Primary energy demand for heat pump and gas condensing Figure 4: Primary energy demand for the reference building in
boiler in CRAVEzero countries. Germany and in Italy with different tech. systems.
5Contents
1. Introduction ................................................................................................................................................................................. 9
2. Overview at EU level ............................................................................................................................................................... 10
2.1. The European policies on nZEBs ............................................................................................................................... 10
EU Directives ....................................................................................................................................................... 10
Overview of implementation ............................................................................................................................. 12
Cost-optimality ..................................................................................................................................................... 14
Relevant projects .................................................................................................................................................. 15
2.2. EU Construction market ............................................................................................................................................... 16
3. Focus at national level.............................................................................................................................................................. 21
3.1. Austria .............................................................................................................................................................................. 22
Definition and regulatory policy ........................................................................................................................ 23
EP and envelope features ................................................................................................................................... 23
Renewable energy sources .................................................................................................................................. 23
Other requirements .............................................................................................................................................. 24
3.2. Germany........................................................................................................................................................................... 24
Definition and regulatory policy ........................................................................................................................ 24
EP and envelope features ................................................................................................................................... 25
Renewable energy sources .................................................................................................................................. 25
Other requirements .............................................................................................................................................. 26
3.3. France ............................................................................................................................................................................... 26
Definition and regulatory policy ........................................................................................................................ 26
EP and envelope features ................................................................................................................................... 26
Renewable energy sources .................................................................................................................................. 27
3.4. Italy ................................................................................................................................................................................... 27
Definition and regulatory policy ........................................................................................................................ 27
EP and envelope features ................................................................................................................................... 28
Renewable energy sources .................................................................................................................................. 29
3.5. Sweden ............................................................................................................................................................................. 29
Definition and regulatory policy ........................................................................................................................ 29
EP and envelope features ................................................................................................................................... 29
Renewable energy sources .................................................................................................................................. 30
Other requirements .............................................................................................................................................. 30
4. Comparative analysis ................................................................................................................................................................ 31
4.1. Reference building.......................................................................................................................................................... 31
4.2. Results .............................................................................................................................................................................. 32
5. Conclusions ............................................................................................................................................................................... 36
6. References .................................................................................................................................................................................. 37
6LIST OF FIGURES
Figure 1: Key elements of European Directives (EED, EPBD, and RED).........................................................12
Figure 2: Timeline for nZEB implementation (D'Agostino, 2015)........................................................................12
Figure 3: nZEB definitions in MSs, including Norway (BPIE, 2015). ..................................................................13
Figure 4: Building typology and building classification in nZEB MS definitions (D’Agostino et al., 2016). ..13
Figure 5: Energy balance and building physical boundary in nZEB MS definitions (D’Agostino et al., 2016).
...........................................................................................................................................................................................14
Figure 6: Share of residential in total building floor area across Europe (EU Buildings Observatory, 2013).17
Figure 7: Number of completed dwellings per 1000 citizens (Deloitte, 2017).....................................................18
Figure 8: Distribution of new residential buildings according to the nZEB radar graph in 2014 (EU IEE
ZEBRA2020 Data Tool). ..............................................................................................................................................18
Figure 9: Distribution of new non-residential buildings according to the nZEB radar graph in 2014 (EU IEE
ZEBRA2020 Data Tool). ..............................................................................................................................................19
Figure 10: Share of heating systems according to climatic zones (Paoletti et al., 2017). ....................................19
Figure 11: Average U-value of the envelope in residential buildings [W/(m2K)] (EU Buildings Observatory,
2014). ................................................................................................................................................................................20
Figure 12: Share of buildings with photovoltaic systems across Europe (EU IEE ZEBRA2020 Data Tool).
...........................................................................................................................................................................................20
Figure 13: Share of buildings with solar thermal systems across Europe (EU IEE ZEBRA2020 Data Tool).
...........................................................................................................................................................................................21
Figure 14: Extra costs for nZEBs construction versus average cost of new constructions (Pascual et al., 2016).
...........................................................................................................................................................................................21
Figure 15: Reference building used to calculate the requirement on primary energy consumption (Concerted
Action, 2014). ..................................................................................................................................................................25
Figure 16: Comparison of the heating demand among selected countries regarding final energy and primary
energy. ..............................................................................................................................................................................32
Figure 17: Primary energy demand for heat pump and gas condensing boiler. ...................................................33
Figure 18: Primary energy demand for the reference building in Germany and in Italy with different tech.
systems. ............................................................................................................................................................................33
7LIST OF TABLES Table 1: Absolute level of energy consumption in 2020 as indicated from MSs (www.ec.europa.eu). ............11 Table 2: Overview of the factors actual markets should grow by to satisfy future demand (BPIE, 2011). ....20 Table 3: Overview of the issued regulations for CRAVEzero countries. .............................................................22 Table 4: Main characteristics of the national regulations. ........................................................................................22 Table 5: Requirements for residential and non-residential buildings, as well as for new and existing buildings. ...........................................................................................................................................................................................23 Table 6: Additional requirements on U-values. .........................................................................................................23 Table 7: U-values comparison for new buildings between EnEV2014 and KfW. ..............................................25 Table 8: Share of renewable energy sources according to EEWärmeG. ...............................................................26 Table 9: Requirements on primary energy for residential and non-residential buildings, as well as for new and existing buildings in France. .........................................................................................................................................27 Table 10: U-values for new and existing buildings in the climate zone E to define the reference building....29 Table 11: Requirements on specific energy use for residential and non-residential buildings in Sweden (zone 3). ......................................................................................................................................................................................29 Table 12: Geometrical features of the reference building........................................................................................31 Table 13: Summary of the four cases modeled in PHPP.........................................................................................32 Table 14: U-values requirements comparison in the consortium countries. ........................................................34 Table 15: Primary energy factors comparison in CRAVEzero countries. ............................................................35 8
1. INTRODUCTION
The Energy Performance of Building Directive              As the first driver of the uptake of nZEB, the docu-
(EPBD) 2010/31/EU introduced the nZEB con-                ment focuses on the overview of the EU Directives
cept as a target to be reached by all the new construc-   and related activities (i.e., Concerted Action) identi-
tions from January 2019, in case of public buildings,     fying the general definition given by the European
and from January 2021 in case of private ones. De-        Commission and the indications to the Member
spite the established deadlines, the nZEB uptake is       States (MSs). Starting from the general framework,
still far from the EPBD target, in case of both reno-     Section 2.1.2 reports an overview of the national im-
vation and new construction. As demonstrated by           plementation across EU, identifying the main as-
the IEE project ZEBRA2020 and by the Concerted            pects of the calculation approach (e.g., metrics,
Action, the implementation of the EPBD at the na-         boundaries, normalization). Then, this deliverable
tional level is quite fragmented regarding both re-       reports in section 2.2 an overview of the EU con-
quirements and evaluation approach. Therefore,            struction market, organizing data from literature and
making a comparative analysis of the national stand-      previous projects.
ards, nZEB targets and features is quite difficult.       A special focus is devoted at the national level for
For the development of the activities within              the countries involved, with a case study, within the
CRAVEzero, it is strategic to characterize the cur-       project: Austria, Germany, France, Italy, and Swe-
rent nZEB situation across Europe, considering the        den. This section describes the national regulatory
national adoption of European Directives and im-          policies and requirements regarding energy perfor-
pacts on the construction sector, with a special focus    mance, the share of renewable energy sources, enve-
of the countries involved within the project.             lope insulation and technical systems performances.
In this regard, D2.1 aims to provide a general analy-     Each country has its characteristics, which are re-
sis of the implementation of nZEB across Europe,          flected in the different approaches towards the im-
identifying the main information on the regulatory        plementation of the EPBD. Eventually, in section 4
framework, policies, and impact on the construction       a comparative analysis of the requirements among
sector.                                                   the CRAVEzero countries involved in the consor-
                                                          tium is proposed.

                                                                                                               9
2. OVERVIEW AT EU LEVEL
The Energy Performance of Building Directive To better understand the regulatory framework de-
(EPBD 2010/31/EU) defines a nZEB as a building veloped in each country, this section will first give an
that has a very high-energy performance, as deter- overview of the main European directives that influ-
mined by Annex I, where a common general frame- ence the building features. Section 2.1.2 reports the
work for the calculation of energy performance of status of implementation at national level, analyzing
buildings is introduced. The nearly zero-energy tar- the specificities and the main differences across the
get should be covered, to a very significant extent, by Member States, with a focus on new construction
energy from renewable sources, including energy and nZEB implementation. One of the key concepts
produced on-site or nearby. Considering the differ- in the EPBD is cost-optimality. Therefore a closer
ences among countries regarding the construction look to this aspect has been devoted in section 2.1.3.
market, climate conditions and energy mix, the In the end, forerunner projects, which tackled the is-
EPBD established the Member States to elaborate sue of nZEB implementation in Europe, will be pre-
their nZEB definition and to set specific national re- sented.
quirements according to the context.
2.1. THE EUROPEAN POLICIES ON NZEBS
EU DIRECTIVES
The EPBD, as recast in 2010 (EPBD 2010/31/EU), together with the Energy Efficiency Directive (EED
2012/27/EU) and the Renewable Energy Directive (RED 2014/53/EU) represents the key regulatory frame-
work adopted at EU level to promote an increase of energy efficiency and renewable energy production.
Energy Efficiency Directive (EED 2012/27/EU)
In October 2012, EU adopted the Energy Efficiency an update to this Directive, including a new 30% tar-
Directive 2012/27/EU. It established a set of get by 2030.
measures for the promotion of energy efficiency, at The Directive applies minimum requirements and
all stages of the energy chain, starting from the pro- objectives, which are complementary to the indica-
duction to final consumption. The aim is to achieve tions of the EPBD 2010/31/EU; the Member States
the target of 20% of energy savings by 2020. In No- are allowed to set more tightening ones. Key
vember 2016, the European Commission proposed measures to enhance the energy efficiency promoted
by the directive are the followings:
① Energy saving efficiency targets for the Member States.
② Exemplary role of public buildings - article 5 sets binding renovation targets for public buildings.
③ Energy efficiency obligations - obligations related to the previous point are also imposed. For instance,
every year starting from 2014, each MS shall refurbish 3% of the buildings owned or occupied by
central government.
④ Energy audits and management - article 8 states that MS shall promote cost-effective, independent and
high-quality energy audits for all final customers. Also, non-small and medium-sized enterprises shall
implement energy or an environmental management system.
⑤ Metering and billing - good energy consumption management requires that the consumer can easily
access to data through individual metering and billing information.
⑥ Qualification, accreditation and certification schemes, energy services and energy performance con-
tracting, split incentives, online platform.
10Although the abovementioned measures have a The EED directive aims at reducing the energy con-
higher impact on existing buildings, the application sumption at EU level of 30%. To reach that target,
can also improve the energy efficiency of new con- each country has a specific objective. Table 1 reports
structions. In particular, the improvement of moni- the absolute level of energy consumption target in
toring and billing approach as well as a structured 2020 as indicated by the Member States to the Euro-
energy management of buildings can foster the pean Commission, with a focus on the CRAVEzero
proper operation of nZEBs and guarantee the en- countries.
ergy performance targets.
STATE PRIMARY PRIMARY FINAL ENERGY FINAL EN-
ENERGY ENERGY PER [MTOE] ERGY PER
[MTOE] CAPITA CAPITA
[TOE] [TOE]
Austria 31.5 3,6 25.1 2,9
Germany 276.6 3,4 194.3 2,4
France 219.9 3,3 131.4 2,0
Italy 158 2,6 124 2,0
Sweden 43.4 4,3 30.3 3,0
Table 1: Absolute level of energy consumption in 2020 as indicated from MSs (www.ec.europa.eu).
Energy Performance of Building Directive (EPBD 2010/31/EU)
The first version of the Directive was approved in December 2002 and recast in May 2010. This Directive
established targets for the Member States to be fulfilled by all the new public buildings from January 2019
and all residential ones from 2021. As mentioned before, this Directive introduced the concept of nZEB and
the main indications for implementation. It also added the concept of cost-optimality. Key elements of the
directive are:
① Boosting the Member States to draw up National Plans towards nZEB, establishing definitions, re-
quirements, and policies to reach the nZEB target.
② Encouraging the integration of renewable energy sources.
③ Cost-optimality - Article 2.14 defines the cost-optimal level as “the energy performance level which
leads to the lowest cost during the estimated economic lifecycle”.
④ Energy performance certificates, introduced in the EPBD 2002/31/EC, serve as an information tool
for building owners, occupiers, and real estate actors.
⑤ Establishing regular inspections of heating and cooling systems.
⑥ Certification of buildings, which only qualified experts are accredited to carry out independently.
Renewable Energy Directive (RED 2014/53/EU)
The Directive 2014/53/EU established an overall policy for the promotion of the energy production from
renewable sources. It requires the Member States to fulfill at least 20% of its total energy consumption with
energy from renewables by 2020. Also, it requires that at least 10% of transport fuels come from renewable
sources. The 20% target was updated in November 2016. The new target requires at least 27% of energy from
renewable energy sources in the final energy consumption by 2030. Figure 1 summarises the main measures
promoted by the three directives that affect the path towards nZEB in Europe.
11Figure 1: Key elements of European Directives (EED, EPBD, and RED).
OVERVIEW OF IMPLEMENTATION
The article 9 of the EPBD set the timeline for the project ZEBRA2020 and the main relevant papers
implementation of the nZEB definition, as shown in on the topic.
Figure 2 (D'Agostino, 2015). All new public build- Following the indication of EPBD 2020/31/EU, in
ings starting from 1st January 2019 and all private 2015 fifteen countries of the European Union had
buildings starting from 1st January 2021 must reach submitted a definition of nZEB, and four countries
the nZEB target, according to the federal definition. set both a definition with a numerical target with a
To give an overview of implementation across Eu- specific requirement on renewable energy share. Fig-
rope, we reviewed the latest issued reports, such as ure 3 reports results of definition implementation
from the EPBD Concerted Action, from the IEE across Europe from 2013 to 2015 (D’Agostino et al.,
2016).
Figure 2: Timeline for nZEB implementation (D'Agostino, 2015).
12nZEB definitions in MS
2013 2015
15
9 10 10
6
4 3
Definition in place Definition still to be Definition under No information available
approved development
Figure 3: nZEB definitions in MSs, including Norway (BPIE, 2015).
The analysis of definitions and the fixed evaluation), which can refer to a single building or
requirements shows how the countries chose groups of buildings. In most of the cases, such as the
different approaches to the matter, defining different CRAVEzero countries, the requirements are set for
system boundaries. Figure 4 summarizes the main single buildings and include in the definition of
differences and their distribution across the Member nZEB targets both new and renovated ones. At the
States. As stated in D’Agostino et al. (2016) as well same time, the definition is established for both
as in the outcomes of Task 40, the boundaries of the private, and public buildings. Concerning the balance
energy balance are one of the most discussed issues, period and normalization factors, MSs present a
since they strongly affects the assessment of the general homogeneity. In most countries, the balance
renewable energy production that can contribute to period is one year, and the normalization factor is the
the energy balance. Another critical point is the focus conditioned area.
of the definition (that also affects the performance
New Retrofit New and Retrofit Private Public Private/Public
0%
8%
21%
0%
79%
92%
Figure 4: Building typology and building classification in nZEB MS definitions (D’Agostino et al., 2016).
13Energy demand vs. Energy generation Building unit
Virtual balance between demand and generation Building site
Energy import vs energy export Single building
Not specified Building/building unit/part of building/zone
31% 24% 28%
48%
12%
17% 36%
4%
Figure 5: Energy balance and building physical boundary in nZEB MS definitions (D’Agostino et al., 2016).
Considering the generation from renewable energy On the one hand, there is a need for economic in-
sources, all countries include solar thermal, geo- centives and pilot programs as drivers of the mar-
thermal, heat recovery, and photovoltaics. Among ket transition to nZEBs. On the other hand, a lack
the CRAVEzero partners, a minimum require- of professional knowledge and experience was
ment for the renewable energy share is set in the identified. Most of the countries, examined in the
case of Austria, Germany, Italy, and France, while project, pointed out that there are obstacles in the
the majority of MSs renewable energy share is not diffusion of innovative energy saving technical so-
included in the primary energy requirement. An lutions among designers and craftsmen.
exception is France, where a certain amount of en- The objective of CRAVEzero is to tackle these is-
ergy from photovoltaics can be accounted the pri- sues, identifying and reducing the extra costs of
mary energy consumption; this determines a nZEBs, so that the impact on financing policies
higher requirement. can be reduced. Furthermore, one of the outcomes
of the project is the CRAVEzero pinboard, an in-
Drivers and barriers strument where information, methodologies, tools
To analyze major drivers and barriers in the nZEB and approaches defined within the project are col-
market uptake in Europe the single country must lected. This instrument will support industry part-
be considered. However, the ZEBRA2020 project ners in the planning process to structure the spe-
identified two common aspects, which go beyond cific business model.
national differences: financing schemes and pro-
fessional knowledge.
COST-OPTIMALITY
The achievement of high performances in nZEBs the building envelope when they are replaced or ret-
must go with the cost-optimality assessment. The rofitted, with a view to achieving cost-optimal lev-
EPBD Directive stated that, MSs shall “take the nec- els”. Furthermore, the guidelines accompanying
essary measures to ensure that minimum energy per- Commission Delegated Regulation (EU) 244/2012
formance requirements are set for building elements supplementing the EPBD established “a compara-
that form part of the building envelope and that have tive methodology framework for calculating cost-
a significant impact on the energy performance of
14optimal levels of minimum energy performance re- account energy efficient solutions with minimal life
quirements for buildings and building elements.” cycle cost. The investigated countries have adopted
Cost-optimality means that the building design, from this aspect of the Directive as follows:
envelope to technical systems, has to take into
• Austria – OIB in March 2013 carried out studies on the cost-optimality of the energy performance
requirements of nZEB 2020. The requirements, which have been defined in the OIB Guidelines 6, are
based on those studies (Leutgöb, et al., 2012 and Mitterndorfer et al., 2012).
• Germany – Report on cost-optimality shows the calculations performed on a set of six representative
model buildings, where different solutions were tested on new buildings. Results of the report show
that the current requirements for all types of new buildings meet or exceed the cost‐optimal level
(Concerted Action, 2014).
• France – RT2012 states: “Regulatory requirements were developed starting from techno-economic
studies. These made it possible to determine an optimum between the impact of the requirements on
the cost of construction and the gain in energy consumption and comfort.”
• Italy – Studies on cost-optimality were conducted in 2013 to define the requirements.
• Sweden – The national board of housing, building, and planning (Boverket), continuously monitors
cost-optimality of the requirements. Several revisions have been carried out in the last years. A further
one is planned in 2019/2020.
RELEVANT PROJECTS
There are several EU projects dealing with nZEB, and in this report, we adopted as a source of information
for monitoring the nZEB implementation at European level three main references:
ZEBRA2020 - Nearly Zero-Energy Building Strategy 2020: the results of the project “are meant to reinforce
the investors’ confidence in the market transition and the long-term perspective of nZEB targets.” The pro-
ject carried out cross-country comparisons of barriers, drivers, and best practices, especially for economic
aspects. Furthermore, online data tools, which provide data on the nZEB market, have been developed.
Relevant as starting point for CRAVEzero is the conclusion reached by ZEBRA2020 stating that “a quanti-
tative comparison of national nZEB definitions is complex due to different system boundaries, calculation
methodologies, applied factors, etc. However, the analysis indicates that a significant share of nZEB defini-
tions does not meet the intent of the EU directive on energy efficient buildings (EPBD). Thus, a recast EPBD
should require clear definitions of terms and thresholds, and gaps should be closed”. Within this report, we
tried to overcome the limits of this analysis, by comparing the required nZEB performances adopting a ref-
erence building and a unique calculation approach.
ASIEPI - Assessment and improvement of the EPBD Impact (for new buildings and building renovation):
the objective was to support the Member States and the European Commission on the issues related to the
implementation of the EPBD. The project carried out an instrument to compare the energy performance
requirements in the Member States and proposed solutions for improving the national approaches to the
implementation of EPBD. The comparison method is divided into five steps:
① Description of the cases: definition of the geometrical parameters of several case studies, together
with the technical systems.
15② National calculation of average insulation levels: for each country the average insulation level needed
to fulfill the EP requirement is calculated.
③ Uniform calculated energy use: total primary energy for each case study is calculated. Results are
compared, taking into account outcomes of point 2 and specific climate.
④ Climate severity index: a correction based on climate is needed to directly compare primary energy,
therefore a climate severity index is introduced.
Qualitative evaluation: since this method presents several difficulties in the comparison, a qualitative evalua-
tion was carried out.
ENTRANZE - Policies to enforce the transition to nearly zero-energy buildings in the EU-27: the project
aims to support the development of those policy measures, which promote penetration of nZEB technolo-
gies. The project wanted to connect experts from European universities and research institutes with public
decision-makers and stakeholders from the building sector, to promote a shared political action plan, with a
focus on the refurbishment of existing buildings. Major outputs of the projects, also interesting for
CRAVEzero framework, are:
• There is a massive lack of data regarding renovation activities and the energy performance of buildings.
There is a need for a building data observatory, in particular for monitoring policy impacts.
• The EPBD (recast) was a first attempt to create a comparable framework for European countries.
However, further enhancement of the legislation is necessary. Especially pointing out that cost-opti-
mality has to represent the absolute minimum requirements for existing regulations in the building
codes.
• The EPBD should also gradually increase the binding character of nZEB requirements for existing
buildings. Thus, a precise definition of nZEB or deep renovation is also required.
EPBD Concerted Action (CA) – This project is a joint initiative between the Member States and the Euro-
pean Commission. Representatives of MSs plus Norway, who are in charge of preparing the technical, legal
and administrative framework for the EPBD, take part in the project. The aim is to better share the infor-
mation and progress about the adoption of the European directive.
IEA SHC TASK 40 – The activities of Task 40 had the aim of studying zero or near net energy buildings,
aiming to develop a common understanding of a harmonized definitions framework, tools for the study of
NZEBs (Net Zero Energy Building), innovative solutions and guidelines for industries. To accomplish this
goal several case studies of both residential and non-residential buildings (new and existing) were documented
and analyzed.
2.2. EU CONSTRUCTION MARKET
General overview
The building sector in Europe is responsible for ap- Energy Efficiency Directive and the Renewable En-
proximately 40% of the total energy consumption. ergy Directive, established a set of measures with the
The percentage accounted for residential buildings aim to provide in Europe the conditions for signifi-
amounts at 27% of the total. Hence, this sector has cant and long-term improvements in the energy per-
a key role in the path towards the enhancement of formance of the construction market.
energy efficiency and reduction of greenhouse emis- In this section, an overview on construction market
sions at EU level. The EPBD, together with the in Europe is provided, to better understand the
16current situation and trying to identify where the bar- Figure 6 presents the share of residential buildings in
riers on nZEB implementation identified by ZEBRA European countries. This reaches 89% in Italy, while
2020 have a higher impact. in Austria accounts 61.6%.
Share of residential in total building floor area (2013)
Slovakia
Netherlands
Austria
Lithuania
Czech Republic
Luxembourg
Sweden
Poland
Belgium
Finland
Germany
Ireland
Bulgaria
Denmark
Hungary
Latvia
Estonia
EU28
United Kingdom
France
Croatia
Portugal
Slovenia
Spain
Romania
Greece
Malta
Cyprus
Italy
0% 10% 20% 30% 40% 50% 60% 70% 80% 90% 100%
Figure 6: Share of residential in total building floor area across Europe (EU Buildings Observatory, 2013).
On average, the volume of housing development across Europe amounts 2.8 completed apartments per 1000
citizens (Figure 7). The number of households, at European level, is expected to increase by more than 15%
by 2050 compared to the number measured in 2013.
178
7
6
5
4
3
2
1
0
PT ES HT SI UK CZ EU28 IE NL DE PL BE FR
Figure 7: Number of completed dwellings per 1000 citizens (Deloitte, 2017).
Starting from 2021 (2019 for public buildings) all minimum requirements of the building code, to
new buildings must be nZEB. Meanwhile, the pro- green, where buildings with higher performance than
ject ZEBRA2020 carried out a picture of the new nZEB definition are accounted. In this analysis, the
buildings in 2014. In Figure 8 and Figure 9, the dis- level of ambition of the national target is not consid-
tribution of respectively new residential and non-res- ered and so not directly comparable (e.g. in France,
idential buildings is displayed according to the per- all the new buildings should reach the target nZEB,
formance target. The scale starts from red, which in- set at 65 kWh/m2 of primary energy, thus there are
dicates the share of new buildings fulfilling the no new constructions built below this limit).
Figure 8: Distribution of new residential buildings according to the nZEB radar graph in 2014 (EU IEE ZEBRA2020 Data Tool).
18Figure 9: Distribution of new non-residential buildings according to the nZEB radar graph in 2014 (EU IEE ZEBRA2020 Data Tool).
Technologies
A cost-effective design and operation of technical pump and the district heating occupy the first two
systems play an important role in the final energy positions of the most common heating technologies,
consumption of a building. As reported in Atanasiu whereas the heat pump has a lower penetration in
et al. (2011), itis evident that technologies based on comparison with mild climates (Paoletti et al., 2017).
fossil fuel are not consistent with nZEB concept Other technological aspects whose improvement is
promoted by EPBD. Electric heat pump seems to be necessary to push forward the market uptake of
the most suitable technology, due to the expected in- nZEB are efficient thermal insulation materials and
crease of the renewable energy share in the national windows, HVAC technologies. However, an analysis
electricity mix and renewable on-site production. In of BPIE showed how the actual markets related to
addition to heat pumps also biomass micro-CHPs these technologies must grow consistently to cover
and district heating systems (with a renewable energy the future demand due to nZEBs. Table 2 shows that
share of 50% at least) will be important in the future ventilation systems with heat recovery and triple
development of the nZEB market. Figure 10 shows glazed windows currently have a market about ten
the share of the most used heating systems, accord- times smaller than the required one. The market of
ing to the climatic zone. In cold climate a sample of insulation materials, heat pumps, pellet boilers and
234 buildings has been collected, in mild climate 160 solar thermal systems has to growth 2-3 times.
and in warm climate 17. In cold climates the heat
Warm climate
Mild climate
Cold climate
0% 10% 20% 30% 40% 50% 60% 70% 80% 90% 100%
Heat pump Boiler District heating Stove Other Unknown
Figure 10: Share of heating systems according to climatic zones (Paoletti et al., 2017).
19MARKETS REQUIRED GROWTH CURRENT UNIT
FACTOR MARKET SIZE
Insulation materials 2-3 2010 Mio €
Ventilation with HR 8-10 130.000 Units
Triple glazed windows >10 1.500.000 m2
Heat pumps 2-3 185.000 Units
Pellet boilers 2-3 43.000 Units
Solar thermal systems 2-3 3.700.000 m2
Table 2: Overview of the factors actual markets should grow by to satisfy future demand (BPIE, 2011).
Data on average U-value of building envelope across Europe, as well as on the share of buildings with pho-
tovoltaic and solar thermal systems installed, are displayed in Figure 11 - 10 - 11.
Average U-value of the envelope in residential buildings [W/(m2K)]
3,5
3
2,5
2
1,5
1
0,5
0
Croatia
Bulgaria
Denmark
Cyprus
Portugal
Netherlands
Ireland
Poland
Finland
Spain
Belgium
United Kingdom
Sweden
Malta
Italy
Greece
Slovakia
France
Romania
Hungary
Czech Republic
Austria
Slovenia
Germany
Lithuania
Estonia
Luxembourg
EU28
Figure 11: Average U-value of the envelope in residential buildings [W/(m2K)] (EU Buildings Observatory, 2014).
Photovoltaic system installed (Residential)
60%
50%
40%
30%
20%
10%
0%
Figure 12: Share of buildings with photovoltaic systems across Europe (EU IEE ZEBRA2020 Data Tool).
20Solar Thermal system installed (Residential)
70%
60%
50%
40%
30%
20%
10%
0%
Figure 13: Share of buildings with solar thermal systems across Europe (EU IEE ZEBRA2020 Data Tool).
Finally, extra costs for nZEB construction are displayed in Figure 14. The objective of CRAVEzero project
is to identify and to propose solutions to reduce these extra costs associated with the nZEB construction.
Extra costs for nZEB construction
Average cost of new constructions Extra costs for nZEB construction
100%
80%
60%
40%
20%
0%
RO AT BE CZ DK FR DE IT LT NO PL SK ES SE
Figure 14: Extra costs for nZEBs construction versus average cost of new constructions (Pascual et al., 2016).
3. FOCUS AT NATIONAL LEVEL
The EPBD recognizes that each MS has its specific level is needed. Due to the easy access to information
conditions regarding construction market, climate, and the possibility to receive direct feedback, we
and energy mix. Therefore, the Directive did not have selected the countries of the consortium
provide minimum or maximum harmonized require- CRAVEzero: Austria, Germany, France, Italy, and
ments for nZEBs, but required only the implemen- Sweden.
tation of very high energy performance, where the
energy demand has to be covered to a very signifi- The focus is on the nZEB definitions of each coun-
cant extent by energy from renewable sources. This, try and the corresponding regulatory policies. We
together with the absence of a common calculation gave particular regard to minimum and maximum re-
methodology for energy performance, causes that quirements, boundary conditions and renewable en-
the approaches of MSs are not readily comparable. ergy share. These indicators will permit, in chapter 4,
To carry out a comparative analysis among countries, to establish a comparison among countries that
an analysis of regulatory framework at the national
21present significant differences in building stock ty-
pology, climate conditions, energy mix, etc.
COUNTRY REGULATION YEAR REQUIREMENTS
PE Envelope Renewable
energy
Austria OIB-“Nationaler Plan”, OIB-RL 6 2015 x x x
EnEV 2014 x
Germany EEWärmeG 2011 x
KfW 2015 x x
Réglementation Thermique (RT2012) 2012 x x
France
RT des bâtiments existants 2017 x x
Decreto ministeriale 26 giugno 2015 2015 x
Italy
Decreto legislativo 28/2011 2011 x
Sweden BBR25 2017 x
Table 3: Overview of the issued regulations for CRAVEzero countries.
In Table 3 national regulations of CRAVEzero buildings. In the same way, no one considers the bal-
members that are currently in force are displayed, to- ance at the building site level, but the physical
gether with the indication of which type or require- boundaries are set on the building unit/single build-
ment is set: specific primary energy (PE), transmit- ing. More differences can be found in the balance
tance values for envelope elements and requirements typology (which is related to how renewable energy
on renewable energy share. is calculated in the energy balance), Austria and Ger-
Each regulation has a different nZEB definition and many consider energy demand and energy genera-
thus different system boundaries, as pointed out in tion; Italy considers energy import and energy ex-
paragraph 2.1.2. However, the CRAVEzero coun- port. Finally, all regulations take into account both
tries show many approach similarities. on-site and off-site generation.
All take into account in their regulation both new
and renovated buildings, as well as private and public
COUNTRY BUILDING BUILDING ENERGY PHYSICAL GENERATION
TYPOLOGY CLASSIFICATION BALANCE BOUNDARY
demand/ on-site/
Austria new/retrofit private and public single building
generation off-site
demand/ on-site/
Germany new/retrofit private and public single building
generation off-site
France new/retrofit private and public / single building /
on-site/
Italy new/retrofit private and public import/export single building
off-site
on-site/
Sweden new/retrofit private and public / single building
off-site
Table 4: Main characteristics of the national regulations.
3.1. AUSTRIA
22DEFINITION AND REGULATORY POLICY
The Austrian Institute of construction engineering regulation of energy savings for both residential and
carried out the “National Plan”. This contains mini- non-residential buildings are contained. This guide-
mum energy performance requirements for build- line deals with heating and cooling demand and final
ings, by EPBD. In 2015 the new OIB Guideline 6 energy demand related to space heating and DHW
(OIB-RL 6) “Energy saving and heat protection” of new buildings or those, which are under a deep
was published, where the definition of nZEB and the renovation process.
EP AND ENVELOPE FEATURES
The document “national plan” includes minimum standards for four energy indicators, which are used to
define nZEBs: space heating demand, primary energy demand, CO2 emissions and total energy efficiency
factors. The provided requirements are tightened stepwise towards 2020 (in 2014, 2016, 2018, and 2020).
Furthermore, the guideline provides as a second, additional requirement on U-values for all buildings, which
need an energy performance certificate (Table 6). The requirements are related to the Austrian reference
climate (3400 HDD).
REQUIREMENTS FOR 2020 HEATING PEMAX CO2
DEMAND [KWH/(M2A)] [KG/(M2A)]
New residential buildings 10*(1+3.0/lc) 160 24
[kWh/(m2a)]
New non-residential buildings 3.33*(1+3.0/lc) 170 27
[kWh/(m3a)]
Existing residential buildings 17*(1+2.5/lc) 200 32
[kWh/(m2a)]
Existing non-residential buildings 5.67*(1+2.5/lc) 250 39
[kWh/(m3a)]
Table 5: Requirements for residential and non-residential buildings, as well as for new and existing buildings.
U-VALUES [W/(M2K)]
Wall 0.35
Roof 0.20
Floor 0.40
Window 1.4
Table 6: Additional requirements on U-values.
Specific limits of energy demand are set. Thus the performance of the building is evaluated regarding
building envelope should ensure minimum perfor- the requirements shown in Table 5, and the contri-
mance levels (calculated without the heat recovery of bution of energy from renewable sources is partly in-
the mechanical ventilation system). The overall cluded in the energy balance.
RENEWABLE ENERGY SOURCES
The OIB guideline 6 includes requirements for renewable energy share, for both new construction and major
renovation of a building. Requirements are fulfilled in at least one of the following cases:
23You can also read