Sustainable Electricity and Water for Europe, Middle East and North Africa - DLR
←
→
Page content transcription
If your browser does not render page correctly, please read the page content below
Sustainable Electricity and Water for EUMENA

                   Sustainable Electricity and Water
               for Europe, Middle East and North Africa

                            Franz Trieb, Hans Müller-Steinhagen

                 Franz.Trieb@dlr.de, Phone: +49 711 6862 423, Fax: +49 711 6862 783
           Hans.Mueller-Steinhagen@dlr.de, Phone: +49 711 6862 358, Fax: +49 711 6862 712
                   German Aerospace Center, Institute of Technical Thermodynamics,
                        Pfaffenwaldring 38-40, D-70569 Stuttgart, Germany

Abstract
This paper describes the perspective of a sustainable supply of electricity for Europe (EU), the
Middle East (ME) and North Africa (NA) up to the year 2050. It shows that a transition to
competitive, secure and compatible supply is possible using renewable energy sources and
efficiency gains, and fossil fuels as backup for balancing power. A close cooperation between
EU and MENA for market introduction of renewable energy and interconnection of electricity
grids by high-voltage direct-current transmission are keys for economic and physical survival
of the whole region. However, the necessary measures will take at least two decades to be-
come effective. Therefore, adequate policy and economic frameworks for their realization
must be introduced immediately. The role of sustainable energy to secure freshwater supplies
based on seawater desalination is also addressed.
Keywords: concentrating solar power, renewable energy, solar electricity, long term scenario,
Europe, Middle East, North Africa

Introduction
In order to find a viable transition to an electricity supply that is inexpensive, compatible with
the environment and based on secure resources, rigorous criteria must be applied to ensure
that the results are compatible with a comprehensive definition of sustainability (Table 1). A
central criterion for power generation is its availability at any moment on demand. Today, this
is achieved by consuming stored fossil or nuclear energy sources that can provide electricity
whenever and wherever required. This is the easiest way to provide power on demand. How-
ever, consuming the stored energy reserves of the globe has a high price: they are quickly
depleted and their residues contaminate the planet.
With the exception of hydropower, natural flows of energy are not widely used for power
generation today, because they are not as easily stored and exploited as fossil or nuclear fuels.
Some of them can be stored with a reasonable technical effort for a limited time-span, but
others must be taken as provided by nature (Table 1). The challenge of future electricity sup-
ply is to find a mix of available technologies and resources that is capable of satisfying not
only the criterion of “power on demand”, but all the other criteria for sustainability, too.
The paper describes a scenario of electricity demand and supply opportunities by renewable
energy in the integrated EUMENA region up to the middle of the century, and confirms the
importance of international cooperation to achieve economic and environmental sustainability
(MED-CSP 2005, TRANS-CSP 2006).
DESERTEC, Whitebook of TREC and Club of Rome                                                 1
Sustainable Electricity and Water for EUMENA
Criteria for Energy Sustainability:
Technology Portfolio:
9 Inexpensive
low electricity cost 9 Coal, Lignite ideally stored
no long term subsidies 9 Oil, Gas energy
9 Secure 9 Nuclear Fission, Fusion
diversified and redundant supply 9 Concentrating Solar Power (CSP)
power on demand 9 Geothermal Power (Hot Dry Rock) storable energy
based on undepletable resources
9 Biomass
available or at least visible technology
9 Hydropower
9 Compatible 9 Wind Power fluctuating
low pollution 9 Photovoltaic energy
climate protection
low risks for health and environment 9 Wave / Tidal
fair access
Table 1: Criteria for sustainability and portfolio of technologies and resources for power generation
Pressure on Electricity and Water is Increasing
As a first step, our analysis quantifies electricity demand in Europe and MENA up to the
middle of the century. Growing freshwater deficits in MENA are also part of the energy prob-
lem, as there will be an increasing demand for seawater desalination. For simplicity we as-
sume that in the long term, the necessary energy for desalination will also be supplied by elec-
tricity.
Population growth is a major driving force for electricity and water consumption. According
to the World Population Prospect of the United Nations the population of the European region
will stabilize at around 600 million while MENA will grow from 300 million in the year 2000
to a similar 600 million by the middle of the century (UN 2004).
The second driving force is economic growth, which usually has two opposite effects on en-
ergy and water demand: on the one hand, the demand increases because new services are re-
quested within a developing economy. On the other hand, efficiency of production, distribu-
tion and end-use is enhanced, thus allowing the provision of more services for a given amount
of energy. In past decades, all industrial nations observed a typical decoupling of economic
growth and energy demand. In order to be able to afford efficiency measures, a certain eco-
nomic level beyond sheer subsistence must have been attained, something that is now true of
most countries in EUMENA. The demand study is described elsewhere (Trieb, Klann 2006).
Our analysis shows that by 2050 electricity consumption in the Middle East and North Africa
is likely to be around 3000 TWh/year (Figure 1), which is comparable with what is consumed
in Europe today. Meanwhile, European consumption is likely to increase to and stabilize at a
value of about 4000 TWh/year (Figure 2). Due to increased efficiency gains, our model yields
lower levels of predicted demand than most other scenarios (IEA 2005, IEA 2006, CEC 2006,
Mantzos and Capros 2005). However, there are also scenarios indicating lower demand (Be-
noit and Comeau 2005, Teske et al., 2007). The reduction of demand in Europe after 2040 (as
shown in Figure 2) is however uncertain. Stagnant or slowly growing demand is also a possi-
bility, since efficiency gains may be transformed into new energy services not considered
here, such as, for example, electric vehicles or hydrogen for the transport sector.
A similar analysis has been done for the water sector in MENA. The difference between the
available sources of fresh water that are renewable and growing demands for water leads to
the water deficit displayed in Figure 3. There is already a significant deficit today, which is
DESERTEC, Whitebook of TREC and Club of Rome 2Sustainable Electricity and Water for EUMENA
poorly met by sea-water desalination via fossil fuels and mainly by the over-exploitation of
groundwater resources, leading in many regions in MENA to falling levels of groundwater,
intrusion of salt water into groundwater reservoirs and to a fast expansion of deserts.
3500 Diff.to Trend
Morocco
Gross Electricity Consumption [TWh/y]
Algeria
3000
Tunisia
Libya
2500 Egypt
Yemen
2000 UAE
Saudi Arabia
1500 Qatar
Kuwait
Bahrain
1000
Oman
Syria
500 Lebanon
Jordan
0 Israel
1980 1990 2000 2010 2020 2030 2040 2050 Iraq
Year Iran
Figure 1: Electricity demand scenario for the MENA countries considered in the study (MED-CSP 2005)
Difference to Trend
6000 Norway
Sweden
Finland
Gross Electricity Consumption [TWh/y]
Iceland
5000 Denmark
United Kingdom
Ireland
Germany
Switzerland
4000
France
Netherlands
Luxembourg
Belgium
3000 Austria
Portugal
Spain
Italy
2000 Greece
Bosnia-Herzegovina
Serbia & Montenegro
Croatia
1000 Macedonia
Slovenia
Turkey
Romania
0 Hungary
Bulgaria
1980 1990 2000 2010 2020 2030 2040 2050 Slovak Republic
Czech Republic
Year Poland
Figure 2: Electricity demand for the European countries considered in the study (TRANS-CSP 2006)
DESERTEC, Whitebook of TREC and Club of Rome 3Sustainable Electricity and Water for EUMENA
According to our projection, this deficit tends to increase from the current 60 billion m³ per
year, which is almost the annual flow of the Nile River, to 150 billion m³ in the year 2050.
Egypt, Saudi Arabia, Yemen, and Syria are the countries with the largest deficits. Enhance-
ment of efficiency of water distribution, water (re-)use and water management to achieve
best-practice standards is already included in the underlying assumptions of this scenario. It is
obvious that the MENA countries will be confronted with a very serious problem in the not
too distant future, if those measures and the necessary additional measures are not initiated in
good time. Seawater desalination is one of those additional options. Assuming that, on aver-
age, 3.5 kWh of electricity is needed to desalinate one cubic meter of seawater, this would
mean an additional demand for almost 550 TWh/y by 2050 for desalination. This would be
equivalent to the current electricity demand of a country like Germany (MED-CSP 2005).
160 560 Bahrain
Yemen
140 490 UAE
Freshwater Deficit [billion m³/y]
Equivalent Electricity Demand
Saudi Arabia
120 420 Qatar
Kuwait
100 350 Oman
[TWh/y]
Iran
80 280 Iraq
Syria
60 210 Lebanon
Jordan
40 140 Israel
Palestine
20 70 Egypt
Libya
0 0 Tunisia
2000 2010 2020 2030 2040 2050 Algeria
Morocco
Year Reihe14
Figure 3: Freshwater deficit defined as the difference between water demand and renewable freshwater
resources for each of the MENA countries, and equivalent electricity demand for seawater desalination
(Trieb and Müller-Steinhagen 2007).
Available Resources and Technology Options
In the financial and insurance business there is a clear answer to the question of security and
risk management: the diversification of the assets portfolio (Awerbuch and Berger 2003). This
simple truth has been completely ignored in the energy sector. Here, investment decisions
were based on “least cost and proven technology” and the portfolio was usually limited to
fossil fuel, hydropower and nuclear plants. This short-sighted policy has been harmful both
for consumers and for the environment: prices of all kinds of fossil fuels and of uranium have
multiplied several times since the year 2000 and the burning of these fuels is seriously con-
taminating the global atmosphere. Today, consumers and taxpayers have no choice but to pay
the higher cost of fossil fuels, as the energy policies of the past failed to build up alternatives
in good time and to establish them as part of the energy market. To add insult to injury, fossil
and nuclear energy technologies still receive 75 % of current energy subsidies (EEA 2004), a
number that increases to over 90 % if the failure to include external costs is also considered.
DESERTEC, Whitebook of TREC and Club of Rome 4Sustainable Electricity and Water for EUMENA
Nevertheless, an impressive portfolio of renewable energy technologies is available today
(Dürrschmidt et al. 2006). Some of these produce fluctuating output, like wind and photo-
voltaic power (PV), but some of them (such as biomass, hydropower and concentrating solar
thermal power (CSP)) can meet both peak- and base-load demands for electricity (Table 2).
The long-term economic potential of renewable energy in EUMENA is much larger than pre-
sent demand, and the potential of solar energy dwarfs them all. From each km² of desert land,
up to 250 GWh of electricity can be harvested each year using the technology of concentrat-
ing solar thermal power. This is 250 times more than can be produced per square kilometre by
biomass or 5 times more than can be generated by the best available wind and hydropower
sites. Each year, each square kilometre of land in MENA receives an amount of solar energy
that is equivalent to 1.5 million barrels of crude oil1. A concentrating solar collector field with
the size of Lake Nasser in Egypt (Aswan) could harvest energy equivalent to the present Mid-
dle East oil production2.
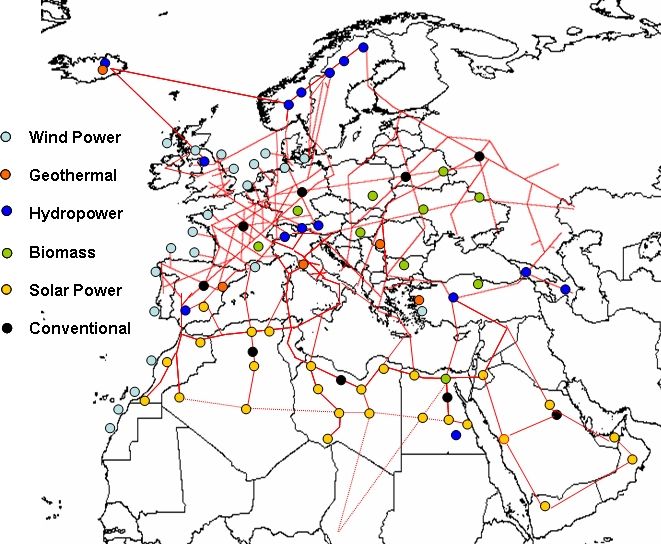
In addition, there are other large sources of renewable energy in EUMENA: there is potential
of almost 2000 TWh of wind power and 4000 TWh/y of power from geothermal, hydro and
biomass sources including agricultural and municipal waste. Also PV, wave and tidal power
have considerable potentials in the region. By contrast with fossil and nuclear fuels, renew-
able energy sources in the region are over-abundant. However, each renewable energy re-
source has a specific geographic distribution (Figure 4). Each country will therefore have its
specific mix of resources, with hydropower, biomass and wind energy being the preferred
sources in the North, and solar and wind energy being the most powerful sources in the South
of EUMENA.
Biomass (0-1) Geothermal (0-1) Solar (10-250)
Max
Min
Electricity Yield
Wind Energy (5-50) Hydropower (0-50) in GWh/km²
Figure 4: Renewable energy resource maps for EUMENA, showing the minimum and maximum annual
electricity yield (as specified in brackets) that can be harvested by each technology from 1 km² of land
area. Solar includes both photovoltaic and concentrating solar thermal power technologies. The overall
potential and the different characteristics of each resource are given in Table 2 (MED-CSP 2005).
1
reference solar irradiance 2400 kWh/m²/year, 1600 kWh heating value per barrel
2
Lake Nasser has a surface of 6000 km², Middle East oil production is currently 9·109 barrels/year
DESERTEC, Whitebook of TREC and Club of Rome 5Sustainable Electricity and Water for EUMENA
Unit Capacity Capacity Capacity Potential*** Type of Resource Applications Comment
Credit * Factor ** (TWh/y)
Wind Power 1 kW – 5 MW 0 – 30 % 15 – 50 % 1950 kinetic energy of the electricity fluctuating, supply de-
wind fined by resource
Photovoltaic 1 W – 5 MW 0% 5 – 25 % 325 direct and diffuse ir- electricity fluctuating, supply de-
radiance on a surface fined by resource
tilted with latitude
Biomass 1 kW – 25 MW 50 - 90 % 40 – 90 % 1350 municipal and agricul- electricity and seasonal fluctuations but
tural organic waste and heat good storability, power
wood on demand
Geothermal 25 – 50 MW 90 % 40 – 90 % 1100 heat from hot dry electricity and no fluctuations, power on
(Hot Dry Rock) rocks of several 1000 heat demand
meters depth
Hydropower 1 kW – 1000 50 - 90 % 10 – 90 % 1350 kinetic and potential electricity seasonal fluctuation,
MW energy from water good storability in dams,
flows also used as pump stor-
age for other sources
Solar Updraft 100 – 200 MW 10 to 70 % 20 to 70 % part of CSP direct and diffuse ir- electricity seasonal fluctuations,
Tower depending on potential radiance on a horizon- good storability, base-
storage tal surface load power
Concentrating 10 kW – 200 0 to 90 % 20 to 90 % 630,000 direct irradiance on a electricity and fluctuations are compen-
Solar Thermal MW depending on surface tracking the heat sated by thermal storage
Power (CSP) storage and sun and (bio)fuel, power on
hybridisation demand
Gas Turbine 0.5 – 100 MW 90 % 10 – 90 % n. a. natural gas, fuel oil electricity and power on demand
heat
Steam Cycle 5 – 500 MW 90 % 40 – 90 % n. a. coal, lignite, fuel oil, electricity and power on demand
natural gas heat
Nuclear > 500 MW 90 % 90 % n. a. uranium electricity and base-load power
heat
Table 2: Some characteristics of contemporary power technologies. * Contribution to firm power and reserve capacity. ** Average annual utilisation. *** Technical
electricity potential in EUMENA that can be exploited in the long-term at competitive cost considering each technology’s learning curve. In the case of PV only the
demand-side potential used until 2050 was assessed; the technical potential is comparable to that of CSP.
DESERTEC, Whitebook of TREC and Club of Rome 6EU-MENA Cooperation for Sustainable Electricity and Water Fossil energy sources like coal, oil and gas can be a useful complement to the renewable en- ergy mix, being stored forms of energy that can easily be used for balancing power and for grid stabilization. If their consumption is reduced to the point where they are used exclusively for this purpose, their cost escalation will be reduced and cause only a minor burden to eco- nomic development and their environmental impact will be minimized. Moreover, their avail- ability will be extended for decades or even centuries. By contrast, nuclear fission plants are not easily combined with renewables because their out- put cannot, economically, be varied to meet fluctuating demands. Moreover, decommission- ing costs of nuclear plants exceed their initial investment (NDA 2002) and, half a century after market introduction, there are still unsolved problems like plutonium proliferation and nuclear waste disposal. The other nuclear option, fusion, is not expected to be commercially available before 2050 and is therefore not relevant for our proposals (HGF 2001). Several renewable power technologies can also provide base-load and balancing power. These include: geothermal (hot dry rock) systems that are today in a phase of research and develop- ment; hydropower plants with large storage dams in Norway, Iceland and the Alps; most biomass plants; and concentrating solar thermal power plants (CSP) in MENA. CSP plants use the high annual solar irradiance of that region, the possibility of solar thermal energy stor- age for overnight operation and the option of backup firing with fossil fuels or biomass. CSP in Europe is subject to significant seasonal fluctuations. Constant output for base-load power can only be provided with a considerable fossil fuel share. Due to the higher solar irradiance in MENA, the cost of concentrating solar power there is usually lower and its availability is better than in Europe. Therefore, there will be a significant market for solar electricity imports to complement the European sources and provide firm renewable power capacity at competi- tive cost. Concentrating Solar Power as Key Element of the Energy Mix Steam turbines and gas turbines powered by coal, uranium, oil and natural gas are today’s guarantors of electrical grid stability, providing both base-load and balancing power. How- ever, turbines can also be powered by high temperature heat from concentrating solar collec- tor fields (Figure 5). Power plants of this type with 30 - 80 MW unit capacity are operating successfully in California since 20 years, and new plants are currently erected in the U.S. and Spain. The concentrating solar collectors are efficient fuel savers, today producing heat at a cost equivalent to 50 $/barrel of fuel oil, with the perspective to achieve a level below 25 $/barrel within a decade (MED-CSP 2005, Pitz-Paal et al. 2005). Just like conventional power stations, concentrating solar power plants can deliver base-load or balancing power, directly using sunshine during the day, making use of thermal energy storage facilities during the night and in case there is a longer period without sunshine, using fossil or biomass fuel as backup heat source. Just like fossil fuel fired conventional power stations, CSP plants have an availability that is close to 100 %, but with significantly lower fuel consumption. A CSP plant with a thermal energy storage facility for additional 8 hours of full load operation is currently build in the Spanish Sierra Nevada near Guadix, allowing solar electricity generation also during night-time. This plant with a capacity of 50 MW will have a minimum annual solar share of 85 %. Another feature that distinguishes CSP is the possibility of combined generation of electricity and heat to achieve the highest possible efficiencies for energy conversion. In addition to elec- tricity, such plants can provide steam for absorption chillers, industrial process heat or ther- DESERTEC, Whitebook of TREC and Club of Rome 7
EU-MENA Cooperation for Sustainable Electricity and Water

mal seawater desalination. A design study for such a plant was finished late 2006, the plant is
scheduled to be commissioned for early 2009 (Figure 5, left). It will provide 10 MW of
power, 40 MW of district cooling and 10,000 cubic metres per day of desalted water for a
large hotel resort in Aqaba, Jordan (Trieb et al. 2007).

  Solar Field        Storage

   heat                  fuel

           Power
           Plant
 heat       heat

   MED          AC

   Water Cooling Power

Figure 5: Left: Configuration of a concentrating solar power station for combined generation of electricity
and heat for absorption cooling (AC) and multi-effect seawater desalination (MED). Right: Line-
concentrating solar thermal collector technologies.

Sustainable Energy and Water for EUMENA
Following the criteria for sustainability in Table 1 and additional technical, social and eco-
nomic frame conditions described in other reports (MED-CSP 2005, TRANS-CSP 2006), we
have developed a scenario for electricity generation for 50 countries in EUMENA up to the
year 2050. Except for wind power that is already booming today, and hydropower that has
been established since decades, renewable energy will hardly become visible in the electricity
mix before 2020 (Figure 6 and Figure 7). At the same time, phasing out of nuclear power in
many European countries and the stagnating use of coal and lignite due to climate protection
will generate increasing pressure on natural gas resources, increasing their consumption as
well as their installed capacity for power generation. Until 2020, renewables like wind and PV
power will mainly have the effect of reducing fuel consumption, but will do little to replace
existing capacities of balancing power. Owing to growing demands and the replacement of
nuclear power, consumption of fossil fuels cannot be reduced before 2020. Fuel oil for elec-
tricity will largely disappear by 2030 and nuclear power will follow after 2040. The consump-
tion of gas and coal will increase until 2030 and thereafter be reduced to a compatible and
affordable level by 2050. In the long term, new services such as electric vehicles may increase
the electricity demand further and thus require a higher exploitation of renewables.
The electricity mix in the year 2000 depends mainly on five resources, most of them limited,
while the mix in 2050 will be based on ten energy sources, most of them renewable. Thus, our
scenario responds positively to the European Strategy for Sustainable, Competitive and Se-
cure Energy declared by the European Commission in the corresponding Green Paper and
Background Document, aiming at higher diversification and security of the European energy
supply (Commission of the European Communities 2006).

DESERTEC, Whitebook of TREC and Club of Rome                                                             8
EU-MENA Cooperation for Sustainable Electricity and Water
4500
4000
Desalination
3500 Export Solar
Electricity [TWh/y]
Photovoltaics
3000 Wind
Geothermal
2500
Hydropower
2000 Biomass
Wave / Tidal
1500 CSP Plants
Oil / Gas
1000 Coal
Nuclear
500
0
2000 2010 2020 2030 2040 2050
Year
Figure 6: Electricity generated for regional demand according to Figure 1 and in addition for seawater
desalination and for export to Europe using the different forms of primary energy available in MENA
4500
4000 Import Solar
Photovoltaics
3500 Wind
Electricity [TWh/y]
3000 Geothermal
Hydropower
2500 Biomass
Wave / Tidal
2000
CSP Plants
1500 Oil
Gas
1000
Coal
500 Nuclear
0
2000 2010 2020 2030 2040 2050
Year
Figure 7: Electricity generated from the different forms of primary energy in Europe including the import
of solar electricity from MENA
A prerequisite of the electricity mix is to provide firm capacity with a reserve of about 25 %
in addition to the expected peaking load (Figure 8). Before significant CSP transmission starts
in the year 2020, this can only be provided by extending the capacity and fuel consumption of
gas fired peaking plants based on natural gas and later eventually on coal gasification. In
Europe, the consumption of natural gas doubles with respect to the starting year 2000; but it is
then brought back to the initial level, after the introduction in 2020 of increasing shares of
CSP transmission from MENA as well as geothermal and hydropower from Scandinavia, via
High-Voltage Direct-Current (HVDC) interconnections. European renewable energy sources
DESERTEC, Whitebook of TREC and Club of Rome 9EU-MENA Cooperation for Sustainable Electricity and Water
that could provide firm capacity are rather limited from the point of view of their potential.
Therefore, CSP transmission from MENA to Europe will be essential to reduce both the in-
stalled capacity and the fuel consumption of gas fired peaking plants and to provide firm re-
newable power capacity. In MENA, concentrating solar power is the only source that can
really cope with rapidly growing electricity consumption, providing both base-load- and bal-
ancing power. By 2050, fossil energy sources will be used solely for backup purposes. This
will reduce their consumption to a sustainable level and bring down the otherwise rapidly
escalating cost of power generation. Fossil fuels will be used to guarantee firm balancing
power capacity, while renewables will serve to reduce their consumption for everyday use and
base-load supply.
Installed Capacity vs. Peak Load in EUMENA
2400 2400 Photovoltaic
Wind Power
2000 2000 Geothermal
Installed Capacity [GW]
Hydropower
1600 1600 Biomass
Tidal/Wave
1200 1200
CSP
Oil & Gas
800 800
Coal
400 400 Nuclear
Firm Capacity
0 0 Peak Load
2000 2010 2020 2030 2040 2050
Year
Figure 8: Scenario of the installed power capacity in comparison to the cumulated peak load of all coun-
tries in the EUMENA region. Firm power capacity is calculated on the basis of capacity credits for each
technology according to Table 2. By the year 2050, 68 % of the installed CSP capacity is used for local
supplies, 19 % for long-distance transmission and 13 % for desalination.
An efficient backup infrastructure will be necessary to complement the renewable electricity
mix: on one hand to provide firm capacity on demand by quickly-reacting, natural-gas-fired
peaking plants, and on the other hand as an efficient grid infrastructure that allows the trans-
mission of renewable electricity from the best centres of production to the main centres of
demand. The best solution is a combination of High-Voltage Direct-Current (HVDC) trans-
mission lines and the conventional Alternating Current (AC) grid. At lower voltage levels,
decentralised structures will also gain importance, combining, for example, PV, wind and
micro-turbines operating together just like a single virtual power plant. Such a grid infrastruc-
ture will not be motivated by the use of renewables alone. In fact, its construction will proba-
bly take place anyway, in order to stabilize the growing European grid, to provide greater se-
curity of supply, and to foster competition (Asplund 2004, Eurelectric 2003). By 2050, trans-
mission lines with a capacity of 2.5-5.0 GW each will transport about 700 TWh/y of solar
electricity from 20-40 different locations in the Middle East and North Africa to the main cen-
tres of demand in Europe (Figure 9 and Table 3). HVDC technology has been a mature tech-
nology for several decades and is becoming increasingly important for the stabilisation of
DESERTEC, Whitebook of TREC and Club of Rome 10EU-MENA Cooperation for Sustainable Electricity and Water large-scale electricity grids, especially if more fluctuating resources are incorporated. HVDC transmission over long distances contributes considerably to increase the compensational ef- fects between distant and local energy sources. And it allows failures of large power stations to be accommodated via distant backup capacity. It can be expected that a HVDC backbone will be established in the long term to support the conventional electricity grid and to increase the stability of the future power-supply system. Figure 9: Concept of a EUMENA interconnected electricity grid based on HVDC power transmission as “Electricity Highways” to complement the conventional AC electricity grid. Asplund 2004 (modified). As a spin-off effect of this development, solar electricity from MENA will become an attrac- tive means of diversifying the European power-generation portfolio. Due to the abundance and seasonal uniformity of solar energy from deserts it will be cheaper and better available than solar electricity generated in Europe. In a coming renewable energy alliance of Europe and MENA solar and wind energy, hydropower, geothermal power and biomass will be gen- erated in places where they work best and where they are most abundant. This power will be distributed all over Europe and MENA through a highly efficient HVDC grid at high-voltage levels, and delivered to consumers by the conventional interconnected AC grid at low-voltage levels. By analogy with the network of interstate highways, a future HVDC grid will have a low number of inlets to and outlets from the conventional AC system because its primary purpose will be to serve long-distance power transmission, while the AC grid will function in a manner that is analogous to the operation of country roads and city streets. About 10 % of the generated solar electricity will be lost by HVDC transmission from MENA to Europe over 3000 km distance. In 2050, twenty to forty power lines with 2500 - 5000 MW capacity each could provide about 15 % of the European electricity as clean power from deserts, motivated by a low production cost of around 5 €-cent/kWh (not accounting for further cost reduction via carbon credits) and their high flexibility for base-, intermediate- and peak-load operation. DESERTEC, Whitebook of TREC and Club of Rome 11
EU-MENA Cooperation for Sustainable Electricity and Water

Year                         2020         2030         2040         2050         Concentrating Solar Thermal Power
                                                                                 (CSP) plants use mirrors to
Transfer Capacity GW         2x5          8x5          14 x 5       20 x 5       concentrate sunlight for steam and
                                                                                 power generation. Solar heat can be
Electricity Transfer TWh/y   60           230          470          700          stored in tanks of molten salt and
                                                                                 used for nighttime operation of the
Capacity Factor              0.60         0.67         0.75         0.80         turbines, which can also be powered
Turnover Billion €/y         3.8          12.5         24           35           by oil, natural gas or biomass fuels.

Land Area          CSP       15 x 15 30 x 30 40 x 40 50 x 50                     High Voltage Direct Current (HVDC)
                             3100 x 0.1   3600 x 0.4   3600 x 0.7   3600 x 1.0   transmission lines are used in some
km x km            HVDC
                                                                                 100 projects world wide transmitting
Investment         CSP       42           143          245          350          today about 80 GW of electricity from
Billion €          HVDC      5            20           31           45           remote, mostly renewable sources
                                                                                 like large hydropower dams and
Elec. Cost         CSP       0.050        0.045        0.040        0.040        geothermal plants to large centres of
€/kWh              HVDC      0.014        0.010        0.010        0.010        demand.

Table 3: Main indicators of a EUMENA High Voltage Direct Current (HVDC) interconnection for Con-
centrating Solar Thermal Power (CSP) from 2020 – 2050 according to the TRANS-CSP scenario. In 2050,
lines with a capacity of 5 GW each will transmit about 700 TWh/y of electricity from 20-40 different loca-
tions in the Middle East and North Africa to the main centres of demand in Europe.

There is a wide-spread belief that for every wind farm or PV plant a fossil fuel fired backup
power plant must be installed. However, hourly time series modelling of the power supply
system of selected countries according to our scenario showed that even without additional
storage capacities for electricity, the existing balancing capacity is sufficient for the purpose
of covering fluctuations in demand. No extra capacity is needed as long as the fluctuating
renewable energy share is smaller than the existing peaking plant capacity, which is the case
in our scenario.
In fact, as a consequence of the increasing share of renewable electricity generation, the need
for conventional base load plants with constant output will step by step disappear (Figure 10).
Base load will be covered by plants for combined generation of heat and power (CHP) using
fossil and biomass fuels, river run-off hydropower, wind power and photovoltaics. Intermedi-
ate power capacity will be provided by better storable sources like hydropower from dams,
biomass and geothermal power. This combination of power sources will not totally cover, but
fairly approximate the daily load curve. The remaining balancing capacity will be supplied by
pump storage, hydropower dams, concentrating solar power and fossil fuel fired peaking
plants. In addition to that, enhanced demand side management will increasingly be used to
minimise the need of pump storage capacity and fossil fuel consumption for peaking power,
which both will remain in the same order of magnitude as today (Brischke 2005).
The fossil fuel fired power capacities remaining in 2050 will exclusively serve balancing du-
ties and combined generation of heat and power. This is in line with the strategy of using
those valuable, perfectly stored energy sources exclusively for what they are best suited for
and not wasting them for quotidian use. Base load plants with constant output fuelled by nu-
clear fission, fusion or lignite will not fit well into such a system, as they are not capable of
providing quickly changing output to fill the gap between the partially fluctuating supply
from cogeneration and renewables and the otherwise fluctuating demand. In fact, gas driven
plants will be the preferred choice for this purpose. In the very long-term after 2050, renew-
able sources supported by advanced storage and load management in close coordination with
other energy sectors like heating and cooling as well as transport and mobility will finally also
take over the remaining demand for balancing power and combined generation.

DESERTEC, Whitebook of TREC and Club of Rome                                                                         12
EU-MENA Cooperation for Sustainable Electricity and Water
60
50
Power Consumption [GW] 40
30
20
10
0
25.6. 26.6. 27.6. 28.6. 29.6. 30.6. 1.7.
CHP (fossil) Domestic Renewables Solar Import
Other Import & Storage Balancing Power (fossil) Renewable Surplus
Figure 10: Model of the hourly electricity balance of Germany in 2050 (Brischke 2005)
Least Cost Electricity from Renewable Sources
Installing CSP plants world wide, a reduction of the solar electricity cost due to economies of
scale can be achieved with a progress ratio of about 85-90 %3 (Pitz-Paal et al. 2005). As an
example, a CSP-plant today can produce electricity at about 0.14-0.18 €/kWh depending on
solar irradiance (Figure 11). With 5000 MW installed world-wide the cost would drop to
about 0.08-0.12 €/kWh, and to 0.04-0.06 €/kWh once a capacity of 100 GW would be in-
stalled4. A prerequisite for this cost reduction is a global CSP expansion from 415 MW today
to about 28 GW by 2020 and roughly 140 GW by 2030 including capacities for seawater de-
salination (MED-CSP 2005), (TRANS-CSP 2006), (AQUA-CSP 2007). In the long-term, a
total of 500 GW could be installed by 2050. For the calculation of this learning curve we have
assumed solar only operation, an economic lifetime of 25 years and a real project rate of re-
turn of 6.5 %/y.
All renewable energy sources show similar learning curves, becoming cheaper the more they
are exploited. While most renewable sources show capacity limits of exploitation, the solar
energy resource in MENA is about hundred times larger than demand will ever be. Further,
due to better solar radiation costs of clean power from deserts including transmission will be
lower than for solar power produced by the same type of power plants located in Europe. If
we take as example the Spanish electricity mix as described in (TRANS-CSP 2006) a scenario
based on a mix of domestic renewable energies, solar electricity from North Africa and fossil
fuels for balancing power has the medium-term perspective of stable and even slightly re-
duced electricity costs, while a business-as-usual scenario would lead to steadily escalating
costs of energy (Figure 12) as has happened since the year 2000. In the TRANS-CSP sce-
nario, the expansion of renewable energy will take place in niche markets like the Spanish
Renewable Energy Act until about 2020, temporarily leading to slightly higher electricity
3
A progress ratio of 90 % means that the specific investment is reduced by 10 % every time the total installed
capacity of the solar collectors is doubled (Neij et al. 2003, Pitz-Paal et al. 2005)
4
This cost is calculated for solar only operation and would be lower in hybrid mode, as there would be a better
amortisation of the power block investment.
DESERTEC, Whitebook of TREC and Club of Rome 13EU-MENA Cooperation for Sustainable Electricity and Water
costs than for a business-as-usual mix. During that time, the share of renewable energy will
increase while the cost of renewable energy will decrease.
Cost of Electricity [€/kWh] 1
0.1
0.01
100 1000 10000 100000 1000000
Installed Capacity [MW]
Figure 11: Expected cost of electricity from CSP in solar-only operation as function of installed capacity
according to (NEEDS 2007) for an annual irradiance (from top to bottom) of 2000, 2400 and 2800
kWh/m²/y.
Electricity Cost (Example Spain)
8.0
Electricity Cost [c/kWh]
7.5
7.0
6.5
6.0
5.5
5.0
4.5
4.0
2000 2010 2020 2030 2040 2050
Year
TRANS-CSP Mix Mix 2000 CSP Import CSP Spain
Figure 12: Costs of the Spanish electricity mix in the TRANS-CSP scenario based increasingly on renew-
able sources of energy compared of a cost development in case of maintaining the mix of the year 2000.
The cost of solar import electricity from North Africa and the cost of CSP in Spain are also shown for
comparison (TRANS-CSP 2006).
DESERTEC, Whitebook of TREC and Club of Rome 14EU-MENA Cooperation for Sustainable Electricity and Water
Once cost break-even with conventional power is achieved, renewable capacities will be ex-
tended faster, avoiding further increases in the nationwide cost of electricity. Thus, the cost of
the electricity mix can be maintained constant or in some cases even be brought back to lower
levels, by subsequently increasing the share of renewable energy sources. This concept can be
realized in all EUMENA countries.
The ongoing electricity cost escalation shows clearly that introducing CSP and other renew-
able energy sources on a large scale is the only viable solution for avoiding further long-term
cost elevation in the power sector and to return to a relatively low cost level for electricity in
the medium-term future. This is in line with the utilities’ commitment to deliver least cost
electricity to their clients. CSP from deserts is a key element of such a strategy.
An affordable and sustainable source of energy is also required for an even more vital com-
modity: freshwater from seawater desalination. CSP and other renewables can be the solution
for this, too (Bennouna and Nokraschy 2006). The AQUA-CSP study shows the potential of
CSP for seawater desalination in the MENA region and describes the technical options avail-
able, ranging from solar-powered membrane desalination to the combined generation of solar
electricity and heat for thermal multi-effect desalination (AQUA-CSP 2007). In fact, there is
no other way to avoid a serious water crisis in the MENA region, than to activate all options
for better water management, higher efficiency of water distribution and end-use, re-use of
waste-water and seawater desalination based on renewable energy sources (Figure 13).
600
Water Consumption [Bm³/y]
500
400
300
200
100
0
2000 2005 2010 2015 2020 2025 2030 2035 2040 2045 2050
Natural Water Used Wastewater reused Fossil Fuel Desalination
Groundwater Over-Use CSP Desalination Efficiency Gains
Figure 13: Water demand scenario for MENA until 2050 and coverage of demand by sustainable sources,
by unsustainable sources and by solar desalination. (shaded: efficiency gains with respect to business as
usual). Source: (AQUA-CSP 2007)
There is an Alternative to Climate Change and Nuclear Proliferation
By implementing our scenario, carbon emissions can be reduced to values that are compatible
with the goal of stabilising the CO2 content of the atmosphere at 450 parts per million that is
considered necessary by the Intergovernmental Panel on Climate Change in order to keep
global warming in a range of 1.5 to 3.9 °C (IPCC 2001). Starting with 1790 million tons of
DESERTEC, Whitebook of TREC and Club of Rome 15EU-MENA Cooperation for Sustainable Electricity and Water
carbon dioxide per year in the year 2000, emissions can be reduced to 690 Mt/y in 2050, in-
stead of growing to 3700 Mt/y in a business as usual case (Figure 14). The final per capita
emission of 0.58 tons/cap/y in the electricity sector is acceptable in terms of a maximum total
emission of 1-1.5 tons/cap/y that has been recommended by the German Scientific Council on
Global Environmental Change (Graßl 2003). Further reductions can be achieved after 2050.
Other pollutants are reduced in a similar way, without any need to expand the use of nuclear
energy and its associated risks. Carbon capture and sequestration (CCS) has been considered
in our study as a complement, but not as an alternative to renewable energy, as it will reduce
power plant efficiency and thus accelerate the consumption of fossil fuels. The fact that the
cost of carbon capturing always adds to the cost of fossil fuels will accelerate cost break-even
with renewables and increase the speed of their market introduction.
The area required for the total renewable energy infrastructure including the proposed HVDC
transmission lines for the period up to 2050 amounts to roughly 1 % of the total land area of
EUMENA. This is comparable to the land required at present for the transport and mobility
infrastructure in Europe. Using a geographic information system (GIS) three examples of
HVDC lines connecting very good sites for CSP generation in MENA with three major Euro-
pean centres of demand were analyzed on the basis of a life cycle eco-balance (May 2005).
The GIS was programmed to minimize cost, environmental impacts and visibility of the
power lines, and we found that the resulting impacts are in an acceptable range. In general, the
environmental impacts of HVDC lines are much lower than those of comparable AC over-
head lines using conventional technology. Altogether, our scenario shows a way to reduce
significantly the negative environmental impacts of power generation, and could also serve as
a model for global application. This has been recognized by a study of the U.S. Department of
Energy analysing the feasibility of this concept for the U.S. (Price 2007).
4000
Avoided
3500 Import Solar
CO2-Emissions in Mt/y
Photovoltaics
3000
Wind
2500 Geothermal
Hydropower
2000
Wave / Tidal
1500 Biomass
1000 CSP Plants
Oil / Gas
500 Coal
0 Nuclear
2000 2010 2020 2030 2040 2050
Year
Figure 14: CO2-emissions from electricity generation in million tons per year for all EUMENA countries
and emissions avoided by implementing the proposed scenario with respect to an electricity mix equiva-
lent to that of the year 2000.
DESERTEC, Whitebook of TREC and Club of Rome 16EU-MENA Cooperation for Sustainable Electricity and Water
If desalination of sea water is powered by solar energy instead by fossil fuels, its environ-
mental impacts are significantly reduced. However, seawater desalination itself is always a
considerable burden to the environment, due to the resulting salty brine and the necessary
chemical water treatment. Nano-filtration of intake water can mitigate those impacts, but
more energy is required in that case. Therefore, activating the existing potential for enhanced
efficiency of water use, water management and infrastructure is also a very high priority, in
order to minimize the need for desalination. The AQUA-CSP study analyses the environ-
mental impact of a broad application of solar-powered seawater desalination to cover the ex-
pected freshwater deficits in MENA (AQUA-CSP 2007). The results will be published by the
end of 2007.
Five Focal Points for Sustainable Energy Policy
The timely realization of a scenario that meets all criteria of sustainability will require de-
termined political support and action. Five focal points for national and international policy
for all countries in Europe, the Middle East and North Africa (EUMENA) result from our stud-
ies:
1. Increase support for research and development and for the market introduction of
measures for efficient supply, distribution and use of energy (efficiency focus).
2. Provide a reliable framework for the market introduction of existing renewable energy
technologies, based on best practice experience and increase support for research and
development for promising enhancements (renewable energy focus).
3. Initiate a EUMENA-wide partnership for sustainable energy. Provide European support to
accelerate renewable energy use in MENA (interregional cooperation focus).
4. Initiate planning and evaluation of a EUMENA High Voltage Direct Current super-grid to
combine the best renewable energy sources in this region and to increase diversity and
redundancy of supply (interconnection focus).
5. Support research and development for shifting the use of fossil fuels from bulk electricity
supply to a source primarily used for balancing power (balancing power focus).
Electricity in other Energy Sectors
A sustainable solution must also be found for the heating, cooling and transport sectors. En-
ergy efficiency and increasing renewable shares are useful guidelines for these sectors. In the
long term, there is the option of a partial shift from traditional heat and fuel to electricity. Ex-
amples for such a possible shift are electric heat pumps or direct electricity for space and wa-
ter heating and electric or hybrid vehicles. In terms of sustainability, the higher demand for
electricity arising from that shift will not constitute a problem if electricity is mainly produced
by renewable energy as assumed in our scenario. In the power sector, each kWh of electricity
produced by solar and wind energy will substitute approximately three kWh of primary en-
ergy from coal, oil, gas or uranium5. This relation depends on the actual efficiency of conven-
tional primary-energy conversion, which ranges from about 20 % in the transport sector to
about 80 % in space heating. Thus, the use of renewable electricity will add to the efficiency
5
assuming a typical conventional power plant efficiency of 33%
DESERTEC, Whitebook of TREC and Club of Rome 17EU-MENA Cooperation for Sustainable Electricity and Water
gains of primary energy in all energy sectors. A partial long-term shift of other sectors to
(clean) electricity is possible, as the renewable electricity potential in EUMENA is large
enough to cope with that additional demand. In addition to electricity, direct renewable solu-
tions also exist for those sectors, such as the use of bio-fuels for transport and heating, energy-
efficient buildings, absorption cooling and solar water heaters, to give only a few examples
(Dürrschmidt et al. 2006).
Combined heat and power is an important measure for increasing the energy efficiency of
fossil fuels. Some renewable technologies, such as biomass, geothermal and concentrating
solar thermal power plants, can also use this option for the combined generation of electricity
and heat – usually via steam – for industrial processes, cooling and desalination, and will gain
an increasing share in a future energy supply system.
Conclusions
The report quantifies the renewable electricity potentials in Europe and MENA and confirms
their ability to provide firm power capacity on demand. Of great advantage for a fast transi-
tion to clean and secure power is an interconnection between the electricity grids of Europe,
the Middle East and North Africa (EUMENA). Our study evaluates the potential and benefits
of solar power from deserts. The conventional electricity grid is not capable of transferring
large amounts of electricity over long distances. Therefore, a combination of the conventional
Alternating Current (AC) grid for local distribution and High-Voltage Direct-Current
(HVDC) transmission technology for long-distance transfer will be used in a Trans-
Mediterranean electricity scheme based mainly on renewable energy sources with some fossil
fuel backup. Sustainable energy will also be vital for sustainable freshwater supply by desali-
nation. The results can be summarized in the following statements:
1. A mix of various renewable energy sources backed by fossil fuels can provide sustain-
able, competitive and secure electricity. Our scenario for EUMENA starts with the
16% share of renewable electricity that existed in the year 2000 and reaches 80 % in
2050. An efficient backup infrastructure will be necessary to complement the renew-
able electricity mix, providing firm capacity on demand by quickly-reacting gas-fired
peaking plants, and by an efficient grid infrastructure to distribute renewable electric-
ity from the best centres of production to the main centres of demand.
2. Market introduction of renewable electricity requires initial support in the form of
long term power purchase agreements that cover the costs of operation together with a
reasonable return on investment. This will mean only a small increase in national elec-
tricity prices, but will avoid their long-term escalation thanks to an increasing propor-
tion of relatively inexpensive renewables and corresponding reductions in cost.
3. If initiated now, the change to a sustainable energy mix will, within a time-span of
about 15 years, lead to power generation that is less expensive than it would be in a
business-as-usual strategy. Fossil fuels with steadily rising costs will be replaced pro-
gressively by renewable forms of energy, most of which will be home-grown. The
negative socio-economic impacts of increases in fossil-fuel prices can be reversed by
2020 if an adequate political and legal framework for the introduction of renewables
into the market is established in time. Long-term power-purchase agreements like
DESERTEC, Whitebook of TREC and Club of Rome 18EU-MENA Cooperation for Sustainable Electricity and Water
those provided by the German or Spanish Renewable Energy Acts are very effective
instruments for the market introduction of renewables. If initial tariff additions are
subsequently reduced to zero, they can be considered as a very efficient public in-
vestment into affordable and secure power generation rather than as subsidy.
4. Solar electricity generated by concentrating solar thermal power plants in MENA and
transferred to Europe via high-voltage direct-current transmission can provide firm
capacity for base-load and peaking power, effectively complementing European elec-
tricity sources. Starting between 2020 and 2025 with a transfer of 60 TWh/y, solar
electricity imports could subsequently be extended to 700 TWh/y by 2050. High solar
irradiance in MENA and low transmission losses of around 10 % will yield a competi-
tive price of about 0.05 €/kWh in Europe for import of solar electricity.
5. Instead of a doubling of carbon dioxide emissions in the period up to 2050, which is
likely to happen in a business-as-usual scenario, the CO2 emissions from power gen-
eration in EUMENA can be reduced to 38 % of emissions of the year 2000. Only 1 %
of the land area will be required for this renewable electricity scheme, which is
equivalent to the land used at present for transport and mobility in Europe.
6. Growing freshwater deficits in MENA will increasingly require seawater desalination,
but this must be done using sustainable sources of energy. Solar electricity for mem-
brane desalination and combined solar heat and power for thermal seawater desalina-
tion are major candidates for such a sustainable solution.
7. European support for MENA for the introduction of renewables into the market can
relieve the increasing pressure on fossil fuel resources that would otherwise result
from the economic growth of this region, thus helping indirectly to secure fossil fuel
supply also in Europe. The necessary political process could be initiated by a renew-
able energy partnership and a common free trade area for renewable forms of energy
in EUMENA and culminate in a Community for Energy, Water and Climate Security.
In order to achieve those benefits, governments in EUMENA must now take the initiative and
establish an adequate legal and financial framework for new investment into this least-cost
option for clean and sustainable energy. As energy is also a prerequisite for a sustainable sup-
ply of water, a timely decision by EUMENA governments to initiate that path is of vital im-
portance for the total region.
References
AQUA-CSP 2007, Trieb, F., Schillings, C., Viebahn, P., Paul, C., Altowaie, H., Sufian, T., Alnaser, W., Ka-
bariti, M., Shahin, W., Bennouna, A., Nokraschy, H., Kern, J., Knies, G., El Bassam, N., Hasairi, I., Haddouche,
A., Glade, H., Aliewi, A., Concentrating Solar Power for Seawater Desalination. German Aerospace Center
(DLR), Study for the German Ministry of Environment, Nature Conversation and Nuclear Safety, (ongoing)
Stuttgart 2007, (www.dlr.de/tt/aqua-csp)
Asplund, G., Sustainable energy systems with HVDC transmission, at IEEE PES 2004 General Meeting, Denver,
6-12 June 2004, http://ewh.ieee.org/cmte/ips/2004GM/2004GM_GlobalPowerSystems.pdf, www.abb.com
Awerbuch, S., Berger, M., Energy diversity and security in the EU: Applying portfolio theory to EU electricity
planning and policymaking, IEA, Report EET/2003/03, February 2003,
http://www.iea.org/textbase/papers/2003/port.pdf
DESERTEC, Whitebook of TREC and Club of Rome 19EU-MENA Cooperation for Sustainable Electricity and Water Bennouna, A., Nokraschy, H., A Sustainable Solution to the Global Problem of Water Scarcity in the Arab World, Proceedings of GCREADER Conference, Amman, 2006 Benoit, G., Comeau, A., A Sustainable Future for the Mediterranean, Earthscan 2005 http://shop.earthscan.co.uk/ProductDetails/mcs/productID/667 BMU 2004, German Federal Ministry for the Environment, Nature Conservation and Nuclear Safety (BMU), The Renewable Energy Sources Act, Berlin 2004, http://www.erneuerbare-energien.de/inhalt/6465/5982/ Brischke, L.A., Model of a Future Electricity Supply in Germany with Large Contributions from Renewable Energy Sources using a Single Node Grid (in German), VDI Fortschritt Berichte, Reihe 6, Energietechnik, Nr. 530, ISBN 3-18-353006-6, VDI Düsseldorf 2005, http://www.vdi-nachrichten.com/onlineshops/buchshop/literaturshop/langanzeige.asp?vr_id=7124 Commission of the European Communities, DG Research, World Energy Technology Outlook 2050 (WETO- H2), Luxembourg 2006, http://ec.europa.eu/research/energy/pdf/weto-h2_en.pdf Commission of the European Communities, GREEN PAPER - A European Strategy for Sustainable, Competi- tive and Secure Energy, COM(2006) 105 final, Brussels, 8.3.2006 http://europa.eu.int/comm/energy/green- paper-energy/index_en.htm Dürrschmidt, W., Zimmermann, G., Böhme, D., Eds., Renewable Energies - Innovation for the Future, German Federal Ministry for the Environment, Nature Conservation and Nuclear Safety, Berlin 2006, http://www.erneuerbare-energien.de/inhalt/37453/36356/ Eurelectric, Union of the Electricity Industry, Mediterranean Interconnection - SYSTMED, Brussels 2003 http://public.eurelectric.org/Content/Default.asp?PageID=35 European Environment Agency, Energy Subsidies in the European Union, EEA Technical Report 1/2004, Co- penhagen 2004, http://reports.eea.europa.eu/technical_report_2004_1/en Graßl H., et. al., World in Transition – Towards Sustainable Energy Systems, German Advisory Council on Global Change, WBGU, Berlin March 2003, http://www.wbgu.de/wbgu_jg2003_engl.html Helmholtz-Gemeinschaft der Großforschungsunternehmen (HGF), Hearing on Nuclear Fusion before the Bundestag Committee for Education, Research and Technology Assessment, Berlin, 28. March 2001, http://fire.pppl.gov/eu_bundestag_english.pdf International Energy Agency, World Energy Outlook 2005, Paris, 2005, http://www.worldenergyoutlook.org/ International Energy Agency, Projected Costs of Generating Electricity - 2005 Update, Paris, 2005 International Energy Agency, World Energy Outlook 2006, Paris, 2006, http://www.worldenergyoutlook.org/ Intergovernmental Panel on Climate Change (IPCC), Climate Change 2001 – Synthesis Report – Summary for Policy Makers, www.ipcc.ch/pub/un/syreng/spm.pdf Mantzos L., Capros, P., European Energy and Transport Trends to 2030, Update 2005, The European Commis- sion, Brussels 2005, http://ec.europa.eu/dgs/energy_transport/figures/trends_2030/1_pref_en.pdf May, N., Eco-Balance of Solar Electricity Transmission from North Africa to Europe, Diploma Thesis, Univer- sity of Braunschweig, 2005, http://www.dlr.de/tt/trans-csp MED-CSP 2005, Trieb, F., Schillings, C., Kronshage, S., Viebahn, P., May, N., Paul, C., Klann, U., Kabariti, M., Bennouna, A., Nokraschy, H., Hassan, S., Georgy Yussef, L., Hasni, T., Bassam, N., Satoguina, H., Concen- trating Solar Power for the Mediterranean Region. German Aerospace Center (DLR), Study for the German Ministry of Environment, Nature Conversation and Nuclear Safety, April 2005. (www.dlr.de/tt/med-csp) Nuclear Decommissioning Authority (NDA), Managing the Nuclear Legacy - A strategy for action, Whitepaper of the UK Nuclear Decommissioning Authority, London 2002, www.nda.gov.uk Neij, L., et al., Experience Curves: A Tool for Energy Policy Assessment, Lund University, European Commis- sion, Lund 2003, http://www.iset.uni-kassel.de/extool/Extool_final_report.pdf Pitz-Paal, R., Dersch, J., Milow, B., European Concentrated Solar Thermal Road Mapping, ECOSTAR, SES6- CT-2003-502578, European Commission, 6th Framework Programme, German Aerospace Center, Cologne 2005 ftp://ftp.dlr.de/ecostar/ECOSTAR_Roadmap2005.pdf Price, H., DLR TRANS-CSP Study applied to North America, Department of Energy of the United States of America (DOE) 2007, http://www.osti.gov/bridge/purl.cover.jsp?purl=/910505-F2lSrR/ DESERTEC, Whitebook of TREC and Club of Rome 20
You can also read


