Cooperation perspectives for the Luxembourg Cross-border Functional Region - Thinking and planning in areas of territorial cooperation: ESPON ...
←
→
Page content transcription
If your browser does not render page correctly, please read the page content below
Cooperation perspectives
     for the Luxembourg
Cross-border Functional Region
          Thinking and planning
    in areas of territorial cooperation:
       ESPON ACTAREA spin-off

              Final Report
Final Report

        Cooperation perspectives
   for the Luxembourg Cross-border
           Functional Region

                    Version 13/10/2020

        Disclaimer:
        This document is a final report.

        The information contained herein is subject to change and does not commit
        the ESPON EGTC and the countries participating in the ESPON 2020
        Cooperation Programme.

Cooperation perspectives for the Luxembourg Cross-border Functional Region          i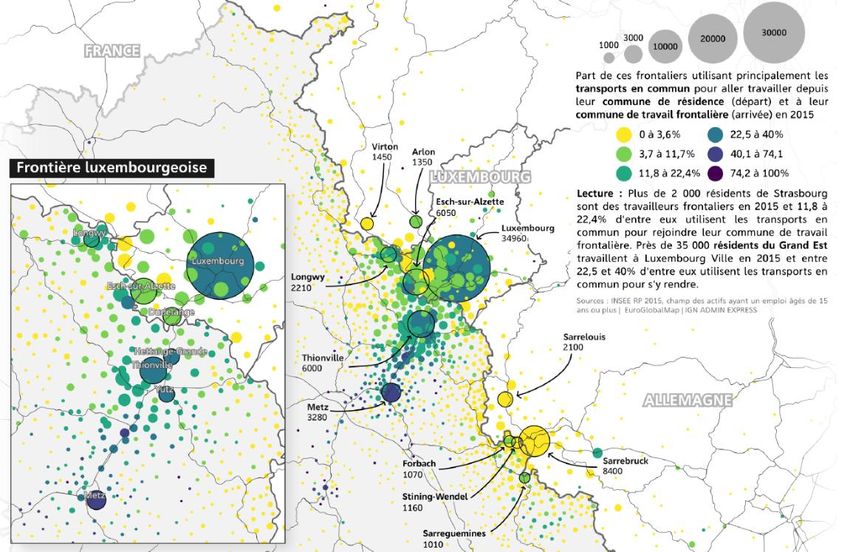
Table of contents
List of Figures ............................................................................................................................ iii
List of Tables ............................................................................................................................. iv
Abbreviations ............................................................................................................................. vi
1      Introduction ........................................................................................................................ 1
2      Labour, housing and transport .......................................................................................... 2
       2.1 Cross border commuting ........................................................................................... 2
       2.2 Transport axes, modal distribution and congestion risks .......................................... 8
       2.3 Labour market dynamics ......................................................................................... 12
       2.4 Housing ................................................................................................................... 15
       2.5 Delineation of the functional region ......................................................................... 20
       2.6 Mapshot................................................................................................................... 21
       2.7 Institutional mapping ............................................................................................... 23
3      Energy production and provision ..................................................................................... 24
       3.1 Energy consumption in Luxembourg ...................................................................... 24
       3.2 Electricity production in Luxembourg ...................................................................... 28
       3.3 Energy transfers with neighbouring countries ......................................................... 30
       3.4 Electricity production around Luxembourg .............................................................. 34
           3.4.1 Grand Est ....................................................................................................... 34
           3.4.2 Wallonia ......................................................................................................... 37
           3.4.3 Saarland ......................................................................................................... 37
           3.4.4 Rhineland-Palatinate ...................................................................................... 38
           3.4.5 North Rhine-Westphalia ................................................................................. 39
       3.5 Electricity consumption around Luxembourg .......................................................... 40
           3.5.1 Grand Est ....................................................................................................... 40
           3.5.2 Wallonia ......................................................................................................... 41
           3.5.3 Saarland ......................................................................................................... 42
           3.5.4 Rhineland-Palatinate ...................................................................................... 42
           3.5.5 North Rhine-Westphalia ................................................................................. 43
       3.6 Energy production policy objectives ........................................................................ 43
       3.7 Functional area........................................................................................................ 47
       3.8 Mapshot................................................................................................................... 48
       3.9 Institutional mapping ............................................................................................... 50
4      Food provision and associated value chains .................................................................. 51
       4.1 Exports and imports of foodstuffs............................................................................ 51
       4.2 Production intensities .............................................................................................. 53
       4.3 Ecological farming ................................................................................................... 55
       4.4 Functional area........................................................................................................ 56
       4.5 Mapshot................................................................................................................... 56
5      Recommendations for soft cross-border territorial cooperation strategy ........................ 58

Cooperation perspectives for the Luxembourg Cross-border Functional Region                                                                    ii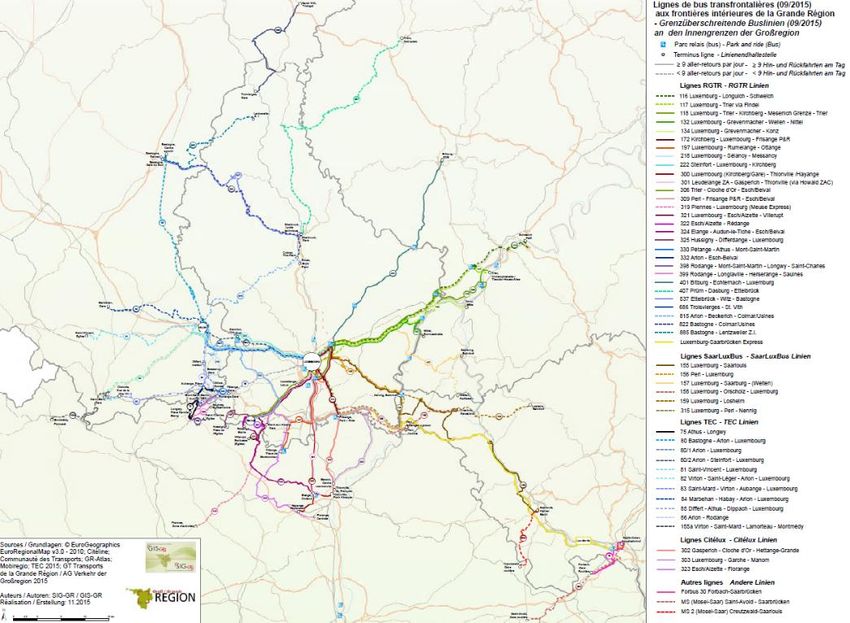
List of Figures
Figure 1       Evolution of the number of cross-border workers ............................................ 2

Figure 2       Volumes of cross-border commuter flows in the Greater Region .................... 4

Figure 3       Geographical distribution of cross-border commuters 29.03.2019 .................. 5

Figure 4       Cross border travel-to-work flows towards Luxembourg in 2017 .................... 6

Figure 5       Area with a concentration of cross-border in- and out-commuters in 2002 ..... 7

Figure 6       Geographical distribution of cross-border workers from Grand-Est
               region using public transportation .................................................................... 8

Figure 7       Cross-border bus lines around Luxembourg ................................................... 9

Figure 8       Cross-border railway connections around Luxembourg ................................ 10

Figure 9       Number of travel-to-work movements on main road section, 2017 ............... 11

Figure 10      Ratio of cross-border commuters in direction of Luxembourg
               to total number of commuters ........................................................................ 13

Figure 11      Spatial distribution of new dwellings in the Grand Est region (2014) ............ 16

Figure 12      Evolution of building permits in Belgium (2004-2014) ................................... 17

Figure 13      Delivery of new residential buildings 2018 and trends 2008-2018 ................ 18

Figure 14      Growth in residential built-up area 2010-2016
               in Luxembourg municipalities ......................................................................... 19

Figure 15      Functional urban areas around Luxembourg ................................................. 20

Figure 16      Mapshot - thematic field "labour, transport and housing" .............................. 22

Figure 17      Institutional mapping - thematic field "labour, transport and housing" ........... 23

Figure 18      Final energy consumption per dwelling by country (2000 and 2017) ............ 25

Figure 19      Energy consumption for heating per dwelling by country (2000 and 2017) .. 26

Figure 20      Electricity consumption per dwelling by country (2000 and 2017)................. 26

Figure 21      Share of energy from renewable sources
               in gross final energy consumption, by country (2018) ................................... 27

Figure 22      Electricity production in Luxembourg – 2010-2017........................................ 29

Figure 23      Positioning Vianden pump storage facility ..................................................... 29

Figure 24      Cross-border electricity transmission lines Luxembourg ............................... 31

Figure 25      Natural gas pipelines around Luxembourg .................................................... 32

Cooperation perspectives for the Luxembourg Cross-border Functional Region                                           iii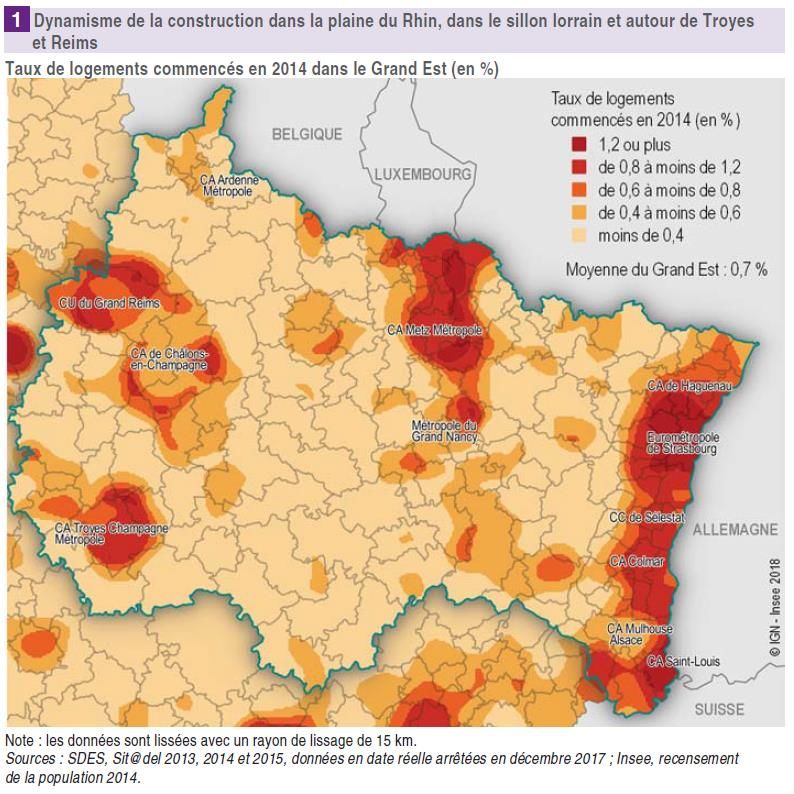
Figure 26          Cross-border pipeline projects that were proposed in 2013
                   to reduce congestion in the provision of natural gas to Luxembourg ............ 32

Figure 27          MosaHYc distribution system for hydrogen ................................................... 33

Figure 28          Electricity produced (2019) ............................................................................ 35

Figure 29          Comparison of electricity production and consumption
                   in Grand Est region (2019) ............................................................................. 35

Figure 30          Energy exports and import in Grand Est-Region (2019) ............................... 36

Figure 31          Renewable energy production in the Grand Est region ................................. 36

Figure 32          Electricity production in Wallonia by source (2016) ....................................... 37

Figure 33          Electricity consumption by sector in Grand Est region (2019) ....................... 40

Figure 34          Industrial energy consumption in Grand Est region (2019) ........................... 40

Figure 35          Energy consumption by sector in 2018 in Belgium ........................................ 41

Figure 36          Mean wind power density .............................................................................. 46

Figure 37          Mapshot - thematic field "energy provision and production" .......................... 49

Figure 38          Institutional mapping - thematic field “energy production and provision” ...... 50

Figure 39          Luxembourg’s level of self-sufficiency for selected vegetables and fruits ..... 51

Figure 40          Agricultural production intensities per inhabitant,
                   compared to Greater Region average ........................................................... 54

Figure 41          Mapshot – theme “food provision and associated value chains” ................... 57

List of Tables
Table 1      Proportions of cross-border workers in Luxembourg
             by country/region of residence ................................................................................ 3

Table 2     Modal distribution for cross-border workers in 2007, 2010 and 2017 ...................... 8

Table 3      Activity and unemployment rates ........................................................................... 12

Table 4      Population and employment growth ...................................................................... 13

Table 5     Employment change .............................................................................................. 14

Table 6     Population change ................................................................................................. 14

Table 7     Working age population change (20 to 60 years old) ............................................ 15

Table 8     Number of new constructions per year per thousand inhabitants
            in Saarland (by NUTS3) .......................................................................................... 19

Cooperation perspectives for the Luxembourg Cross-border Functional Region                                                     iv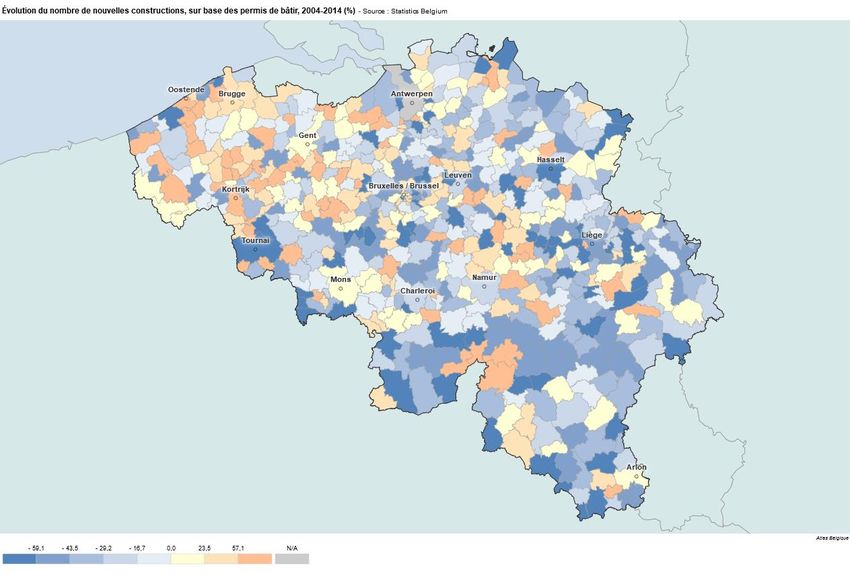
Table 9    Energy consumption by category of use in Luxembourg – 2000-2018 (GWh) ...... 25

Table 10   Energy consumption (electricity) – 2000-2018 (GWh) .......................................... 27

Table 11   Share of fuels in the final energy consumption in the residential sector (2017) .... 28

Table 12   Electricity imports in Luxembourg, countries of origin 2013-2018........................ 31

Table 13   Electricity exports from Luxembourg, countries of destination 2013-2018........... 31

Table 14   Luxembourg electricity imports and exports (in MWh) 2013-2018 ....................... 31

Table 15   Comparison of electricity production and consumption ........................................ 34

Table 16   Electricity production in Saarland by source, 2008 and 2017 .............................. 38

Table 17   Electricity production in Rhineland-Palatinate by source, 2008 and 2017 ........... 38

Table 18   Electricity production in North Rhine-Westphalia by source,
           2008 and 2017 ....................................................................................................... 39

Table 19   Total energy consumption by sector in Wallonia (2018) ....................................... 41

Table 20   Energy consumption by user group, 2008 and 2015
           as share of total consumption for Saarland ........................................................... 42

Table 21   Energy consumption by user group, 2008 and 2017
           as share of total consumption for Rhineland-Palatinate ........................................ 42

Table 22   Energy consumption by user group, 2008 and 2017
           as share of total consumption for North Rhine-Westphalia ................................... 43

Table 23   Renewable electricity production levels and 2030 objectives .............................. 45

Table 24   Renewable electricity production levels and 2030 objectives:
           absolute change .................................................................................................... 45

Table 25   Renewable electricity production levels and 2030 objectives:
           relative change ...................................................................................................... 46

Table 26   Exports and imports of foodstuffs in 2019 (thousands euros) .............................. 52

Table 27   Exports and imports of key products in Grand Est Region (2016)
           with main countries of origin/destination ............................................................... 52

Table 28   Proportion of manufacturing turnover general by food processing industries ...... 54

Table 29   Ecological production in Luxembourg and neighbouring regions ......................... 55

Cooperation perspectives for the Luxembourg Cross-border Functional Region                                                        v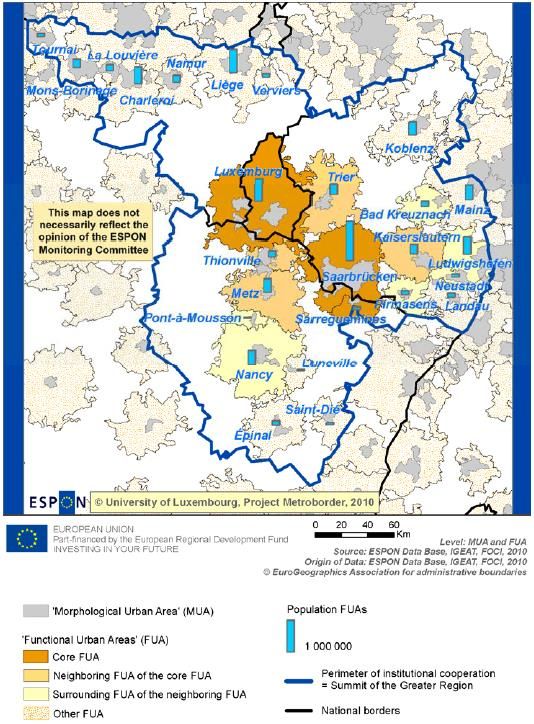
Abbreviations
 COVID-19         Coronavirus Disease 2019
 DATer            Luxembourgish Department of Spatial Planning
 EC               European Commission
 EGTC             European Grouping of Territorial Cooperation
 ESPON            European Territorial Observatory Network
 EU               European Union
 FUA              Functional Urban Area
 INSEE            Institut national de la statistique et des études économiques (France)
 LISER            Luxembourg Institute of Socio-Economic Research
 MosaHYc          Mosel Saar HYdrogen Conversion
 NUTS             Nomenclature of Territorial Units for Statistics
 STATEC           Institut national de la statistique et des études économiques du Grand-Duché
                  de Luxembourg
 VRE              Variable renewable energy

Cooperation perspectives for the Luxembourg Cross-border Functional Region                 vi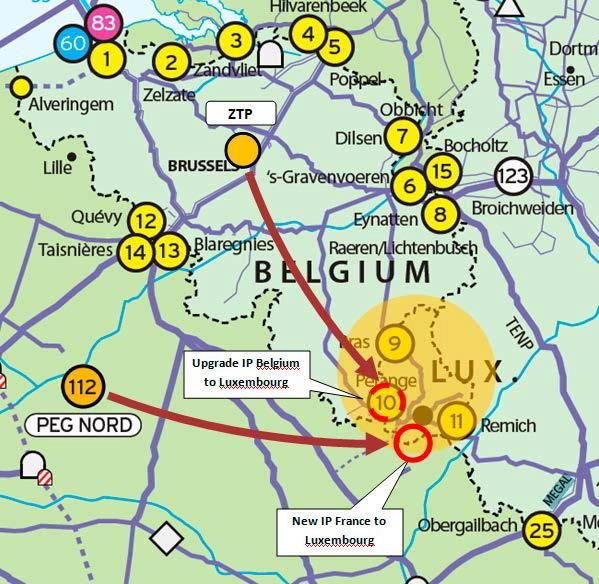
1 Introduction
The Luxembourg government is currently revising the Master Programme for Spatial Planning.
This new version will include guidelines for the near- to medium-term future development of the
Luxembourgish territory (time horizon 2035) and strategic orientations for its long-term future
development (time horizon 2050). As a preparation and input for these strategic orientations,
the government has launched the process of creating a vision for the cross-border functional
area of Luxembourg until 2050 (called “Luxembourg in Transition”) based on the principles of
carbon neutrality and resilience. This fits into the context of ongoing discussions in Luxembourg
about an approach of co-development in the cross-border cooperation with its neighbours and
the vision will eventually guide a soft territorial cooperation driven by the Luxembourg
government in the context of the implementation of the Master Programme for Spatial Planning.
The visioning process itself will run from October 2020 until December 2021 and will be
supported by 10 expert teams, many of which neither come from Luxembourg nor from the
Greater Region.

The present report is meant to offer different types of guidance to support the work of the expert
groups. These inputs are based on two pillars:

    -   a precise overview of institutional frameworks of relevance for the balanced territorial
        development in and around Luxembourg; and

    -   descriptions of cross-border functional interdependencies in relation to themes and
        issues considered to be of strategic importance by the government of Luxembourg.

The objective is to provide contextual information for expert inputs. This contextual information
is synthesised by using two types of graphic tools developed by the ACTAREA project:
Mapshots and Institutional mappings.

It focuses on three themes, which have been selected in dialogue with the Luxembourgish
Department of Spatial Planning (DATer):

    -   Labour markets, housing and transport;

    -   Energy production and provision;

    -   Food provision and associated value chains.

The following chapters successively address these three themes. Each section first reviews
available evidence. Mapshots and Institutional mappings are presented in the final sub-
sections. The final section of the report presents recommendations for a soft cross-border
territorial cooperation strategy.

Cooperation perspectives for the Luxembourg Cross-border Functional Region                      1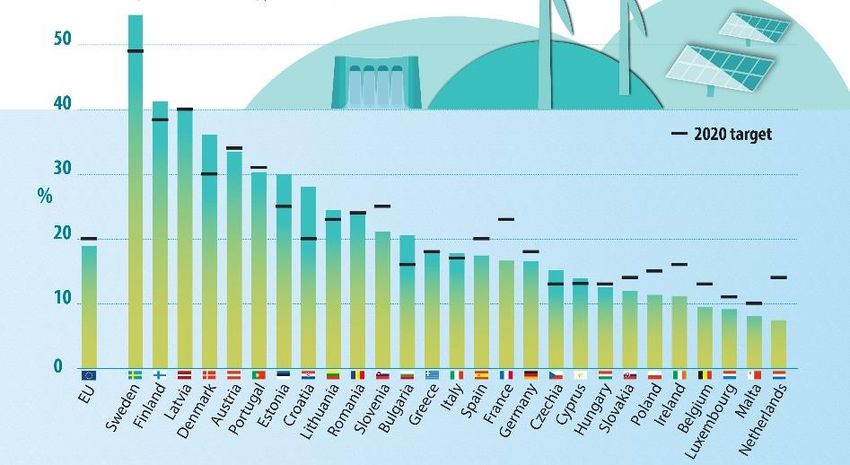
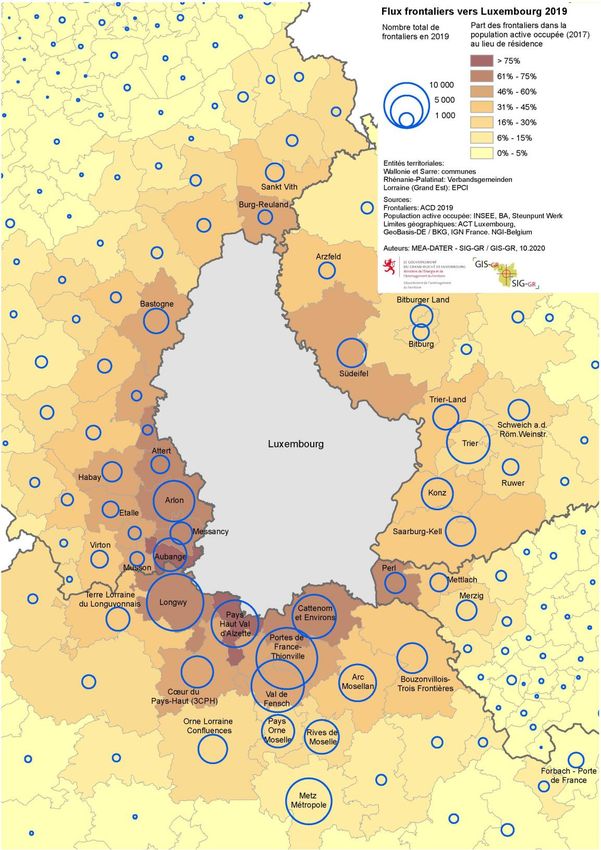
2 Labour, housing and transport
Access to jobs, affordable housing and the adequate provision of transport infrastructure and
services are key concerns for the Luxembourg Cross-border Functional Region. The present
chapter first describes the extent of cross border commuting (section 2.1) and its impact in
terms of transport flows and congestion (section 2.2). Patterns and trends in the different labour
markets around the Luxembourg Cross-border Functional Region are then described (section
2.3). Finally, available evidence on housing construction trends across these territories is
compiled (section 2.4). On this basis, a delineation of the Luxembourg Cross-border Functional
Region from the perspective of the labour market, housing and transport is presented (section
2.5). This forms the basis for the elaboration of a Mapshot (section 2.6) and an institutional
mapping (section 2.7).

2.1   Cross border commuting
Cross-border workers account for 43 % of the employed population in Luxembourg, i.e. over
200,000 workers out of a total of 460,000 (Conseil économique et social, 2020). This proportion
has been steadily increasing since 1986 (Figure 1). Since 2009, the number of cross-border
workers has increased by 36 %.

Figure 1 Evolution of the number of cross-border workers

Source: Conseil économique et social (2020)

The countries of residence of cross-border workers are roughly 50 % France, 25 % Belgium
and 25 % Germany (Table 1). These proportions have remained relatively constant since 2009.
The proportion of cross-border workers residing in France is slowly increasing. Flows of
commuters in direction of Luxembourg are considerably greater than any other flows observed
in the Greater Region (Figure 2).

Cross-border commuter flows primarily target the City of Luxembourg. There are also significant
flows from France in direction of Esch-Belval, and more diffuse short-distance flows across all
the border (Figure 4). Judging from these 2017 data, the 2002 general representation of how
out-commuting and in-commuting areas are organised geographically (Figure 5) remains valid.
Cross-border commuters working in Luxembourg reside primarily along the Metz-Thionville
axis, around Trier and Arlon, and in the vicinity of the southern border of Luxembourg (Figure
3).

Cooperation perspectives for the Luxembourg Cross-border Functional Region                      2
Table 1        Proportions of cross-border workers in Luxembourg
               by country/region of residence

                            2009      2010       2011      2012      2013      2014
  Germany                    25.1 %    25.2 %     25.3 %    25.3 %    25.3 %    25.3 %
             Rhineland-      18.0 %    18.2 %     18.3 %    18.4 %    18.5 %    18.5 %
             Palatinate
             Saarland         4.9 %      5.0 %     5.0 %     5.1 %     5.2 %     5.2 %
  Belgium                    25.7 %    25.6 %     25.5 %    25.4 %    25.5 %    25.5 %
             Province de      4.6 %      4.6 %     4.6 %     4.6 %     4.6 %     4.6 %
             Liège
             Province du     18.4 %    18.4 %     18.3 %    18.3 %    18.3 %    18.3 %
             Luxembourg
  France                     49.2 %    49.2 %     49.2 %    49.2 %    49.1 %    49.3 %
             Meurthe-et-     12.7 %    12.7 %     12.7 %    12.7 %    12.6 %    12.7 %
             Moselle
             Meuse            1.0 %      1.0 %     1.0 %     1.0 %     1.0 %     1.0 %
             Moselle         32.7 %    32.8 %     32.8 %    33.0 %    33.1 %    33.2 %

                           2015       2016       2017      2018      2019      2020
  Germany                    25.2 %    24.9 %     24.5 %   24.3 %    24.0 %    24.4 %
             Rhineland-      18.6 %    18.4 %     18.1 %   17.9 %    17.6 %    17.9 %
             Palatinate
             Saarland         5.1 %     5.1 %      5.0 %     5.0 %     4.9 %     5.0 %
  Belgium                    25.3 %    25.1 %     24.8 %   24.6 %    24.2 %    24.1 %
             Province de      4.6 %     4.5 %      4.5 %     4.4 %     4.3 %     4.3 %
             Liège
             Province du     18.2 %    18.1 %     18.0 %   17.9 %    17.8 %    17.8 %
             Luxembourg
  France                     49.5 %    50.0 %     50.7 %   51.1 %    51.8 %    51.5 %
             Meurthe-et-     12.7 %    12.8 %     13.0 %   13.1 %    13.2 %    13.1 %
             Moselle
             Meuse            0.9 %     1.0 %      1.0 %     1.0 %     1.0 %     1.0 %
             Moselle         33.5 %    34.0 %     34.7 %   35.0 %    35.5 %    35.4 %
Source: Conseil économique et social (2020)

Raft

Cooperation perspectives for the Luxembourg Cross-border Functional Region               3
Figure 2 Volumes of cross-border commuter flows in the Greater Region Source: IBA-OIE Cooperation perspectives for the Luxembourg Cross-border Functional Region 4
Figure 3 Geographical distribution of cross-border commuters 2019

Source: SIG-GR

Cooperation perspectives for the Luxembourg Cross-border Functional Region   5
Figure 4 Cross border travel-to-work flows towards Luxembourg in 2017

Source: LISER (2017)

Cooperation perspectives for the Luxembourg Cross-border Functional Region   6
Figure 5 Area with a concentration of cross-border in- and out-commuters in 2002

Source: Diop and Lamour (2014)

Cooperation perspectives for the Luxembourg Cross-border Functional Region         7
2.2   Transport axes, modal distribution and congestion risks
Latest identified available data on preferred modes of transportation among cross-border
workers are from 2010. These data indicate that the vast majority of cross-border workers from
Belgium and Germany use private cars (88-90 %). This also concerns 83 % of French cross-
border workers (Table 2). According to French data, the situation has not evolved much
between 2010 and 2015. Only 18 % of cross-border workers used public transportation to travel
between the Grand-Est region and Luxembourg in 2015 (Préfet de la région Grand Est, 2018).
These workers are concentrated along the rail axis between Luxembourg and Nancy (Figure
6).

Table 2          Modal distribution for cross-border workers in 2007, 2010 and 2017
              Individual car                Train                           Bus, walking

              2007      2010      2017      2007     2010      2017         2007      2010    2017

 France       89 %      83 %      80,8      9,5 %    11,5      12,1         1,5 %     5,5 %   0,2 %
                                  %                  %         %

 Belgium      95 %      90 %      88,1      8%       9%        8%           2,5 %     3%      0%
                                  %

 Germany      95 %      90 %      89,7      1%       2,5 %     3%           4%        7,5 %   0,3 %
                                  %

Sources: 2007, 2010: Schmidt, Gerber (2012), 2017: Enquête LuxMobil, quoted by Conseil
économique et social (2020)

Figure 6 Geographical distribution of cross-border workers from Grand-Est
         region using public transportation

Source: Préfet de la Région Grand Est (2018)

Cooperation perspectives for the Luxembourg Cross-border Functional Region                            8
However, there is an extensive network of bus and rail services connecting neighbouring regions to Luxembourg (Figure 7 and Figure 8). Admittedly, these connections are centred on Luxembourg city-centre and Esch-sur-Alzette. Commuting to other destinations may be complicated, unless they are situated close to one of the stations along these lines. Furthermore, the speed and reliability of the different connections would need to be critically assessed. Despite the relatively higher proportion of commuters using public transportation, road traffic is the highest in direction of France (Figure 9). Figure 7 Cross-border bus lines around Luxembourg Source: SIG-GR Cooperation perspectives for the Luxembourg Cross-border Functional Region 9
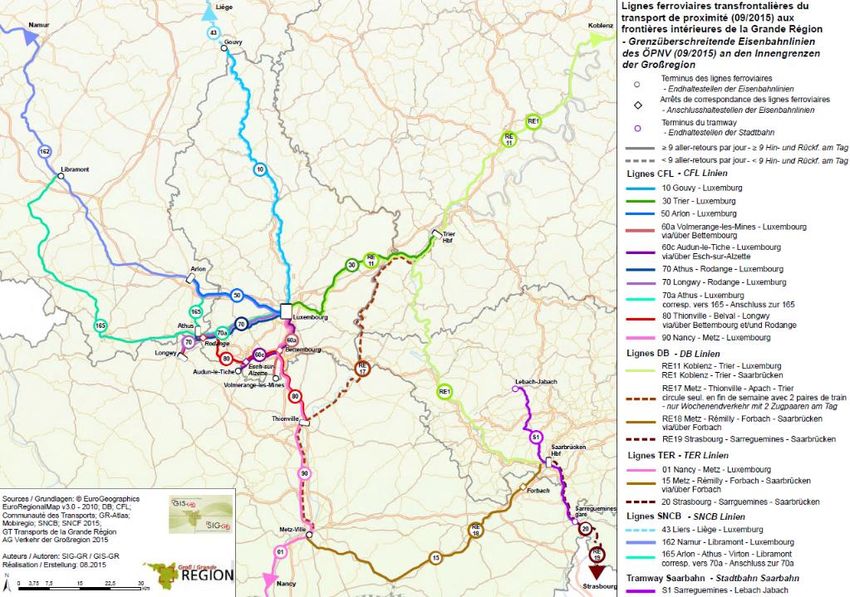
Figure 8 Cross-border railway connections around Luxembourg

Source: SIG-GR

Cooperation perspectives for the Luxembourg Cross-border Functional Region   10
Figure 9 Number of travel-to-work movements on main road section, 2017

Source: Administration des contributions directes 2019, MEA DATer, September 2020

Cooperation perspectives for the Luxembourg Cross-border Functional Region          11
2.3        Labour market dynamics
The change in the numbers of cross-border commuters over the coming years will be impacted
by many factors, e.g. number and range of job opportunities in Luxembourg, differences
between wages in Luxembourg and neighbouring regions, unemployment rates, and
demographic change. The present sub-section explores a selection of these factors.

Luxembourg has a relatively lower employment rate compared to neighbouring regions,
especially in Germany. Unemployment is significantly lower than in French neighbouring
regions and Wallonia, but higher than in Rhineland-Palatinate. However, unemployment figures
have risen significantly as a result of the COVID-19 crisis in Luxembourg 1 , Saarland 2 and
Rhineland Palatinate 3 , while they have fallen in the Grand Est 4 and remained stable in
Wallonia5.

Over the last decades, employment and population have rapidly increased in Luxembourg-City and
           neighbouring municipalities with extensive cross-border commuting in direction of the city,
           and only weakly in remaining parts of the functional region in France, Belgium and Germany
           (Table 4 and
Figure 10). If we consider neighbouring regions as a whole (Tables 5 to 7):

       -      Saarland experiences significant population losses, especially in the working age
              population, but gains in employment. Population losses are decelerating.

       -      Grand Est experiences more limited, but also significant population losses in the
              working age population, accompanied by losses in employment. Population losses are
              accelerating.

       -      Wallonia experiences population gains and a stable working age population.

Table 3 Activity and unemployment rates
                                 Luxemb     Grand        Saarlan   Rhinela    Prov.       Prov.          Walloni
                                 ourg       Est          d         nd-        Luxemb      Liège          a
                                                                   Palatina   ourg
                                                                   te
 Employment rates               67,9 %     65,5 %     73,6 %         76,5 %     65,3 %      59,0 %        59,2 %
 (2019)*
 Unemployment rate               5,6 %      8,9 %      3,6 %      3,1 %          5,4 %       8,2 %         8,5 %
 (2018)
 Unemployment rate               5,6 %      8,0 %      3,7 %      2,8 %          5,4 %       6,7 %         7,2 %
 (2019)
*Ratio of full time equivalents to total population aged 15 to 64 years.
Sources: Employment rates: Eurostat lfst_r_lfsd2pwc,
Unemployment rates: Eurostat lfst_r_lfu3rt

1   Statistical Poral of the Grand Duchy of Luxembourg
2   Statista
3   Statista
4   OREF Grand Est
5   Statbel

Cooperation perspectives for the Luxembourg Cross-border Functional Region                           12
Table 4 Population and employment growth
Source: Hein (2019)
Figure 10 Ratio of cross-border commuters in direction of Luxembourg
to total number of commuters
Source: SIG/GR
Cooperation perspectives for the Luxembourg Cross-border Functional Region 13Table 5 Employment change
Rhineland-
Luxembourg Lorraine* Saarland Wallonie
Palatinate
Total Total Total Total Total
2000 264,000 875,151 517,600 1,808,000 n.d.
2010 359,400 851,920 519,400 1,905,000 1,201,475
2018 448,500 822,067 534,300 2,034,000 1,281,208
2019 465,000 : 534,200 2,046,700 n.d.
2000-2018 69,9 % -6,1 % 3,2 % 12,5 % n.d.
2010-2018 24,8 % -3,5 % 2,9 % 6,8 % 6,6 %
* Départements of Meuse, Meurthe-et-Moselle, Moselle and Vosges
Source: Portail statistique de la Grande Région
Table 6 Population change
Rhineland-
Luxembourg Lorraine* Saarland Wallonie
Palatinate
Total Total Total Total Total
2000 433,600 2,314,909 1,071,501 4,030,773 3,339,516
2010 502,066 2,350,920 1,022,585 4,012,675 3,498,484
2018 602,005 2,324,619 994,187 4,073,679 3,624,377
2019 613,894 2,316,183 990,509 4,084,844 3,633,795
2020 626,108 2,307,425 986,887 4,093,903 3,645,243
2000-2018 38,8 % 0,4 % -7,2 % 1,1 % 8,5 %
2010-2018 19,9 % -1,1 % -2,8 % 1,5 % 3,6 %
2000-2019 41,6 % 0,1 % -7,6 % 1,3 % 8,8 %
2010-2019 22,3 % -1,5 % -3,1 % 1,8 % 3,9 %
*Départements of Meuse, Meurthe-et-Moselle, Moselle and Vosges
Source: Portail statistique de la Grande Région
Cooperation perspectives for the Luxembourg Cross-border Functional Region 14Table 7 Working age population change (20 to 60 years old)
Rhineland-
Luxembourg Lorraine* Saarland Wallonie
Palatinate
Total Total Total Total Total
2000 246,056 1,244,792 585,868 2,195,711 1,792,859
2010 288,346 1,262,456 559,230 2,194,395 1,873,548
2018 353,232 1,166,429 520,801 2,170,285 1,892,858
2019 360,322 1,153,971 513,783 2,162,832 1,889,322
2020 367,438 1,140,997 506,092 2,149,334 1,885,640
2000-2018 43,6 % -6,3 % -11,1 % -1,2 % 5,6 %
2010-2018 22,5 % -7,6 % -6,9 % -1,1 % 1,0 %
2000-2019 46,4 % -7,3 % -12,3 % -1,5 % 5,4 %
2010-2019 25,0 % -8,6 % -8,1 % -1,4 % 0,8 %
*Départements of Meuse, Meurthe-et-Moselle, Moselle and Vosges
Source: Portail statistique de la Grande Région
2.4 Housing
Since 2010, 2,891 new dwellings have been built on average every year in Luxembourg, while
the number of households has increased by 5,390 (STATEC, 2019). Housing needs have been
met thanks to the stock of available dwellings built before 2000.
In the French part of the functional region, housing construction is relatively intense in spite of
the demographic stagnation at the level of the entire region. Housing constructions appears
specifically focused on the areas with high accessibility to Luxembourg (Figure 11). In Wallonia,
the only visible impact of proximity to Luxembourg on residential building activity would be in
the vicinity of Arlon (Figure 12). In Rhineland-Palatinate, some Kreise with more intense
housing construction activities can be found in the vicinity of Luxembourg (Figure 13). In
Saarland, Merzig-Wadern in the vicinity of Luxembourg has the highest intensity in construction
activities of all Kreise (Table 8). Therefore, there is converging evidence of an impact of cross-
border commuting to Luxembourg on building activities. However, causal connections remain
to be identified.
Challenges related to the construction of new dwellings within the Grand Duchy of Luxembourg
are linked to a concentration of land ownership in the hands of a limited number of primarily
private actors (LISER - L’observatoire de l’habitat, 2019b). As prices on the real estate market
keep rising (+6,1 % on average every year between 2010 and 2017 (LISER - L’observatoire de
Cooperation perspectives for the Luxembourg Cross-border Functional Region 15l’habitat, 2019d)), a large proportion of these actors prefer to keep the land they possess, rather than sell it to developers (LISER - L’observatoire de l’habitat, 2019c). Luxembourg planning law makes it difficult to overcome this reluctance to sell land. In spite of efforts to expand existing constructions and to redevelop brownfields (LISER - L’observatoire de l’habitat, 2019a), the pressure on housing construction in the parts of Luxembourg located far from the main employment areas and in neighbouring countries is all the higher. This generates longer commuting distances, and high pressure on transport infrastructure. In the cross-border functional region of Luxembourg, one may therefore identify two distinct types of spaces: on the one hand, a central area with structural constraints on residential building and a lack of available housing; on the other hand, different peripheral areas within commuting distance experiencing an acceleration of residential building activities. These peripheral areas include multiple territories in Luxembourg’s neighbouring regions, but also some areas within Luxembourg (see Figure 14). Figure 11 Spatial distribution of new dwellings in the Grand Est region (2014) Source: INSEE (2019: 12) Cooperation perspectives for the Luxembourg Cross-border Functional Region 16
Figure 12 Evolution of building permits in Belgium (2004-2014)

Source: Atlas de Belgique

Cooperation perspectives for the Luxembourg Cross-border Functional Region   17
Figure 13 Delivery of new residential buildings 2018 and trends 2008-2018

Source: Statistisches Landesamt Rhineland-Palatinate (2019)

Cooperation perspectives for the Luxembourg Cross-border Functional Region   18
Table 8 Number of new constructions per year per thousand inhabitants
        in Saarland (by NUTS3)
 Kreis                             2014        2015       2016      2017       2018      2019
 Regionalverband
 Saarbrücken                           0,45        0,41      0,85       0,47      0,51      0,73
 Merzig-Wadern                         1,40        1,41      1,40       1,44      1,74      1,55
 Neunkirchen                           0,68        0,67      0,76       0,72      0,80      0,81
 Saarlouis                             1,17        1,15      1,36       1,13      1,23      1,13
 Saarpfalz-Kreis                       1,09        0,79      1,00       0,78      1,00      0,77
 St. Wendel                            0,75        0,92      1,34       1,25      1,38      1,38
 Saarland                              0,84        0,80      1,06       0,85      0,96      0,97
Source: own calculations based on Eurostat (population) and Saarland Statistical Office

Figure 14 Growth in residential built-up area 2010-2016
          in Luxembourg municipalities

Source: LISER – L’observatoire de l’habitat (2019a)

Cooperation perspectives for the Luxembourg Cross-border Functional Region                  19
2.5 Delineation of the functional region The cross-border functional region of Luxembourg for the labour market, housing and transport should include areas where commuting flows currently occur, and territories where such flows may emerge or could be encouraged. It therefore includes the functional urban area (FUA) of Luxembourg as it was described by the ESPON METROBORDER project (see Figure 15 below). However, as illustrated by the study area in Figure 4 p. 6, it also extends to the surroundings of Trier to the east and of Thionville and Metz to the south, in addition to a number of local administrative units contiguous to the border. The need to consider areas beyond the FUA identified by the METROBORDER project is also confirmed by Figure 5 p. 7. It appears important to distinguish between the part of the cross-border functional area located within the Grand Duchy of Luxembourg, and the parts located in the different neighbouring regions. Figure 15 Functional urban areas around Luxembourg Source: ESPON METROBORDER final report, p. 23 Cooperation perspectives for the Luxembourg Cross-border Functional Region 20
2.6       Mapshot
The Mapshot focuses on the following aspects:
      -    Current volumes of commuter flows from each of the three neighbouring countries in
           direction of Luxembourg (2019-2020);
      -    Delineation of the main area of out-commuting and in-commuting;
      -    Current unemployment levels (2019);
      -    Evolution of active population (growth, decline) (2010-2020);

      -    main urban nodes of in- and out-commuting areas.

The Mapshot describes the territorial organisation of some of the main driving forces of cross-
border commuting. It also illustrates how commuting is organised territorially. Transport axes,
congestion and tensions on the real estate market are not represented specifically. However,
areas with more intense building activities (compared to regional values) correspond to areas
with intense out-commuting (black hatches). Pressures on transportation systems are
synthesised by the arrows showing volumes of commuters. The main urban nodes of in- and
out-commuting areas are hubs around which multi-modal public transportation services can be
organised.

Cooperation perspectives for the Luxembourg Cross-border Functional Region                  21
Figure 16 Mapshot - thematic field "labour, transport and housing" ‘Lorraine’ in this context designates the three Départements Meuse, Meurthe-et-Moselle and Moselle. Cooperation perspectives for the Luxembourg Cross-border Functional Region 22
2.7       Institutional mapping
The Institutional mapping focuses on the description of overlaps between the cross-border
functional region of Luxembourg and the three major urban networks in the area:

      -    ‘Tonicité’ is entirely included in the Cross-border functional area;

      -    ‘Quattropole’ is partly included, as Saarbrücken has its own functional area;

      -    Only the northern half of the ‘Sillon Lorrain’ is included in the functional area.

In addition, the European Grouping of Territorial Cooperation Alzette Belval organises the part
of the cross-border functional region located between Esch-sur-Alzette and the Pays Haut Val
d’Alzette intermunicipal cooperation area in France.

Figure 17 Institutional mapping - thematic field "labour, transport and housing"

Cooperation perspectives for the Luxembourg Cross-border Functional Region                      23
3 Energy production and provision The present chapter describes the main issues and cooperation potentials linked to energy production and provision in the Luxembourg Cross-border Functional Region. National and regional borders continue to play a major role in the implementation of energy policies. The chapter, therefore, first focuses on energy consumption and production within Luxembourg. Section 3.1 and 3.2 compare levels of consumption to other European countries, describe current electricity production from renewable sources and provide figures on the level of dependence on external providers of energy. Section 3.3 then focuses on infrastructure for energy transmission between Luxembourg and its neighbouring countries. In sections 3.4 and 3.5, data on electricity production and consumption in neighbouring regions is compiled. The objective is to provide an overview on the respective importance of different types of production, from renewable and non-renewable sources, and the respective importance of different types of electricity consumption (e.g. by households, manufacturing and service activities). This provides indications on constraints and opportunities for future energy policies. Section 3.7 provides synthetic reflections on how a functional area for energy production and provision for the cross-border functional region of Luxembourg may be circumscribed. Finally, a Mapshot and an Institutional Mapping for this theme are presented in sections 3.8 and 3.9. 3.1 Energy consumption in Luxembourg Total energy consumption in Luxembourg is extensively influenced by the purchase of fossil fuels by non-residents. A significant number of inhabitants from neighbouring countries and transiting truck drivers choose to buy fuel in Luxembourg, benefitting from lower prices compared to neighbouring countries. This explains the high proportion of energy consumption in the transport sector (Table 9). However, Luxembourgish households also have the highest final energy consumption per dwelling6 (Figure 18). This is partly due to particularly high heating consumption by dwelling (Figure 19). 48.6 % of this energy consumption by dwellings was covered through imports of natural gas (Table 11). As a result, Luxembourg’s electricity consumption per dwelling is just above the EU average (Figure 20). 6 Figures calculated considering household consumption only Cooperation perspectives for the Luxembourg Cross-border Functional Region 24
Table 9 Energy consumption by category of use in Luxembourg –
        2000-2018 (GWh)
 Year                  2000     2010     2011     2012     2013     2014     2015     2016     2017     2018

 Total                 41,553   51,223   50,696   49,307   48,729   47,309   47,203   47,835   49,418   51,386

 Manufacturing          8,775    9,181    8,833    8,278    7,875    7,996    7,847    8,203    7,587    7,693

 Transports            22,483   30,587   31,718   30,194   29,745   29,186   28,281   28,305   29,733   31,750

 Other                 10,295   11,456   10,145   10,835   11,109   10,126   11,075   11,327   12,098   11,943

  Services              4,677    5,116    4,211    4,776    4,945    4,336    4,787    4,826    5,429    5,697

  Households            5,582    6,242    5,836    5,969    6,078    5,719    6,219    6,426    6,587    6,154

  Agriculture              36      97       98       90       86       72       69       75       83       92

Source: Statistics portal of the Grand Duchy of Luxembourg

Figure 18 Final energy consumption per dwelling by country (2000 and 2017)

Source: Odysee-Mure

Cooperation perspectives for the Luxembourg Cross-border Functional Region                        25
Figure 19 Energy consumption for heating per dwelling by country (2000 and 2017) Source: Odysee-Mure Figure 20 Electricity consumption per dwelling by country (2000 and 2017) Source: Odysee Mure If we consider electricity consumption only, we observe that 47 % is consumed by manufacturing industries, 35 % by service activities and 14.5 % by households (Table 10). Households, therefore, account for a relatively limited share of total electricity consumption. Cooperation perspectives for the Luxembourg Cross-border Functional Region 26
Table 10 Energy consumption (electricity) – 2000-2018 (GWh)
 Année           2000    2010       2011      2012     2013      2014     2015     2016     2017        2018

 Total             5,775    6,593     6,484    6,236     6,199    6,182    6,224    6,367    6,393       6,422

 Manu-
 facturing         3,242    3,625     3,576    3,207     3,051    3,077    3,146    3,432    3,004       3,062

 Transport            60      120       129      129       129     123      131      130      134         136

 Services          1,647    1,994     1,881    1,946     1,999    1,932    1,921    1,794    2,252       2,262

 Households          792      815       852      917       980    1,011     990      977      970         930

 Agriculture          34        39       46       38        40      39       37       34       33          33

Source: Statistics portal of the Grand Duchy of Luxembourg

Overall, the share of renewable energies in Luxembourg’s total energy consumption is just
above 9% (Figure 21). This is the third lowest rate in the EU, above Malta and the Netherlands.

Figure 21 Share of energy from renewable sources
          in gross final energy consumption, by country (2018)

Source: Eurostat (nrg_ind_ren)

Cooperation perspectives for the Luxembourg Cross-border Functional Region                         27
Table 11 Share of fuels in the final energy consumption in the residential sector (2017) Source: Eurostat 3.2 Electricity production in Luxembourg In 2019, Luxembourg produced 6,555 GWh, i.e. 15,9 % of the electricity it consumed. 12,2 % of this electricity production came from renewable sources (802 GWh) (Institut Luxembourgeois de Régulation, 2020). Wind energy production has been significantly increasing in recent years. The Luxembourg government expects production to reach 314 GWh in 2020, partly as result of the start of production at the Wincrange wind park in March 20207 (Luxembourg Ministry of Energy and Spatial Planning, 2020). However, electricity production from wind energy remains well below hydro-electric production and cogeneration (production from excess heat). Over the last decade, thermal electricity production has dropped from 2,588 GWh to 105 GWh (Figure 22). However, this production fluctuated in previous decades. It was only 34 GWh in 2000. 7 Luxembourg government Cooperation perspectives for the Luxembourg Cross-border Functional Region 28
Figure 22 Electricity production in Luxembourg – 2010-2017

Source: Statistical portal of the Grand Duchy of Luxembourg

One of Europe’s largest pump storage facilities is located in Vianden in Luxembourg (Figure
23). According to the International Energy Agency, “Luxembourg should continue to co-operate
with Germany and Amprion to ensure that the Vianden plant supports effective integration of
variable renewable energy (VRE) generation in the joint German-Luxembourg control area, as
this will contribute to Luxembourg’s security of supply and could allow for greater deployment
of VRE generation in Luxembourg” (International Energy Agency, 2020).

Figure 23          Positioning Vianden pump storage facility

Source: Société Électrique de l'Our

Cooperation perspectives for the Luxembourg Cross-border Functional Region                 29
3.3         Energy transfers with neighbouring countries
Luxembourg imports 95 % of the energy it consumes8, i.e. 100 % of oil, natural gas and biofuels.
In 2018, renewable energy covered 7.5 % of the country’s total primary energy supply (TPES).
Renewable energy came primarily from imported biofuels used in transport and biomass used
in combined heat and power plants, along with small but growing contributions from electricity
generated by wind and solar photovoltaics (PV) (International Energy Agency, 2020).

Electricity

Given its limited production capacities (see section 3.2 above), the Grand Duchy imports most
of its electricity from neighbouring regions: 5678 GWh net import in 2018 for a total production
of 933 GWh (Institut Luxembourgeois de Régulation, 2019).

All permanent cross-border transmission lines suppling the Luxembourg distribution grid with
electricity are connected to the system operated by Amprion in Germany. No connection to the
French and Belgian distribution systems is currently used for electricity distribution beyond
selected industrial plants 9. The connection to France (between Moulaine and Sotel, as shown
in Figure 24) is solely providing electricity to the Arcelor-Mittal steel plant in Esch/Belval10. The
same holds true for the connection between Aubange (in Wallonia) and Esch/Belval. An
interconnection to Belgium was established in 2017. After one year of technical tests, it was
decided that it did not provide significant added-value, and that it would not be
commercialised11.

Currently, the connection to Germany is sufficient to cover peek energy demand in
Luxembourg. For this reason, no mechanism to allocate capacity on the network has been
established. Such mechanisms may be established if the situation changes. 12 A new line is
currently being built between Aach in Rhineland-Palatinate and Bofferdange to increase the
exchange capacity between the German and Luxemburgish grids 13 . Electricity import and
export figures (Tables 12 to 14) must be interpreted keeping the elements above in mind.
Exports to Germany are partly linked to functioning of the storage facility in Vianden (see Figure
23 p. 29).

8   World data
9   Creos
10   Newspaper article, Républicain Lorrain
11   Elia
12 Creos : “La capacité d'interconnexion contractuelle en situation dégradée n-1 pour les lignes en
provenance de l'Allemagne s'élève actuellement à 980 MW. Cette capacité est suffisante pour couvrir les
besoins du réseau public luxembourgeois dont la charge de pointe prévisible est de 770 MW.”
13   ENTSOE

Cooperation perspectives for the Luxembourg Cross-border Functional Region                         30
Figure 24 Cross-border electricity transmission lines Luxembourg
          (1st January 2019)

Source: ENTSOE

Table 12 Electricity imports in Luxembourg, countries of origin 2013-2018
                                        2013        2014        2015        2016        2017        2018
  Belgium                                 13.7 %       2.7 %        3.4 %       4.1 %     7.0 %         5.1 %
  France                                   4.3 %     16.1 %        14.0 %    14.8 %      11.7 %       17.2 %
  Germany                                 82.0 %     81.3 %        82.6 %    81.2 %      81.2 %       77.6 %
Source : data.public.lu

Table 13 Electricity exports from Luxembourg, countries of destination 2013-2018
                                        2013        2014        2015        2016        2017        2018

  Belgium                                 45.5 %     48.7 %        25.4 %       0.4 %     3.7 %       10.5 %
  France
  Germany                                 54.5 %     51.3 %        74.6 %    99.6 %      96.3 %       89.5 %
Source : data.public.lu

Table 14 Luxembourg electricity imports and exports (in MWh) 2013-2018
                    2013           2014            2015            2016          2017          2018

  Imports            6,851,524      6,961,176       7,518,755       7,718,393      7,566,690      7,553,012
  Exports            1,039,355      1,061,303       1,431,902       1,413,500      1,336,934      1,244,868
  Net imports        5,812,170      5,899,873       6,086,853       6,304,893      6,229,756      6,308,144
Source : data.public.lu

Cooperation perspectives for the Luxembourg Cross-border Functional Region                         31
Natural gas
Maps of gas pipelines show that Luxembourg is connected to Belgium and Germany (see
Figure 25). The European “Gas Regional Investment Plan 2013-2022” published in 2013
contains a dedicated section dealing with “Luxembourg cross-border congestion”. In this
section, it is observed that “the sum of firm capacity, at contractual pressure, on all of the
Luxembourg’s [Transmission System Operator] (Creos) [Interconnection Points] doesn’t cover
the needs of the Luxembourg national market demand”. To address this issue, the report
indicates that “Two different infrastructure projects are under investigation in order to comply
with the capacity requirements by the end of 2018” (Figure 25). It has not been possible to
obtain information on the realisation of either of these projects.
Figure 25 Natural gas pipelines around Luxembourg
Source: ENTSOG (2017)
Figure 26 Cross-border pipeline projects that were proposed in 2013
to reduce congestion in the provision of natural gas to Luxembourg
Source: ENTSOG (2013)
Cooperation perspectives for the Luxembourg Cross-border Functional Region 32Hydrogen A 70km cross-border system for the distribution of hydrogen is currently being built between Völklingen (Germany), Carling (France), Bouzonville (France) and Perl (Germany) at the Luxembourgish border. MosaHYc (Mosel Saar HYdrogen Conversion) will supply clean hydrogen to the transport sector (train, bus, automobiles, trucks,etc.) in Saarland, the Grand Est region and Luxembourg14. Figure 27 MosaHYc distribution system for hydrogen Source: GRTgaz 14 GRTgaz Cooperation perspectives for the Luxembourg Cross-border Functional Region 33
3.4     Electricity production around Luxembourg
In all regions neighbouring Luxembourg, electricity production is equivalent or higher than
consumption (Table 15). The ratio is particularly high in the Grand Est, largely as a result of
extensive generation from nuclear power plants. Rhineland-Palatinate also has a significant
excess production, combined with a large share of renewable energies.

Table 15 Comparison of electricity production and consumption
                                                                                                        North
                   Luxem-                                                          Rhineland-
                                  Grand Est        Wallonia        Saarland                             Rhine-
                    bourg                                                          Palatinate
                                    (2019)           (2018)          (2015)                        Westphalia
                    (2019)                                                           (2017)
                                                                                                        (2017)

 Electricity
 produced               1,043         104,662           27,200         157,906          29,056            10,634
 (GWh)

 Electricity
 consumed               6,555          41,100           24,400         143,710          20,676             9,057
 (GWh)

 Ratio                 15.9 %         254.7 %         111.5 %         109.9 %          140.5 %           117.4 %

Sources: Luxembourg: gouvernement.lu, Wallonia : Iweps, Saarland, Rhineland-Palatinate and
North Rhine Westphalia: Föderal erneuerbar

3.4.1    Grand Est
Electricity production in the Grand Est region is primarily based on nuclear energy (73.4 % in
2019). Renewable energies account for 18,3 % of the production. However, renewable energies
account for 29.9 % of the production capacity (Figure 28). One nuclear plant is located in the
vicinity of Luxembourg, in Cattenom. This plant was built between 1979 and 1986. Luxembourg,
Saarland and Rhineland-Palatinate have asked for this plant to be closed for a number of
years15. However, French authorities foresee to pursue the plant’s operations 16.

Overall, the production of the Grand Est region largely exceeds regional consumption (Figure
29). Excess energy is primarily exported to the Hauts-de-France region and to Germany (Figure
30).

15Luxembourg   Ministry of Health (2012) Sommet informel de la Grande Région à Metz, 26 th June 2012
16Communiqué conjoint du ministère des Affaires étrangères et européennes et du ministère de la Santé
du Luxembourg et de l’Autorité de sûreté nucléaire (France)

Cooperation perspectives for the Luxembourg Cross-border Functional Region                        34
Electricity production from renewable sources is concentrated in different parts of the Grand
Est region depending on the source considered (Figure 31):
- Marne and Aube for wind energy;
- Meurthe-et-Moselle for solar energy;
- Bas-Rhin, Vosges and Marne for biomass;
- Ardennes and Alsace for hydroelectricity.
Figure 28 Electricity produced (2019)
Source: RTE (2019b)
Figure 29 Comparison of electricity production and consumption
in Grand Est region (2019)
Source: RTE (2019b)
Cooperation perspectives for the Luxembourg Cross-border Functional Region 35Figure 30 Energy exports and import in Grand Est-Region (2019) Source: RTE (2019b) Figure 31 Renewable energy production in the Grand Est region Source: Direction régionale de l’environnement, de l’aménagement et du logement (2020) Cooperation perspectives for the Luxembourg Cross-border Functional Region 36
3.4.2   Wallonia
Electricity production in Wallonia is characterised by a large share of nuclear energy (47.8 %),
followed by gas (TGV – “Turbines gaz vapeur”) (26.1 %) (Figure 32). Wind energy accounts for
a relatively high share (11.7 %) compared to neighbouring regions.

Belgian authorities have announced the closure of nuclear plants in 2025. However, policy
discussions are ongoing on a possible extension of this delay. The closure of these plants
seems unlikely as long as alternative solutions are not in place.

Figure 32 Electricity production in Wallonia by source (2016)

Source: Service public de Wallonie (2018)

3.4.3   Saarland
Electricity production in Saarland is characterised by a large share of electricity coming from
hard coal (Table 16). About 56 % of the electricity produced came from coal-fired generation in
2017. The high share can be explained by the regions’ hard coal mining heritage, which has
impacted the structure of industry and that of electricity production. In view of the energy
transition, the score has been decreased from 80 % to today’s level since 2008. The second
largest post are renewable electricity sources, accounting for about 19 % of the region’s energy
production. Most renewable electricity is produced from wind energy (9 %), followed by
photovoltaic energy (5 %) and biomass (3 %). Natural gas presents the third largest electricity
source, accounting for about 18 % of the electricity produced in Saarland.

Cooperation perspectives for the Luxembourg Cross-border Functional Region                   37
Table 16 Electricity production in Saarland by source, 2008 and 2017
 Year                                                              2008                     2017
 Hard coal                                                                     80.2 %                   55.6 %
 Lignite                                                                            0%                    0%
 Natural gas                                                                       6.1 %                 18 %
 Nuclear energy                                                                     0%                    0%
 Other non-renewable and waste                                                     8.6 %                 7.2 %
 Share of renewable energies                                                       5.1 %                19.2 %
                   from wind power                                                 2.1 %                 9.3 %
                   from biomass                                                    1.6 %                 3.1 %
                   from water energy                                               0.8 %                 1.3 %
                   from photovoltaic                                               0.5 %                 5.4 %
                 from other renewable sources                                       0%                    0%
Source: Agentur für erneuerbare Energien (2019),

3.4.4      Rhineland-Palatinate
A large share of electricity production in Rhineland-Palatinate came from renewable sources in
2017 (Table 17). About 48 % comes from renewable sources, with the largest source being
wind energy in Rhineland-Palatinate accounting for about 27 %. Wind energy is followed by
photovoltaic (9%) and biomass (4 %). The second largest source for electricity in Rhineland-
Palatinate is natural gas, accounting for about 47 % of the total electricity produced.

Table 17 Electricity production in Rhineland-Palatinate by source, 2008 and 2017
 Year                                                              2008                    2017
 Hard coal                                                                    0.4 %                       0%
 Lignite                                                                           0%                     0%
 Natural gas                                                                 68.8 %                     47.6 %
 Nuclear energy                                                                    0%                     0%
 Other non-renewable and waste                                                     7%                    4.3 %
 Share of renewable energies                                                 23.8 %                     48.1 %
                  from wind power                                            10.4 %                     28.6 %
                  from biomass                                                4.3 %                       6%
                  from water energy                                           7.1 %                       4%
                  from photovoltaic                                           1.4 %                       9%
                  from other renewable sources                          0.6 %                             0%
Source: Agentur für erneuerbare Energien (2019)
Due to reporting inconsistencies, some deviations are observed between total electricity
production from renewable sources and electricity production by source.

Cooperation perspectives for the Luxembourg Cross-border Functional Region                         38
3.4.5 North Rhine-Westphalia
A large share of electricity produced in North Rhine-Westphalia still comes from coal
combustion (Table 18). 48 % of the electricity produced comes from lignite and 20 % from hard
coal. This means that, in total, 68 % of electricity produced in 2017 resulted from coal
combustion. About 11 % of electricity produced comes from renewable sources. Wind energy
accounts for 6 %, biomass for 4 %, and photovoltaic panels for 2 %.
North Rhine-Westphalia is the most populated region in Germany and has a long history in
industrial production and coal mining. The region is hence also the one with the highest energy
consumption. As a result, about 28 % of Germany’s production facilities are located in North
Rhine-Westphalia.
Table 18 Electricity production in North Rhine-Westphalia by source,
2008 and 2017
Year 2008 2017
Hard coal 27.7 % 19.6 %
Lignite 44.3 % 48.3 %
Natural gas 15.6 % 9.3 %
Nuclear energy 0% 0%
Other non-renewable and waste 8% 12 %
Share of renewable energies 4.4 % 10.8 %
from wind power 2.1 % 5.6 %
from biomass 1.3 % 3.9 %
from water energy 0.4 % 0.4 %
from photovoltaic 0.2 % 2.3 %
from other renewable sources 0.7 % 0.4 %
Source: Agentur für erneuerbare Energien (2019)
Due to reporting inconsistencies, some deviations are observed between total electricity
production from renewable sources and electricity production by source.
Cooperation perspectives for the Luxembourg Cross-border Functional Region 39You can also read