Are Personal Electric Vehicles Sustainable? A Hybrid E-Bike Case Study

Page created by Jeffery Reed
 
CONTINUE READING
Are Personal Electric Vehicles Sustainable? A Hybrid E-Bike Case Study
sustainability

Article
Are Personal Electric Vehicles Sustainable?
A Hybrid E-Bike Case Study
Mihai Machedon-Pisu *              and Paul Nicolae Borza
 Department of Electronics and Computers, Transilvania University of Bras, ov, 500036 Bras, ov, Romania;
 borzapn@unitbv.ro
 * Correspondence: mihai_machedon@unitbv.ro; Tel.: +40-726-392-909
                                                                                                       
 Received: 22 November 2019; Accepted: 14 December 2019; Published: 18 December 2019                   

 Abstract: As the title suggests, the sustainability of personal electric vehicles is in question. In terms
 of life span, range, comfort, and safety, electric vehicles, such as e-cars and e-buses, are much better
 than personal electric vehicles, such as e-bikes. However, electric vehicles present greater costs
 and increased energy consumption. Also, the impact on environment, health, and fitness is more
 negative than that of personal electric vehicles. Since transportation vehicles can benefit from hybrid
 electric storage solutions, we address the following question: Is it possible to reach a compromise
 between sustainability and technology constraints by implementing a low-cost hybrid personal
 electric vehicle with improved life span and range that is also green? Our methodology consists of
 life cycle assessment and performance analyses tackling the facets of the sustainability challenges
 (economy, society, and environment) and limitations of the electric storage solutions (dependent on
 technology and application) presented herein. The hybrid electric storage system of the proposed
 hybrid e-bike is made of batteries, supercapacitors, and corresponding power electronics, allowing
 the optimal control of power flows between the system’s components and application’s actuators.
 Our hybrid e-bike costs less than a normal e-bike (half or less), does not depend on battery operation
 for short periods of time (a few seconds), has better autonomy than most personal electric vehicles
 (more than 60 km), has a greater life span (a few years more than a normal e-bike), has better energy
 efficiency (more than 90%), and is much cleaner due to the reduced number of batteries replaced per
 life time (one instead of two or three).

 Keywords: life cycle assessment; personal electric vehicles; hybrid energy storage system; e-bike

1. Introduction
     In the context of the recent expansion of urban transportation systems, followed by rapid
development of road infrastructure and motorization, the increase in the number of vehicles is
completely justified [1,2]. Hopefully, in the near future, these will be seen as both smart and green
transportation systems [3], and the corresponding infrastructure will be provided [4]. This could lead
to the implementation of smart cities. Until that day, one has to wonder whether these transportation
systems are sustainable [5–8]. In order to sustainably develop transportation systems, the following
factors must be taken into account—economic growth, society demands, and environmental impact.
     Figure 1 illustrates these sustainability challenges and their relation to transport systems, which
need to be considered in order to develop sustainable, green and resilient cities [9]. Figure 1 also
hints out at the need to use the appropriate methodology for implementing the vehicles of tomorrow
(EVs), according to the sustainability challenges mentioned above. Going back in time, the first electric
vehicles have appeared in the first half of the 19th century thanks to Aynos Jedlik in 1828 [10]. In 1834,
Thomas Davenport built a small electric car [11]. Between 1832 and 1839, Robert Anderson invented
the first crude electric vehicle powered by non-rechargeable chemical cells. In 1859, Gaston Planté

Sustainability 2020, 12, 32; doi:10.3390/su12010032                          www.mdpi.com/journal/sustainability
Are Personal Electric Vehicles Sustainable? A Hybrid E-Bike Case Study
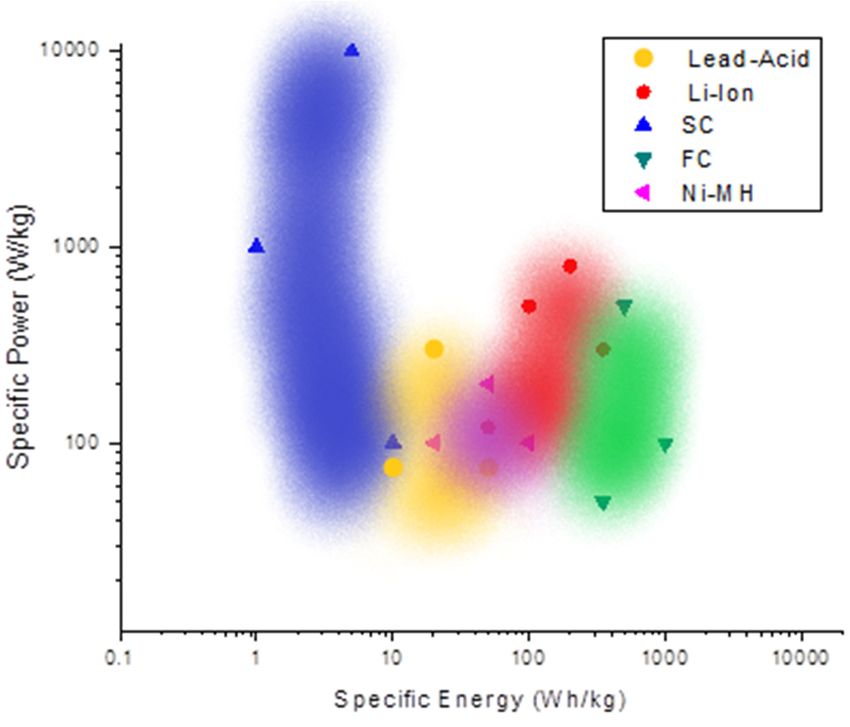
Sustainability 2020, 12, 32                                                                                                                       2 of 24
Sustainability 2019, 12, x FOR PEER REVIEW                                                                                                      2 of 25

invented the first rechargeable battery (lead-acid), thus paving the way for electric cars. In 1901,
Planté invented the first rechargeable battery (lead-acid), thus paving the way for electric cars. In
Ferdinand Porsche invented the first hybrid electric car, the Lohner-Porsche Mixte. Since 1969, General
1901, Ferdinand Porsche invented the first hybrid electric car, the Lohner-Porsche Mixte. Since 1969,
Motors has been preoccupied on developing hybrid driving cars (see GM XP-883 in 1969), and in 1973,
General Motors has been preoccupied on developing hybrid driving cars (see GM XP-883 in 1969),
they proposed a hybrid car prototype due to pollution issues, based on the previous model of the Buick
and in 1973, they proposed a hybrid car prototype due to pollution issues, based on the previous
Skylark. This prototype was designed by Victor Wouk. In 1997, Toyota developed the Prius, the first
model of the Buick Skylark. This prototype was designed by Victor Wouk. In 1997, Toyota developed
mass production hybrid car.
the Prius, the first mass production hybrid car.

                                     Figure
                                     Figure 1.
                                            1. Sustainability
                                               Sustainability challenges
                                                              challenges for
                                                                          for transport
                                                                               transport systems.
                                                                                         systems.

       The
       The technologies
              technologies for      for transport
                                         transportsystemssystemshave  havealways
                                                                              alwayslooked looked   forfor  compromises
                                                                                                         compromises         thatthat
                                                                                                                                    cancan    smooth
                                                                                                                                          smooth       the
the  transition       from      motor     vehicles       with    ICE    to  electric     cars.    Thus,
transition from motor vehicles with ICE to electric cars. Thus, “mild hybrid” cars have been developed,    “mild      hybrid”      cars   have     been
developed,
which are capable which are        capable offuel
                              of reducing          reducing       fuel consumption
                                                         consumption          by 5–7%. by      This5–7%.    Thisby
                                                                                                       is done      is done     by recovering
                                                                                                                        recovering       the braking  the
braking
energy and   energy      and by optimizing
                  by optimizing          the operating   the curves
                                                               operating      curves
                                                                         of the  ICE as   of athe    ICEofasadding
                                                                                                result          a result    of adding
                                                                                                                         a certain    power  a certain
                                                                                                                                                supply
power
from a small electric car [12]. The demand for energy storage on board has led to the increase to
          supply      from      a small    electric     car   [12].  The   demand         for  energy      storage     on   board    has   led   in the
                                                                                                                                                      the
increase
standardin       the standard
              voltage                 voltage of
                           of the electrical           the electrical
                                                   energy                 energyper
                                                              sources energy         sources
                                                                                           vehicle energy
                                                                                                       from per
                                                                                                              12 orvehicle
                                                                                                                      24 V tofrom48 V,12   or 24 V to
                                                                                                                                         respectively,
48 V, respectively,
above     hundreds of above   volts for hundreds
                                           pure electric of volts    for pure
                                                                vehicles.        electric
                                                                             Also,    plug-in  vehicles.
                                                                                                   electricAlso,
                                                                                                              vehiclesplug-in
                                                                                                                            withelectric
                                                                                                                                   increased  vehicles
                                                                                                                                                  range
with   increased        range      when     operating         in  an   electric   regime        have
when operating in an electric regime have been proposed, being known as “extended ranger” systems.       been    proposed,       being     known        as
“extended       ranger”the
They can increase             systems.
                                   range They
                                            of thecan      increase
                                                       vehicle,    butthe
                                                                        withrange     of the vehicle,
                                                                               a sacrifice       in nominal  but performance
                                                                                                                  with a sacrifice        in nominal
                                                                                                                                      [13].
performance         [13].
       The main types of EVs can be classified in two categories—(i) heavy-duty and medium EVs, like
       Thetrams,
electric     main typestrains,oftrucks,
                                     EVs can      be classified
                                              buses     and e-cars, in two
                                                                         andcategories—(i)
                                                                               (ii) light EVs (LEVs)   heavy-duty        and medium
                                                                                                                or personal       electricEVs,       like
                                                                                                                                              vehicles
electric
(PEVs), trams,        trains,motorcycles,
            like electric         trucks, buses         and e-cars,
                                                    scooters,            and (ii)PEVs
                                                                  and bikes.        lightcan  EVsbe(LEVs)       or personal
                                                                                                       also split    into medium  electric    vehicles
                                                                                                                                         battery     EVs
(PEVs),    like   electric     motorcycles,         scooters,     and   bikes.   PEVs       can
(BEVs), such as e-motorcycles, big e-scooters, and small BEVs, like e-bikes and small e-scooters. be  also  split   into   medium       battery     EVs
(BEVs),    such as
       Heavier       EVse-motorcycles,
                             are made upbig            e-scooters,
                                                  of electric          and and
                                                                  motors     small     BEVs, like
                                                                                   batteries            e-bikes
                                                                                                   together        andor
                                                                                                                 with     small    e-scooters.
                                                                                                                             without      ICE or fuel
       Heavier      EVs     are   made     up     of  electric   motors     and    batteries       together
cells, while smaller EVs, such as PEVs, use only motors and batteries and possibly also other storage           with     or without      ICE    or fuel
cells, while      smaller      EVs,    such    as  PEVs,     use   only   motors     and      batteries
elements. For example, e-bikes can be electric assisted, battery-based, or hybrid (e.g., batteries and     and    possibly     also   other    storage
elements.
supercapacitorsFor example,           e-bikes and
                         (SCs), batteries         can fuel
                                                         be electric     assisted,
                                                               cells (FCs)).    A clearbattery-based,         or hybrid
                                                                                             distinction should               (e.g., between
                                                                                                                         be made      batteriestheseand
supercapacitors           (SCs),     batteries     and    fuel   cells   (FCs)).    A    clear    distinction
terms, as it is not always clear, as in reference [14]. Electric assisted bikes, or electrically power assisted    should      be   made     between
these
bikes terms,
         (EPAC),   as or
                       it is  not always
                           pedelecs,       get clear,     as in reference
                                                 propulsion        by means[14].  of an Electric
                                                                                            electric assisted
                                                                                                         motorbikes,
                                                                                                                  connectedor electrically
                                                                                                                                  to batteries  powerand
assisted     bikes     (EPAC),        or   pedelecs,       get   propulsion        by    means
still can be pedaled by the rider. E-motorcycles cannot be pedaled, as they are only battery-based.   of  an   electric    motor      connected         to
batteries     and    still   can    be  pedaled        by   the   rider.   E-motorcycles           cannot
They are also known as BEVs. Hybrid e-bikes, or HESS bikes [15], which belong to the class of assisted        be  pedaled,       as  they    are   only
battery-based.
hybrid vehiclesThey     (AHVs), are also    known as BEVs.
                                      use additional         storageHybrid
                                                                        elements,e-bikes,      or HESS bikes [15],
                                                                                       like supercapacitors,                which
                                                                                                                       to drive    thebelong
                                                                                                                                        motorto   whenthe
class
battery of operation
            assisted hybrid            vehicles (AHVs), use additional storage elements, like supercapacitors, to
                            is not required.
driveUnfortunately,
        the motor whenthe          battery
                                        currentoperation       is not required.
                                                       development          of vehicles can have a damaging effect on the
       Unfortunately,
environment         [16]. Airthe        currentcaused
                                   pollution          development
                                                             by different  ofclasses
                                                                                vehicles        can have
                                                                                         of vehicles            a damaging
                                                                                                          is discussed               effect on
                                                                                                                            in references             the
                                                                                                                                               [17–20].
environment         [16].   Air    pollution      caused      by   different   classes      of  vehicles
In order to reduce the effects of pollution and the dependence on oil, electric vehicles (EVs) should        is discussed       in  references     [17–
20].  In order
replace              to reduce
           conventional          carsthe    effects
                                        (diesel    andofgasoline)
                                                             pollution  in and   the dependence
                                                                           the future        [21,22]. Theon       oil,traffic
                                                                                                               high      electric
                                                                                                                                canvehicles
                                                                                                                                      be diverted(EVs)   in
should     replace      conventional          cars    (diesel   and    gasoline)      in   the   future
large cities by opting for smaller EVs (PEVs and LEVs), such as electrical two-wheelers (e.g., e-bikes     [21,22].    The    high    traffic   can     be
diverted      in largethat
and e-scooters)            cities    by opting
                                consume        and for     smaller
                                                      pollute    less,EVs    (PEVs
                                                                        instead         and LEVs),
                                                                                   of heavier              such such
                                                                                                     vehicles,    as electrical
                                                                                                                          as cars andtwo-wheelers
                                                                                                                                           buses [23].
(e.g., e-bikes     and     e-scooters)       that    consume       and    pollute    less,
As discussed in reference [19], greenhouse gas (GHG) emissions are much lower for e-bikes     instead     of  heavier     vehicles,     suchthanas carsfor
and   buses     [23].   As   discussed        in  reference      [19],   greenhouse         gas   (GHG)
other EVs. As seen in Table 1, e-bikes have less energy consumption, lower maintenance and purchase          emissions       are  much      lower     for
e-bikes     than for
costs, require        lessother
                              travelEVs.timeAs       seen in Table
                                                 in congested               1, and
                                                                      traffic,  e-bikes are have        less to
                                                                                               beneficial     energy
                                                                                                                  human    consumption,          lower
                                                                                                                               health and fitness.
maintenance
E-bikes and other   and purchase
                            EVs present    costs,     require
                                                several           less travel
                                                            limitations     and time
                                                                                  issuesinsuch congested
                                                                                                      as lack traffic,     and are beneficial
                                                                                                                of infrastructure        and unitary    to
human      health     and     fitness.    E-bikes      and    other   EVs    present      several
regulations in safety, speed, and power; reduced autonomy and life span. But, crowded cities still    limitations      and    issues   such     as  lack
of infrastructure
require    solutions and   that unitary
                                   should implyregulations
                                                         green in and safety,   speed,smart
                                                                         sustainable          and power;        reducedsystems
                                                                                                     transportation          autonomy   [16]andthat life
                                                                                                                                                       are
span. But, crowded cities still require solutions that should imply green and sustainable smart
transportation systems [16] that are also beneficial to human health and fitness, or at least not
damaging. Of course, the traditional bike is also green and does not consume any energy except for
Sustainability 2020, 12, 32                                                                           3 of 24

also beneficial to human health and fitness, or at least not damaging. Of course, the traditional bike is
also green and does not consume any energy except for human effort. However, human effort is very
limited, and older people, those with health issues, or those not fit enough can reduce the trip time
significantly and cut the benefits of owning a bicycle. Some health benefits of e-bikes are presented
in reference [24]. E-bikes and e-motorcycles are compared to the conventional ones in reference [25].
Reductions in human effort and variations of heart rate were reported for these small EVs. Reduction in
travel time was also observed for e-bikes, but not for e-motorcycles. As mentioned in reference [26],
e-bikes were reported with the shortest travel time in congested traffic: less than 5 km. It is also possible
to transform a conventional bike into an electrical assisted bike, as mentioned in reference [27], but one
has to think about costs and gain in performance, as you cannot always get the best of both worlds.
Sustainability 2020, 12, 32                                                                                                                                                                           4 of 24

                                                          Table 1. Typical characteristics of different types of transportation vehicles.

                                        Cars, Trains, Trams,                                                         Motorcycles, Big                Bikes, Small
          Characteristic                                                Medium and Heavy-Duty EVs                                                                                     E-Bikes
                                          Trucks, Buses                                                              Scooters, Mopeds                  Scooters
         Air pollution                  4–30 1 kilotons/year                2–5 1 kilotons/year             10 1 kilotons/year             Negligible *           1–2 1 kilotons/year
     Health & fitness factor                                     No impact on fitness, no health benefits *                                           Beneficial to both 7
        Infrastructure                           Yes *                                  Conditional Yes: Road *                                   Cond. Yes: Bike lane/road *
                                                                                                                                                              Medium to low 3 (when
               Safety                   High (industry regulations) to medium (when on road) *                            Medium (when on road) *
                                                                                                                                                               on road + high speed)
                                                                                                                   mopeds: 45 km/h *,
    Limits in speed, power,                                                                                                                                    25–32 km/h,100–750 W,
                                                                       No*                                        motorcycle: Tens of kW   100–300 W *
            weight                                                                                                                                                      160,000 km *(e-cars); –(e-trucks)            25,000–50,000 8 km                15,000 8 km               4000–15,000 8 km
                                       0.5–1*10 6 km (trucks)
        Recharging time                           -                     Tens of minutes to few hours **                        -                            -                          5–8h6
                                                                           High to medium: A few
                                    High: Up to thousands of
                                                                                hundreds of km                      Medium: Daily use,                                      Medium to low: Hours,
               Range                 km * (infrastructure &                                                                                                 -
                                                                          *(storage-dependent, max.                  hundreds of km *                                            45–50 km 5
                                      storage-dependent)
                                                                                   500 km)
                                                                                                                   (Cong.) 15–20 min *;
             Trip time                        (Congested) 15–35 min 4 ; (Light traffic) 5min *                                                        30min–1h *                   15–20 min 4
                                                                                                                  (Light tr.) 5–10 min *
          Purchase costs                              Tens/hundreds of thousands € *                                 3000 to 10,000 € *             below 1000€ *                 500 to 5000 € *
                                                                                                                  Medium: Hundreds to
       Maintenance costs                              High: Up to tens of thousands €                                                                     Low to medium: Hundreds of € *
                                                                                                                     thousands of € *
      * According to estimations; ** dependent on charger and battery type; 1 according to references [2,17,19,20], based on average values for the sum of main pollutants: CO (carbon monoxide),
      NOx (nitrogen oxides), VOC (volatile organic compounds), and PM10 (particulate matter that have 10 micrograms per cubic meter or less in diameter); 2 according to reference [28];
      3 according to references [29,30]; 4 according to reference [26], based on average values for car/bus and e-bike, up to 5 km; 5 according to reference [21], based on average values; 6 according

      to references [31,32]; 7 according to reference [25]; 8 according to reference [33].
Sustainability 2020, 12, 32                                                                                                        5 of 24

     Performance is rather a complex task to quantify, as it comprises of various facets. Many studies
have tried to cover a least a part of these facets, such as dynamic performance (speed, power, range and
acceleration, according to local regulations, see Table 1) [17,21,31], energy consumption analysis (stored
vs. used energy, autonomy, charging time, storage characteristics, see Tables 2 and 3) [21,25,26,33],
functional performance (energy efficiency, temperature domain and other environmental parameters,
route optimization, and minimizing daily accelerations and braking) [25,26], and sustainability
(cyclability/durability that affects life span, state of charge characteristics) [29,34]. Most of these facets
area direct result of the constraints on the design of EVs [35]. As seen in Figure 2, the e-Mobility
design [36] is based on a reservoir of energy (energy source) powering an actual vehicle. Even if the
design is simplified, its implementation is not that simple due the performance constraints discussed
previously, which can become difficult to comply with.

      Table 2. Life cycle assessment (LCA) for personal electric vehicles (PEVs) and medium battery electric
      vehicles (BEVs).

                Metric                Conventional Bike             E-Bike                 BEV *         Conventional Motorcycle
                                        Environmental impact (emissions and other products)
                                                           Main Pollutants
               CO (g/km)                       -                   0.02 3                2.1–8.47 2          1.7–5 6 ; 12.5–18 3
                                                                            3                       2           0.05–0.15 3 ;
              NOx (g/km)                       -                     0.06               0.11–0.37
                                                                                                                 0.1–0.34 6
              HC (g/km)                        -                      -             0.29–1.16 2                 0.56–4.69 6
             PM10 (g/km)                       -                   0.02 3                -                      0.06–0.33 3
             PM2.5 (g/km)                      -                   0.01 3                -                      0.03–0.16 3
              SO2 (g/km)                       -                   0.13 3                -                            03
              HC (g/km)                        -                  0.007 3                -                             -
              CO2 (g/km)                       -                   21.5 3         20.2–40.53 ; 308            40–553 ; 68–1056
                                                 Production/Manufacturing Processes
               SO2 (kg)                     0.275 2               1.563 2             2.198 2                       12
               PM (kg)                      1.176 2               5.824 2             8.173 2                       42
           GHG(tones SCE)                   0.097 2               0.603 2             0.875 2                     0.284 2
           Waste water (kg)                  393 2                 1488 2              2092 2                     1397 2
           Solid waste (kg)                 0.641 2               4.463 2             7.139 2                       32
                                           Life Cycle of Lead Acid Battery Based Vehicles
              CO2 (g/km)                     4.7 3              15.6–31.2 3         20.2–40.5 3                  64–128 3
              SO2 (g/km)                    0.01 3              0.07–0.14 3         0.09–0.17 3                 0.04–0.08 3
              PM (g/km)                     0.06 3              0.07–0.14 3          0.1–0.19 3                  0.2–0.4 3
              CO (g/km)                        -               0.007–0.014 3       0.009–0.017 3                 6.3–12.5 3
              HC (g km)                        -               0.027–0.053 3       0.032–0.064 3                1.13–2.25 3
              NOx (g/km)                       -                0.01–0.02 3        0.014–0.027 3                0.08–0.15 3
              Pb (mg/km)                      03                 145–290 3           210–420 3                    16–32 3
                                                            Energy impact
                                                      Energy Used When Operating
                                           10                    0.19 9 –0.52 1 ;     4.68–14.97 1 ;
     Energy consumption (MJ/user)      0.25 ; 69.44 Wh                                                                -
                                                                52.77–144.4 Wh       1300–4160 Wh
                                                                     0.028 1 ;           0.73 9 ;              0.67–0.85 9 ;
        Energy per km (MJ/km)        0.013 1 ; 3.62 Wh/km
                                                                  7.78 Wh/km          203 Wh/km              186–236 Wh/km
     Energy use (kWh/100 pax-km)              4.88 3                3.8–7.6 3        4.9–9.9 3 ; 5.7 7           21–42 3
            Battery (kWh)                        -                    0.36 9           1.68–5.4 9                   -
                                                    Energy Used Per Activity(KJ/PKT)
            Fuel production                     05                    1.25 5                -                   50–150 **
             Infrastructure                   126 5                    126 5                -                   200–500 **
              Maintenance                      5.5 5                   5.5 5                -                   60–150 **
            Manufacturing                      66 5                    87 5                 -                   140–200 **
               Operation                        05                      05                  -                   600–700 **
                                                     Energy Used Per Life Cycle (MJ)
              Manufacture                        -                   12,000 4           20,000 4                      -
                   Use                           -                   87,000 4           265,000 4                     -
                 Disposal                        -                    1200 4             3000 4                       -
     Life cycle energy consumption               -                  102,000 4           288,000 4                     -
      * E-cars and small e-scooters are excluded, ** according to estimations, 1 according to Reference [21] for Well-to-Wheel
      (WTW) analysis, 2 according to Reference [17] for test scenarios in Italy, 3 according to Reference [23] for the models
      used, lead losses are considered for a recycle rate from 100 to 90%, 4 according to Reference [37], 5 according
      to Reference [38], PKT is passenger occupancy-km-traveled, 6 according to Reference [18] for test scenarios in
      Switzerland, 7 according to Reference [39], 8 according to Reference [40], 9 according to Reference [25], 10 according
      to Reference [41].
23 4–24 3;                65.8 2; 140 4–144 3;
    Total weight (kg)                   15 6;17 3; 18 2                                                                                 90 3,4; 94 2
                                                                  26 1–41 2                        80–208 5
          Steel                          13 2                       18.2 2                           26.22                                   76.4 2
         Plastic                          22                         5.7 2                           15.22                                   9.1 2
          Sustainability 2020, 12, 32                                                                                                         6 of 24
          Lead                             -                        10.3 2                           14.72                                   1.7 2
         Nickel                            -                           -                                 -                                   0.3 3
          Fluid Table 3. Environmental- impact of lead-acid battery-based
                                                                     2.92                vehicles—materials
                                                                                                      4.22          and battery losses. -

        Copper                             -                         2.62                             3.52                  Conventional1
                                                                                                                                                 2
                          Metric               Conventional Bike              E-Bike                     BEV *
                                                                                                                             Motorcycle
         Rubber                           2  2                       1.1 2                           1.2     2                               3.2 2
                                                             Weight  of materials    used
      Aluminum                            12                         0.5 2                           0.6 2                                   1.5 2
                                                    6     3  2              23 4 –24 3 ;         65.8 2 ; 140 4 –144 3 ;          3,4      2
                    Total weight (kg) 50%Plastic,15 ;17 ; 18 50%Plastic,1                        10%Steel,                    90 ; 94   10%Steel,
      Maintenance                                                           26 –41 2                  80–208 5
                                                          2                          2                          2                      2
                           Steel       5%Steel   4    13         5%Steel 18.2 4             10%Aluminum   26.2          4        10%Aluminum
                                                                                                                                 76.4                     4
                          Plastic                     22                        5.7 2                     15.22                   9.1 2
                           Lead            Lead Acid    - Battery Losses       10.3(kg
                                                                                     2    Per Battery)    14.72                   1.7 2
     Battery weight       Nickel           -            -         10.3 kg    2    -          14.7 kg ; 32 kg
                                                                                                         2  -          4          0.3 3 1.7 kg 2
                           Fluid                        -                       2.9 2                     4.2  2                     -
      Mining and Copper                                 -                    2 2.6
                                                                                    2                     3.52 2                   1 2 0.17–0.19 2
                                           -                      1.1–1.2                          1.5–1.7
   concentration loss     Rubber                      22                        1.1 2                     1.2 2                   3.2 2
                        Aluminum                      12                        0.5 2                     0.6  2                  1.5 2
  Smelt loss (primary)                     -                         0.4 2                           0.6     2
                                                                                                      10%Steel,                        0.06–0.07 2
                                                                                                                               10%Steel,
                       Maintenance            50%Plastic, 5%Steel 4 50%Plastic,     5%Steel 4                         4                        4
    Smelt loss (sec.)                      -                       0.9–1   2                       1.3–1.4
                                                                                                 10%Aluminum      2        10%Aluminum 0.14–0.16        2

   Manufacture loss                        -        Lead Acid Battery0.5Losses
                                                                         2       (kg Per Battery) 0.7 2                                      0.082
                      Battery weight                    -                   10.3 kg    2                    2
                                                                                                  14.7 kg ; 32 kg     4         1.7 kg   2
    Total production
             Mining and concentration loss -            -          2.9–3 21.1–1.2 2                4.2–4.3
                                                                                                       1.5–1.722              0.17–0.190.48–0.49
                                                                                                                                           2            2
       emissions  Smelt loss (primary)                  -                       0.4 2                     0.6  2              0.06–0.07    2

      Solid wasteSmelt loss (sec.)         -            -           0–1 2 0.9–12 2                  0–1.5
                                                                                                      1.3–1.4
                                                                                                               2
                                                                                                                2 2                        2
                                                                                                                              0.14–0.160–0.17
                                                                                                                                       2
                                                                                                                                                      2
                      Manufacture loss                       -                      0.5                     0.7                    0.08
      * E-cars Total
                andproduction
                      small e-scooters
                                emissions   are excluded,
                                                        -        1 according to
                                                                             2.9–3 2 reference [17] 4.2–4.3for
                                                                                                            2   test scenarios
                                                                                                                           0.48–0.49 2in Italy, 2
                      Solid waste                       -                     0–1 2                  0–1.5 2                 0–0.17 2
      according to reference [23] for the models used, lead losses                    are considered         for a recycle      rate from 100
                * E-cars and small e-scooters are excluded,  1 according to reference [17] for test scenarios           2
                                                                                                               in Italy, according to
                3 according
      to 90%, reference          tothereference
                          [23] for                [33],
                                       models used,
                                                          4 according
                                                    lead losses           to reference
                                                                 are considered  for a recycle[39],
                                                                                                     5 according
                                                                                               rate from  100 to 90%, to    reference
                                                                                                                        3 according   to [25],
                                                                                                                                                6
                               4                             5                             6
      accordingreference  [33], according
                   to reference     [41]. to reference [39], according to reference [25], according to reference [41].

                              FigureFigure
                                     2. Methodology    forfor
                                           2. Methodology   developing   sustainable
                                                              developing sustainable   EVs
                                                                                     EVs     (e-Mobility).
                                                                                         (e-Mobility).

                   Starting from Figure 2, state the research question of this paper is whether it possible to provide
     Starting from Figure 2, state the research question of this paper is whether it possible to provide
         an appropriate methodology for implementing a sustainable design of hybrid electric transportation
an appropriate
         systemsmethodology
                  in the context offor implementing
                                    current              a sustainable
                                            storage solutions               design
                                                               (Li-ion batteries, SC,of hybrid
                                                                                      FC) [42] in electric  transportation
                                                                                                  order to increase
systems in  the
         their   contexton
               autonomy,   ofone
                              current
                                  hand, storage
                                        and reducesolutions   (Li-ion
                                                    the costs and       batteries,
                                                                   impact            SC, FC)on[42]
                                                                           on environment,           in order
                                                                                                 the other.      to increase
                                                                                                            In order
            to provide an answer, the paper is organized as in Figure 3.
Sustainability 2019, 12, x FOR PEER REVIEW                                                                                 7 of 25

their autonomy,
Sustainability 2020, 12,on
                         32one hand, and reduce the costs and impact on environment, on the other. In order
                                                                                                      7 of 24
to provide an answer, the paper is organized as in Figure 3.

                    Figure 3. Methodology proposed in paper for developing sustainable PEVs.
                    Figure 3.

      In the
          theintroduction,
               introduction, wewe presented
                                       presentedthe current   state ofstate
                                                      the current       vehicles
                                                                               of in terms ofin
                                                                                   vehicles     sustainability,   emphasizing
                                                                                                   terms of sustainability,
on  the vehicles
emphasizing     onofthe
                      thevehicles
                           future—EVs,       as justified inas
                                    of the future—EVs,          Table   1. In in
                                                                   justified   Section
                                                                                  Table 2,
                                                                                         1. the  performance
                                                                                             In Section           of small and
                                                                                                          2, the performance
medium     EVs,medium
of small and     which include     PEVs, include
                           EVs, which       is analyzed
                                                      PEVs, in terms   of life cycle
                                                               is analyzed            assessment
                                                                               in terms              (LCA),
                                                                                          of life cycle       thus addressing
                                                                                                          assessment     (LCA),
the
thussociety   requirements
       addressing              (and requirements
                      the society      the need for compromise)
                                                           (and the need   for building    green transportation
                                                                                 for compromise)         for building  systems,
                                                                                                                          green
transportation
with              systems,aswith
      less lead batteries,           less lead
                                justified         batteries,
                                           in Tables    2 and as3. justified
                                                                   Section 3in    Tablesthe
                                                                               presents   2 and    3. Section 3ofpresents
                                                                                               characteristics                the
                                                                                                                    the storage
characteristics
elements          of the
            used for  suchstorage    elements used
                             EVs underlining        theirfor  such EVs presented
                                                           limitations,    underlining  in their
                                                                                           Tableslimitations,
                                                                                                     4–6. Section presented
                                                                                                                    4 analyzes in
Tables
the       4–6. Section
     possibility  to employ4 analyzes
                               a hybrid the       possibility
                                            storage               to employ
                                                       system based               a hybrid storage
                                                                         on supercapacitors                system
                                                                                                   (SC) and/or       based
                                                                                                                  fuel         on
                                                                                                                        cells for
supercapacitors
PEVs   in terms of(SC)
                     LCA, and/or
                             as seenfuel
                                       in cells
                                          Tablefor 7. PEVs    in terms
                                                      This section       of the
                                                                       and   LCA,   as emphasize
                                                                                  next  seen in Table  the7.methods
                                                                                                             This section
                                                                                                                        that and
                                                                                                                             can
the nextthe
provide     emphasize     the between
              right balance      methodsthe   that   can provide
                                                 benefits              the right
                                                            and limitations         balance
                                                                                of such  storagebetween
                                                                                                    elementsthe(SC
                                                                                                                 benefits
                                                                                                                    and FC)  and
                                                                                                                               in
limitations of
conjunction      such
               with     storage
                     Li-Ion        elements
                             batteries,  in order(SCtoand    FC) in conjunction
                                                         implement      hybrid storage with    Li-Ionfor
                                                                                          systems      batteries,
                                                                                                          PEVs, asinillustrated
                                                                                                                       order to
implement
in            hybrid 5storage
   Table 8. Section      proposes systems    for PEVs,
                                      a low-cost     hybridas illustrated    in Table
                                                               bike that tackles        8. Section
                                                                                     most             5 proposes
                                                                                             sustainability    issuesa low-cost
                                                                                                                       of PEVs,
hybrid
as        bike that in
   demonstrated      tackles
                        Tablemost      sustainability
                                9. Section     6 presentsissues     of PEVs, the
                                                             and discusses      as demonstrated
                                                                                    guidelines for in      Table 9.green
                                                                                                        designing     Sectionand6
presents andvehicles
sustainable     discusses   the guidelines
                         containing     hybrid   for designing
                                                   electric  storagegreen  and sustainable
                                                                        systems    (HESS), basedvehicles   containing
                                                                                                      on the   findingshybrid
                                                                                                                          of the
electricSection
paper.    storage7 presents
                    systems the(HESS),     based onofthe
                                   main findings          thisfindings    of thetopaper.
                                                               paper, related       the used  Section   7 presents
                                                                                                methodology           the main
                                                                                                                 for designing
findings of PEVs
sustainable    this paper,
                      and therelated    to the used
                                performance        of ourmethodology         for designing
                                                           solution for PEVs—a         hybridsustainable
                                                                                                 e-bike with PEVs
                                                                                                                SC and  and   the
                                                                                                                          Li-Ion
performance
battery         of our solution for PEVs—a hybrid e-bike with SC and Li-Ion battery storage.
          storage.

2. Life Cycle
2. Life Cycle Assessment
              Assessment
      Apart   from the
      Apart from      the immediate     consequences of
                          immediate consequences             of safety,
                                                                safety, health,
                                                                          health, range,
                                                                                    range, and
                                                                                            and cost
                                                                                                   cost on
                                                                                                         on EV
                                                                                                             EV usage,
                                                                                                                 usage, aspects
                                                                                                                          aspects
already
already presented
           presentedininTable    1, another
                             Table   1, anotheraspect,   life cycle
                                                     aspect,     life assessment      (LCA) is(LCA)
                                                                       cycle assessment           relevant
                                                                                                         is for  EVs, especially
                                                                                                             relevant   for EVs,
in terms of in
especially    environmental      impact and energy
                 terms of environmental          impactconsumption.            PEVs consume
                                                            and energy consumption.                less energy
                                                                                                 PEVs   consume  andless
                                                                                                                       cause   less
                                                                                                                          energy
pollution   than   heavier  EVs.
and cause less pollution than heavier EVs.
      Table
      Table 22presents
                presentsthetheLCA
                                LCAimpact
                                       impactofofPEVsPEVs andandcan   be be
                                                                    can   seen   as an
                                                                              seen      extension
                                                                                    as an  extension of Table  1. Although
                                                                                                         of Table   1. Althoughthis
type  of analysis    implies   some   uncertainty      due    to  changes     in technology,     rider
this type of analysis implies some uncertainty due to changes in technology, rider behavior [38], lack  behavior    [38], lack   of
standard
of standard methodology,
               methodology,   andandmetrics
                                      metrics  forfor
                                                    dynamic
                                                      dynamicperformance
                                                                    performance[33,39],
                                                                                     [33,39],ititcan
                                                                                                  canstill
                                                                                                       stillbe
                                                                                                            beused
                                                                                                                used for
                                                                                                                      for testing
                                                                                                                          testing
the
the sustainability
    sustainability of  of an
                          an EV,
                             EV, but
                                   but only
                                        only if
                                              if it
                                                 it is
                                                    is correlated
                                                       correlated with with other
                                                                              other types
                                                                                     types ofof analysis
                                                                                                 analysis that
                                                                                                            that can
                                                                                                                 can guarantee
                                                                                                                       guarantee
the
the static
     static and
            and dynamic
                  dynamic performance           metrics related
                              performance metrics          related to to the
                                                                          the application’s      requirements. Today,
                                                                               application’s requirements.         Today, from
                                                                                                                             from
the
the application      point of
     application point      of view,
                                view, the
                                        the advances
                                             advances in    in power
                                                                power electronics
                                                                           electronics permit
                                                                                         permit cheap
                                                                                                    cheap and
                                                                                                            and very
                                                                                                                  very efficient
                                                                                                                         efficient
commutation       solutions [36].
commutation solutions         [36]. In
                                     In this
                                         this sense,
                                              sense, PEVs
                                                       PEVs could
                                                                could be be seen
                                                                              seen as
                                                                                    as the
                                                                                       the right
                                                                                            right candidate
                                                                                                    candidate forfor testing
                                                                                                                     testing thethe
control  strategies   of EVs  at a smaller   scale.   In order    to meet    the sustainability    challenges,
control strategies of EVs at a smaller scale. In order to meet the sustainability challenges, e-bikes,           e-bikes,  which
are oneare
which     of the
              onemost    promising
                    of the            PEVs, permit
                             most promising         PEVs,the permit
                                                               appropriate      compromisecompromise
                                                                         the appropriate         between most      performance
                                                                                                                 between     most
metrics   due  to  their customizable      design.
performance metrics due to their customizable design.
Sustainability 2019, 12, x FOR PEER REVIEW                                                                                                             8 of 25
Sustainability 2020, 12, 32                                                                                                                            8 of 24
 Sustainability 2019, 12, x FOR
         A European             PEERanalyzed
                             study   REVIEW
                                      the economic and social impact of owning an e-bike,       8 of in
                                                                                                     25 reference

  [43], reporting study
     AAEuropean   fuel savings of ~300
                        analyzed        € per year,
                                  theeconomic
                                      economic      ansocial
                                                        acceptance
                                                andsocial    impact  rate of 70%,  and  a safe  operation[43],
                                                                                                            since
         European study analyzed the           and         impact of of owning
                                                                      owning  an an e-bike,
                                                                                 e-bike,    in reference
                                                                                         in reference
  no incidents
reporting       were reported.
           fuel savings of ~300 € per year, an acceptance rate of 70%, and a safe operation since no
 [43], reporting fuel savings of ~300 € per year, an acceptance rate of 70%, and a safe operation since
incidents
 no incidents   were
                   werereported.
                          reported.
   3. Performance Analysis of Main Storage Solutions for PEVs
3.3.Performance
     Performance        AnalysisofofMain Main    Storage Solutions      for PEVs
           As can Analysis
                        be observed        in Storage
                                                Figure Solutions
                                                         4, whenforcomparing
                                                                       PEVs         lead-acid battery–based conventional
   motorcycles
        Ascan
       As      canbebetoobserved
                          e-bikesinand
                     observed             heavier
                                      in Figure
                                     Figure        4,PEVs,
                                              4, when  when  such  as lead-acid
                                                                       e-scooters,
                                                               comparing
                                                         comparing                  thebattery–based
                                                                            lead-acid    latter have
                                                                                 battery–based          a more     negative
                                                                                                          conventional
                                                                                                    conventional     motorcyclesimpact
 motorcycles
to on   life cycle
    e-bikes        to  e-bikes  and
                      in termsPEVs,
                and heavier          heavier
                                  of Pbsuch     PEVs,
                                          (mg/km)      such  as e-scooters,
                                                       and SO2 the
                                                as e-scooters,   (mg/km)    the latter
                                                                     latter [23].
                                                                            have E-bikeshave  a more   negative
                                                                                             and otherimpact
                                                                                   a more negative        PEVs on impact
                                                                                                                   have
                                                                                                                      lifeacycle
                                                                                                                              shortinlife
 on
terms lifeofcycle
   span,     and   in
             Pb (mg/km)terms and
                   therefore   ofthe
                                  PbSO
                                     (mg/km)
                                     disposal
                                         (mg/km) and
                                                  of  SO2 (mg/km)
                                                      batteries
                                                     [23].       can
                                                           E-bikes   [23].
                                                                      have
                                                                    and    E-bikes
                                                                             a
                                                                         other veryand
                                                                                PEVs     otheraPEVs
                                                                                      negative
                                                                                        have     impact
                                                                                                short  have
                                                                                                       life ona short
                                                                                                            span,      lifetherefore
                                                                                                                 environment
                                                                                                                    and           [44].
                                       2
 span,
   When    andit therefore
                 comes    to the  disposal
                              energy         of batteries
                                        consumption,       can have
                                                          energy     a
                                                                   use very
                                                                        (kWh)negative
                                                                                has     impact
                                                                                      the        on
                                                                                           largest   environment
the disposal of batteries can have a very negative impact on environment [44]. When it comes to energy 5.
                                                                                                    impact,    as    [44].
                                                                                                                  seen    in  Figure
 When
   This canit comes    to energy consumption,
                  be attributed                     energy   usestorage.
                                                                 (kWh) has   the largest  impact, asmain
                                                                                                      seen performance
                                                                                                             in Figure 5. metrics
consumption,          energy useto(kWh)the influence    of EV
                                              has the largest    impact,Table
                                                                           as seen4 analyzes
                                                                                     in Figurethe5. This can     be attributed to
 This can be attributed to the influence of EV storage. Table 4 analyzes the main performance metrics
theofinfluence
       the mostof    used    storage elements
                        EV storage.                 that provide
                                         Table 4 analyzes           the necessary
                                                              the main   performance   energy   andofpower
                                                                                          metrics       the mostfor the
                                                                                                                    usedpropulsion
                                                                                                                             storage
 of the most used storage elements that provide the necessary energy and power for the propulsion
   of  PEVs.
elements
 of PEVs. that provide the necessary energy and power for the propulsion of PEVs.

                                                                      10 10                               9.4 9.4
                                                                       9 9                                             Conventional    bike
                                                                                                                Conventional bike
                                                                 Main pollutants impact
                                        Main pollutants impact

                                                                       8 8
                                                                                                                E-bike E-bike
                                                                       7 7
                                                                                                                BEV* BEV*
                                                                       6 6
                                                                                                                Conventional motorcycle
                                                                                                                       Conventional    motorcycle
                                                                       5 5
                                                                       4
                                                                          4
                                                                       3
                                                                          3                                      1.69
                                                                       2                                                1.69
                                                                          2                      0.3                                0.024
                                                                       1               0.06           0.3                0.115              0.024
                                                                             0.096
                                                                       0 1       0.096      0.06                                  0.115
                                                                          0 CO2         SO2      PM       CO      HC      NOx Pb (g/km)
                                                                                  CO2 (g/km)SO2(g/km) PM(g/km) CO
                                                                            (kg/km)                             (g/km) HC(g/km) NOx Pb (g/km)
                                                                                          (kg/km)   (g/km)   (g/km)   (g/km)    (g/km)   (g/km)

      Figure
       Figure 4. Environmentalimpact
              4. Environmental    impact of of lead-acid
                                            lead-acid     battery–based
                                                      battery–based        transportation
                                                                     transportation         vehicles,
                                                                                     vehicles,         according
                                                                                               according  to the to the
      average
       average values   fromTable
                             Table2.2.The
                                       The   values
                                                  on on
                                                     toptop  areafor a conventional    motorcycle.
                                                                                             * E-cars*and
                                                                                                       E-cars  and small
         Figurevalues  from
                 4. Environmental         values
                                      impact             are for
                                               of lead-acid       conventional
                                                             battery–based       motorcycle.
                                                                              transportation               small
                                                                                               vehicles, according   to the
      e-scooters  are excluded.
       e-scooters are excluded.
         average values from Table 2. The values on top are for a conventional motorcycle. * E-cars and small
         e-scooters are excluded.
                40
                         23.350
             Lead-Acid Battery Losses

                35
                   40                                                    Conventional bike
                30          23.350
                                   Lead-Acid Battery Losses

                   35                                                    E-bike
                25                                                                Conventional bike
                                                                         BEV*
                20 30                                                             E-bikemotorcycle
                                                                         Conventional
                15 25
                                                                                  BEV*      4.250
                10 20
                 5 15                 1.600                      1.350            Conventional motorcycle
                                                    0.600                      0.700                     0.750
                 0 10                                                                                  4.250
                                                                                                     1.600                     1.350
                                                                                  5
                                                                                                                 0.600                   0.700      0.750
                                                                                  0

      Figure 5. Battery losses (kg per battery) of lead-acid battery–based transportation vehicles, according
      to the average values from Table 3. The values on top are for a BEV. * E-cars and small e-scooters
      are excluded.
Sustainability 2020, 12, 32                                                                          9 of 24

     One storage solution that is absent from Table 4 is Li polymer. It is a promising lithium battery that
presents good power density, but their calendar life is modest, as detailed in reference [45]. There are
also other types of battery and storage solutions that were not considered in Table 4. Ni-iron, Ni-zinc,
Ni-cadmium, aluminum-air, and zinc-air batteries are analyzed in reference [46]. Nickel’s low operating
voltage is similar with that of Ni-MH, while Zinc-air has a reduced number of life cycles. Li-oxygen,
Li-sulfur [46], and magnesium-ion batteries are even better than Li-ion batteries in energy density,
as discussed in [47], in the 300–1000 Wh/kg range. However, these are only predicted values since
they are not commercially available. Other types of storage—pumped hydroelectric storage (PHS),
compressed air energy storage (CAES), flywheels, capacitors, sodium-sulfur (NaS) batteries, vanadium
redox (VRB), zinc-bromine (ZnBr) and polysulfide bromine (PSB) flow batteries, superconducting
magnetic energy storage (SMES), solar fuel, thermal energy storage (TES), and liquid air storage are
analyzed in reference [34]. Most of these solutions are incompatible to EVs both in terms of costs and
deployment issues, as well as (lack of) maturity, or they have poor performance, such as energy or
power density.
Sustainability 2020, 12, 32                                                                                                                                                                      10 of 24

                                                                 Table 4. Characteristics of the main storage solutions for PEVs.

                Characteristic                       Lead Acid                          Li Ion                 Supercapacitors           Hydrogen Fuel Cells             Ni-MH & Ni-Cd
            Energy density (Wh/l)                 50–70 1 ; 50–90 4             150–200 1 ; 150–500 4          10–30 4 ; 3–180 6               500–3000 4                200 1 ; 170–420 4
             Power density (W/l)                     10–400 4                       1500–10,000 4                100,000+ 4                      500+ 4                      80–600 4
                                                                               100–200 1 ;
Sustainability 2020, 12, 32                                                                                                                                                                           11 of 24

                                                          Table 5. Typical characteristics of other lithium and nickel based batteries.

                                                        NCA                            LMO/LTO                                   LFP                               NMC                  LMO-NMC
                 Characteristic                  Nickel Cobalt              Lithium Manganese/Titanium                                                      Nickel Manganese
                                                                                                                      Lithium Iron Phosphate                                                  -
                                                Aluminum Oxide                        Oxide                                                                   Cobalt Oxide
            Specific energy (Wh/kg)                  200–260 2                           50–80 2                               90–120 2                           150–220 2                   -
            Energy density (Wh/kg)                     130 7                 857 (LTO), 114 3 –120 7 (LMO)               93 3 –130 7 (poor 8 )                       170 7                120–170 *
                                                                               Good7 : 200–500 W (LTO),                                                    Average 7 : 50–100 W,
                      Power                  Acceptable 7 : 100–200 W                                                       Acceptable 7                                                      -
                                                                                       Acceptable 7                                                             AccepTable 8
        Energy consumption (Wh/km)                        -                             105–214 3                               114–2233                               -                      -
                                                          −
           Energy capacity (kWh)                                                        24–34.2 1                             18.5 4,5 –24 3                    26.6 1 ;63.5 3              24 1
           Nominal capacity (Ah)                           -                                 -                          60 4 ; 40 9 ; 2.3 10 ; 90 12         2.3–12.4 5 ;40–50 6              -
            Nominal current (A)                            -                                 -                                 18.3 11 ; 40 4                          -                      -
            Nominal voltage (V)                     3.6 2 ; 3.65 7           2.4 2,7 (LTO); 3.8 2 –4 7 (LMO)                   3.2 2,3 ; 3.3 2               3.6 (3.7) 2 ; 3.8–4 7         3.6–4 *
                                               0.7 C, (4.2 V), typical                                           1 C typical, max.10 C 13 (3.65 V 4 ),     0.7–1 C, (4.2 to 4.3 V),
                 Charge (C-rate)                                                     1 C, (2.85 V) 2                                                                                          -
                                                 charge time 3 h 2                                                    typical charge time 3 h 2          typical charge time 3 h 2
               Discharge (C-rate)                   1 C (3 V) 2                     10 C (1.8 V)   2               1 C (2.5 V) 2,4 ; max.5 C-15 C 14          1 C, 2 C (2.5 V) 2              -
             Battery efficiency (%)                        -                            95 1                          82.3 (1.2 C)–94.5 (0.1 C) 4                  95–96 1                 95–96 *
             Depth of discharge (%)                        -                            70 3                                       70 3                                -                      -
                   Cycle life                           500 2                 2000–25,000 2 ; 1400–1500 3                      1000–20002                   1000–2000 2 ; 1500 5              -
               Cost ($ per kWh)                        ~350 2                          ~1005 2                                    ~580 2                            ~420 2                    -
                     Safety                      Average 7 , poor 8           Good 7 (LTO), acceptable 7                Good 7 , acceptable 8                Average 7 , poor 8               -
      * According to estimations, 1 according to reference [52], 2 according to reference [53], 3 according to reference [54], 4 according to reference [55], 5 according to reference [56], 6 according
      to reference [57], 7 according to reference [49], 8 according to reference [45], 9 according to reference [58], 10 according to reference [59], 11 according to reference [60], 12 according to
      reference [61], 13 according to reference [62], 14 according to references [62–64].
Sustainability 2020, 12, 32                                                                                                       12 of 24

             Table 6. Typical characteristics of supercapacitors, compared to Li-ion batteries and fuel cells.

                                                   Supercapacitors (SC)
                                                                                               Li-Ion Battery        Hydrogen Fuel
          Characteristic                                                     Hybrid
                                  EDLC SC              Pseudo SC                                                         Cells
                                                                          SCAsymmetric
                                 Aprotic or
     Type of electrolyte                                 Protic 1            Aprotic 1            Aprotic 1                  -
                                  protic 1
       Energy density           5–20 4 ; 3–5 1 ;                          180   1;20–30   2;
                                                        10 1 ;
Sustainability 2020, 12, 32                                                                                 13 of 24

      Table 4 presents both the disadvantages and advantages of the batteries used for providing
propulsion to small EVs. In Table 5, the performance of other types of lithium and nickel batteries
is analyzed.
      Due to the increased weight of lead-acid-based batteries, the losses associated to lead can become
5 to 10 times greater for smaller EVs than for conventional motorcycles, as seen in Table 3. In a similar
fashion, the losses associated to lithium-based and nickel-based batteries, presented in Tables 4 and 5,
can become very relevant in terms of environmental impact. As recommended in [29], for a large-scale
deployment of EVs, less lithium must be used per unit of battery storage, or a suitable type of energy
storage system that does not use lithium must be developed. This is justified by the cumulative
demands of EV/PHEVs that could exhaust the whole lithium reserve by 2050, even with extensive
recycling. The main alternatives to batteries are supercapacitors (SC) and hydrogen fuel cells (FC).
In Table 6, their characteristics are compared to Li-ion batteries.
      Due to the low operating voltage, symmetric hybrid supercapacitors were not considered for
analysis in Table 6, as discussed in reference [65]. Also, according to reference [66], Li-ion batteries
cannot withstand more than 1000 cycles per lifetime, which contradicts many other studies that claim
thousands of life cycles.

                      Table 7. LCA of Li-ion battery only, FC only and hybrid (battery-FC) bikes.

                   Metric                                                          Li-Ion Battery   Fuel Cells
                             Health (1) and Environmental Impact (2) for Production Phase
                                                       Unit                     E-bike          Hydrogen bike
               (1) Carcinogens                   kg C2H3Cleq                   0.0028 1             0.003 1
            (1) Non-carcinogens                  kg C2H3Cleq                   0.0035 1             0.0035 1
       (1) Respiratory inorganics                 kg PM2.5eq                    0.039 1             0.051 1
           (1) Ionizing radiation                  Bq C-14 eq               Below 0.0001    1   Below 0.0001 1
        (1) Ozone layer depletion                kg CFC-11 eq               Below 0.0001    1   Below 0.0001 1
         (1) Respiratory organics                  kg C2H4eq                Below 0.0001    1   Below 0.0001 1
             (1) Human toxicity                   kg 1.4-DB eq                   230 1                581 1
    (1) Particulate matter formation              kg PM10 eq                     0.52 1              1.04 1
  (1) Photochemical oxidant formation             kg NMVOC                       0.67 1              1.21 1
          (2) Aquatic ecotoxicity                kg TEG water               Below 0.0001    1   Below 0.0001 1
        (2) Terrestrial ecotoxicity                kg TEG soil                 0.0035    1          0.0039 1
         (2) Terrestrial acid/nutri                 kg SO2 eq                  0.0005    1          0.0007 1
            (2) Land occupation                  m2org.arable                  0.0002 1             0.0002 1
         (2) Aquatic acidification                  kg SO2 eq                  0.0001 1             0.0001 1
       (2) Aquatic eutrophication                kg PO4 P-lim                  0.0001    1          0.0001 1
             (2) Fossil depletion                    kg oil eq                   41.2  1             66.2 1
             (2) Metal depletion                     kg Fe eq                   118.5   1             176 1
                               Climate Change (3) and Resources (4) for Production Phase
            (3) Global warming                      kg CO2 eq               0.02 1 ; 165.2 2    0.023 1 ; 276.35 2
       (4) Non-renewable energy                    MJ primary                  0.0155    1           0.018 1
           (4) Mineral extraction                  MJ surplus                  0.0005    1          0.0013 1
                     Health (1), Environmental Impact (2), and Climate Change (3) for Use Phase
                                                 Hybrid e-bike                                  Hydrogen bike
                                                                                E-bike
                                                  (Battery-FC)                                        (FC)
  (1) Photochemical oxidant formation                 0.002 2                   0.004 2             0.001 2
    (1) Particulate matter formation                  0.002 2                   0.003 2             0.001 2
             (1) Human toxicity                        0.9 2                     1.07 2              0.55 2
             (2) Fossil depletion                      0.2 2                     0.4 2               0.07 2
             (2) Metal depletion                       0.49 2                    0.51 2              0.31 2
            (3) Global warming                         0.8 2                     1.42  2             0.31 2
                                1   According to Reference [35], 2 according to Reference [67].
Sustainability 2020, 12, 32                                                                                                              14 of 24

4. Life Cycle Assessment of Hybrid Storage Implementations/Solutions
     One approach to avoid battery losses is to use other storage elements, such as FC and SC.
For example, by using hydrogen fuel cells, one can implement a hydrogen bike. An e-bike is compared
with a hydrogen bike in terms of environment, health and energy impact in Table 7.
     The possibility to develop a hybrid e-bike, based on fuel cells and batteries, is analyzed in Table 7.
In reference [68], different stages of hybridization for a 54 kW light electric vehicle (LEV) are discussed
in terms of costs. The storage solutions and combinations include three storage elements: batteries,
supercapacitors and hydrogen fuel cells. The costs range from approximately $23,000–34,000 USD,
depending on the hybrid combination (SC-FC, battery-FC, and SC-battery) or standalone storage
solution (FC and battery). The lowest prices were obtained for the hybrid storage implementations
(battery-FC and SC-FC) and the highest for the FC implementation.

                  Table 8. Performance analysis of hybrid bikes compared to other PEVs and BEVs.

                               Hybrid E-Bikes (SC-Battery             E-Bike (Pedelec/Battery only,                Big E-Scooter and
           Metric
                                    and FC-Battery)                   SC only) and Small E-Scooter              E-Motorcycle (Battery only)
  Specific energy (Wh/kg)                      -                                  32.7–51.4 1                                      -
    Energy expenditure                                                       2           2 );               6                  2
                                               -                       59.8 (CB:69.8            6.92–8.57             202.86 (big EM)
          (Wh/km)
                                                                      0.25–0.52   12 (CB:   0.1212 );4.67 18
    Battery energy (MJ)                4.52 19 (SC-bat)                                                                     5 12 (LEV)
                                                                                   (SC only)
      SC energy (MJ)                                      0.071 13 (SC only)                                                   -
    Overall energy (Wh)                        -                              155 1 –360 1,2 ; 160 8            1680–2880 2 ; 5400 2 (big EM)
                                                                        250 7 (small e-scooter); 250
                                                                     1,3,8,9 –800 1 ; max.: 539 3 ; max.:
                                                                                                                  2000 2 –6000 2,21 ; 20,020 2
         Power (W)                  max.693 20 (SC-bat)             731–950 11 ; 143–1018 15 ; 2 000 14
                                                                                                                           (big EM)
                                                                          (big e-bike); 150–500 13
                                                                                   (SC only);
                                            19                       5.2 7 (small e-scooter); 5.4 1 –10
    Battery capacity (Ah)              12 (SC-bat)                                 1,3,9 ; 75 20                  40–80 21 (big e-scooter);

                                        18          20               48 3 ; 30 8 ; 36 1,9,10 ; 29.6 1 ; 12.73
         Voltage (V)            15–48 ;12–16 (SC-bat)                      20 ; 70–78 13 (SC only);                 74 21 (big e-scooter)
                                  8.816 (FC-Bat); 12.23 19
         Current (A)                                                                 18.39 19                                      -
                                            (SC-bat)
   Charging time (hours)                         -                                      53                                         -
                                 SC: 100,000–1,000,000 7 ;
         Life Cycles                                                    Li-Ion Battery:500 4 –800 3                                -
                                Li-Ion Battery: 500 4 –800 3
    Life expectancy (km)                    15,000   4                       15,000 4,5 ; 24,000 22                       50,000 4,5
                                                                   37–55 ; 46–82 12 (CB: real, 4–8 2 );
                                                                             2                                     26.6 (big EM); 100 21
                                                                                                                        2
    Trip autonomy (km)                           -
                                                                    real:25–30 10 ; 13–80 13 (SC only)                 (big e-scooter)
        Battery type                           16
                                     Li-Ion (FC-Bat)                           Li-Po 3 ; Li-Ion 13              Lithium-based, Lead-based 2
                                                                       18   19 ; 23 2 –26 3,2 ; 20.2–28 1 ;        90–144 3 ; ~140 5 ; 208 2
      Total weight (kg)             23 5 ; 27.1 16 (FC-Bat)
                                                                          41.3–65.8 17 (big e-bike)                       (big EM)
        Weight ratio                                                       0.23–0.35 *; 0.51–0.82 *
                                          0.28–0.34 *                                                             1.12–1.8 *; 2.6 * (big EM)
    (vehicle/80 kg rider)                                                         (big e-bike)
      * According to estimations and average values, 1 according to reference [69], 2 according to reference [25], 3 according
      to reference [17], for the tested pedelec, 4 according to reference [33], 5 according to reference [39], for the tested
      models, 6 according to reference [70], 7 according to reference [49], 8 according to reference [71], 9 according to
      reference [22], 10 according to reference [72], 11 according to reference [73], 12 according to reference [21], 13 according
      to reference [74], 14 according to reference [75], 15 according to reference [76], 16 according to reference [77], 17
      according to reference [23], 18 according to reference [58], 19 according to reference [60], 20 according to reference [78],
      21 according to reference [79], 22 according to reference [67].
Sustainability 2020, 12, 32                                                                                                   15 of 24

      Table 9.    Performance analysis and costs of our hybrid bike (SC-battery) compared to
      other implementations.

                                                Our Hybrid                                                 Big E-Scooter and
                  Metric                                                    E-Bike (in %)
                                                  E-Bike                                                  E-Motorcycle (in %)
          Battery energy (MJ)                 2.190; 608.33 Wh           12–24% 1 (CB: 6% 1 )                228% 1 (LEV)
            SC energy (MJ)                    0.0148; 4.11 Wh                     -                                -
                                                                                                          276–473% 2 ; 887% 2
          Overall energy (Wh)                       612.44                  26 10 –59% 2,10
                                                                                                               (big EM)
                                                                       8–56.5% 12 ; 14% 6 (small
                                                                                                       111 2 –333% 2,15 ; 1112% 2
         Maximum power (W)                           1800                 e-scooter); 111% 11
                                                                                                          (big e-motorcycle)
                                                                               (big e-bike)
                                                                        42 10 –77% 3,8,10 ; 40% 6           308–616% 15
         Battery capacity (Ah)                        13
                                                                           (small e-scooter)               (big e-scooter)
               Voltage (V)                           46.8                    64 10 –102% 3              158% 15 (big e-scooter)
               Current (A)                           42 *                         44% 14                           -
                                                                        53–78.5% 2 ; 66–102% 1
                                                                                                        38% 2 (big EM); 142% 15
          Trip autonomy (km)                         ~70*                  (CB: real, 10% 2 );
                                                                                                            (big e-scooter)
                                                                                real:40% 9
                                                                                                             Lithium-based,
               Battery type                         Li-Ion                 Li-Po 3 ; Li-Ion 10
                                                                                                              Lead-based 2
    Number of batteries replaced
                                                       1                         275% 5                           100% 4
            per lifetime
         Life time (years)                         2–4 **                     33–50% **                            -
     Bike incl. chassis ($& kg)                 200$; 11.6 kg                144% in kg 5                     861% in kg 5
                                                                      84 5 –97 9 % in kg; 332 13
            Batteries ($& kg)                    250$; 3.1 kg                                                 1030% in kg 5
                                                                               % in kg
   SC + DC/DC converter ($& kg)                  250$;1.3 kg                       -                               -
  Motor + AC/DC converter($& kg)                400$; 11.5 kg               18–22% in kg 5                  46–56% in kg 5
           Total cost ($)                           1100                       ~200% 7                             -
                                                                      65–101% 10 ; 140–234% 13            324–518% 3 ; 720% 2
            Total weight (kg)                        27.5
                                                                             (big e-bike)                      (big EM)
      * Limited by power electronics, ** according to estimations and average values, 1 according to reference [21], 2
      according to reference [25], 3 according to reference [17], for the tested pedelec, 4 according to reference [33], 5
      according to reference [39], for the tested models, 6 according to reference [80], 7 according to reference [27], 8
      according to reference [18], 9 according to reference [72], 10 according to reference [69], 11 according to reference [75],
      12 according to reference [76], 13 according to reference [23], for a lead-acid e-bike, 14 according to reference [60], 15

      according to reference [79].

5. Hybrid E-Bike Sizing and Performance Analysis
     As discussed in reference [68] and shown in the last rows of Table 7, EV operation can be split
between the battery and other storage elements. This is the second approach that aims to reduce the
battery dependence. Table 8 compares hybrid e-bikes to e-bikes, e-scooters, and e-motorcycles in terms
of performance. According to the eco-indicators detailed in [39], both e-bikes and conventional bikes
have the lowest impact on environment. One of the main reasons for these results can be attributed
to the reduced demand of energy of these vehicles. E-bikes also have a battery disposal impact that
is two to three times higher than that of big and medium e-scooters. In order to reduce the battery
dependency even more, hybrid e-bikes could be seen as a better alternative.
     Most e-bikes (pedelecs) present the following features: the motor is placed on the rear wheel [17],
have a 26 inch wheel [17,18], the charging time is between 4 and 6 h [17,18,72], the number of life cycles
is between 500 and 1000 [17,18,69], and the overall efficiency is 86% [75]. There are also e-bikes that
use SC as a storage element, such as [58,60,74]. SCs have a greater number of life cycles (see Table 5)
and the charging time is much lower: below 1 min [74]. In order to comply with the different power
regulations for e-bikes throughout the world, mainly in the 250–750 W range, many implementations
have considered 250 W as the maximum power delivered to the e-bike, such as references [17,18,72].
     Other implementations have considered greater power ratings in order to increase the speed and,
thus, the range. In reference [73], for reaching speeds of 25 km/h, the maximum power delivered was
Sustainability 2020, 12, 32                                                                                                               16 of 24

950 W. In reference [76], for a speed of 32 km/h and a slope of 3% the maximum power reached was
1018 W, which is similar to reference [74]. Bigger e-bikes, like the one presented in reference [75],
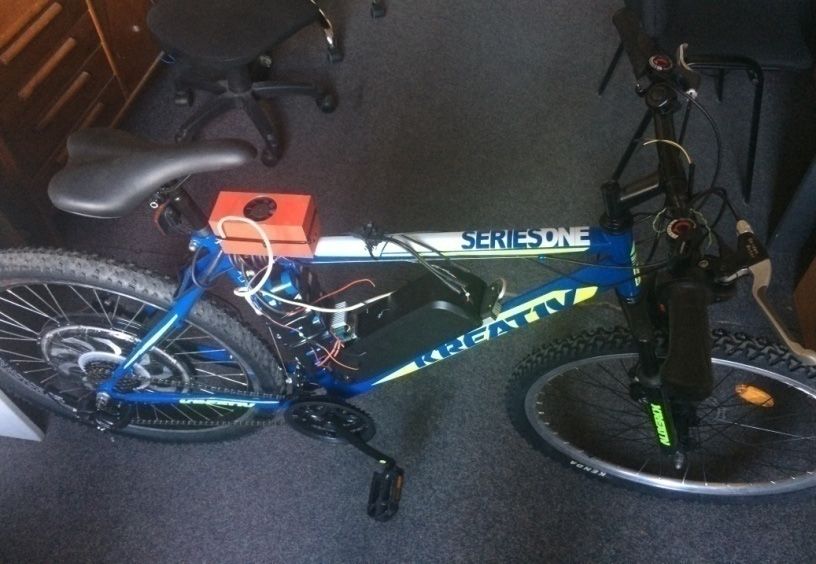
go up to 2000 W. Based on the second approach, we have designed a hybrid e-bike that splits the
operation between the SC and the Li-ion battery, as illustrated in Figure 7. For the design of our hybrid
e-bike, the ratio between battery and SC capacitances was set in order to compensate for the e-bike’s
Sustainability 2019, 12, x FOR PEER REVIEW                                                        16 of 25
maximum kinetic energy by functional SC capacitance. The performance and economic impact of this
implementation is compared to other PEVs and medium BEVs, known also as LEVs, in Table 9 and
impact of this implementation is compared to other PEVs and medium BEVs, known also as LEVs,
Figure 8.
in Table 9 and Figure 8.

Sustainability 2019, 12, x FOR PEER REVIEW                        Figure 7. Hybrid
                                                                  Figure 7. Hybrid e-bike.
                                                                                   e-bike.                                               17 of 25

            Table 9. Performance analysis and costs of our hybrid
                                                              Our bike
                                                                  hybrid(SC-battery)
                                                                          e-bike     compared to other
              80
            implementations.          55                      Medium to big e-bike
                        70
     Performance analysis

                                                                                      Big e-scooter and E-motorcycle
                                                                                                            Big E-Scooter and E-
                        60 Metric                   Our Hybrid E-Bike               E-Bike (in %)
                                                                                                                      Motorcycle (in %)
                        50
                        Battery energy (MJ)          2.190; 608.33 Wh            12–24% 1(CB: 6%32
                                                                                                 1)                      228% 1 (LEV)
                        40SC energy (MJ)              0.0148; 4.11 Wh                    -                                    -
                        30                                                                                          276–473% 2; 887% 2 (big
                       Overall energy (Wh)                612.44
                                                               6.000                 26 10–59% 2,10             6          15EM)
                        20
                                                                               8–56.5% 10
                                                                                        12; 14% 6(small e-          111 2–333% 2,15; 1112% 2
                        10
                       Maximum    power (W) 4
                                 3.8                      1800               1
                                                                             scooter); 111% 11 (big e-bike)           (big e-motorcycle)
                         0                                                  42 10–77% 3,8,10; 40% 6 (small e-
                            Battery capacity (Ah)          13                                                   308–616% 15 (big e-scooter)
                                                                                        scooter)
                                Voltage (V)                46.8                       64 10–102% 3                  158% 15 (big e-scooter)
                                Current (A)                42 *                          44% 14                                 -
                                                                              53–78.5% ; 66–102% 1 (CB:
                                                                                         2                          38% 2 (big EM); 142% 15
                            Trip autonomy (km)            ~70*
                                                                                real, 10% 2); real:40% 9                 (big e-scooter)
                                                                                                                     Lithium-based, Lead-
                                Battery type              Li-Ion                   Li-Po 3; Li-Ion 10
                                                                                                                             based 2
        Number of batteries
                                                 1                          275% 5                            100% 4
       replaced per lifetime
          Life time (years)                   2–4 **                      33–50% **                              -
     Figure
     Bike          Performance
           incl.8.chassis ($& kg) analysis200$;
                                            and11.6
                                                  costs
                                                     kgof our hybrid e-bike,
                                                                         144% incompared
                                                                                   kg 5        to other PEVs,
                                                                                                           861%according
                                                                                                                 in kg 5 to
     Figure   8.
          BatteriesPerformance
                     ($&  kg)     analysis  and
                                           250$; costs
                                                 3.1 kg of our hybrid
                                                               84 5–97 9e-bike,
                                                                         % in kg;compared
                                                                                  332  13 % in to
                                                                                               kg other
     the average values from Tables 8 and 9. The values on top are for big e-scooter and e-motorcycle.  PEVs,
                                                                                                          1030%according
                                                                                                                  in kg 5 to
    SC
     the+ average
          DC/DC converter      ($& Tables 8 and 9. The values on top are for big e-scooter and e-motorcycle.
                     values from           250$;1.3 kg                         -                                 -
6. Discussionkg)
          Motor + AC/DC
6. Discussion
     Theconverter($&
            current state                 400$; 11.5 kg                 18–22% in kg 5                    46–56% in kg 5
                          kg) of transportation vehicles has revealed the necessity to develop cleaner electric
vehicles    Total coststate
     The especially
           current      ($)dueof to the growing
                                 transportation1100 vehicles
                                                     global impact      of ~200%
                                                               has revealed traffic 7
                                                                                 the and    air pollution
                                                                                      necessity                  -
                                                                                                            on cleaner
                                                                                                   to develop    human     health,
                                                                                                                          electric
                                                               65–101% 10; 140–234% 13 (big e-        324–518% 3; 720% 2 (big
mainly   associated
vehiclesTotal
           especially     with   urban  environments,
                           due to the growing
                 weight (kg)                                as  seen  in  Table   1.  Many      EVs  have  been
                                               27.5 global impact of traffic and air pollution on human health,    developed   by
                                                                             bike)                             EM)
the industry.
mainly          Mostwith
        associated       of these  implementations,
                               urban   environments, as    such   as in
                                                               seen  e-cars,
                                                                        Tabletry  1. to coverEVs
                                                                                      Many       issues
                                                                                                     havelike  driver
                                                                                                            been         safety and
                                                                                                                     developed   by
     *Limited by power electronics, **according to estimations and average values, 1 according to reference
the industry.   Most oftothese
     [21], 2 according             implementations,
                             reference  [25], 3 accordingsuch    as e-cars,
                                                            to reference       tryfor
                                                                            [17],   tothe
                                                                                        cover    issues
                                                                                            tested       like driver
                                                                                                     pedelec,            safety
                                                                                                               4 according   to and
comfort,  range,    and   life span.  But  the   price  tag  is too  high    when     compared       to
     reference [33], according to reference [39], for the tested models, according to reference [80], 7
                        5                                                                 6             conventional       vehicles.
Trip according
      autonomy        is very [27],
                  to reference   limited    in comparison
                                      8 according   to reference with      conventional
                                                                   [18], 9 according            transportation
                                                                                         to reference                 systems.
                                                                                                        [72], 10 according   to By
employing
     referencebatteries,   this can cause
                 [69], 11 according          also other
                                      to reference   [75], problems,
                                                           12 accordinglike     reduced[76],
                                                                           to reference     lifespan    (10 years,
                                                                                                  13 according         on average).
                                                                                                                  to reference
The lack   of practical    battery  recycling     solutions    leads  to   this  limit   in
     [23], for a lead-acid e-bike, according to reference [60], according to reference [79].
                                     14                                 15                   life  span.  There     is also a lot of
Sustainability 2020, 12, 32                                                                          17 of 24

comfort, range, and life span. But the price tag is too high when compared to conventional vehicles.
Trip autonomy is very limited in comparison with conventional transportation systems. By employing
batteries, this can cause also other problems, like reduced lifespan (10 years, on average). The lack of
practical battery recycling solutions leads to this limit in life span. There is also a lot of suspicious
advertising related to lifespan. Many consider that their batteries have the best life span, but this is
relative due to the sensitivity of these devices and thus leading to a certain level of distrust when
taking design decisions. In recycling, the “second life” of batteries is of utter importance, especially for
traction batteries. These are used in cheap stationary systems, when the threshold is around 20–30% of
the initial nominal capacity.
      Other issues include lack of infrastructure and no benefits to fitness. Because 90% to 95% of its
time a car is not in operation, in the future, car sharing could be a solution to cut costs and reduce the
impact of batteries by splitting it to the number of users. However, until that day, we must look for
cheaper and cleaner alternatives for personal transportation vehicles, especially in congested traffic.
PEVs represent one such solution, as justified in Table 1. The reduced price of these vehicles also
comes with a considerable loss in range, comfort and safety (mainly due to the lack of infrastructure).
Yet, many e-bikes have been deployed in China. In reference [81], the environmental impact and
safety of e-bikes are compared to that of other transport modes. One can applaud the cost reduction
of these lead-acid-based e-bikes and not think about the consequences on environment associated
with the lead battery losses [82,83]. We tacklethese issues by means of life cycle assessment (LCA)
in Tables 2 and 3. As shown in Figures 4 and 5, the dependence on batteries cuts the benefits of
owning a personal electric vehicle, especially for small to medium BEVs, due to their reduced life
span (3–4 years). So, even if lead-acid batteries are replaced by other batteries, battery disposal is still
a problem for the environment. A much cleaner solution is Li-ion, not only for e-bikes but also for
other vehicles such as e-scooters and e-motorcycles, as well as heavier EVs. It is important to mention
that LCA tackles the environmental and health impacts and the energy consumption aspects, but it
tells nothing about the dynamic performance, especially its sensitivity at wrong charging/discharging
cycles or the combination of more negative factors.
      In Tables 4–6, we have analyzed the performance metrics and limitations of the main storage
solutions for PEVs, which also include SCs and FCs, as alternatives to Li-ion batteries. Energy harvesting
(e.g., PV panels) is another option, but this is out of our paper’s scope. LCA does provide a certain
methodology and thus an almost predictable uncertainty associated with the changes in the driver’s
behavior and in technology. Yet, in the case of our performance analyses in Tables 4–6, we have
observed a large uncertainty. This can be attributed to the great discrepancy between studies, and it
can be observed in Tables 4–6 and Tables 8 and 9. For example, in reference [84], the proposed e-bike
has a total weight of 111.4 kg. The bicycle and motor weigh 41.4 kg. The payload weighs 43.6 kg,
and the batteries (made of 2 Ni-MH 522Wh packs) 26.4 kg. However, most e-bikes are much lighter
(usually 20–30 kg). Big e-bikes go up to 60–65 kg. Thus, these e-bikes have a subunit ratio (e-bike
mass/rider mass), such as references [85–87]. In these references, a clear distinction should be made
between pedelecs and hybrid e-bikes. In reference [88], one can see the limitations of Ni-MH batteries,
such as reduced cycle life—only 200–300 cycles. In reference [89], it is stated that battery life of LFP
batteries is 10 years. These batteries usually do not exceed 1000 cycles per lifetime. By looking at these
examples, we consider that the absence of a standard testing methodology from these articles is one of
the main reasons for obtaining such uncertainty. Another reason is the vagueness related to the load
demands or charging behavior, random variations of temperature, and overvoltage that can cause
significant problems to batteries’ reliability and life span. These are still complicated issues, which not
many are willing to tackle.
      Coming back to dynamic performance, which is another neglected aspect, life expectancy is
a result of both the chemical interactions and temperature of operation which affect the batteries.
Future research should address issues such as battery aging, and thus underline the sustainability
question: Is green also sustainable? This question was also stated in Figure 3. The performance of
You can also read