Nova Scotia Environmental Goals and Sustainable Prosperity Act - Economic Costs and Benefits for Proposed Goals Prepared for: Ecology Action ...
←
→
Page content transcription
If your browser does not render page correctly, please read the page content below
Nova Scotia Environmental Goals and Sustainable
                 Prosperity Act
 Economic Costs and Benefits for Proposed Goals

Prepared for:
Ecology Action Centre

Submitted by:
Gardner Pinfold Consultants Inc.

September, 2019
EGSPA Economic Costs and Benefits                                                                                      Gardner Pinfold

Table of Contents

SUMMARY ....................................................................................................................................... - 4 -
INTRODUCTION ............................................................................................................................... - 6 -
  1. BACKGROUND ....................................................................................................................................... - 6 -
  2. MOTIVATION ........................................................................................................................................ - 6 -
  3. COST-EFFECTIVE STRATEGY ...................................................................................................................... - 7 -
  4. GREEN ECONOMY STRATEGY.................................................................................................................... - 8 -
  5. EAC GOALS IN THIS REPORT..................................................................................................................... - 9 -
  6. BENEFIT-COST ANALYSIS CONCEPTS......................................................................................................... - 10 -
GOAL 1: REDUCING GHG EMISSIONS 50% BELOW 1990 LEVELS ...................................................... - 11 -
GOAL 2: SUPPLYING 90% OF NS ELECTRICITY NEEDS WITH RENEWABLES ....................................... - 13 -
  1. BACKGROUND ..................................................................................................................................... - 13 -
  2. ANALYSIS ........................................................................................................................................... - 13 -
  3. RESULTS............................................................................................................................................. - 15 -
  4. ECONOMIC IMPACTS ............................................................................................................................ - 15 -
GOAL 3: DEEP ENERGY AND RESILIENCY RETROFITS FOR 100% OF ELIGIBLE SOCIAL HOUSING ........ - 17 -
  1. BACKGROUND ..................................................................................................................................... - 17 -
  2. ANALYSIS ........................................................................................................................................... - 18 -
  3. RESULTS............................................................................................................................................. - 19 -
  4. ECONOMIC IMPACTS ............................................................................................................................ - 20 -
GOAL 4: TRIPLING NOVA SCOTIA’S DEMAND SIDE MANAGEMENT TARGET............................................. - 21 -
  1. BACKGROUND ..................................................................................................................................... - 21 -
  2. ANALYSIS ........................................................................................................................................... - 22 -
  3. RESULTS............................................................................................................................................. - 22 -
  4. ECONOMIC IMPACTS ............................................................................................................................ - 23 -
GOAL 5: REDUCING CAR DEPENDENCE, AND ELECTRIFYING PERSONAL AND PUBLIC TRANSPORT ... - 25 -
  1. BACKGROUND ..................................................................................................................................... - 25 -
  2. ANALYSIS ........................................................................................................................................... - 25 -
  3. RESULTS............................................................................................................................................. - 27 -
  4. ECONOMIC IMPACTS ............................................................................................................................ - 28 -
GOAL 6: GROWING NOVA SCOTIA’S GREEN ECONOMY .................................................................. - 30 -
  1. BACKGROUND ..................................................................................................................................... - 30 -
  2. ECONOMIC IMPACTS ............................................................................................................................ - 30 -
REFERENCES................................................................................................................................... - 31 -

                                                                            -2-
EGSPA Economic Costs and Benefits Gardner Pinfold
List of Tables and Figures
FIGURE 1: ILLUSTRATIVE GLOBAL GHG ABATEMENT COST CURVE BEYOND BUSINESS-AS-USUAL, 2030................ - 7 -
TABLE 1: CONTRIBUTION OF EACH GOAL TOWARD OVERALL GHG REDUCTION TARGET ..................................... - 10 -
FIGURE 2: NOVA SCOTIA GHG REDUCTION TARGET AND POTENTIAL FROM THIS REPORT................................... - 11 -
TABLE 2: GOAL 2 BASE CASE VERSUS POLICY CASE ASSUMPTIONS AND VARIABLE SETTINGS .............................. - 14 -
TABLE 3: GOAL 2 ANNUAL AND NPV RESULTS BY 2030.......................................................................................... - 15 -
TABLE 4: GOAL 2 ECONOMIC IMPACTS FOR 2019-2030 (12-YEAR TOTAL) ............................................................ - 16 -
TABLE 5: GOAL 3 BASE CASE VERSUS POLICY CASE ASSUMPTIONS AND VARIABLE SETTINGS .............................. - 19 -
TABLE 6: GOAL 3 ANNUAL AND NPV RESULTS BY 2030.......................................................................................... - 19 -
TABLE 7: GOAL 3 ECONOMIC IMPACTS FOR 2019-2030 (12-YEAR TOTAL) ............................................................ - 20 -
TABLE 8: GOAL 4 POLICY CASE ENERGY EFFICIENCY PATH TO 2030....................................................................... - 22 -
TABLE 9: GOAL 4 BASE CASE VERSUS POLICY CASE ASSUMPTIONS AND VARIABLE SETTINGS .............................. - 22 -
TABLE 10: GOAL 4 ANNUAL AND NPV RESULTS BY 2030........................................................................................ - 23 -
TABLE 11: GOAL 4 ECONOMIC IMPACTS FOR 2019-2030 (12-YEAR TOTAL) .......................................................... - 24 -
TABLE 12: GOAL 5 BASE CASE VERSUS POLICY CASE ASSUMPTIONS AND VARIABLE SETTINGS ............................ - 26 -
TABLE 13: GOAL 5 ANNUAL AND NPV RESULTS BY 2030........................................................................................ - 27 -
TABLE 14: GOAL 5 ECONOMIC IMPACTS FOR 2019-2030 (12-YEAR TOTAL) .......................................................... - 29 -
TABLE 15: GOAL 6 ECONOMIC IMPACTS IN 2030 (ONE YEAR) ............................................................................... - 30 -
TABLE 16: GOAL 6 ECONOMIC IMPACTS FOR 2019-2030 (12-YEAR TOTAL) .......................................................... - 30 -
Acknowledgements
EAC staff Stephen Thomas, Emma Norton, and Meghan McMorris worked to edit and provide
support for this report, along with the support of many other volunteers and reviewers without
whom this report would not have been possible.
Thank-you to Housing Nova Scotia, Efficiency Nova Scotia and Ralph Torrie and Associates for
providing data to inform this report.
The EAC would also like to acknowledge the generous support of the Ivey Foundation and
individual donors for making the completion of this report possible.
-3-EGSPA Economic Costs and Benefits Gardner Pinfold
Summary
The Nova Scotia Environmental Goals and Sustainable Prosperity Act (EGSPA) was enacted in 2007.
The Ecology Action Centre (EAC) has participated in the development of EGSPA through
collaboration and recommendations of goals and strategies over the life of the Act. This report
explores select climate goals that EAC proposes be part of a renewed EGSPA.
EAC is seeking the best strategies for Nova Scotia to avoid the environmental and economic
consequences of overshooting 1.5oC, or 2oC warming (UNIPCC, 2018), and meeting the challenges of
decoupling the provincial economy from carbon-based energy sources. The following six (6) goals
focused on reducing greenhouse gas (GHG) emissions are assessed in terms of associated costs and
benefits:
Goal 1: Reducing GHG emissions 50% below 1990 levels by 2030 – Meeting this goal would
put Nova Scotia in line with its fair share of emissions reductions to keep global warming
below the Paris Agreement’s target of 1.5°C. This overarching goal is met through goals 2-5.
Goal 2: Supplying 90% of NS electricity needs with renewable energy by 2030 – Dramatically
decarbonizing Nova Scotia’s electricity grid by displacing coal, oil and large biomass with
wind, hydro, solar, small scale biomass, and community-scale projects.
Goal 3: Making 100% of social housing Net-Zero Energy Ready (NZER) by 2030– Saving
energy and making people more comfortable in their homes by reducing energy
consumption in existing social housing by 60% or more, and ensuring all new construction
is built to NZER standards.
Goal 4: – Tripling energy efficiency in the electricity sector by 2030 – Saving money and
avoiding the need for new electricity system infrastructure by increasing the level of total
electricity system efficiency to 3% a year.
Goal 5: Reducing car dependence, and electrifying personal and public transport – This goal
includes public transit and active transportation promotion, battery electric buses (BEBs),
higher occupancy vehicles, and promotion of hybrid and electric vehicles.
Goal 6: Growing Nova Scotia’s green economy – Meeting goals 1 through 5 will substantially
increase the economic prosperity of the green economy in Nova Scotia and aim to create
over 15,000 green jobs per year in the province by the year 2030.
Nova Scotia’s total GHG emissions in carbon dioxide equivalents (CO2e) for 1990 were 19.6 million
tonnes (ECCC, 2018), and by 2016 were reduced to 15.6 million tonnes (down 20%). As of 2019 a
further reduction of 5.8 million tonnes is needed to achieve the 50% goal by 2030 (Goal 1) of 9.8
million tonnes. This report indicates the following GHG reductions that are possible through each
goal analyzed in this report.
Goal Mt GHG avoided
1 - Reducing GHG emissions by 50% 5.80
2 - 90% of electricity with renewables 5.36
3 - 100% of eligible social housing NZER 0.02
4 - Increase electricity efficiency to 3% per year 0.57
5 - Reducing car dependence & electrification 0.48
Sub-Total (Goals 2 - 5) 6.43
Mt = million tonnes
-4-EGSPA Economic Costs and Benefits Gardner Pinfold
The specific measures related to each goal are described in the report along with the investments
required based on year by year implementation from 2019 to 2030. The sub-total (55% for Goals 2-
5) moves beyond the 50% reduction target (Goal 1) and towards the net-zero emissions
benchmark needed by 2050. Some reductions are already underway and other measures will be
undertaken by residential, industrial, commercial and institutional sectors. In particular, other
measures for oil and gas, building construction and renovation, commercial and industrial
transportation, and other sectors are not included in this report.
The combined investments outlined in this report all contribute to Nova Scotia’s “green economy”
(Goal 6). The one-year economic impacts in 2030 are shown in the table below, and the report also
includes the cumulative economic impacts from 2019 to 2030. Not all impacts are “new” as some
involve “green” shifting from carbon-based economic activities to businesses and jobs based on
renewable energy and energy efficiency.
Economic impacts for in 2030 (single year)
($M 2019) Direct Indirect Induced Total NS Canada
Output $912 $277 $235 $1,425 $1,880
GDP $487 $161 $169 $816 $1,033
Income $357 $115 $52 $524 $676
Jobs (FTE) 11,124 1,883 1,974 14,980 17,282
Fed tax* $44 $16 $8 $68 $89
Prov tax* $47 $20 $12 $79 $0
Source: Statistics Canada Interprovincial Input-Output Model, 2014 *Tax impacts combine StatCan model
results and Gardner Pinfold income tax calculations based on StatCan SPSDM marginal effective tax rates.
The $816 million in added-value to Nova Scotia will include $524 million in salaries and wages for
about 14,980 full-time equivalent workers. The gross domestic product (GDP, added-value), jobs,
salaries, and tax revenues for government will be sustainable based on renewable energy resources
and energy savings for Nova Scotians. The cumulative 12-year total impacts (below) represent the
return on all investments up to 2030 that meet the goals.
Economic impacts for 2019-2030 (12-year total)
($M 2019) Direct Indirect Induced Total NS Canada
Output $10,949 $3,323 $2,825 $17,096 $22,561
GDP $5,839 $1,936 $2,022 $9,797 $12,392
Income $4,284 $1,381 $624 $6,289 $8,117
Jobs (FTE) 133,483 22,590 23,685 179,759 207,384
Fed tax* $523 $187 $100 $810 $1,064
Prov tax* $569 $235 $145 $948
Source: Statistics Canada Interprovincial Input-Output Model, 2014 *Tax impacts combine StatCan model
results and Gardner Pinfold income tax calculations based on StatCan SPSDM marginal effective tax rates.
Every step forward on this path should be taken with affordability and local benefits at the
forefront of the solutions proposed for a prosperous green economy in Nova Scotia.
-5-EGSPA Economic Costs and Benefits Gardner Pinfold
Introduction
1. Background
The Nova Scotia Environmental Goals and Sustainable Prosperity Act (EGSPA) was enacted in 2007.
The two overarching objectives of the Act are to:
1. Establish clear goals that foster an integrated approach to environmental
sustainability and economic well-being; and
2. Work towards continuous improvement in measures of social, environmental and
economic indicators of prosperity.
Twenty-five goals were initially established. They are revisited periodically to evaluate progress
and set targets for the province.
The Ecology Action Centre (EAC) participates in a Roundtable of stakeholders established by the
Province to engage on EGSPA. The Ecology Action Centre (EAC) has participated in the
development of EGSPA through collaboration and recommendations of goals and strategies over
the life of the Act. This report explores select climate goals that EAC proposes be part of a renewed
EGSPA that are relevant to the Act’s objectives.
2. Motivation
Although EGSPA goals touch on a wide range of environmental and economic opportunities, the
focus here is on reducing greenhouse gas emissions (GHG=Carbon dioxide equivalents CO2e) since
there is a pressing need to reduce GHGs more quickly than previously thought.
In October 2018, the United Nations Intergovernmental Panel on Climate Change (UNIPCC)
released the Special Report on Global Warming of 1.5°C. This report underscores the importance of
avoiding 2°C warming compared to pre-industrial levels and keeping the increase to within 1.5°C.
This report differs from previous ones by explicitly stating a specific need for developed countries
to take. It also highlighted a need to reduce 45% of human-caused GHG emissions, from 2010
levels, by the year 2030 in order to reduce the risk of long-lasting and irreversible changes to
ecosystems. According to the IPCC analysis, keeping below 1.5°C will also require measures beyond
2030 to reach net-zero emissions by 2050. Although the IPCC refers to 2010, EGSPA refers to 1990
as a base year.
EAC is seeking the best strategies for Nova Scotia to help avoid the environmental and economic
consequences of overshooting 2°C warming, and meeting the challenges of decoupling the
provincial economy from carbon-based energy sources in a just and inclusive way.
EAC also sees the considerable economic, innovation and entrepreneurial opportunity from
implementing the solutions that are necessary to meet this challenge. These necessary,
transformative changes to our economy will create many thousands of jobs, and has the
opportunity to not only reduce emissions, but to be a viable action plan for sustainable local
economic prosperity for all of Nova Scotia.
Every step forward on this path should be taken with justice, inclusion, affordability and local
benefits at the forefront of the solutions proposed for a prosperous green economy in Nova Scotia.
-6-EGSPA Economic Costs and Benefits Gardner Pinfold
3. Cost-effective strategy
GHGs are primarily emitted from human activities that directly or indirectly involve the burning of
fossil fuels (e.g. coal, oil, natural gas). Recognition for the need to reduce GHG emissions has grown
substantially in recent years, and it is important to prioritize the range of GHG reduction measures
in terms of their costs and benefits to identify the most cost-effective strategies. At the intersection
of economic and environmental objectives is the concept of marginal abatement cost curves
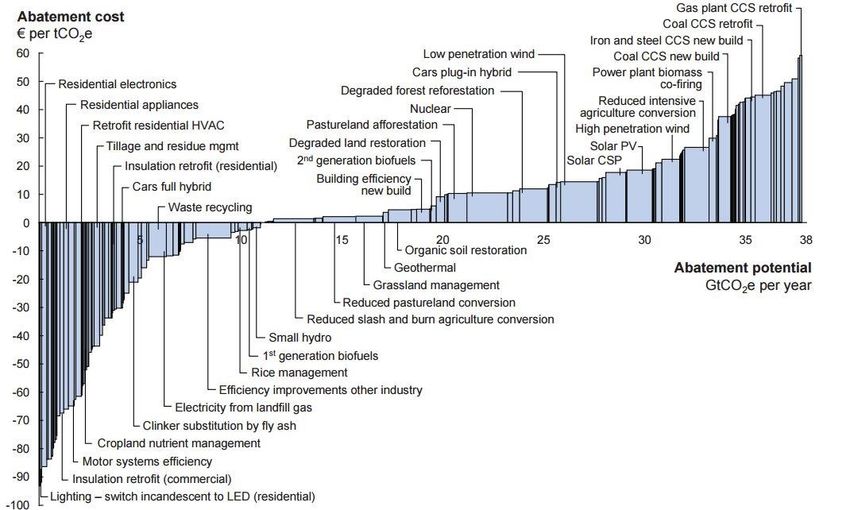
(MACC), shown in Figure 1.
Each bar in Figure 1 represents an initiative that can reduce GHGs. Starting on the left are measures
such as replacing incandescent bulbs with LEDs, insulating commercial buildings, increasing the
efficiency of motors, which reduce costs while also reducing GHGs. Measures in the middle are
break-even measures such as using biofuels, and small hydro-electricity development. Finally,
measures on the right-hand side, including biomass power plants, and carbon capture and storage
for a number of fossil-fuel burning facilities are measures which have a higher cost associated with
reducing GHGs.
The bars below the zero line represent measures that save money while reducing GHGs, and the
bars above the line will incur a cost to reduce GHG emissions. The height of each bar (y-axis)
represents the marginal cost per tonne of GHG reduction. “Marginal cost” or “net cost” is used
because there would have been a cost to continue with current (business as usual) technologies
and this is accounted for in the cost to make changes. The figure below is meant to be illustrative of
different carbon reduction activities, while the exact magnitudes change over time and with
geographical location.
Figure 1: Illustrative global GHG abatement cost curve beyond business-as-usual, 2030
Note: The curve presents an estimate of the maximum potential of all technical GHG abatement measures
below 60 Euros per tCO2e if each is pursued aggressively.
Source: Global GHG Abatement Cost Curves v2.0.
-7-EGSPA Economic Costs and Benefits Gardner Pinfold
The width of each bar above represents the amount of GHG reductions in gigatonnes (Gt) of carbon-
dioxide equivalent (CO2e) that each measure can achieve. Narrow bars achieve smaller gains and
wide bars achieve bigger gains in GHG reductions. Many measures must be taken together in order
to achieve deep reductions in GHG emissions.
Since EGSPA aims to meet economic and environmental objectives, organizing the range of GHG
reduction measures using a MACC figure like this is highly appropriate. The measures that are
below the line clearly meet both economic and environmental criteria (saving money while
reducing GHGs), and the ones that offer the greatest gains above the line (widest bars) should be
among priorities as well. The majority of the measures along the curve are easily recognized by
Nova Scotians since many are already underway in the province. The challenge is to move quickly
and effectively to fully capture the potential value in each bar.
The MACC example above is only illustrative of global measures to reduce GHG emissions. The
particular measures, costs, and potential to reduce GHG emissions are different in every
jurisdiction, and Nova Scotia has its own specific circumstances. The curve is also changing over
time as the costs of different technologies and their ability to reduce GHGs improves. In general,
measures move to the left as their costs come down, and bars widen as the ability of each measure
to reduce GHGs is enhanced. An excellent example of this is wind power generation where the costs
of installed wind energy ($/MWh) have reduced dramatically in the last decade to become the
lowest-cost energy to install in Canada (CANWEA, 2018). Battery technology is another example
where rapid improvements are making hybrid and electric vehicles, both large and small, much
more capable and affordable.
4. Green economy strategy
Cost effectiveness is one way to prioritize GHG reduction initiatives, but this treats each cost equally
when, in fact, some initiatives will have much greater benefits for Nova Scotia’s economy than
others. Here we ask questions like “how much will Nova Scotia’s economy grow?”, “how many jobs
will be created?”, and “what tax revenues will be generated to governments?”. Some examples help
illustrate how GHG reduction initiatives offer different benefits for the economy.
LED lights are one of the most cost-effective initiatives (far left of Figure 1). When a consumer
purchases a household LED, the retail store will earn a margin on the sale (e.g. 10-20%), but most
of the sale revenue goes to the manufacturer. Since Nova Scotia imports household LEDs
manufactured elsewhere in Canada or other countries, most of the money leaves the province.
However, the Nova Scotia firm, LED Roadway Lighting, sells LED street lighting and commercial
lighting and subsequently sales revenues from LED street and commercial lighting in Nova Scotia
stay in the province. Furthermore, supporting the success of this company allows them to compete
in other provinces, states and countries around the world that are converting their systems to LEDs.
When Nova Scotia becomes a manufacturer and exporter of energy efficient technologies, more
income, jobs, and tax revenues are captured in the province. Converting to household LEDs is still a
great initiative, but it has a smaller impact on the Nova Scotia economy than some other initiatives.
Another prime example involves new construction and retrofitting homes and buildings to be much
more energy efficient. The principle aim is to reduce heating requirements (and some cooling in
summer) to avoid GHG emissions from electricity, oil, or natural gas energy sources. These types of
measures appear in Figure 1 in a couple places, both above and below the zero line. Nova Scotia has
several window and door manufacturers, and wood products needed for retrofits and new
construction are generally available from within the province. Both the labour required for
-8-EGSPA Economic Costs and Benefits Gardner Pinfold
construction and renovation (supplied by Nova Scotians) and the reduction in demand for heating
helps to keep money in the province. Electricity generation currently involves imports of coal, oil,
and natural gas. Heating systems reliant on oil and natural gas also involve the import of those
fuels. Making the switch to purchase Nova Scotia products and labour versus importing fossil fuels
is a major benefit to the provincial economy. Furthermore, engaging entrepreneurs and fostering
innovation, within the province, in areas that could support the achievement of these goals, is a
major economic opportunity for the province.
5. EAC goals in this report
Because many GHG reduction measures are becoming highly cost-effective and there are significant
opportunities to grow Nova Scotia’s “green economy”, EAC is focusing on the most promising six
goals that combine renewable energy, energy conservation, energy efficiency energy conservation,
energy efficiency, renewable energy, and electrification measures to position Nova Scotia as a
leader in GHG reductions.
The six EAC 2030 goals assessed in this report are:
Goal 1: Reducing GHG emissions 50% below 1990 levels by 2030 – Meeting this goal would
put Nova Scotia in line with its fair share of emissions reductions to keep global warming
below the Paris Agreement’s target of 1.5°C. This overarching goal is met through goals 2-5.
Goal 2: Supplying 90% of NS electricity needs with renewable energy by 2030 – Dramatically
decarbonizing Nova Scotia’s electricity grid by displacing coal, oil and large biomass with
wind, hydro, solar, small scale biomass, and community-scale projects.
Goal 3: Making 100% of social housing Net-Zero Energy Ready (NZER) by 2030– Saving
energy and making people more comfortable in their homes by reducing energy
consumption in existing social housing by 60% or more, and ensuring all new construction
is built to NZER standards.
Goal 4: – Tripling energy efficiency in the electricity sector by 2030 – Saving money and
avoiding the need for new electricity system infrastructure by increasing the level of total
electricity system efficiency to 3% a year.
Goal 5: Reducing car dependence, and electrifying personal and public transport – This goal
includes public transit and active transportation promotion, battery electric buses (BEBs),
higher occupancy vehicles, and promotion of hybrid and electric vehicles.
Goal 6: Growing Nova Scotia’s green economy – Meeting goals 1 through 5 will substantially
increase the economic prosperity of the green economy in Nova Scotia and aim to create
over 15,000 green jobs per year in the province by the year 2030.
Nova Scotia’s total GHG emissions in carbon dioxide equivalents (CO2e) for 1990 were 19.6 million
tonnes (ECCC, 2018), and by 2016 were reduced to 15.6 million tonnes (down 20%). As of 2019 a
further reduction of 5.8 million tonnes is needed to achieve a 50% reduction by 2030 (Goal 1). This
report indicates the following GHG reductions that are possible through each goal.
-9-EGSPA Economic Costs and Benefits Gardner Pinfold
Table 1: Contribution of each goal toward overall GHG reduction target
Goal Mt GHG avoided
1 - Reducing GHG emissions by 50% 5.80
2 - 90% of electricity with renewables 5.36
3 - 100% of eligible social housing NZER 0.02
4 - Increase electricity efficiency to 3% per year 0.57
5 - Reducing car dependence & electrification 0.48
Sub-Total (Goals 2 - 5) 6.43
Mt = million tonnes
Note: GHG reduction target in 2030 is versus 2019 emissions.
The specific measures related to each goal are described in the report, along with the investments
required based on year by year implementation from 2019 to 2030. The sub-total (56% for Goals 2-
5) move beyond the 50% reduction target (Goal 1) and towards net-zero emissions needed by
2050. Some reductions are already underway and other measures will be undertaken by
residential, industrial, commercial and institutional sectors. In particular, other measures for: oil
and gas, building construction and renovation, commercial and industrial transportation, and other
sectors are not included in this report.
6. Benefit-cost analysis concepts
In order to assess the benefits and costs associated with a policy or investment, a benefit-cost
analysis is commonly used to assess the merits of the decision. The general approach is to
determine what happens if the policy or investment is adopted versus what happens without the
change (commonly referred to as “business as usual”). The analysis for each goal in this report uses
this approach and the results are calculated as the difference between the two decision paths. For
example, there are GHG emissions associated with adoption of battery electric buses (i.e. electricity
generation emissions), and there are emissions from diesel buses, so the result of shifting to electric
buses is the difference in GHG emissions (i.e. net savings). The same approach is used to assess
financial costs, where there are costs associated with each type of bus and we calculate the
difference in costs to determine whether there is a net cost or a net savings.
Since benefits and costs occur over time, it is also important to understand how these are handled.
Purchasing buses has an initial cost (purchase price) as well as operational costs (maintenance,
energy) every year. Costs and benefits are valued differently today than they are in the future. This
is linked to the “time-value of money” where money (typically) loses value over time due to
inflation, but also due to the possibility of investing it. For instance, you may be able to buy
something today for $100 and, due to inflation, the same item costs $102 next year (2% inflation)
so you would not be able to claim the same goods for $100. Also, if you have $100 today, you have
the option of investing it to obtain $105 instead of just $100 in a year (5% interest). For this reason,
we “discount” future costs and benefits when we want to represent them in today’s dollars. The
discount rate is a percentage used to adjust future values and this report uses a 5% rate based on
Treasury Board of Canada Guidelines for Cost-Benefit Analysis. The results for each goal are based
on discounted costs and benefits each year to 2030, and there are separate results based on a 20-
year analysis (2019 - 2039).
- 10 -EGSPA Economic Costs and Benefits Gardner Pinfold
Goal 1: Reducing GHG emissions 50% below 1990 levels
Nova Scotia’s work to reduce emissions in the last 15 years should be celebrated, but much more
work is needed considering the context of the climate crises outlined by the Intergovernmental
Panel on Climate Change’s Special Report on 1.5ºC of Global Warming. Nova Scotia’s current
emissions reductions trajectory does not contribute enough toward Nova Scotia’s fair share of the
Paris Agreement’s goal of keeping global warming below 1.5°C, and misses critical opportunities to
grow the prosperous, green economy in the province. Nova Scotia’s failure to have legislated
climate targets out to the year 2030 will make it difficult for it to contribute its fair share of Paris
Agreement emission reductions and remain a leader in the environment.
The New England Governors and Eastern Canadian Premiers Climate Change Action Plan (2001) is
the origin for the 2020 EGSPA climate change goal. The 2001 agreement set a commitment to
reducing GHGs 10% below 1990 levels by 2020, and a long-term goal of at least 75% below 1990
levels - Nova Scotia surpassed the 2020 target in 2014.
EAC’s goal sets a course to at least 50% reductions below 1990 by 2030 – leading to total provincial
CO2e emissions of about 9.8 million tonnes (Mt). This level is consistent with Nova Scotia’s fair
share of emissions reductions to meet the Paris Agreement’s target of keeping global warming
below 1.5°C, and allows Nova Scotia to benefit from the opportunity of this transition to a
prosperous, green economy.
Figure 2: Nova Scotia GHG reduction target and potential from this report
This target is also consistent with the 2030 Declaration, which calls for a justice-based transition to
a new green economy in Nova Scotia, while highlighting principles based in the Peace and
Friendship Treaties between the Mi’kmaq and settlers, and moving toward economic,
environmental and racial justice. The 2030 Declaration (Anon., 2019) has more than 45
organizational signatories from across Nova Scotia including labour unions, student groups,
Mi’kmaq groups, faith groups, businesses, anti-poverty advocates, academics, environmental
groups, workers and grassroots people.
- 11 -EGSPA Economic Costs and Benefits Gardner Pinfold
The exact carbon reduction measures that will lead to this provincial greenhouse gas emissions
reduction target are analyzed in Goals 2 through 5 of this report. Encouragingly, the goals analyzed
in this report show that emissions reductions of about 56% below 1990 levels by 2030 are possible,
providing further opportunity for Nova Scotia to reduce emissions and grow the green economy.
- 12 -EGSPA Economic Costs and Benefits Gardner Pinfold
Goal 2: Supplying 90% of NS electricity needs with renewables
1. Background
As of 2017, Nova Scotia utilized coal-fired generation for about 55% of its annual electricity needs,
making it Canada’s most coal-dependent province. The “Reduction of Carbon Dioxide Emissions
from Coal-Fired Generation of Electricity Regulations” came into force from the federal government
in September 2012. The regulations state that coal-fired electricity generating units are the highest
emitting stationary sources of GHGs and air pollutants in Canada. These regulations would have
triggered the decommissioning of Nova Scotia coal and petroleum coke power stations, but the
2015 “Canada-Nova Scotia equivalency agreement regarding greenhouse gas emissions from
electricity producers” allowed Nova Scotia to maintain coal-fired stations as long as an equivalent
reduction in GHG emissions could be achieved by other means up to 2030. The decommissioning of
coal-fired stations remains as one of the most cost-effective means of achieving large reductions in
GHG emissions in the province. The recently released Generation Energy Council Report (2018)
reiterates the call for an accelerated nationwide coal phase-out by 2030 (ECCC, 2016).
The current EGSPA target is to generate 40% of electricity from renewable sources by 2020 and
this is on track to be achieved and surpassed by Nova Scotia Power (NSP). Nova Scotia has
successfully demonstrated the ability to deploy multiple renewable sources of electricity generation
capacity. Multiple wind farms through NSP direct investment and community feed-in tariffs
(COMFITs), NSP infrastructure investments to bring hydro power from Newfoundland and
Labrador (Maritime Link), and solar initiatives by the Province and Halifax Regional Municipality
are all contributing.
Achieving the EAC goal will involve the following anticipated additions of renewable electricity
capacity and energy efficiency measures:
500 MW of additional industrial wind capacity through competitive RFPs;
300 MW of additional community wind capacity through competitive RFPs;
330 MW of solar capacity (residential, community, institutional and grid-scale);
200 MW of energy storage (grid-scale, residential and commercial);
153 MW of hydro imports from Muskrat Falls through the Maritime Link (NS Block);
153 MW of hydro imports from Muskrat Falls through the Maritime Link (Market Block);
200 MW or hydro imports from Hydro Quebec and through New Brunswick; and
3% Energy Efficiency Benchmark by 2030 (as per goal #4 of this report).
Achieving this level of emissions reductions and renewable energy generation will also require the
below changes to the electricity system:
Decommission 1,234 MW of coal generation across 8 thermal units;
Decommission 60MW biomass generation at Port Hawkesbury
Reducing the use of natural gas and oil in the province to 9.0% of total generation;
Continued investments in transmission and power quality measures;
Continued grid collaboration between New Brunswick and Newfoundland & Labrador;
2. Analysis
The twenty-year analysis begins with the same starting point in 2019 for the base case (business as
usual) and policy case (EAC goal). The base case is primarily informed by the Nova Scotia Utility
and Review Board (NSUARB) report of July 2018: “Nova Scotia Power 10 Year Outlook”. This report
- 13 -EGSPA Economic Costs and Benefits Gardner Pinfold
recognizes that discussions regarding energy efficiency investments and the status of coal-fired
stations is yet to be finalized.
The federal government finalized its regulations for the phase-out of coal power across Canada by
2030 in 2018. The Regulatory Impact Analysis Statement (RIAS) that accompanied the “Regulations
Amending the Reduction of Carbon Dioxide Emissions from Coal-fired Generation of Electricity
Regulations” (Government of Canada, 2018) provides a cost-benefit analysis of replacing Nova
Scotia coal-fired stations with natural gas capacity. Although the EAC goal does not seek to replace
any generating capacity with natural gas, the RIAS still provides much of the data needed for this
analysis.
Canada’s National Energy Board (NEB) estimates annualized costs for electricity generation from
different sources including renewables. Since costs continue to drop rapidly for renewables such as
wind and solar, the analysis may understate the benefits of the proposed transition.
Table 2: Goal 2 base case versus policy case assumptions and variable settings
Base case Policy case Sources*
General
NS population growth 100.2% 100.2% Statcan Census, 2016
Generation by energy source
Coal and Petcoke 33.6% 0.0% NSUARB, 2018
Natural Gas & Oil 10.0% 9.0% NSUARB, 2018
Solar (Community, Grid-Scale, Residential) 1.0% 3.5% NSUARB, 2018
Large Biomass 2.5% 0.0% NSUARB, 2018
Small Biomass/Tidal/Other 0.5% 3.5% NSUARB, 2018
Existing Wind (Community & Commercial) 18.0% 18.0% NSUARB, 2018
New Community Wind 0.0% 7.1% NSUARB, 2018
New Commercial Wind 0.0% 19.0% NSUARB, 2018
Hydro Legacy 9.0% 9.0% NSUARB, 2018
Hydro Import MF 22.7% 22.7% NSUARB, 2018
Hydro Import QC/NB 2.7% 8.2% NSUARB, 2018
Costs by energy source
Coal and Petcoke $0.05 $0.05 Lazard, 2018**
Natural Gas & Oil $0.08 $0.08 Lazard, 2018**
Large Biomass $0.14 $0.14 NEB Canada, 2016
Small Biomass/tidal/other $0.14 $0.14 NEB Canada, 2017
Existing Wind (Community & Commercial) $0.08 $0.08 NEB Canada, 2017
New Community Wind $0.04 $0.04 NEB Canada, 2017
New Commercial Wind $0.04 $0.04 NEB Canada, 2017
Hydro Legacy $0.06 $0.06 Nalcor, 2019
Hydro Import MF $0.04 $0.04 Nalcor, 2020
Hydro Import QC/NB $0.04 $0.04 NEB Canada, 2017
Solar $0.18 $0.18 NEB Canada, 2017
- 14 -EGSPA Economic Costs and Benefits Gardner Pinfold
Notes: All values are converted to 2019 CAD using Nova Scotia CPI for all items; Twenty-year net-present
values are based on 5% discount rate; Carbon pricing according to Federal Government path starting at $20
per tonne in 2019 with annual increases of $10 per tonne (i.e. $130 in 2030); Decommissioning,
refurbishment, and maintenance costs according to Canada Gazette, 2018. *Sources refer to base case values
since policy case values are set according to EAC goals and Gardner Pinfold calculations **The midpoints of
Lazard’s value ranges in U.S. dollars are converted to Canadian dollars at 1US to 1.30CAD for 2018.
3. Results
Decommissioning coal-fired power plants and installing renewable capacity will require a net
investment by 2030. This goal results in net annual costs of $6 per tonne of GHG avoided by 2030
and a cumulative net present value (NPV) of costs near $27 per tonne. Once the conversion is
complete the long-term costs fall further. These are clearly within the range of incentives that will
be driven by long-term cap and trade or carbon pricing paths.
Table 3: Goal 2 annual and NPV results by 2030
Results
Electricity generation sources by 2030…
9% from natural gas and oil
3.5% from solar
45% from wind
39% from hydro
3.5% from small biomass, tidal, other
Annual impacts of reaching the 2030 target…
$21,544,404 invested in converting to renewables
3,517,915 tonnes of GHGs avoided per year*
$6 cost per tonne of GHG avoided
Cumulative 12-yr NPV of impacts by 2030
$568,804,207 invested in converting to renewables
21,107,492 tonnes of GHGs avoided
$27 cost per tonne of GHG avoided
*This is the difference between base case and policy case in 2030, not compared to today.
4. Economic impacts
There are two broad types of economic impacts, namely those associated with the
decommissioning of the fossil fuel generation capacity, and those associated with the replacement
by renewable energy sources. The decommissioning activities involve capital and operating
impacts. The shut-down of facilities involves salvage of assets and otherwise dismantling
structures. These capital projects generate economic activity through engineering, demolition,
transport, waste disposal, site remediation and potential monitoring. There would have been
refurbishment of generating stations, which would have generated economic impacts, but not to the
same magnitude as decommissioning. The operating implications of decommissioning relate to
foregone fuel purchases, which are mainly imported from international suppliers along with a small
amount that comes from the Donkin coal mine in Cape Breton. Since the Donkin mine exports most
of its product, the amounts currently delivered to Nova Scotia power could find markets elsewhere.
The installation of renewable capacity, particularly wind, hydro, and solar also involves capital and
operational economic impacts. Most of the equipment is imported (turbines, solar panels etc.), but
- 15 -EGSPA Economic Costs and Benefits Gardner Pinfold
site preparation, engineering, transmission upgrades, and construction work is primarily done by
Nova Scotians with many materials sourced from within the province. The operation does not
involve fuel purchase, but there is ongoing maintenance activity.
NSP plans indicate about $45 million would have been spent annually until 2030 on refurbishment
of coal and petcoke facilities. Instead NSP will annually spend about $84 million on
decommissioning activities and $310 million on installing renewable capacity for a total of about
$394 million each year to 2030. The provincial and national economic impacts of the combined 12-
year spending total of $4.7 billion are contained in the following table.
Table 4: Goal 2 economic impacts for 2019-2030 (12-year total)
($M 2019) Direct Indirect Induced Total NS Canada
Output $4,726 $1,448 $984 $7,159 $9,291
GDP $2,456 $759 $614 $3,828 $4,847
Income $1,221 $543 $263 $2,026 $2,615
Jobs (FTE) 20,642 10,268 7,189 38,099 48,644
Fed tax* $157 $75 $43 $275 $363
Prov tax* $186 $96 $62 $344
Source: Statistics Canada Interprovincial Input-Output Model, 2014 *Tax impacts combine StatCan model
results and Gardner Pinfold income tax calculations based on StatCan SPSDM marginal effective tax rates.
- 16 -EGSPA Economic Costs and Benefits Gardner Pinfold
Goal 3: Deep Energy and Resiliency Retrofits for 100% of Eligible
Social Housing
1. Background
With about 12% of Nova Scotia’s GHGs coming from housing and buildings, this sector remains an
important focus of GHG reduction efforts. The Pan Canadian Framework on Clean Growth and
Climate Change (ECCC, 2016) prepared by federal, provincial, and territorial Ministers of the
Environment called for NZER building codes across Canada by 2030. Natural Resources Canada
(NRCan) is now signaling a move toward NZER building standards (NRCan, 2019a) and has
invested in pilot projects to determine the readiness of construction companies to meet this
challenge. This includes the creation of pilot projects for prefabricated exterior wall systems
(NRCan, 2018a). The Pan Canadian Framework on Clean Growth and Climate Change is also
developing codes for existing buildings, aimed to elevate the energy performance of the existing
building stock in Canada.
The National Research Council of Canada writes, “a net-zero energy building is defined as a high
performance building that combines superior standards in energy efficiency with renewable
energy production to offset all of the building’s annual energy consumption. A net-zero energy
ready (NZER) building is defined as a high performance building that is built to the same level
of energy efficiency as a net zero energy building, but does not include renewable energy
production” (National Research Council Canada, 2016). NZER buildings are very energy efficient
structures that reduce heating and cooling needs to such low levels that if renewable power (e.g.
solar panels) were installed, the building would be a net producer of energy rather than a
consumer. NZER homes are up to 80% more efficient than new homes built to current building code
standards. Although it is easier to reach NZER standards with new construction, it is also possible
to achieve this with renovations. NZER houses, passive houses (www.passivehouse.ca), and deep
energy retrofits are related concepts with shared aims.
Inspired by a Dutch model, we propose to perform deep energy retrofits of the social housing stock
in Nova Scotia. The Dutch strategy to retrofit existing homes and buildings to achieve Net Zero
Energy Ready or even Net Zero standards is called EnergieSprong (or Energy Leap in English). The
EnergieSprong model retrofits social housing using prefabricated exterior wall systems,
aggregation of projects, and innovative financing. The retrofits take a total of 1-14 days to complete
and residents do not need to leave their homes. The resulting performance of homes typically
meets Net Zero Energy Ready or Net Zero Standards. The model has successfully retrofit 1,300
units so far. Over the course of four years, the price of the retrofit projects has reduced by 50%, and
the length of time to complete a project has reduced from fourteen days to one day. Deep energy
retrofits in social housing acts as a catalyst for the deep energy retrofit market.
Social housing in NS is managed by Housing Nova Scotia (HNS), which maintains a large portfolio of
properties to provide safe, suitable, and affordable housing for Nova Scotians experiencing low
income. Five Housing Authorities across the province administer, maintain, and operate over
11,500 rental units. In 2016, HNS earned a Bright Business Innovation Award from Efficiency Nova
Scotia (ENS) for a new passive house design that substantially reduces energy costs and increases
affordability for residents. Without increasing construction costs, the annual heating bill is just
$245 and the power bill is just $585. On the coldest night of the year the residence can be heated
with the equivalent of 1.5 hair dryers. HNS also renovated an existing 15 unit building to meet
passive house standards. HNS is currently examining the potential for deep energy retrofits of
- 17 -EGSPA Economic Costs and Benefits Gardner Pinfold
representative buildings in their portfolio and preliminary measures are the basis for the following
analysis.
Before proceeding, it is important to recognize that HNS does not operate all social housing in the
province as some is managed by private and non-profit entities. Also, HNS has currently withdrawn
from building new units with the view that private sector and non-profit housing organizations
have greater potential to deliver new affordable housing options. HNS emphasized that the budget
for maintenance of the existing property portfolio is limited and relies on federal funding sources
that are uncertain over longer time-frames. HNS would need to review all units for suitability to
NZER upgrades so the following is considered illustrative of costs and benefits involved in
transitioning to NZER / passive standards for the same number of units assuming they are similar
to the ones involved in the pilot study.
2. Analysis
The twenty-year analysis begins with the same starting point in 2019 for the base case (business as
usual) and policy case (EAC goal). The base case involves continued maintenance of all units
according to current building code standards. Significant renovations to the building envelopes are
needed about every 17 years, so 5.9% of the eligible portfolio is renovated each year. The policy
case involves renovating eligible units to NZER standards by 2030. This will require 8.3% to be
renovated each year, so normal maintenance costs cannot be assigned toward net-zero renovation
for all units. Once complete in 2030, there will be a period of at least five years before the next cycle
of building envelope renovations would resume.
The annual GHG emissions avoided and heating cost savings are provided by HNS staff from
RETScreen Expert software (NRCan, 2019b). The estimated NZER costs and savings are from three
sources: 1) Pembina Institute (Pembina, 2018) review of social housing energy retrofits in Canada
for multi-unit buildings over 5 stories tall, 2) Sustainable Buildings Canada report (SBC, 2019) on
the application of the Netherlands Energiesprong model in Canada, and 3) Housing Nova Scotia
pilot study and building assessment input. All sources are adapted to the Nova Scotia context
recognizing these are high level estimates that need further study to determine costs, savings, and
energy use outcomes that are specific to the HNS building portfolio. The analysis includes buildings
with 10 or more units that are 7 stories tall or less (about 2,500 HNS units are excluded) and are
based on the following information sources:
Buildings under 5 stories – renovation costs are adapted from the EnergieSprong case by
SBC, including conversations with HNS for guidance.
Buildings of 5 or more stories - renovation costs are adapted from Pembina Institute case
studies in BC, including conversations with HNS for guidance.
For the tallest buildings managed by HNS, it may be more suitable to complete deep energy retrofits
that achieve lower greenhouse gas reductions at lower cost. Each building in the HNS portfolio
must be assessed individually to determine the most cost-effective solutions.
- 18 -EGSPA Economic Costs and Benefits Gardner Pinfold
Table 5: Goal 3 base case versus policy case assumptions and variable settings
Base case Policy case Sources
General
Housing NS units 9,015 9,015 HNS, 2019
Years to renovate stock 17 11 GP estimate
% of NZER renos 0% 100% HNS, 2019
Annual % of units with reno 5.9% 9.1% GP estimate
Under 5 story building
Housing NS units 8,778 8,778 HNS, 2019
Cost of reno $34,530 $86,324 HNS, 2019; SBC, 2019; Altus, 2018
Annual heating savings $100 $1,691 GP estimate
GHG savings t/yr 0.10 2.20 GP estimate
5 or more story building
Housing NS units 237 237 HNS, 2019
Cost of reno $39,000 $97,500 HNS, 2019
Annual heating savings $100 $1,691 HNS, 2019
GHG savings t/yr 0.10 2.20 HNS, 2019
Notes: All values are converted to 2019 CAD using Nova Scotia CPI for all items; Twenty-year net-present
values are based on 5% discount rate; Carbon pricing according to Federal Government path starting at
$20/tonne in 2019 with annual increases of $10/tonne (i.e. $130 in 2030).
3. Results
This goal has a breakeven point in 2030 (12 years) and a payback period in 2036 (18 years). The
breakeven point is where the annual savings from reduced heating costs for NZER buildings starts
to offset the annual investments in renovations. After this point the savings accumulate rapidly
while the annual renovation costs decline. From 2030 to 2038 the $3,037 cost per tonne drops to a
$353 cost per tonne and continues to drop thereafter.
Table 6: Goal 3 annual and NPV results by 2030
Results
Upgrades by local suppliers
9,015 units upgraded to NZER
33,683 windows and doors installed by local suppliers
Annual impacts of reaching the 2030 target…
$15,244,365 family savings for all units
$1,691 family savings per unit
$32,981,129 total annual savings
15,797 tonnes of GHGs avoided per year*
$2,088 saved per tonne of GHG avoided
Cumulative 12-yr NPV of impacts by 2030
$357,617,685 net investments in NZER homes
117,760 tonnes of GHGs avoided
$3,037 cost per tonne of GHG avoided**
*This is the difference between base case and policy case in 2030, not compared to today.
**It is very important to recognize the 2030 result reflects the up-front investment, and after that 2030 the
cost per tonne drops to $353 as savings accumulate to 2038.
- 19 -EGSPA Economic Costs and Benefits Gardner Pinfold
4. Economic impacts
The economic impacts of this goal can also be broadly divided according to capital and operational
expenditures. The capital impacts are straight-forward since renovations are already carried-out
for social housing and moving to NZER standards simply involves more renovation activity. Since
many of the materials are available in Nova Scotia (e.g. windows, doors, basic materials) and
virtually all of the labour will be Nova Scotian, this represents a substantial economic benefit to the
province. The operational impacts depend on the type of energy that will be displaced as a result of
the NZER renovations. When an electrically heated home saves on energy there will be reduced
demand for NSP electricity. In the case of an oil or natural gas heated home this will reduce imports
of fossil fuels from outside the province. Since two-thirds (67%) of HNS units are heated by oil or
natural gas, and just 23% are heated by electricity, the economic benefits will certainly exceed
losses to NSP. Instead of purchasing imported fossil fuels, households will spend more on Nova
Scotia products.
There will be an incentive to convert oil heating systems over to electrical systems and this will
partially offset the reduced demand for NSP from existing electrically heated homes. The cost of
fossil fuels is rising due to carbon pricing and/or carbon caps in the province, and the emissions
intensity of NSP electricity goes down (from pursuing the goals in this report).
Finally, it is important to recognize that the construction and renovation industry in Nova Scotia
will build capacity for delivering high performance homes. HNS represents only a small portion of
the residential stock in the province that can benefit from NZER renovations. Indeed, Efficiency
Nova Scotia delivers the HomeWarming program to other low-income households on behalf of the
Province and Nova Scotia Power. Much larger emissions reductions and economic impacts can be
achieved province-wide as NZER standards are anticipated in national codes.
Meeting NZER standards involves HNS spending about $47 million more per year on renovations
than required to meet current codes, for a total of $560 million by 2030. The household energy
savings means that spending on fossil fuels for electricity generation as well as for oil and gas used
directly to heat homes, will shift nearly $8.5 million per year and a total of $102 million by 2030 to
general household spending in Nova Scotia. The provincial and national economic impacts of the
12-year $662 million spending total are below.
Table 7: Goal 3 economic impacts for 2019-2030 (12-year total)
($M 2019) Direct Indirect Induced Total NS Canada
Output $662 $206 $187 $1,055 $1,452
GDP $319 $107 $117 $543 $730
Income $282 $74 $50 $406 $513
Jobs (FTE) 7,789 1,761 1,369 10,920 12,972
Fed tax* $34 $10 $7 $52 $67
Prov tax* $37 $13 $10 $60
Source: Statistics Canada Interprovincial Input-Output Model, 2014 *Tax impacts combine StatCan model
results and Gardner Pinfold income tax calculations based on StatCan SPSDM marginal effective tax rates.
- 20 -EGSPA Economic Costs and Benefits Gardner Pinfold
Goal 4: Tripling Nova Scotia’s Demand Side Management Target
1. Background
The fourth goal of this report works to greatly expand the work being done in energy efficiency
(Demand Side Management) in the electricity sector in Nova Scotia. Energy efficiency is the first
energy transition pathway in the 2018 Generation Energy Council report. The report indicates that
reducing wasted energy in Canada could meet one-third of the country’s Paris commitments,
delivering savings to Canadians while achieving substantial GHG reductions. The report calls for
annual 2% efficiency gains up to 2025, then 3% efficiency gains by 2030 in the electricity sector.
Although this goal only explores energy efficiency for electricity usage, the measures in the
Generation Energy Council report also include:
Freight transport – Bring fleet fuel efficiency in line with global leaders, shift long-distance
transport from truck to rail;
Buildings – Develop building codes for net-zero energy in new construction and high energy
efficiency renovations, and label energy efficiency of homes for prospective buyers, renters,
and lessors;
Personal transport – Single passenger trips are halved in all major cities, transit and active
transport is promoted and supported through infrastructure investments;
Industry – 75% of industry energy use is part of an energy management system, and
Canada’s energy productivity meets or exceeds that of the U.S.; and
Utilities – regulatory frameworks require utilities to procure energy efficiency and peak
demand reductions as a first priority.
The measures underlying this goal for Nova Scotia focus primarily on residential and commercial
sectors. The following are excerpted from the Navigant report as included measures:
Residential:
Efficient Products (Appliance Retirement) - Cash incentive for disposal of old inefficient
appliances;
Efficient Products (Direct Install) - Free installation of low-cost efficiency measures like
lightbulbs and hot water piping insulation;
Efficient Products (Instant Savings) - In-store savings on energy efficient products;
New Construction (Performance Plus) - Rebates for construction of energy efficient homes;
Existing Homes (Green Heating) - Rebates for energy efficient space-heating sources;
Existing Homes (Solar Program) - Rebates for solar photovoltaic panel installations;
Home Energy Assessment - Subsidized energy assessments and reports for residential
homes; and
Multi‐ Unit Residential Building (MURB) Program (individual suite measures) - Rebates and
financing for energy efficient upgrades to MURBS.
Commercial and Industrial:
Business Energy Solutions;
Business Energy Rebates (i.e. commercial kitchens, commercial laundry, commercial
refrigeration, motors and variable speed drives, central heating and cooling etc.); and
Multi-Unit Residential Building (MURB) Program.
- 21 -You can also read