Assessment of Brazil's Labeling Program for Air Conditioners - MARCH 2019
←
→
Page content transcription
If your browser does not render page correctly, please read the page content below

MARCH 2019

Assessment of Brazil’s
Labeling Program
for Air Conditioners

This report has been produced by CLASP with support from the Instituto Clima e Sociedade and the
Climate Works Foundation, February 2019.

CLASP makes no representations or warranties implied. The work presented in this report represents our
best efforts and judgments based on the information available at the time this report was prepared.

CLASP is not responsible for the reader’s use of, or reliance upon, the report, nor any decisions based on the
report. Readers of the report are advised that they assume all liabilities incurred by them, or third parties, as a
result of their reliance on the report, or the data, information, findings and opinions contained in the report.

Contents

LIST OF FIGURES

LIST OF TABLES

1. INTRODUCTION: THE PURPOSE OF ENERGY EFFICIENCY LABELING       10

2. ENERGY EFFICIENCY LABELING FOR ROOM ACS IN BRAZIL		           13
       Brazilian Labeling Program					                           14

       Selo PROCEL					 		 15

       Brazilian AC Market Evolution, Drivers, and Trends		      17

3. INTERNATIONAL LABELING PROGRAMS FOR ROOM AIR CONDITIONERS     20
       The European Union					                                   21

       India						 		 26

       China						 		 32

       Southeast Asia					 		 34

           Vietnam							 34

           Thailand						                                        35

       Summary						                                             37

4. CONCLUSIONS AND RECOMMENDATIONS			                            38

                                                                         3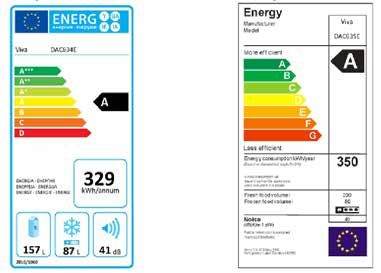
Contents

LIST OF FIGURES

     Figure 1: Production-weighted average EER/ISEER of ACs sold in India, 2011-2017            6
     Figure 2: Timeline of the Brazilian Labeling Program for ACs			                            14
     Figure 3: PBE Comparative Label for ACs						                                              15
     Figure 4: Selo PROCEL for ACs							                                                       16
     Figure 5: Evolution of the Brazilian Split AC Market					                                  17
     Figure 6: Evolution of Indian and Brazilian Top Labeling Tiers for Split ACs 2010-2016     18
     Figure 7: Proportion of Split AC Models per Efficiency Class (2006-2018) in Brazil         19
     Figure 8: 2010 (left) and 1992 (right) versions of the EU energy label for refrigerators   22
     Figure 9: Electrolux illustration of the efficiency class of 2015
               machine on the December 2015 energy label				                                    23
     Figure 10: Refrigerator Market Share by Label Level in the European Union		                24
     Figure 11: Indian Energy Efficiency Label for Split ACs				                                26
     Figure 12: Star Level Improvement for Window and Split ACs, 2009- 2018		                   27
     Figure 13: Indian AC Market by Star Level 2011-2017				                                    30
     Figure 14: Production-weighted average EER/ISEER of ACs, 2011-2017		                       31
     Figure 15: Market Share of Fixed Speed and Inverter ACs				                                31
     Figure 16: China Energy Label							                                                       32
     Figure 17: China Energy Conservation Certification Label			                                32
     Figure 18: Vietnam endorsement label (left) and energy label (right)		                     34

LIST OF TABLES

     Table 1: Overview of Case Study Economies					                                             21
     Table 2: Existing and Proposed EU AC Labeling Tiers				                                    25
     Table 3: Revisions in Star Rating Levels for Window ACs                                    20
     Table 4: Revisions in Star Rating Levels for Split ACs				                                 27
     Table 5: ISEER Temperature Bins							                                                     29
     Table 6: T1 Temperature Bins							                                                        35
     Table 7: SEER Levels for Thai EGAT Nº 5 Label					                                         36
     Table 8: Summary of AC Labeling Programs					                                              37
THIS STUDY WAS CARRIED OUT TO EVALUATE THE EVOLUTION AND IMPACTS OF
   THE BRAZILIAN LABELING PROGRAM COMPARATIVE LABEL AND THE SELO PROCEL
   ENDORSEMENT LABEL FOR AIR CONDITIONERS. THE STUDY ALSO ASSESSES
   OPPORTUNITIES TO ADVANCE ENERGY EFFICIENCY IN BRAZIL BY IDENTIFYING
   INTERNATIONAL BEST PRACTICES IN APPLIANCE AND PRODUCT LABELING
   PROGRAMS AND THEIR RELEVANCE TO THE BRAZILIAN CONTEXT.

   Energy labeling is a critical component of effective appliance energy efficiency policy.
   While minimum energy performance standards (MEPS) remove the least-efficient products
   from the market, energy labels drive product markets to higher efficiency in three ways by:
         Allowing consumers to make informed purchasing decisions by differentiating high
         efficiency products from average and low efficiency products;
         Incentivizing manufacturers to produce more efficient products by helping them to
         market their high efficiency products, as the label provides unbiased evidence that
         their products are more efficient; and
         Providing the foundation for market transformation programs by allowing policymake-
         rs to easily identify high efficiency products to target for bulk purchasing, financing, and
         incentives.

KEY FINDINGS
   Brazil has well-developed and well-known energy labels for electricity-consuming products.
   There are two energy labels for electricity-consuming products in Brazil:

   1     The mandatory Brazilian Labeling Program (PBE, for its initials in Portuguese) compa-
         rative label with categories from ‘A’ to ‘C’ or ‘G,’ depending on the product and

   2     The voluntary Selo PROCEL endorsement label. The PBE is managed by the Brazilian
         National Metrology, Quality, and Technology Institute (INMETRO), who began the discus-
         sion around energy labeling in Brazil in 1984. The Selo PROCEL, which was first launched
         for window air conditioners (ACs) in 1996, is managed by the Electricity Conservation
         Program (PROCEL) of the state-owned electricity generation and transmission company,
         Eletrobras. These two labels are closely interconnected; for example, any room AC that
         achieves the ‘A’ class on the PBE can also receive the Selo PROCEL.

                                                                                                        5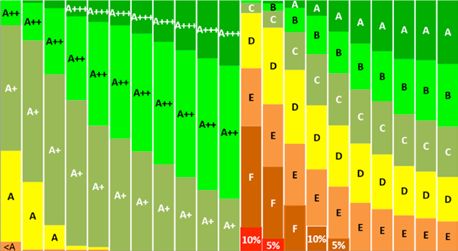
The labels have been effective at reducing energy demand and have a strong influence on the
                             mini-split room air conditioner market.
                             Consumers in Brazil respond to the labels, and manufacturers, importers, and retailers all recognize
                             that products that do not attain an ‘A’ rating and the Selo PROCEL do not sell well. A 2015 study
                             conducted by INMETRO found that 91% of consumers recognized the comparative label, 79.9%
                             said they understood the label, and 68.3% said that they would pay 10% more for a product bea-
                             ring the Selo PROCEL1. Because of the preference for ‘A’ rated products that bear the Selo PROCEL,
                             many manufacturers seek to primarily or exclusively produce ‘A’ rated products, and some retailers
                             only carry ‘A’ rated products.2 The influence of the labeling program on manufacturers’ production
                             decisions is evident in the products available on the market; the most common efficiency level for a
                             split AC is an energy efficiency ratio (EER) of 3.24 W/W, which is just above the ‘A’ class and Selo PRO-
                             CEL threshold of 3.23 W/W.3 The two AC labels combined have had a significant impact in reducing
                             energy demand in Brazil, saving an estimated 2 TWh of electricity in 2009 alone.4

                             The Brazilian Labeling Program and Selo PROCEL are not currently promoting high efficiency
                             split air conditioners.
                             The criteria for the ‘A’ class label and Selo PROCEL for split ACs have been virtually unchan-
                             ged over the past 10 years. As of 2019, only categories ‘A’ and ‘B’ may be sold in the market,
                             as ‘C’ and below do not meet the current MEPS.5 In addition, all ‘A’ class products are eligible
                             for the voluntary Selo PROCEL endorsement label. This means that 77% of split ACs being
                             sold in the market are now ‘A’ class and eligible for the Selo PROCEL. This has greatly redu-
                             ced the value of both the PBE and Selo PROCEL, because neither clearly differentiates hi-
                             ghly efficient products from average efficiency or even below average efficiency products.
                             This lack of differentiation has slowed the improvement of energy efficiency for split ACs,
                             with the median efficiency only increasing 10.2% over 8 years, since 2010.6

Figure 1: Production-weighted average EER/ISEER of ACs sold in India, 2011-2017

                                  4,10
    Production-Weighted Average

                                  3,90                                                                                                         3,6
                                  3,70
             EER/ISEER

                                  3,50                                                                    3,20               3,23
                                  3,30                                                 3,10
                                                                     3,00
                                  3,10                 2,90
                                          2,80
                                  2,90
                                  2,70
                                  2,50
                                          2011         2012          2013              2014               2015               2016              2017

                                                                        Financial Year

1 BRACIER. “USO DE ETIQUETAS DE CONSUMO DE ENERGIA GERÁ ECONOMIA DE R$ 2,9 BI EM DEZ ANOS.” 2015.
Available online at: http://bracier.org.br/noticias/brasil/5288-uso-de-etiquetas-de-consumo-de-energia-gera-economia-de-r-2-9-bi-em-dez-anos
2 Based on interviews with manufacturers and retailers, conducted in August 2018.
3 Based on data from the PBE product database (from 2004 to 2018)
4 Balbino Cardoso, Rafael. “Estudo dos impactos energéticos dos Programas Brasileiros de Etiquetagem Energética: Estudo de caso em

refrigeradores de uma porta, condicionadores de ar e motores elétricos.” UNIVERSIDADE FEDERAL DE ITAJUBÁ. 2012.
5 Diário Oficial da União. “PORTARIA INTERMINISTERIAL Nº 2, DE 31 DE JULHO DE 2018.”
6 Based on data from the PBE product database (from 2004 to 2018)

                                                                                                                                                      6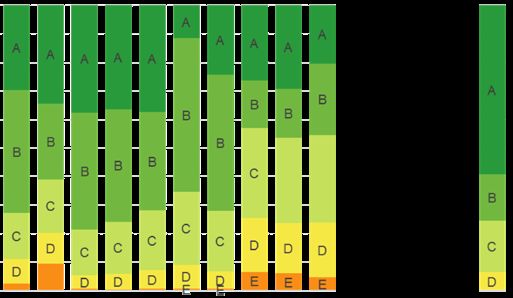
By comparison, the average efficiency of ACs sold in India improved 29% over 6 years, from
           2011 to 2017, as can be seen in Figure 1.7 Similarly, the efficiency improvement of ACs in
           Vietnam was 30.8% over 5 years from 2013-2018.8 These differences in efficiency improve-
           ments can be explained, at least in part, by the fact that labeling programs in both of these
           countries have increased the stringency of their top category by at least 9% since 2010.

KEY RECOMMENDATIONS
           The Brazilian Labeling Program and Selo PROCEL are well placed to move the Brazilian split
           AC market to high efficiency products, as they are well-understood and recognized by con-
           sumers, and they clearly affect the behavior of AC manufacturers. Realizing this potential
           and meaningfully improving the efficiency of split ACs sold in Brazil will require revisions to
           these programs. Based on lessons learned and best practices from a review of international
           labeling programs for ACs, CLASP recommends the following:

                       The PBE and Selo PROCEL should transition to a seasonal performance metric to rate
                       the efficiency of both fixed speed and inverter ACs.
                       Inverter ACs are as much as 51.7% more efficient than fixed speed ACs.9 However,
                       the EER test metric currently used by the Brazilian Labeling Program and the Selo
                       PROCEL, does not capture the efficiency benefits of inverter units.10 This means that a
                       substantially more efficient inverter AC is presented as having the same efficiency as
                       a much less efficient fixed speed unit.11 To ensure that the highest efficiency products
                       are being appropriately promoted by the Brazilian Labeling Program and the Selo
                       PROCEL, these programs should move to a seasonal performance metric, such as the
                       seasonal energy efficiency ratio (SEER), as soon as possible.
                       In countries such as India, Thailand, and Vietnam, the transition to seasonal performance
                       metrics has led to a doubling or more of the market share of inverter ACs. 12 In India, this
                       increase in inverter market share accounts for nearly half of the total improvement in the
                       average efficiency of AC units sold.13 As in these countries, a transition to a seasonal per-
                       formance metric in Brazil should not be overly burdensome, since Brazil already uses the
                       ISO 5151 test method.14 The ISO 16358 evaluation method that allows for fixed speed and
                       inverter ACs to be rated under the same metric simply builds on the ISO 5151 test method
                       by calling for the same efficiency test to be conducted at part load in addition to full load,
                       and does not require any additional test laboratory equipment.15

                       The labeling tiers for the Brazilian energy label for split ACs should be re-scaled
                       as soon as possible.
                       In order for the label to clearly differentiate high efficiency products, the label must
                       be re-scaled with products represented in at least four categories from most efficient

7 Based on data collected by the CLASP India team from the BEE AC database.
8 Based on data collected by CLASP in 2013 and 2018 in these markets. The 2013 data was reported in EER and converted to SEER based on the

conversion equation for fixed speed units. As such, it does not account for the efficiency benefits of inverter units in these markets in 2013.
9 Yoon, M.S., J. H. Lim, T. S. M. Al Qahtani, Y.J. Nam. “Experimental Study on Comparison of Energy Consumption between Constant and Variable Speed

Air-Conditioners in Two Different Climates.” Proceedings of the 9th Asian Conference on Refrigeration and Air-conditioning. June 2018.
10 The energy efficiency ratio (EER) is the ratio of the cooling capacity (in Watts) to the total power consumption (in Watts) at standard rating conditions.

This means the higher the EER, the more efficient the air conditioner.
11 Various manufacturers estimated that the inverter market share in Brazil is between 30% and 45%.
12 CLASP. “Cooling in a Warmer World.” January 2019. Available online here: https://issuu.com/claspngo/docs/clasp_-_cooling_in_warming_world?e=0
13 Based on data collected by CLASP from the Bureau of Energy Efficiency product database.
14 Diário Oficial da União “Portaria Interministerial MME/MCT/MDIC nº 364 de 24/12/2007”
15 United for Efficiency (U4E). “Accelerating the Global Adoption of Energy-efficient and climate-friendly air conditioners”. 2017.

                                                                                                                                                                7
(‘A’) to least efficient (‘D’). This revision should be based on the new, seasonal perfor-
                       mance metric. The revision should ensure that there are products actively being sold
                       that fall into at least four categories (A to D) so that consumers can identify a variety
                       of different efficiencies in the market. In addition, the ‘A’ class and Selo PROCEL crite-
                       ria should be sufficiently stringent so that only high efficiency, inverter AC units can
                       achieve these designations.
                       Such a requirement to have at least four categories, with the highest category reser-
                       ved for highly efficient products, is in line with international best practice.
                                 In the European Union labeling program, on which the PBE is based, the ‘A’ class
                                 must contain no products at the time of re-scaling and the label must be re-s-
                                 caled any time that ‘A’ class products account for 30% or more of the market, or
                                 ‘A’ and ‘B’ class products together account for more than 50% of the market.
                                 In China, there must be at least three and no more than five labeling tiers, with
                                 products in each tier being actively produced. This requirement for multiple
                                 tiers, where each account for some market share, allows Chinese policymakers
                                 to make market transformation targets based on the tiers; for instance, the Cen-
                                 tral Government requires that products in the top tier or top two tiers achieve
                                 certain market shares.

                       The PBE should publish a multi-year split AC policy revision roadmap
                       This roadmap should cover at least the coming six years, with 5% to 10% increases
                       to each labeling tier every two years. Such increases will ensure that the labeling
                       tiers keep pace with the products available in the market, continue to differentiate
                       high efficiency products, and encourage consumers to purchase more efficient pro-
                       ducts. Announcing these increases well in advance, with a roadmap, will give the
                       AC industry certainty as to the policy direction and allow them the necessary time
                       to plan investments to produce ACs in the desired tiers. Multiple AC manufacturers
                       operating in Brazil have requested such a roadmap for this reason.16
                       The effectiveness of such an AC policy roadmap can be observed in India, where
                       a roadmap was implemented from 2010 to 2016, driving the 29% improvement in
                       efficiency while also securing the AC industry’s support for energy efficiency poli-
                       cies. This roadmap included increasing the stringency of the labeling tiers every two
                       years over the six-year period, which ensured that the label kept pace with energy
                       efficiency improvements in the market. Similarly, the announcement of the move to
                       a seasonal metric led to an increase in the market share of inverter ACs even before
                       the seasonal metric became mandatory, as manufacturers shifted their production
                       plans to take advantage of the new metric.

                       The PBE should require manufacturers and importers to report sales per model.
                       The PBE’s current database of AC models on the market does not track sales per
                       model. Several AC companies noted that the database includes models that are no
                       longer sold or that were never sold in significant quantities to begin with. Requiring
                       that manufacturers and importers report sales per model will allow policymakers to

16   Based on interviews with Brazilian AC companies, conducted in August 2018.

                                                                                                                     8
track the market closely, especially what products are actually being sold, which will
                      better inform labeling tier revisions going forward.
                      Such a requirement is a key component of the Bureau of Energy Efficiency (BEE)’s
                      labeling program in India, where manufacturers and importers are required to report
                      the sales per model each quarter. A well maintained database is a necessary tool for
                      the implementation of other recommendations, as it allows for market monitoring and
                      facilitates timely revisions of the labels. It can also support market surveillance and
                      verification efforts by gathering much of the necessary information to provide a low-
                      -cost compliance check for products entering the market and to identify high-risk or
                      regularly non-compliant applicants, which can then be targeted for checks and testing.

                      The Selo PROCEL should only be applied to the best performing products.
                      Only the top 10%-25% of products available on the market should be able to achie-
                      ve the ‘A’ class efficiency criteria and therefore the Selo PROCEL. In addition, PROCEL
                      should consider additional requirements that would maximize the climate benefits of
                      the labeling program and encourage the adoption of new technologies:
                                 PROCEL should consider requiring that AC units use non-ozone-depleting, low
                                 global warming potential refrigerants in order to receive the Selo PROCEL, as it
                                 has done for refrigerators.17

                                 In order to better manage electricity demand from cooling, the Selo PROCEL could
                                 include a requirement that ACs be demand response ready, so that the AC units
                                 could be automatically cycled or turned down during peak demand. While demand
                                 response readiness has not been included in any criteria for the Selo PROCEL,
                                 there is an increasing need for grid flexibility as the share of thermal and variable
                                 renewable generation on the Brazilian grid grows.18 ACs are a key driver of peak
                                 demand and controlling such demand could significantly improve grid flexibility.

                      The value of these additional requirements should be weighed against the additional
                      cost and complexity of certifying compliance; implementing an overly complex certi-
                      fication process may lead to too few products receiving the designation and therefore
                      have limited impact, as was the case of Top Runner in China. In Brazil, the efficien-
                      cy requirements for the Selo PROCEL should continue to be based on the efficiency
                      testing conducted for the PBE, with any additional criteria heavily considering requi-
                      rements for any additional testing. For example, the efficiency requirement for the
                      Selo PROCEL could continue to correspond to the ‘A’ labeling tier, but with additional
                      requirements related to the refrigerant or demand response being easily verified from
                      the product specifications.

17 For refrigerators, the Selo PROCEL requires that the refrigerant used must have zero ozone depleting potential and a global warming potential of less

than 150 times that of CO2.
18 IEEE. “Challenges for Demand Response in Brazil.” 2015. Available online at: https://www.ieee-pes.org/presentations/gm2015/PESGM2015P-001977.pdf

                                                                                                                                                           9
1. Introduction: The Purpose of Energy Efficiency Labeling
1. Introduction: The Purpose
of Energy Efficiency Labeling
This study was carried out to evaluate the evolution and impacts of the Brazilian Labeling
Program and the PROCEL Seal endorsement label for air conditioners (ACs), and to assess
opportunities to advance energy efficiency in Brazil by identifying international best practi-
ce in appliance and product labeling programs and their relevance to the Brazilian context.
This assessment was funded by the Instituto Clima e Sociedade as part of the Kigali Cooling
Efficiency Program (K-CEP), which aims to improve energy efficiency in cooling products to
increase and accelerate the climate and development benefits of the Kigali Amendment to
phase down high global warming potential (GWP) refrigerants.
Labeling programs that promote highly efficient products are a critical element of energy
efficiency policy. They are a valuable tool for different stakeholders, including consumers, in-
dustry, government energy agencies, and other institutions interested in market transforma-
tion. Frequent revisions to the label criteria, in order to keep up with market and technology
trends, is essential to maintaining the value and integrity of the program.
Value to consumers
Informing Labels inform consumers as to which products are more or less efficient,
purchasing allowing them to make an educated decision about the trade-off between
decisions and up-front cost and operating cost, as well as the environmental benefits
differentiating of more efficient products. They can inform consumers by categorizing
products products into different efficiency tiers, identifying a product’s efficiency
relative to a continuous spectrum representing the range of efficiencies
available in the market, or by endorsing the highest efficiency products.
In order to inform consumers effectively, labels must be updated
frequently and ratcheted up as technology improves. Without such
changes, technological improvements will lead all products to be
categorized as highly efficient, and the label will no longer serve its
purpose of differentiating products.
11Value to industry
Incentives Labels also help manufacturers who produce highly efficient products
to market to market their products. An official label can be viewed as an impartial
more efficient signal that the product is highly efficient, and can therefore help to
products justify what may be a higher up-front cost. In this way, energy efficiency
labeling can help appliance manufacturers increase their revenues by
marketing products with higher upfront costs.
The labels also encourage manufacturers to improve efficiency of their
products, as these highly efficient products will be differentiated in the
market; often times, labels from the top rated products are used as a
marketing tool. This, in turn, encourages investments in research and
development in order to improve product technology. Technological
advancements that allow for greater output from less input, such as
improvements in energy efficiency, have been demonstrated to be the
key driver of long-run economic growth.19
Value to market transformation program
Providing By differentiating products, labels provide the foundation for market
easy to use transformation programs such as incentive schemes, government
categorization procurement rules, and bulk buys. Energy labels allow the administrators
for informing of such programs to easily identify the more efficient products and
program design target those products for purchase or for incentives.
With frequent updates to the label categories, labels can continuously
serve this function, as the highest category signals a high-efficiency
product relative to the average efficiency in the market. In such a
case, basing a market transformation program on the highest labeling
category can lead to noticeable improvement in the average efficiency
in the market.
19 FPress release. NobelPrize.org. Nobel Media AB 2019. Thu. 7 Feb 2019. https://www.nobelprize.org/prizes/economic-sciences/1987/press-release/
122. Energy Efficiency Labeling
for Room ACs in Brazil2. Energy Efficiency Labeling
for Room ACs in Brazil
Brazil began exploring a labeling program for energy-consuming products in 1984, though ACs
were not included in the labeling program for another decade.20 The first label for ACs was the
voluntary Selo PROCEL endorsement label for window units, launched in 1996. This was then
followed by a Selo PROCEL for split units in 2004 and then mandatory comparative labeling un-
der the Brazilian Labeling Program (PBE, for its initials in Portuguese) in 2006. The criteria for the
Selo PROCEL and the comparative label have both been revised since their introductions, though
there have been no major revisions in the past decade.
Figure 2: Timeline of the Brazilian Labeling Program for ACs
Labeling Selo PROCEL Selo PROCEL
Program PROCEL for WindowUnits for Split Units
1984 1985 1996 2004 2006 2009 2011 2013
Mandatory 1st revision 2nd revision 3rd revision
Labeling of the Labeling of the Labeling of the Labeling
Program for AC Program for AC Program for AC Program for AC
A CEE > 3,20 A CEE > 3,20 A 3,20 CEE > A 3,23The PBE label itself is based on the European Union’s label, with products categorized from ‘A’
to ‘C’ or ‘G,’ depending on the product, with ‘A’ being the highest efficiency rating.24 Consumers
respond to the label, and manufacturers, importers, and retailers all recognize that products that
do not attain an ‘A’ rating do not sell well. Because of this preference for ‘A’ rated products, many
manufacturers seek to primarily or exclusively produce ‘A’ rated products, and some retailers only
carry ‘A’ rated products.25 A 2015 study conducted by INMETRO found that 91% of consumers rec-
ognized the comparative label, 79.9% said they understood the label, and 68.3% said that they
would pay 10% more for a product bearing the Selo PROCEL.26
As part of its administration of the PBE, INMETRO main-
tains a database of all ACs authorized for sale on the Bra-
Figure 3: PBE Comparative Label for ACs zilian market, with specific information on their efficiency
and capacity, among other criteria. However, this database
does not contain sales figures for each product, and seve-
ral stakeholders have stated that it contains many models
that are not currently available in the market.27 Because of
the lack of sales information, it is not possible to use the
database to identify the sales-weighted average AC effi-
ciency in the market.
The PBE does not have a clearly defined system for deter-
mining when and how to revise labeling criteria. Typically,
the labeling tiers have been revised whenever INMETRO
has come to an agreement with local industry on a label
revision. In recent years, INMETRO, like much of the Brazi-
lian Government, has faced declining budgets. At the same
time, the agreements on label revisions have become less
frequent.28 As a result, the criteria for the ‘A’ level for ACs
has not been meaningfully revised in the past decade.
SELO PROCEL
The Selo PROCEL is an endorsement labeling program managed by the Electricity Conservation
Program (PROCEL) of the state-owned electricity generation and transmission company, Eletro-
bras. The Selo PROCEL currently covers 41 product categories, having started with refrigerators
in 1995 and having most recently added LCD TVs and LED luminaires in 2017. PROCEL faced de-
clining budgets over the past few years, with the budget decreasing by 64% from 2013 to 2016.
However, in 2016, Law 13.280 was passed, specifying that 0.4% of electricity revenues will now
go to PROCEL. As a result PROCEL’s funding in 2017 was five times larger than the budget in 2016.
With this new funding, PROCEL is seeking to update and expand the Selo PROCEL and to support
the PBE, among other activities.29
24 INMETRO. ” Histórico do Programa Brasileiro de Etiquetagem.” 2019. Available online at: http://www2.inmetro.gov.br/pbe/historico.php
25 Based on interviews with manufacturers and retail store workers, conducted in August 2018.
26 BRACIER. “USO DE ETIQUETAS DE CONSUMO DE ENERGIA GERÁ ECONOMIA DE R$ 2,9 BI EM DEZ ANOS.” 2015.
Available online at: http://bracier.org.br/noticias/brasil/5288-uso-de-etiquetas-de-consumo-de-energia-gera-economia-de-r-2-9-bi-em-dez-anos
27 Based on interviews with manufacturers operating in Brazil, conducted in August 2018.
28 Correspondence with INMETRO Staff. January 2019
29 PROCEL. “Resultados PROCEL 2018.” 2018. Available online at: http://www.procelinfo.com.br/resultadosprocel2018/docs/Procel_rel_2018_web.pdf
15The criteria for the Selo PROCEL for ACs is based on the 2004 agreement
Figure 4: Selo PROCEL for ACs between PROCEL and INMETRO that accompanied the launch of the Selo
PROCEL for split ACs.30 This agreement stipulates that any product that
receives an ‘A’ rating may also receive the Selo PROCEL; however, it notes
that the ‘A’ rating should only apply to approximately 25% of the market.
As detailed below, the ‘A’ rating now applies to most split ACs currently
available on the Brazilian market, which has led PROCEL to begin discus-
sion with INMETRO on re-evaluating the criteria for both labels.
The Selo PROCEL for some other products includes criteria beyond ener-
gy efficiency. For refrigerators, the refrigerant used must have zero ozo-
ne depleting potential and a global warming potential of less than 150
times that of CO2.31 PROCEL is currently considering whether the require-
ments for the Selo PROCEL for ACs should include criteria beyond energy
efficiency, such as the refrigerant or the materials in the AC unit. While
demand response readiness has not been included in any criteria for the
Selo PROCEL, controlling electricity demand from ACs via demand res-
ponse may prove to be a valuable method of adding grid flexibility.
The Potential for AC Demand Response in Brazil 32, 33
The large share of hydroelectric dams in Brazil’s electricity generation mix
has historically guaranteed adequate grid flexibility to meet variations
in demand. However, there is an increasing need for grid flexibility as the
share of thermal and variable renewable generation on the Brazilian grid
increases. Demand response and time of use rates, wherein the price of
electricity depends on the time of day when the electricity is consumed,
have been identified as one way of providing this flexibility. Eletropaulo has
begun implementing time of use rates and smart metering with support
from the National Electric Energy Agency (ANEEL).
ACs are a key driver of peak demand and controlling such demand could
significantly improve grid flexibility. WiFi compatibility coupled devices that
allow for customers to program their ACs to respond to time of use rates
could provide additional grid flexibility. Additionally, utilities could pay
consumers to turn down or cycle their ACs during peak demand.
30 Correspondence with PROCEL Staff. January 2019.
31 PROCEL. “CRITÉRIOS PARA A CONCESSÃO DO SELO PROCEL DE ECONOMIA DE ENERGIA A REFRIGERADORES E ASSEMELHADOS” 2015. Available online at: http://
www.procelinfo.com.br/services/DocumentManagement/FileDownload.EZTSvc.asp?DocumentID=%7BE298D619-FE84-42CE-A8EC-31A1BB5E38E7%7D&ServiceInstU-
ID=%7B46764F02-4164-4748-9A41-C8E7309F80E1%7D
32 IEEE. “Challenges for Demand Response in Brazil.” 2015. Available online at: https://www.ieee-pes.org/presentations/gm2015/PESGM2015P-001977.pdf
33 Smart Energy International. “Smart grid development in Brazil and South American counterparts.” September 2018. Available online at: https://www.smart-energy.
com/industry-sectors/business-finance-regulation/smart-grid-brazil-south-america-frost-sullivan/
16BRAZILIAN AC MARKET EVOLUTION,
DRIVERS, AND TRENDS
The Brazilian Labeling Program and Selo PROCEL have noticeably shaped the efficiency levels of
split ACs sold in Brazil. These effects can be seen in the models registered for sale in Brazil, even
though the database does not include sales figures for each model. For example, the last major
revisions to the ‘A’ class and Selo PROCEL criteria in 2009 led to a 3% increase in the median split
AC efficiency in two years, following 3 years of no improvement in split AC efficiency. The influen-
ce of the PBE and Selo PROCEL is even more evident in 2018, as the median and most common
efficiency available in the split AC market is an energy efficiency ratio (EER) of 3.24 W/W, just
above the ‘A’ class and Selo PROCEL threshold of 3.23 W/W, with 25% of split ACs in the market
having EERs between 3.24 W/W and 3.26 W/W. This large percentage of split ACs just above the ‘A’
class and Selo PROCEL threshold indicates that manufacturers design their products to achieve
these labels (see Figure 5).
The impacts of the Brazilian Labeling Program and Selo PROCEL on electricity consumption have
also been significant. For example, a 2012 study found that the labeling programs for ACs had
saved over 2 TWh in 2009. Similarly, the labeling programs for refrigerators had saved approxima-
tely 3.5 TWh in 2009.34 In addition, a 2015 study conducted by INMETRO found that the labeling
program had saved consumers 2.9 billion reals in the ten years from 2006-2015.35
Figure 5: Evolution of the Brazilian Split AC Market
5.00
4.50
A-level
4.00
2009 Revision B-level
EER (W/W)
2013 Revision
2011 Revision
3.50 C-level
D-level
3.00
E-level
2.50
2.00
2006 2007 2008 2009 2010 2011 2012 2013 2014 2015 2016 2017 2018
Minimum EER Median EER Maximum EER
34 Balbino Cardoso, Rafael. “Estudo dos impactos energéticos dos Programas Brasileiros de Etiquetagem Energética: estudo de caso em
refrigeradores de uma porta, condicionadores de ar e motores elétricos.” UNIVERSIDADE FEDERAL DE ITAJUBÁ. 2012.
35 BRACIER. “USO DE ETIQUETAS DE CONSUMO DE ENERGIA GERÁ ECONOMIA DE R$ 2,9 BI EM DEZ ANOS.” 2015. Available online at:
http://bracier.org.br/noticias/brasil/5288-uso-de-etiquetas-de-consumo-de-energia-gera-economia-de-r-2-9-bi-em-dez-anos
17Despite the ability of the Selo PROCEL and PBE to shape the Brazilian split AC market, these labels have
not driven significant efficiency improvements in recent years, because the labeling criteria for the ‘A’
class has not been meaningfully revised in a decade. As a result, efficiency improvements in Brazil sig-
nificantly lag behind other markets. From 2010 to 2018, the median efficiency of split ACs available on
the Brazilian market increased 10.2%, based on EER. By comparison, the market-weighted average effi-
ciency of ACs sold on the Indian market has increased 29% from 2011-2017, if the benefits from the shift
to inverter units are included. Based purely on EER, the efficiency improvement in India from 2011-2016
was 15.4%. A comparison of the evolution of the top label classes in Brazil and India is shown in Figure
6.36 Similarly, the efficiency improvement in Vietnam was 30.8% over 5 years from 2013-2018.37
Figure 6: Evolution of Indian and Brazilian Top Labeling Tiers for Split ACs 2010-2016
Indian 5-Star Brazilian 'A' Class
3.6
3.5
3.4
3.3
EER
3.2
3.1
3
2.9
2010 2011 2012 2013 2014 2015 2016
The pace of energy efficiency improvement over the past decade in Brazil is influenced by a variety of
factors, such as the AC components available locally, consumer price sensitivity, and the spillover effects
of efficiency improvements in other markets. On one hand, the availability of AC components in Brazil
and consumer sensitivity to higher prices for more efficient equipment have been identified as challenges
for improving the efficiency of ACs made and sold in Brazil.38 On the other hand, the spillover effects of
efficiency improvements in other markets have likely increased the efficiency of ACs assembled and sold
in Brazil, as many of these ACs use the same designs and components used in other markets. However,
the lack of labeling revisions has been determinant in the slow improvements in energy efficiency. The
pace of labeling revisions in Brazil has lagged the pace in India, as can be seen the figure above. The 1%
increase in the stringency in the highest efficiency category since 2010 has also lagged the 9.5% increase
in the stringency of the highest category in Vietnam and the 10.8% increase in Thailand over the same pe-
riod.39, 40 This has meant that Brazilian AC manufacturers have had little incentive to improve the efficiency
of their products, as the improved efficiency would not be demonstrated to consumers on the label.
36 Note that both the Brazilian Labeling Program and the Indian program used the same metric (EER) and same test standard (ISO 5151) through 2016. Thus, the
labeling tiers shown in this figure are directly comparable.
37 Based on data collected by CLASP in 2013 and 2018 in these markets. The 2013 data was reported in EER and converted to SEER based on the conversion equation
for fixed speed units. As such, it does not account for the efficiency benefits of inverter units in these markets in 2013.
38 CLASP “Estudo de Viabilidade Técnica e Econômica para um Mercado de Compressores de Alta Eficiência no Brasil”. November 2018. Available online at: http://kigali.
org.br/wp-content/uploads/2019/01/iCS-compressores.pdf
39 CLASP. Vietnam Room Air Conditioner Market Assessment and Policy Options Analysis. Forthcoming.
40 CLASP. Thailand Room Air Conditioner Market Assessment and Policy Options Analysis. Forthcoming.
18Figure 7: Proportion of Split AC Models per Efficiency Class (2006-2018) in Brazil 41
100%
90%
80%
70% A
60% B
50% C
D
40%
E
30%
20%
10%
0%
2004 2005 2006 2007 2008 2009 2010 2011 2012 2013 2014 2015 2016 2017 2018
Another key way in which the lack of labeling revisions has slowed the pace of efficiency impro-
vements is that, with most products now in the ‘A’ class, the labels no longer differentiate the
high efficiency products from the average products. As can be seen in Figure 7, 77% of all split AC
models are now ‘A’ class, following the 2019 MEPS revision, as ‘C’ and ‘D’ class products are below
the MEPS and cannot be sold in the market.
This inability to differentiate products means that consumers seeking to purchase higher effi-
ciency split ACs cannot easily determine which products have above-average efficiency. Manu-
facturers seeking to market high efficiency products have no credible, third-party label to refer to
in order to show that their products are higher efficiency than the market average. Policymakers
seeking to shift the market through government purchasing requirements or subsidies cannot
specify above-average efficiency, as the only ready-made specification is the ‘A’ class label and
Selo PROCEL, which are applied to average efficiency products.
41 No data was available for 2014-2017.
193. International Labeling Programs
for Room Air Conditioners3. International Labeling Programs
for Room Air Conditioners
As of 2019, approximately 90 economies around the world have some form of
energy labeling policy for ACs, showcasing a wide array of experiences and
best practices for AC energy labeling policy design and revision. The case stu-
dies below are relevant for Brazil in particular as they reflect the experiences
of other relatively large AC markets with local AC industries.
Table 1: Overview of Case Study Economies
GDP Per Capita AC Market Size AC Production Volume
Economy
(2017)42 (2017)43 (2017)44
Brazil $9,821 3.8M 3.1M
European Union $33,715 4.2M 1.2M
India $1,940 4.3M 2.6M
China $8,827 91.7M 144.4M
Vietnan $2,343 2.4M 0.6M
Thailand $6,594 1.6M 12.4M
THE EUROPEAN UNION
The European Union introduced categorical labeling for household appliances in 1992 with the
Council Directive 92/75/EEC of 22 September 1992 on the indication by labelling and standard product
information of the consumption of energy and other resources by household appliances. This directive
established the A to G scale and the general design of the EU Energy Label as is still used today.
After a few years of enforcement of the label, it became obvious that the highest efficiency classes
for some products were already overpopulated whereas the lower classes were empty. The cluste-
ring of models in the top classes meant that the label no longer allowed for visible differentiation
between products on the market. The scale of the label therefore needed to be revised in order to
restore its ability to help consumers make well-informed purchasing choices. The discussion pre-
ceding the adoption of a new Directive in 2010 centred on the question of the rescaling. However,
in view of the industry resistance to proceed to a complete rescale of the label, EU Member States
decided to maintain the existing classes and add higher efficiency classes (A+, A++, and A+++). The
2010 Directive therefore did not trigger a rescale of the energy labels but rather an extension of the
scale to those 3 additional classes.
42 World Bank
43 Euromonitor
44 Euromonitor
21In 2013, CLASP published a consumer research study45 to examine the effectiveness of the new label
design in supporting consumers in making informed choices about the energy efficiency of applian-
ces during purchase. The study was designed to assess how consumers use, understand, and are mo-
tivated by the new and revised labels. This was achieved by holding ten consumer focus groups and
30 in-depth interviews across ten cities in the EU.
Evidence from this study demonstrated that consumers understand both versions of the label and that
both positively impact purchase decisions. It also showed some differences in appeal and understanding
between the two versions. The new design was deemed more attractive and clearer but the appeal of the
best class compared to the rest of the scale appeared higher in the A to G scale than in the A+++ to D scale;
consumers were less likely to choose an A+++ model over an A model under the new regulation than they
were to choose an A model over a D model under the previous regulation. See Figure 8.
Figure 8: 2010 (left) and 1992 (right) versions of the EU energy label for refrigerators
Refrigerators and freezers
Option A (new label) Option B (old label)
The 2010 label was considered ‘clearer’ by 50% of focus groups, and ‘less cluttered’ and ‘better designed’
by 60%. The CLASP study found that more consumers would consider the middle class acceptable in an
A+++ to D label scale than in an A to G scale. When selecting products from an A+++ to D scale, consumers
declared that they would be willing to pay 44% more for the highest energy efficiency class as opposed
to middle-range products, compared to 50% more for an A to G class. Other studies found a larger diffe-
rence between the motivational power of the two scales (see for example Heinzle & Wüstenhagen, 2010,
in which researchers dissociated the effect of the A+++ to D scale from the rest of the design changes).46
The study also investigated other parts of the label, such as energy consumption per year, water consump-
tion, icons and others. Detailed feedback from consumers was extremely useful to justify shifting back to
the original A to G scale in the 2017 revision of the legal framework, as well as to improve the presentation
of certain elements and identify what may have to be further investigated for each product group. The
survey also highlighted the importance of improving communication around the energy label.
45 CLASP. “Assessing Consumer Comprehension of the EU Energy Label.”:2013. Available online at: https://clasp.ngo/publications/assessing-consumer-com-
prehension-of-the-eu-energy-label
46 Heinzle S. and Wüstenhagen R., 2010. Disimproving the European energy label’s value for consumers?
Results from a consumer survey, University of St. Gallen, February 2010
22After the A+++ to D scale was put in place, it rapidly became obvious that product efficiency was
improving beyond what the 3 additional classes were able to discriminate and that a new rescaling
would be necessary. In 2015, less than 4 years after the entry into force of the revised energy label
for washing machines, Electrolux was putting a machine on the market that claimed to “surpass the
EU top energy rating A+++ by a whole 50%” (see Figure 5).
The company was concerned that the EU label would not
Figure 9: Electrolux illustration of the do justice to the efficiency of their product and called for
efficiency class of 2015 machine on
a revision, declaring: “It is time for a major revision of the
the December 2015 energy label
energy labeling system in the EU”, and “The current system
where manufacturers have to add more and more plus-
signs to the labels will be increasingly confusing for con-
sumers.”47 In fact, just 3 years after the revisions to the EU
Energy Label in 2010, there was already a consensus that a
new rescale was needed and that adding plus-signs was not
a long term solution. The European Environmental Bureau
(EEB), the European Environmental Citizens Organisation
for Standardisation (ECOS) and the European Committee of
Domestic Equipment Manufacturers (CECED) co-authored
a paper on this issue in 2013: Revising EU energy label: evo-
lution or revolution?, confirming that even for industry, the
2010 revision with its scale extension only “provided a short
term solution to the issue of saturation of the top classes.”48
This paper also lays out a few suggested principles for the
revision of the label, some of which were respected by the
European Commission.
In 2014, the European Commission published a report on the evaluation of the Energy Labelling Directive
(initiated in 2012).49 The first priority identified by this study was to revise the energy label:
A key priority is the revision of the present energy label so that higher efficiency levels can be
communicated in the future. This will help to ensure future relevance and effectiveness of the
energy label. While a new label design will inevitably require a rebasing of the efficiency class-
es currently applied, consumer understanding should be the chief concern for future label re-
visions (…). It is also becoming increasingly clear that the A+ categories are less effective at
attracting consumers to the higher classes than the A class on an A-G scale. The evolution of
energy labels to the A+++ categories is one that has little support among stakeholders, and
where there is an overwhelming recognition of the need for change. In addition, labels should
also not show empty classes at the lower end of the scale without in some way indicating that
they are no longer active. The possibility to display environmental information on the label
should be maintained. Future options to explore in greater depth are the opportunities offered
by ICT to convey additional information or provide electronic labels, display of lifecycle cost
information, the development of guidelines for how to revise existing labels, an in-depth as-
sessment of transition issues, as well as a number of advanced label design options.
47 Electrolux “New washer breaks all limits: Time to revise energy label system.” 2015. Available online at: https://www.electroluxgroup.com/en/new-washer-breaks-all-
limits-time-to-revise-energy-label-system-21050/
48 Arditi, S., Toulouse, E., and Meli, L., “Revising EU energy label: evolution or revolution?” 2013. Available online at: http://www.ecostandard.org/wp-content/uploads/
Revising-EU-energy-label-evolution-or-revolution.pdf
49 ECOFYS. “Final Technical Report: Evaluation of the Energy Labelling Directive and specific aspects of the Ecodesign Directive” 2014. Available online at: http://www.
energylabelevaluation.eu/tmce/Final_technical_report-Evaluation_ELD_ED_June_2014.pdf
23In 2017 the European Commission adopted a revised legal framework for the energy efficiency label.50
Not only does this new framework restore the original A to G scale, but it also institutes rules about how
efficiency classes shall be defined and revised in the future:
Leaving top of the scale empty:
“Where a label is introduced or rescaled, the commission shall ensure that no
products are expected to fall into energy class A at the moment of the introduction
of the label and the estimated time within which a majority of models falls into that
class is at least 10 years later.
By way of derogation […], where technology is expected to develop more rapidly,
requirements shall be laid down so that no products are expected to fall into energy
classes A and B at the moment of the introduction of the label.”
Rescale trigger: “the commission shall review the label with a view to rescaling if it
estimates that:
30 % of the units of models belonging to a product group sold within the union
market fall into the top energy efficiency class A and further technological
development can be expected, or
50 % of the units of models belonging to a product group sold within the
union market fall into the top two energy efficiency classes A and B and further
technological development can be expected.”
These new rules have led to dramatic changes in how products are categorized. For example, the
refrigerator market went from only including products that were ‘A+’ or higher, to having no ‘A’ class
products at all, as the previous ‘A+’ became an ‘F.’ The figure below shows the evolution of the classes
in the past 9 years, and how they are projected to evolve through 2030.51
Figure 10: Refrigerator Market Share by Label Level in the European Union
100%
90%
80%
70%
60%
50%
40%
30%
20%
10%
0%
10 11 12 13 14 5 16 17 18 19 20 21 22 23 24 25 26 27 28 29 30
20 20 20 20 20 201 20 20 20 20 20 20 20 20 20 20 20 20 20 20 20
ED1 ED2
EL
50 Regulation (EU) 2017/1369 of the European Parliament and of the Council of 4 July 2017 setting a framework for energy labelling and repealing Directive 2010/30/
EU. Available online at: https://eur-lex.europa.eu/eli/reg/2017/1369/oj
51 COMMISSION DELEGATED REGULATION (EU) supplementing Regulation (EU) 2017/1369 of the European Parliament and of the Council with regard to energy
labelling of refrigerating appliances and repealing Commission Delegated Regulation (EU) No 1060/2010 Available online at: https://ec.europa.eu/info/law/better-regu-
lation/initiative/1553/publication/311969/attachment/090166e5be38dcdc_en
24For ACs, the revisions to the labeling levels will also be dramatic. According to the labeling tiers proposed
by the EU Commission in May of 2018, the current ‘A’ class will become an ‘F’ class. The full revisions can be
seen below, in Table 2.52
Table 2: Existing and Proposed EU AC Labeling Tiers
Existing Label Tiers Proposed Label Tiers
Tier SEER Tier SEER
A+++ SEER ≥ 8.50 A SEER ≥ 11.5
A++ 6.10 ≤ SEER < 8.50 B 9.7 ≤ SEER < 11.5
A+ 5.60 ≤ SEER < 6.10 C 8.1 ≤ SEER < 9.7
A 5.10 ≤ SEER < 5.60 B 6.8 ≤ SEER < 8.1
B 4.60 ≤ SEER < 5.10 E 5.7 ≤ SEER < 6.8
C 4.10 ≤ SEER < 4.60 F 4.8 ≤ SEER < 5.7
D 3.60 ≤ SEER < 4.10 G SEER < 4.8
E 3.10 ≤ SEER < 3.60
F 2.60 ≤ SEER < 3.10
G SEER < 2.60
Beyond highlighting the need for a dramatic re-scaling of the EU energy labels, the evaluation of
the EU labeling program noted the need for up-to-date information on the types of products on
the market and their sales totals. The long rulemaking process and low level of ambition in energy
labeling were viewed as direct results of the lack of up-to-date market data. In order to address this
problem, the evaluation recommended that the EU create a database of all models allowed to be sold
in the EU market. This database would then simplify rulemaking by giving policymakers the necessary
data to inform label re-scaling and would also improve market surveillance by providing compliance
authorities with an accurate database of all products allowed to be sold in the market.
Key takeaways from the EU labeling program
It is essential to frequently revise the energy efficiency label tiers and/or to leave
the top categories empty at the time of re-scaling, so that the market can evolve
to fill all label categories.
The system of creating A+, A++, and A+++ categories was less effective at
influencing consumer behavior than a full re-scaling, as consumers did not find
these categories compelling.
A well-maintained central database of models for sale in the market simplifies
policymaking and compliance efforts.
52 Baijia Huang, Philippe Riviere, Peter Martin Skov Hansen, Jan Viegand, Hassane Asloune, Florian Dittmann. Air conditioners and comfort fans, Review of Regulation
206/2012 and 626/2011 Final report. [Research Report] European Commission, DG Energy. 2018.
25INDIA
The Indian Bureau of Energy Efficiency (BEE) launched the labeling program for fixed-speed ACs
in 2006 as a voluntary initiative, and the program became mandatory in 2009. BEE revised the
energy performance thresholds for ACs covered under the program on a biennial basis from
2010 - 2016. In 2015, BEE launched a voluntary labeling program for inverter ACs, and made the
program mandatory in January 2018. The labeling program for ACs now covers both fixed and
inverter units under a common rating plan. The increases in stringency have resulted in substan-
tial efficiency improvement of 35% to the MEPS for split units, which are the most popular type
of AC. Since the inception of the AC labeling program, 46 TWh of electricity have been saved and
38 million tons of carbon emissions have been avoided.53
THE EVOLUTION OF THE INDIAN
AC LABELING PROGRAM
Figure 11: Indian Energy
Efficiency Label for Split ACs
BEE developed distinct star rating plans for split and window/unitary
type ACs. The split AC rating plan covers wall, ceiling, and floor-mounted
ACs. AC efficiency was originally measured in terms of the EER. Starting
on a voluntary basis in 2016, BEE adopted an improved rating methodo-
logy that factors in variance in temperature across the various climatic
zones in India and operating hours. The new metric is called the Indian
Seasonal Energy Efficiency Ratio (ISEER), which is the ratio of the total
annual amount of heat that the equipment may remove from the indoor
air when operated for cooling in active mode to the total annual amount
of energy consumed by the equipment during the same period.
BEE has been revising the star rating plans for window and split ACs since
the program was launched to increase the stringency of the energy per-
formance thresholds, as shown in Table 3 and Table 4 respectively. These
revisions to the star ratings have been conducted based on analysis of
the registered labeled products in BEE’s database, with a view to ensu-
ring that each star rating contains a meaningful share of the products
available on the market. Such a distribution of products across all rating
tiers allows consumers to clearly distinguish between the efficiency le-
vels of the various available products.
Table 3: Revisions in Star Rating Levels for Window ACs
1st January 2009 1st January 2012 to 1st January 2014 1st January 2016 1st January 2018
Star level to 31st December 31st December to 31st December to 31st December to 31st December
2011 2013 2015 2017 2019
EER EER EER EER ISEER
1 Star 2.3 2.3 2.5 2.5 2.5
2 Star 2.5 2.5 2.7 2.7 2.7
3 Star 2.7 2.7 2.9 2.9 2.9
4 Star 2.9 2.9 3.1 3.1 3.1
5 Star 3.1 3.1 3.3 3.3 3.3
53 The data and qualitative information contained in this case study has been gathered by the CLASP India office with support from BEE.
26Table 4: Revisions in Star Rating Levels for Split ACs
1st January 2009 1st January 2012 to 1st January 2014 1st January 2016 1st January 2018
Star level to 31st December 31st December to 31st December to 31st December to 31st December
2011 2013 2015 2017 2019
EER EER EER EER ISEER
1 Star 2.3 2.5 2.7 2.7 3.1
2 Star 2.5 2.7 2.9 2.9 3.3
3 Star 2.7 2.9 3.1 3.1 3.5
4 Star 2.9 3.1 3.3 3.3 4.0
5 Star 3.1 3.3 3.5 3.5 4.5
As per Table 3, the extent of efficiency improvements for window ACs has been limited. This is due to the
technological and size constraints inherent in window ACs. As per the last revision in 2018, BEE does not
allow the registration of those models which would have been rated 1-Star.
In comparison, the split type ACs have periodically seen more substantial revisions (see Table 4). For
example, the existing 5-Star level in 2009 became 3-Star in 2015 and 1-Star in 2018 as per new star
levels and ISEER methodology.
Figure 12: Star Level Improvement for Window and Split ACs, 2009- 2018
Window type Split type
50%
Energy Performance improvement (%)
45%
45%
40% 38%
35%
35% 32%
30%
30%
25%
20%
15%
9% 8% 7%
10% 7% 6%
5%
0
1 Star 2 Star 3 Star 4 Star 5 Star
Star levels
As shown in the figure above, the increases in the energy efficiency requirements for window ACs resulted
in marginal efficiency improvements of 9% to the MEPS (1-Star) and 6% for the 5-Star threshold. For split
RACs, increases in the energy efficiency requirements resulted in an overall improvement of 35% to the
MEPS (1-Star) and 45% for the 5-Star threshold.
Notably, dramatic changes to the labeling program, such as the shift to the ISEER, have first been imple-
mented on a voluntary basis before being made mandatory. This transitional voluntary phase in making
these large shifts has allowed manufacturers to adapt to policy changes over time and to understand how
they can benefit from these programs before being required to participate.
27You can also read