The Australian Hydrogen Industry - Will Australia be able to meet its National Hydrogen Strategy ambitions?
←
→
Page content transcription
If your browser does not render page correctly, please read the page content below
The Australian Hydrogen Industry
                                           -
                   Will Australia be able to meet its
                National Hydrogen Strategy ambitions?

Learning Community Energy Transition
Date: January 1st, 2021

Marvin Dan Kornhaas         S4416902       m.d.kornhaas.1@student.rug.nl
Katie Kwok                  S4405331       k.kwok@student.rug.nl
Francesco Poletto Cortese   S4504720       f.poletto.cortese@student.rug.nl
Inge Heijtmeijer            S4181778       i.e.e.tabernee.heijtmeijer@student.rug.nl

                                       1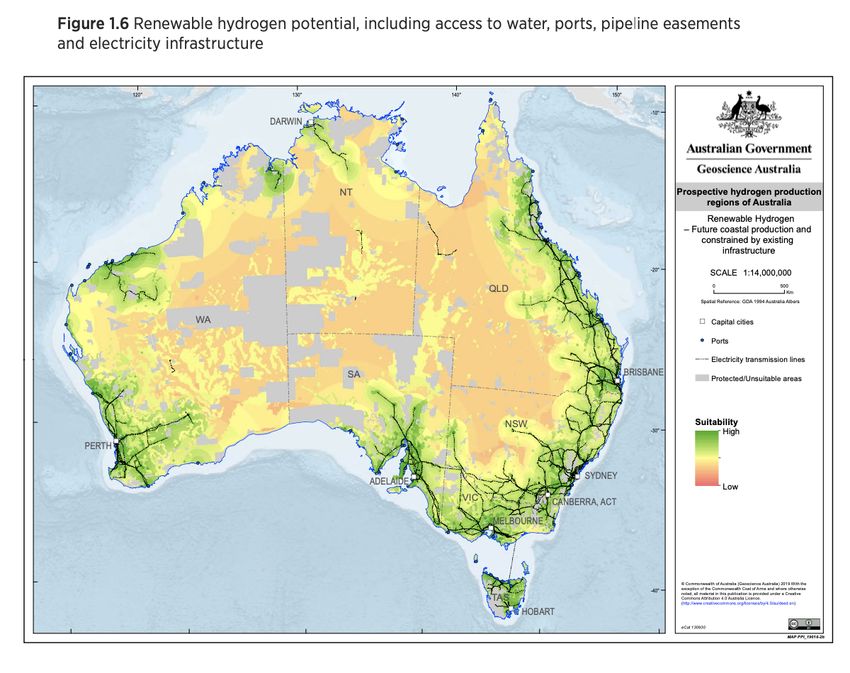
Table of contents

Executive Summary: Overview and motivation to study Australia’s hydrogen market                3
1.        Australia’s institutions and ambitions                                               5
     a)     The Australian Hydrogen Strategy (COAG)                                            6
     b)     Opportunities for Australia from hydrogen exports, ACIL Allen Consulting (ARENA)   10
     c)     PwC Embracing clean hydrogen in Australia                                          13
     d)     Hydrogen roadmap (CSIRO, 2018)                                                     13
     e)     Transportation                                                                     15
     f)     Industrial use                                                                     17
     g)     Electricity systems                                                                18
     h)     The Future of Hydrogen (IEA, 2019)                                                 19
2. Australia’s market environment for hydrogen                                                 21
     a)     Australia’s comparative advantage                                                  21
     b)     Outlook for Australia’s advantage                                                  25
3. Electricity prices analysis                                                                 26
4. Regulation analysis                                                                         32
5. Policy analysis                                                                             33
     a)     Energy policy                                                                      33
     b)     Tax policy                                                                         34
     c)     Public investment funding gap                                                      34
     d)     Public investment funding gap                                                      35
6. Conclusion                                                                                  36
7. References                                                                                  37
8. Appendix: Summary of priorities of COAG (2019) report                                       43

                                                      2
Executive Summary: Overview and motivation to study Australia’s hydrogen
market

Green and blue hydrogen offer a potential solution for the production of low or zero emissions energy.
Unlike renewable electricity which could be transferred through high voltage direct current cables, it can
be stored at relatively low cost, exported to any destination with appropriate import facilities, and is less
dependent on a single piece of infrastructure. Hydrogen is also very versatile, with potential applications
in electricity production, direct combustion and as a transport fuel in fuel cell electric vehicles. This range
of applications across energy sectors gives flexibility in being able to meet the demands of the importing
country, provides opportunities for wide decarbonization, and reduces the risk of oversupply and stranded
assets, as uptake markets are diverse. However, currently most of the global hydrogen production is made
out of emission emitting resources like coal or natural gas (“grey hydrogen”; Brasington, 2018; PwC,
2020).

After signing the Paris agreement in 2016, Australia set up a National Hydrogen Strategy as one the tools
to reduce its emissions (26%-28% reduction in greenhouse gas emissions below 2005 levels by 2030; see
Figure 1), achieve greater fuel security and provide stability of electricity networks. Most importantly,
Australia wants to reap the large economic benefits associated with becoming an “hydrogen powerhouse
and the top exporter to Asian markets. With 57 underlying actions which are planned to be undertaken
until 2050, Australia wants to achieve scale and commercial viability in the hydrogen industry (COAG,
2020). If successfully implemented, Australia could have an additional $26 billion a year in GDP as well
as ten thousands of jobs.

In this report, we will examine if Australia is able to achieve its ambitions in scaling up and exporting
“clean” hydrogen (includes green and blue) stated in the National Hydrogen Strategy (COAG, 2019) and
other key reports. A review of the ambitions and other projections for hydrogen’s role in the Australian
economy will be made in section 1. To examine these Australia’s ambitions, we start with an assessment
of the environment for hydrogen production by highlighting Australia’s current advantages and future
outlook in section 2. In section 3 we analyze the electricity price. This is important as in most cases,
electrolysers will likely be connected to grid electricity rather than directly to a renewable source.
Examining the prices of electricity per state during the year through Price Duration Curves and the fuel
combination through each state’s fuel mix helps understanding whether a state presents good prerequisites
for a clean hydrogen economy. We find that, in states where renewables are price setters, electricity prices
are normally quite elevated, rendering the production of clean hydrogen less competitive than expected.
Section 4 assesses hydrogen regulations which are needed to facilitate investments and innovations in the

                                                       3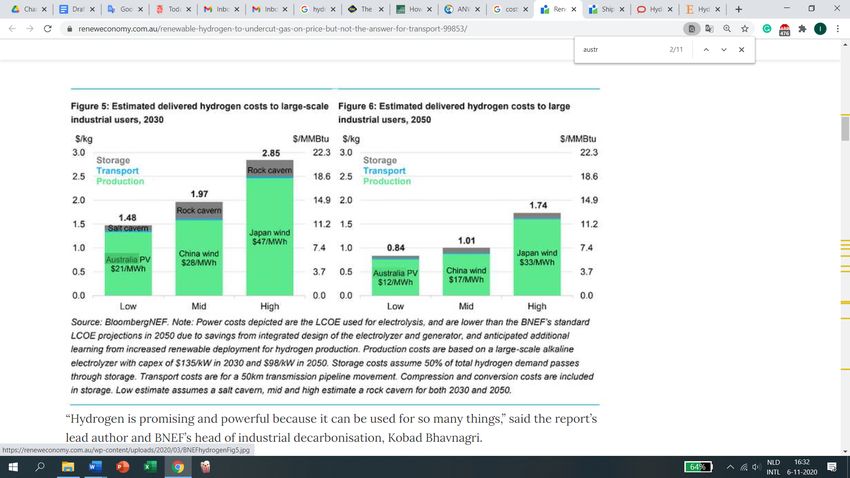
hydrogen market. In order to provide a solid backbone for the hydrogen industry, standards still have to
be revised and adopted. Especially, the implementation of an international certification scheme is crucial.
Regarding policy analysis in section 5, we examine Australia’s fragmented energy policy, the existence of
funding gaps in both the public and private sector and the lack of a tax scheme for hydrogen exports.
Australia is hoping to generate large economic benefits from a new hydrogen industry; however, the lack
of an efficient tax scheme may lead to Australia to reap few economic benefits which is seen in the LNG
industry. In all, we conclude that despite Australia's natural advantages, the environment for hydrogen
production is less feasible than the Australian Hydrogen Strategy has hoped. Australia should focus on
creating the right environment for hydrogen production before setting its sights on ambitious outcomes.

                         Figure 1: Current and projected GHG emissions (CSIRO, 2018)

                                                     4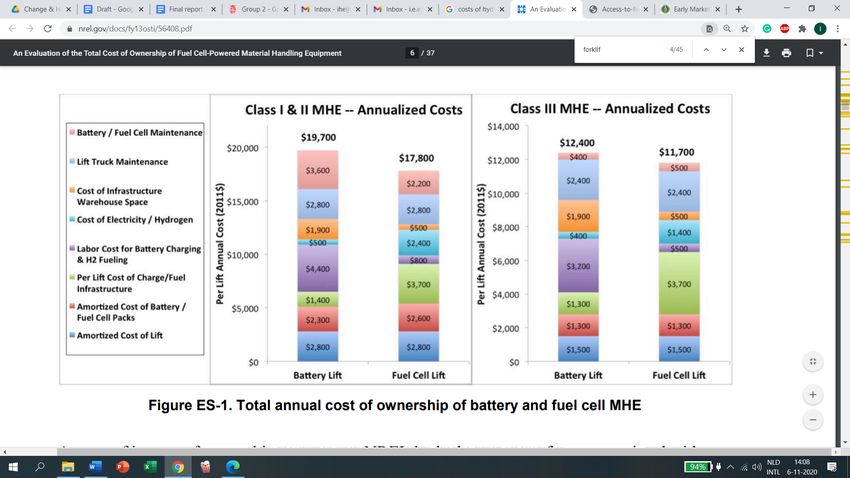
1. Australia’s institutions and ambitions

Australia is an interesting country to study given the size of its ambitions to become a “hydrogen
powerhouse” (COAG, 2019). There have been various reports published on the topic of implementing a
hydrogen economy in Australia namely written by intergovernmental organizations, government agencies
and specialized consultants.

In Australia, there are a number of (governmental) institutions that are in charge of plans, goals, and
progress. The Hydrogen Mobility Australia (HMA) was formed at the beginning of 2018 to pursue a vision
of a hydrogen society built upon clean and renewable energy technology, including hydrogen-powered
transport (Horrocks, Bukowski, Roch, & Robertson, 2020). HMA's members are a collection of vehicle
manufacturers, energy companies, infrastructure providers, research organizations, and governments with
a mission to make this hydrogen vision a reality in Australia (Horrocks et al., 2020). For example, Siemens,
BOC, ITM Power, and Toyota (Martin, 2018).

The Hydrogen Council, launched in 2017, is a global, industry-led effort to develop the hydrogen economy
(Horrocks et al., 2020). Their goals are to accelerate their significant investment in the development and
commercialization of the hydrogen and fuel cell sectors and encourage key stakeholders to increase their
backing of hydrogen as part of the future energy mix with appropriate policies and supporting schemes
(Hydrogen council, 2020).

Moreover, established by the Australian Government in 2012, is the Australian Renewable Energy Agency
(ARENA, 2020). The purpose of ARENA (2020) is to improve the competitiveness of renewable energy
technologies and increase the supply of renewable energy through innovation that benefits Australian
consumers and businesses till 2022. They have also committed $70m to scale up hydrogen projects. As of
yet, their function has not been extended by the government.

Furthermore, the Commonwealth Scientific and Industrial Research Organisation (CSIRO), founded in
1916 shapes the future. They do this by using science to solve real issues to unlock a better future for our
community, our economy, our planet (www.csiro.au, 2020). In 2018, Dr Patrick Hartley established
CSIRO’s Hydrogen Energy Systems Future Science Platform (events.csiro.au, 2019). This major
initiative focuses on addressing research challenges which underpin the development of hydrogen energy
value chains in Australia (events.csiro.au, 2019). During this time, he co-led the formulation of CSIRO’s
‘National Hydrogen Roadmap, and, with the Chief Scientist of Australia, the briefing paper ‘Hydrogen

                                                      5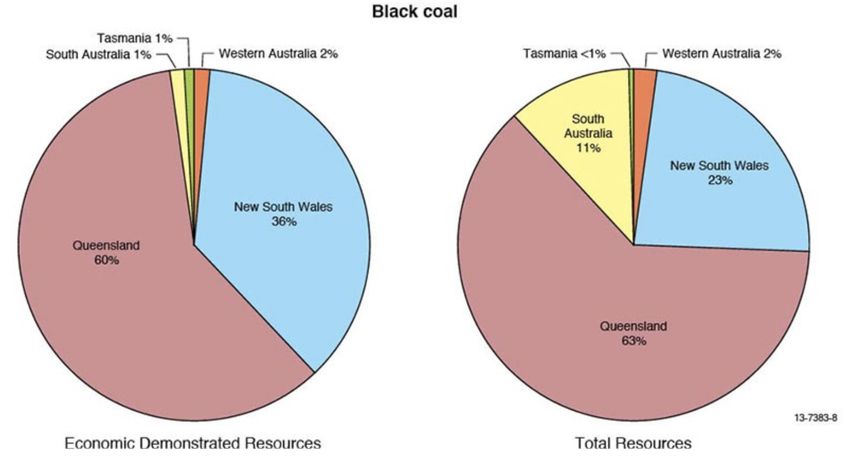
for Australia’s Future’ which was presented to the Council of Australian Government’s (COAG) Energy
council in August 2018 (/events.csiro.au, 2020). Lastly, the Council of Australian Governments (COAG)
Energy Council (the Council), established in December 2013, is a Ministerial forum for the
Commonwealth, states and territories and New Zealand, to work together in the pursuit of national energy
reforms (coagenergycouncil.gov.au, 2020). This institute made the Australian hydrogen strategy report
described below.

    a) The Australian Hydrogen Strategy (COAG)
The Australian Hydrogen Strategy was published by the COAG Energy Council Working Group (COAG,
2019). The report of the Council of Australian Governments (COAG) Energy Council included in this
report of Australia's potential, opportunities, the journey to hydrogen, enabling industry growth, building
benefits, tracking progress and even an outlook after 2030 for hydrogen in Australia.
They estimate that beyond 2030, the cost of making, storing, moving and using clean hydrogen will become
increasingly competitive. In some applications such as transport ammonia and refinery, the cost of clean
hydrogen will be the same as or even cheaper than using fossil fuels) with other fuels in an energy-hungry
world (COAG, 2019).

  Figure 2: Clean Hydrogen Cost Competitiveness Estimates (Australia’s National hydrogen Strategy,
                                             2019)

                                                    6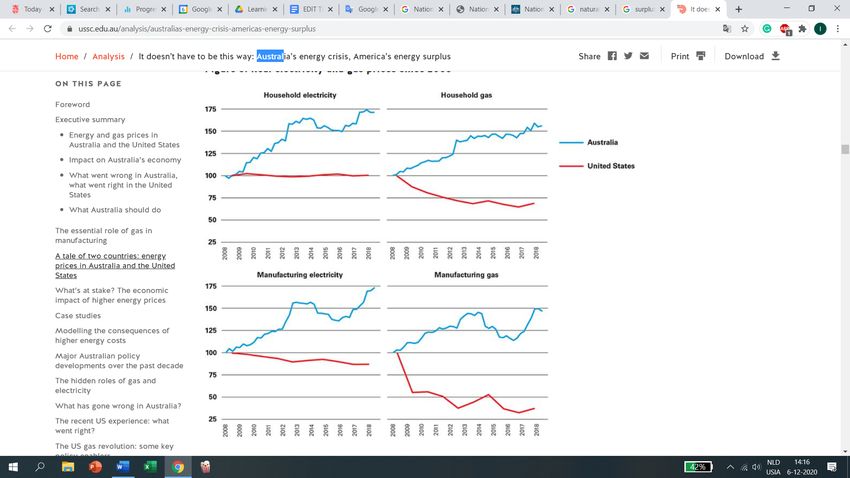
As figure 2 above shows, the cost of clean hydrogen in 10 years' time is estimated to range between 2.0-3.5
$/kg, which could render it cheaper than other technologies like natural gas or electric vehicles' batteries.
However, currently, clean hydrogen is 2-3x more expensive than hydrogen produced from fossil fuels
without CCS technology ($4-6/kg vs $1.5-$2.5/kg) (PWC, 2020). Since this figure is simply illustrative,
the cost range of clean hydrogen within Australia - as well as that of other alternatives - is likely to differ
across different territorial regions. (Australia’s National hydrogen Strategy, 2019)

With these expectations for hydrogen, Australia thus has the vision is to develop a “clean, innovative, safe
and competitive hydrogen industry that benefits all Australians and is a major global player by 2030”
(COAG Energy Council, 2019). In achieving this vision, Australia from now till 2030 underlines its strategy
to efficiently build up supply and demand, accelerating Australia’s cost competitiveness, set a regulatory
framework and engage in international agreements, including a scheme to track and certify the origin of
hydrogen. This is in order to develop a hydrogen industry that can support the domestic fuel needs of
Australia as well as to become a dominant player in the hydrogen export industry. Australia aims to be
among the top three exports of hydrogen to Asian markets.

Australia has the motivation to develop it’s hydrogen economy due to the large estimated demand by
countries such as Japan, currently depend on imported fossil fuels and are aiming to get 40% of all its
energy from hydrogen by 2050 providing to be the most promising export market, where Australia could
capture an approximate 20% share of the demand. Japan has provided clear targets through its 2017 Basic
Hydrogen Strategy for a delivered cost of hydrogen to be A$4.88/kg by 2030. Production costs for
renewable hydrogen in Australia are currently around A$7/kg. However, with savings due to falling costs
for renewable energy, increased plant size and greater efficiencies, CSIRO (2018) predicts this cost could
fall to A$2.29-2.79/kg by 2025. Analysis earlier described by ARENA (2020) goes one step further and
predicts hydrogen production costs will fall to the A$2/kg mark by “2025-2030”. PwC (2020) estimates
that the price of renewable generation must fall to $20/MWh assuming that the costs associated with
handling and exporting hydrogen is $1.5/kg by 2040.

The strategy of the Australian government from now till 2030 is to first “develop clean hydrogen supply
chains to service new and existing uses of hydrogen and develop rapid industry scale-up”, such as ammonia
production. The strategy to achieve this will be to create hydrogen hubs which will “help prove
technologies, test business models and build capacities”. The second part of the strategy will be to scale up
the supply chain and large-scale market activation. Market activation can be achieved by building up
domestic hydrogen demand such as blending of hydrogen in gas networks, using clean hydrogen for

                                                      7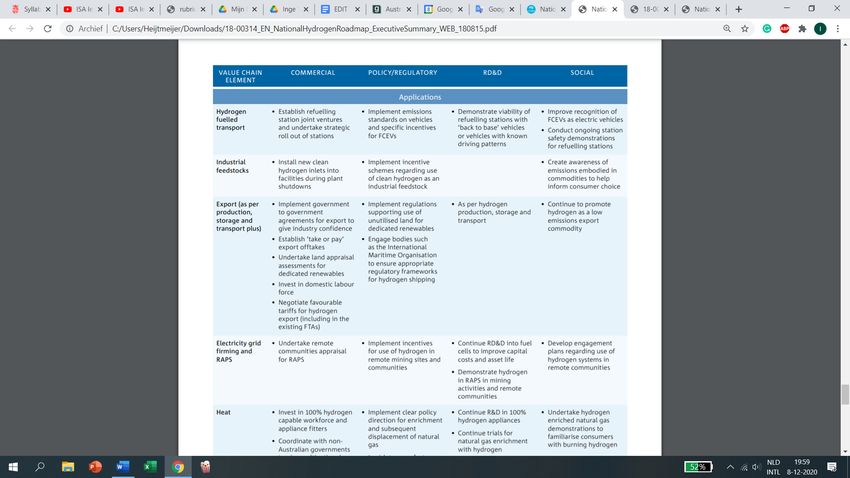
industrial feedstocks and heating and hydrogen for long-distance heavy-duty transport. Activities
undertaken in this phase would build on demonstration projects in the first.

Australia’s national strategy underlies hydrogen hubs as a “cost-effective route to achieving scale”. Hubs
allow various users of hydrogen to be aggregated in one area which minimizes the cost of infrastructure
(powerlines, pipelines), facilitates economies of scale in producing and delivering hydrogen to demand and
allows for sector coupling. Around 30 ports have been chosen as potential hubs. Some factors choosing
potential hub locations are access to demand, land availability, port potential, grid connectivity,
infrastructure development, water access, proximity to hydrogen production regions, electricity pricing.
Each hydrogen hub has a specific set of goals which is according to the geographies and environment of
that state and their scope to achieve a hydrogen economy.

Lastly, there are state specific strategies and goals underlined by each region-specific hydrogen strategy.
Western Australia aims to “develop industry and markets to be a major exporter of renewable hydrogen”,
with the goal of reaching a similar market share of global hydrogen exports as it’s LNG exports by 2030.
Most of the states aim to supply cost-competitive green hydrogen to become global exporters.

Despite every state aiming to be a large exporter, if scale up projects are successful, Western Australia,
Northern Territory and Queensland in particular are likely to become large exporters of hydrogen. LNG
infrastructure can be easily turned to liquefy hydrogen and exports (PwC, 2020). As shown in Figure 3,
these 3 states have developed LNG terminals and well-established trade relationships with Japan, China
and South Korea. Furthermore, the potential for renewable energy generation is high especially for Western
Australia and the Northern Territory, receiving some of the highest rates of sunshine (Fig. 4). Although
South Australia also has a high solar potential and aims to be a “world class renewable hydrogen exporter”,
it’s geographical position makes it unlikely to directly export to Asian markets and also it has yet to develop
any LNG infrastructure or ports. More likely, it will export hydrogen through one of the northern states,
but these may be less cost competitive due to added transport and storage costs. Tasmania also aims to
develop a “competitive large-scale renewable hydrogen industry” however, by using its wind and hydro
power resources. It is on track in meeting its target to be self-sufficient in renewables by 2022. If Tasmania
does reach high renewable penetration, indeed, hydrogen production is likely to be cost-competitive due to
low electricity prices from high renewable penetration. Furthermore, “the combination of predominantly
wind power and capacity firming hydro can provide a high electrolyser utilization compared to regions
which have wind and solar generation”. The relative size of the state, however, may be a constraining factor
in becoming a large hydrogen producer and exports face added costs of transportation.

                                                      8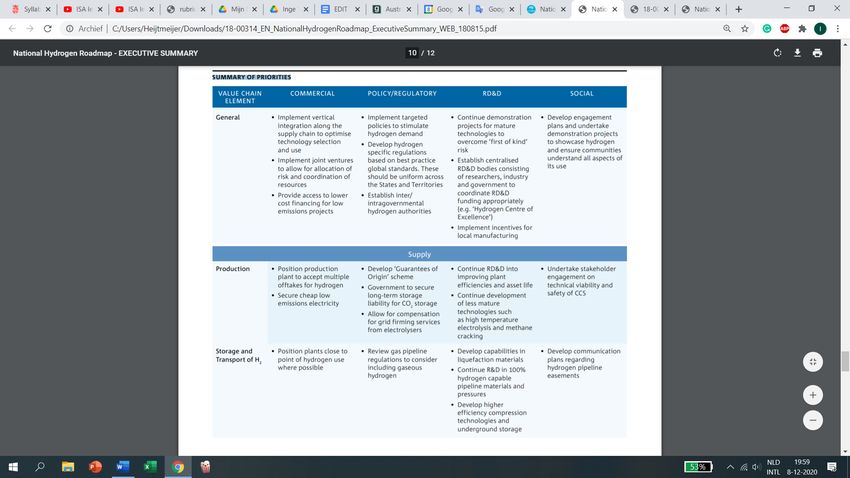
In contrast, New South Wales and Victoria are likely to develop blue hydrogen capacities as both states
have significant black and brown coal resources, respectively. New South Wales has already an established
hydrogen-based industry. It has well established international scale ports for black coal which could
potentially export hydrogen. A well-established industrial base may also suggest a potentially large demand
for hydrogen in the area. Good transport networks and proximity to population centers may also allow scale
up of hydrogen for domestic uses. There are projects to develop blue hydrogen such as Coal Innovation
NSW is leading the CO2 storage assessment program. Victoria “is also actively pursuing opportunities to
use its brown coal resource in new ways, consistent with the Statement on Future Uses of Brown Coal”, as
these generation plants are likely to be decommissioned in the future as they are the most polluting. Victoria
has a large motivation to transform brown coal to blue hydrogen, as much of the regional economy depends
on the brown coal industry. The Hydrogen Energy Supply Chain (HESC) starting with hydrogen production
from brown coal in the Latrobe Valley and ending with its transportation in Japan, is the first initiative to
transport mass quantities of (grey) hydrogen across open waters.

Besides the positive notes this report said that the journey will not be easy, nor predictable, that they will
see and seize opportunities as they emerge and end with the note that the opportunities for hydrogen in
Australia are vast.

                        Figure 3: Liquefied Natural Gas Infrastructure (EIA, 2019)

                                                      9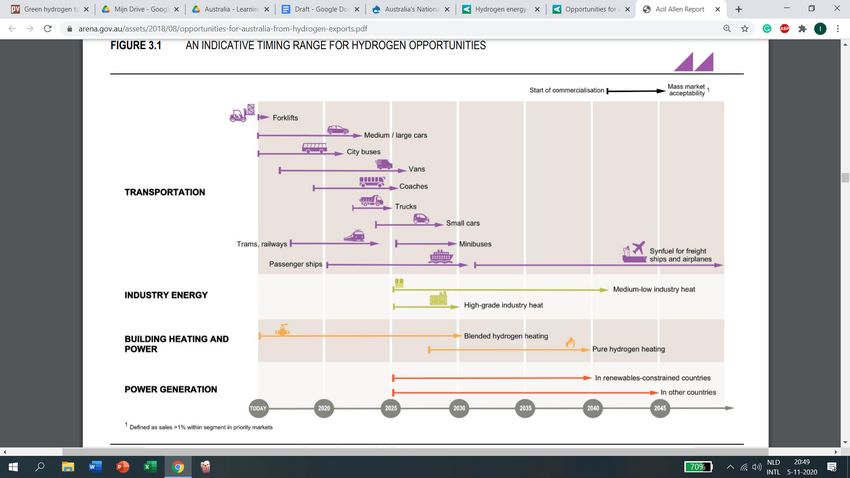
Fig 4: Solar PV potential across different states (Solargis, 2020)

    b) Opportunities for Australia from hydrogen exports, ACIL Allen Consulting (ARENA)
The report of the Acil Allen consulting for ARENA report focuses on Australia’s competitive position
relative to other potential suppliers of hydrogen for export. The report assesses the ability for Australia to
become a major exporter to the world by considering the cost competitiveness of hydrogen production
compared with production cost of import countries as well as the cost of liquefaction, storage,
transportation. This report used the CSIRO’s Hydrogen Roadmap costs of production, storage and transport
were important inputs into the modelling of the opportunities for Australia from potential hydrogen exports
(ACIL Allen Consulting, 2018).

The costs of production are shown in table 1. It shows that Australia has lower projected LCOE in solar PV
and wind compared to the other countries starting from 2025. This means that the average revenue that
would be required to recover capital costs of investment in renewable energy are lower relative to others,
such as countries in which Australia hopes to export, as well as its competitors in supplying hydrogen such
as the USA and Qatar. Table 2 summarizes the assumptions for transport and storage costs. Shipping is the

                                                     10
cheapest method compared to rail or truck for all storage types. Ammonia is the most cost competitive way
of storing hydrogen.
Table 1: Projected LCOE of Renewable Technologies in selected countries (Acil Allen
Consulting, 2018)
11Table 2: Transport cost by distribution vehicle (Bruce, Temminghoff, Hayward, Schmidt, Munnings,
Palfreyman & Hartley, 2018).
Using different projected demand scenarios for hydrogen in 2025, 2030, 2040 as well as the competitiveness
of Australia exports, the report estimates the value of potential hydrogen exports to Japan, South Korea,
China and the rest of the world (Table 3).
Table 3: Projections of hydrogen exports in tons (Acil Allen Consulting, 2018)
The report estimates that potential demand for imported hydrogen in China, Japan, South Korea, and
Singapore could reach 500,000 tons worth A$2,225 million by 2030 following the medium scenario rising
to 1,350,000 tons worth A$5,703 million in 2040. Furthermore, it sets a target of a hydrogen production
12price of $2-3/kg excluding storage and transport needed for Australia in order to compete with other
exporting countries.
c) PwC Embracing clean hydrogen in Australia
For the energy outlook below, the PWC report used the Acil Allen medium scenario, estimating by 2050
75% of hydrogen produced in Australia will be exported (Figure 5). This paper sees a great role for
Hydrogen export for Australia whether it is produced grey or green. It states that Global momentum is
growing across the hydrogen industry, with few sectors likely to remain untouched by this energy revolution
(PwC, 2020).
Figure 5: PwC energy outlook of Australia (PwC, 2020)
d) Hydrogen roadmap (CSIRO, 2018)
The report shows that while government intervention is needed to kick-start the industry, it can become
economically sustainable thereafter (Ginn, 2020). This is demonstrated by first assessing the target price of
hydrogen needed for it to be competitive with other energy carriers and feedstocks. Second, the assessment
considers the current state of the industry, namely the cost and maturity of the underpinning technologies
and infrastructure, then identifies the material cost drivers and consequently, the key priorities and areas
for investment needed to make hydrogen competitive in each of the identified markets (Ginn, 2020)
13As seen in section 1, to make this report, the CSIRO worked closely with a number of stakeholders from
industry, government and academia (CSIRO, 2018), among others, the COAG. The aim of this report is to
help inform the next series of investment amongst various stakeholder groups (e.g. industry, government
and research) so that the industry can continue to scale in a coordinated manner (CSIRO, 2018). It
acknowledges that there is still a lack of hydrogen infrastructure and that there are still lots of barriers for
the entry of hydrogen into the energy market, however, it is quite optimistic that hydrogen has a potential
in the future Australian market and that it will be commercially competitive. “Hydrogen offers a new,
sustainable energy storage and transport future (COAG, 2019)”. Furthermore, it both analyzes and gives
input for further action in the type of production (Thermochemical and electrochemical) as well as the
potential application markets. This table is added in the appendix.
The graph below provides a roadmap of potential hydrogen uses over time in Australia (Figure 6). In the
sections, hereafter we look into a select few industries and the use of hydrogen in those industries. We also
consider other reports on this topic alongside the Hydrogen Roadmap.
Figure 6: Hydrogen competitiveness in the applications (CSIRO, 2018)
14e) Transportation
Figure 7: Industries opportunities in Australia (ACIL Allen Consulting, 2018)
As is seen in figure 7, some industries will be faster developed than others and/or need different prices to
be able to be competitive with other energy fuels. Small vehicles, like forklifts, are easier to implement than
for example electric vehicles, given they can be conveniently refueled in just a few minutes, offering
obvious (environmental friendly) productivity efficiencies (Toyota forklifts leading the hydrogen charge,
2018). They also require less maintenance because they don’t need the watering, equalizing, charging, or
cleaning that is required with lead acid batteries (Castetter, 2019). Moreover, they have health benefits for
employees due to lower emissions and noise exposures and no voltage drop as seen in batteries and better
performance at low temperatures compared to batteries (Berger, 2017).
15Figure 8: Total annual cost of ownership for Electric and hydrogen forklifts (Ramsden, 2013)
Concluding from figure 8 above, while fuel cell Forklifts have higher costs for hydrogen fuel (light blue)
and hydrogen infrastructure (green) compared to the energy and infrastructure needs for battery Forklifts,
fuel cell forklifts can yield significant savings in labor costs (purple) and facility space costs (orange)
(Ramsden, 2013). Based on NREL analysis, fuel cell MHE out-performs battery MHE in maintenance,
facility space, refueling, recharging time, and product life, resulting in a lower annual cost of ownership for
the equipment (U.S. department of Energy, 2016).
One could say that forklifts are quite similar to cars. However, with hydrogen as a fuel, cars are a bit more
difficult. As seen in figure 8, the price of hydrogen for passenger vehicles, busses and trucks have a lot of
barriers. The CSIRO report (2018) states that the primary barriers to market are the current capital cost of
FCEVs and lack of infrastructure supporting their use. To date, the only hydrogen refuelling point in
Australia is behind Hyundai’s Sydney head office for its use only (Dowling, 2019). Infrastructure is
virtually non-existent. This is hydrogen’s Achilles heel, for meaningful adoption of hydrogen cars won’t
happen until there’s a sizable network of refuelling stations in place for the public to use (O'Kane, 2020).
Furthermore, according to the CSIRO report (2018), most material reductions in capital costs will stem
from economies of scale in manufacturing. This is a difficult statement because economies of scale are
mostly in a well-developed market with lots of demand. Nowadays, as mentioned before, the only hydrogen
refueling point in Australia is behind Hyundai’s Sydney head office for its use only (Dowling, 2019).
Hence, there is no demand yet. Lastly the CSIRO report (2018) states that the success of the Fuel cell
electric vehicles (FCEV) market in Australia rests largely on the strategic deployment of hydrogen refueling
16stations. Depending on the configuration, current costs range from USD1.5 to USD2.0 million per station
(CSIRO, 2018).
Furthermore, construction projects in Brisbane, Melbourne and the ACT have been slightly delayed due to
the COVID-19 pandemic (Toscano, 2020). The Nexo, says Hyundai, can do 800km on a single fill and with
(available) hydrogen prices at around $16 per kilo, costs just under $90 to refill the 5.5kg tank (Butler,
2018). Also looking at figure 9 below, this means that hydrogen as fuel (not looking at the price of the car
itself) is not yet competitive. So, Hydrogen cars are coming soon in Australia however they are not yet
competitive at the same price level.
Figure 9: Breakeven prices of hydrogen versus petrol, diesel and natural gas (COAG Energy Council,
2019).
f) Industrial use
Like the rest of the world, the main use of hydrogen in Australia is as a raw material for industrial processes
(Hydrogen energy, 2020). The breakeven point will be driven by the price of natural gas against reductions
in the cost of hydrogen via electrolysis (CSIRO, 2018). Despite natural gas prices being relatively high in
Australia and around $6-$8, the costs of producing green hydrogen via electrolysis still remains high
(COAG Energy Council, 2019). However, as shown in Figure 12, these costs are expected to decrease in
the near and medium term to between $2 and $4 per kg for green hydrogen. This is enough for hydrogen to
become cost competitive to replace natural gas in industrial uses (Figure 2). Vorrath (2020) estimates even
more optimistic projections for the estimated delivered hydrogen costs to be 1,48$/kg in 2030 and 0,84$/kg
in 2050. Hydrogen is very likely to be used for industrial purposes in the near term in Australia.
17Figure 10: Electrolysis costs 2030 vs 2050 (Vorrath, 2020)
g) Electricity systems
The current Labor government has a 50 percent renewables target by 2030 for the electricity grid, but not
much has happened to see that realized (Mazengarb, the 10GW solar vision that could turn Northern
Territory into an economic powerhouse, 2019). According to Australian national hydrogen strategy, over
the past decade, the cost of generating electricity from wind has fallen by about 70%, and from solar PV by
about 80%. Hydrogen can also be used to generate electricity (through fuel cells or being burned to drive
turbines). If made when there is surplus or cheap electricity available, hydrogen can be stored and then used
to produce electricity when there is insufficient electricity available from other sources (COAG, 2020).
Nowadays, this is not feasible yet because there is no surplus. As seen in figure 11, the previous prices of
Australian energy went up instead of the optimistic predictions for the next few years of going down due
to the Australian energy crisis (Robson, 2018). Furthermore, the prices of America can be explained
because they have had a surplus (Robson, 2018). The AEMO has predicted that more than a million houses
in Victoria Australia will suffer power outage this summer (2019-20) unless coal and gas plants are returned
back to service (AEMO, 2019). So far in 2020, concluding from the Excel sheets of AUSGRID (2020) there
has been 420.035 minutes (7000 hours) of interruptions to power supply for 841.504 customers and this
does not even include planned maintenance work; emergency work that may require power to be
disconnected to allow crews to work safely; or outages on major event days when the network is affected
by extreme weather events (Ausgrid, 2020) . All the electricity in Australia is used in a very short timeframe.
Storage is not necessary and only adds costs. However, when the world becomes CO2 neutral, inventions
like the following hydrogen storage for homes, invented by Australian-based venture LAVO, could likely
be the next big invention (Mazengarb, 2020). In announcing that the company will soon (installation in
18June 2021) begin taking orders for the hydrogen energy storage system, LAVO (2020) says that it will
target four core markets, including residential and commercial energy storage, off-grid and backup power
supplies and telecommunication towers. LAVO estimates that these markets represent a $2 billion
opportunity for the company in Australia (Mazengarb, 2020).
Figure 11: Real electricity and gas prices of Australia versus America since 2008 (Robson, 2018)
On the other hand, hydrogen systems consisting of storage and fuel cells are unlikely to be constructed for
the sole purpose of grid stability, due to the need for a hydrogen price of less than $2/kg to compete with
batteries, pumped hydro and gas turbines (CSIRO, 2018).
h) The Future of Hydrogen (IEA, 2019)
This report projects the future feasibility of hydrogen in general. Interestingly, it includes the cost
competitiveness between blue and green hydrogen.
From the report, it is likely that blue hydrogen from Victoria and New South Wales will be more cost
competitive then green hydrogen production from the other states. The price of blue hydrogen is likely to
remain cheaper than green hydrogen over the next decade and beyond in Australia, as the figure below
19suggests1. Studies have estimated that, despite the implementation and the reduction in costs of greener
methods for hydrogen’s production, the cost of blue hydrogen will decrease by, approximately, 0.4$/kg by
2030 (the yellow and grey bars might eventually move below the ‘2 USD/kg’-line).
Figure 12: Hydrogen production costs based on used input, IEA (2019)
The price difference between blue and green hydrogen is due only partly to the fact that green hydrogen
depends on the price of renewable resources plus green certificates. Despite their increasing cost-
effectiveness and cost-efficiency, renewable resources can be highly intermittent, thus impacting the
utilization level of the inputs set for the electrolysis and the production of green hydrogen (ARUB, 2019.
Australian Hydrogen Hubs Study).
However, as we consider in section 3, this is only the case when there is a high share of renewable electricity
generation in the market. Unfortunately, this is not the case of Australia - or, at least, not for all the 5 major
states which participate in the National Energy Market (NEM). Renewable resources determine electricity
prices only when they have the capacity to supply the entire demand. This is because renewable sources
have the lowest marginal costs out of all technologies. When demand exceeds total generation from
renewable capacity, the price will be determined by marginal power plants using other technologies, such
as a gas or coal-fired power plant.
1
Green hydrogen is identified in the figure with the entry ‘Electrolysis renewables’, whereas blue hydrogen with
‘natural gas or coal with CCUS’.
20It is important in this context, therefore, to have information on the fuel composition of the different states
in Australia in order to understand how the price of electricity is set and, consequently, how that of (clean)
hydrogen may vary. We examine these crucial aspects in the electricity price analysis in section 3.
2. Australia’s market environment for hydrogen
Reports detailing Australia's ability to become a global hydrogen producer tend to point out several
comparative advantages such as its advantageous land and material resources; its reputation in expanding
exporting industries, its rapidly expanding renewable generation capacity as well as the relatively high
capacity factors and lower cost of renewable energies. However, the competitiveness of Australia’s
hydrogen depends on electricity prices if we are assuming that electrolysers are connected to the grid
network. Despite relatively high capacity factors, for solar power these are still only around 20%. Direct
connection of the electrolyser to the renewable energy generator is unlikely to be feasible, as this would
result in high break-even costs for hydrogen. When considering grid electricity prices, these are highly
influenced by Australian energy policy, which will be seen in section 5 is “fragmented” and does not have
a clear direction.
a) Australia’s comparative advantage
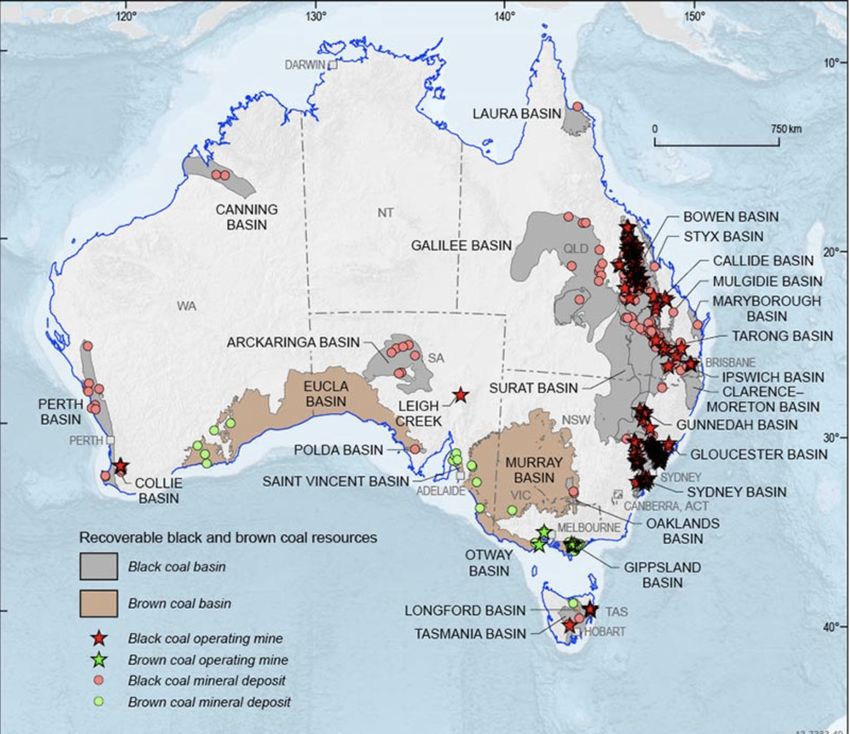
Australia has a big availability of land in which green and blue hydrogen can be produced (Figure 13;
COAG, 2019). 3% of Australia’s surface can be used for green hydrogen and utilized fully, the amount of
land used could make more than the global demand predicted by the hydrogen council for 2050 (Ibid.).
For blue hydrogen, coal will be used in the production of blue hydrogen. Also, Australia has the third
largest proven coal reserves in the world (BP, 2019). Furthermore, the price of natural gas is relatively
high and around AUD$4-10/GJ as shown in Figure 18 as opposed to AUD$2-4 /GJ in the United states
(PwC, 2020). Natural gas prices are likely to stay high due to significant demand for Australia’s LNG
exports.
21Figure 13: Prospective green (LHS) and blue (RHS) hydrogen production regions of Australia (COAG,
2019)
Furthermore, there are several CCS opportunities and various demonstration projects are being undertaken
in the Carnarvon, Gippsland, Cooper and Surat Basin. With the decommissioning of coal power stations,
especially carbon intensive brown coal generators mainly located in Victoria (Figure 14); this presents an
opportunity to repurpose the low cost and abundant resource to the production of hydrogen, meanwhile
retaining important jobs and regional economies (Joyce, 2020). As detailed above, given the high natural
gas prices hydrogen use as a feedstock in ammonia production may displace the use of natural gas earlier,
relative to other countries. This may give the demand of hydrogen a boost and incentivize hydrogen
production, if the price of natural gas remains high (PwC, 2020). The increase in demand may be quite
substantial; McKinsey (2017) estimates that ⅓ of natural gas demand is from industry, ¼ of which is for
feedstock usage.
22Figure 14: Black and Brown coal resources location (Geoscience Australia, 2020)
Moreover, Australia has experience in ramping up industries with the aim of exporting, namely Liquefied
Natural Gas (LNG). Currently, Australia is the largest LNG exporter by volume; shipping trade routes and
relations are already in place for Australia to exploit in supplying hydrogen.
Furthermore, due to the yearlong solar PV exploitation and onshore wind, Australia might have a relatively
high capacity factor compared to other nations. These are around 21%, 15% and 40% for large- and small-
scale solar PV and wind (Baldwin et al, 2018). Assuming that Australia continues to install renewable
energy technologies and this becomes a sizable share, there may be more hours in which the electrolyser is
run on renewable energy rather than on fossil fuels giving Australia an edge in producing green hydrogen
(PwC, 2020). Therefore, its competitive advantage could be particularly relevant in the near to mid-term in
several key markets which may have demand for imported hydrogen. A caveat to this is the production
costs of hydrogen depends on the national electricity prices plus the price of green certificates called Large
Scale Generation Certificates (LGC).
Lastly, the uptake of renewable energy has increased significantly in recent years with Australia having
23the highest per capita instalment rates of renewables of nearly 250 MW per capita (Figure 15). The large
uptake was supported by higher electricity prices, favorable government initiatives and falling LCOE:
Since 2015, electricity prices have been high due to the decommissioning of two brown coal fired plants
in the NEM network reducing generation capacity of 5%; tightening supply and increasing electricity
prices. Moreover, favorable environmental policies such as the Renewable Energy Targets (RET) required
electricity retailers to source an increasing amount of renewable energy. Paired with the green certificates
market (LGCs), the RET increased demand for green energy and raised the prices of certificates
incentivizing more investors to expand green energy production, this amount was greater than the original
renewable energy targets set out in 2001, to generate 20% of energy from renewables by 2020 and met
early in 2018 (COAG, 2019)
Australia is on track to meet the projected green hydrogen demand for exports of over 3.5 million tons in
2030 to Japan, Korea, China and Singapore. CSIRO forecasts that total wind and solar capacity of 15 GW
to 17.5 GW are required (CSIRO, 2018; ACIL Allen Consulting, 2018). Total capacity in 2019 was around
20 GW (Figure 16).
left: Figure 15: Installed capacity per capita (Stocks et al, 2020)
right: Figure 16: Installed capacity of solar and wind (MW) (IRENA, 2020)
24b) Outlook for Australia’s advantage
Despite past trends, in the next 3 years, the uptake of renewable energy is likely to be slower (RBA, 2020).
With renewable energies making up a greater proportion of the energy mix, investments in green capacity
are becoming less attractive. As renewables are intermittent, intraday wholesale electricity prices patterns
have changed. Daytime prices have declined significantly due to increased solar generation. Negative
pricing has also been observed during particularly windy or sunny days, reducing returns for generation.
Wholesale electricity price futures also have declined in average price, suggesting investors expect lower
future electricity prices. Hence, the gap between wholesale electricity prices and LCOE of renewable
generation is expected to narrow and the previously advantageous electricity prices provide less incentives
for investment in green energy.
Secondly, RETs are unlikely to incentivize more renewable energy installments. LGC futures have
declined to around $15/MWh in 2022 and may reduce further, as more renewable capacity is brought to
the market. The direction of national energy policy is unclear, but it is likely existing Australian
Government policy will provide less support than in the past as the RETs have been met adding uncertainty
to investors. However, state government policies are supportive of renewable investment over the long
term with most states targeting at least 40 percent renewable generation by 2030.
Despite this, in the long run the RBA and other researchers forecast that the future for renewable
installments are positive irrespective of the lack of direction of Australian energy policy. The RBA notes
that electricity prices are expected to increase in the medium to long run term due to the retirement of coal
fired plants. Indeed, energy research firm, Reputex (2020), forecasts that by 2030 Australia can reach 50%
renewable energy generation where investments are driven by the boom-bust cycle of electricity prices.
They expect more closures of coal fired generators to lead to higher prices, rather than through federal
government policy measures. 63% of the 15GW of coal fired capacity is expected to be withdrawn from
the NEM by 2040 with Liddel coal fired station (1.8GW) decommissioned by 2023.
In conclusion, Australia does have a big comparative advantage in terms of land and material resources,
expanding renewable technology, and experience in developing export markets. However, with the current
direction of government energy policy, electricity prices are likely to be volatile in coming years with the
closures of coal plants and no measures to prevent price instability in electricity markets.
25left: Figure 17: RepuTex energy forecasted fuel mix (2020)
right: Figure 18: Natural gas prices in Australia 2011-2020 (AER, 2020)
3. Electricity prices analysis
Despite the cost projections for hydrogen versus other sources. The reports on the opportunity to implement
a hydrogen strategy in Australia tend to overstate the importance of falling renewable energy costs. For
example, according to PwC (2020) to be able to export hydrogen at competitive prices for example to Japan,
estimates that the price of renewable generation must fall to $20/MWh assuming that the costs associated
with handling and exporting hydrogen is $1.5/kg by 2040. However, this is only important when the
electrolysers are directly connected to the renewable energy source, this is likely to have too high capital
costs (CAPEX) given low maximum capacity factors of solar of around 20%. The competitiveness of
producing hydrogen hence depends on the cost of electricity generation of the whole market. If the share
of renewables in electricity generation continues to increase and becomes substantially large, then the price
of electricity will decrease in Australia as the number of hours per year fossil fuel power plants are price
setting will decrease.
First, it might be useful to observe how the price of energy has been subject to variations in the recent years.
The Australian Energy Market Operator (AEMO) reports data – and changes - in price and demand for
energy, with updates occurring every 5 minutes, for the whole country as well as data disaggregated for
each of the 5 Australian states. Additional information is provided by the fuel mix. Seemingly, the price of
energy tends to decrease slightly when the fuel mix consists of a bigger portion of energy obtained from
26cheaper sources – such as black and brown coal. For instance, QLD and NSW represent the regions with
the lowest forecasted spot prices for energy (to date, November 18th, 2020) and are, at the same time, those
that use mostly black coal. However, as Figure 19 shows, prices can vary enormously and very rapidly.
Figure 19: Authors’ calculations based on AEMO (n.d.) data.
The aforementioned fuel mix represents the ratio of different energy sources used to generate electricity in
a specific region. Hereby the fuel mix for the whole country is provided (Figure 20), while Figure 21 and
Table 4 report the fuel mixes disaggregated per state. From the graphics below, it is evident that coal - black
and brown - still plays a huge part in the fuel composition of Australia and, therefore, in the determination
of electricity prices, for the country as a whole. However, the utilization of sources changes significantly
according to the different states we would focus on. For instance, while NSW utilizes mainly black coal
(86%), TAS has the lead in Hydropower (91%) and SA, oppositely, in Natural Gas.
27Figure 20: Australia’s (aggregate) fuel mix (AEMO, n.d.).
Figure 21: Australian electricity generation fuel mix, calendar year 2019 (Australian Government
Department of Industry, Science, Energy and Resources, 2020)
28* with values of 0% or null: the amount of use for that typology of alternative is usually NON-absent but so low
(close to 0%) that it can be negligible.
Table 4: Fuel mix by state (Authors’ calculations based on AEMO (n.d.) data).
Price duration curves
To understand whether there are good chances for the development of a green hydrogen strategy in
Australia, looking solely at the trends of electricity prices is not enough. In fact, electricity prices’ volatility
is quite elevated in the Australian energy market and, therefore, interpreting whether a region is generally
more suited for developing a clean hydrogen economy can be challenging. However, price duration curves
result helpful in such a situation. Thus, the following charts help to visualize whether a given state’s
electricity prices are most often low or high – with the definition of ‘low’ and ‘high’ depending on a pre-
established threshold. In connection to the possibility of producing clean hydrogen, the intuition behind this
data and the related threshold value is that if, in a specific state, electricity prices are low for most of the
hours in a year and renewable resources are “price setters” – i.e. take up a high percentage in the state’s
fuel mix and are connected to the electrolyzer – a hydrogen economy is much more feasible. In fact, since
the electrolyzer can be switched on and off according to the current electricity price, if prices are generally
low it would remain active for a longer time than in a scenario in which prices are, oppositely, generally
high, thus allowing for the production of clean hydrogen at reduced costs. In brief, the characteristics needed
to examine the issue are: (i) whether renewable alternatives are “price setters” and (ii) whether (hourly-
updated) electricity prices are mostly below the threshold in a given year.
For the purpose of this analysis, since AEMO reports price updates with a highly elevated frequency, instead
of hourly prices we consider prices related to the 30-minutes clearing2 (updated every half an hour). This
2
Data on 5-minutes-clearing prices are available but, according to our observations, the biggest changes in price are
less likely to occur within such a short interval of time than in a 30-minutes clearing.
29means that the total number of yearly observations are, ideally, 17520. However, due to the presence of
outliers - either too high or too low values - which would lead to an unsightly visualization of the plotted
values, we drop, as a ‘rule’, all observations whose price is above $1000 or below –$100. In three of the
five states (NWL, QLD and VIC) this consists of the elimination of a negligible sum of observations,
whereas in the other two the number of dropped observations (345 for SA, 1509 for TAS). The threshold
value is set at $80.
30Figure 22: Price Duration Curves (Authors’ calculations based on AEMO data)
Looking at the fuel mix in Figure 22 and the charts of the PDCs – i.e. without considering different energy
policies and the perspective of growth in the hydrogen sector, but simply looking at the numbers for 2019
– the development of a clean hydrogen economy in the nearest future looks less feasible than what the
Australia National Hydrogen Strategy seems to show. In fact, the three states which present the highest
percentage of renewable resources in their fuel mix (in order of amount of renewables, Tasmania, South
Australia and Victoria) usually experience quite high (30-minutes-clearing) electricity prices (above the
threshold of $80) for more than half of the year. Further support for this insight can lie on the fact that the
selected threshold price of $80 can be considered already quite elevated itself.
314. Regulation analysis
Australian government’s target to ensure a consistent and predictable regulatory framework to support
investments and innovations and to facilitate entering the hydrogen market. At the moment there are 730
pieces of legislation and 119 standards which have to be considered for the industry and its supply chain.
On the one hand, the industry development should be promoted, on the other side hydrogen safety has to
be considered. For this much coordination is required: Between the national governments of Australia,
between industry associations and their members as well as between countries. Regulations should be
consistent with the objectives but also flexible to be able to react to industry developments and to cover
new approaches (COAG Energy Council, 2019, p. 50).
Three different regulation types have to be (re)considered:
First, the commercial regulation which is defined in the gas supply act. It promotes the efficient
and economical processed gas supply and protects the interests of the customers. Until now hydrogen is not
specifically mentioned under this act which hinders the development of the hydrogen market.
Second, the safety regulations which are written down in the Commonwealth work health and
safety act. Its goals are to protect workers and other persons against harm to their health and safety. It still
needs to be analyzed if hydrogen requires additional regulations concerning these points.
Third, the functional regulations cover the technical, safety and environmental codes and standards
when using hydrogen.
Although some standards have been implemented (Hydrogen mobility Australia, 2020), many more
standards need to be adopted (general international safety standards, hydrogen production standards and
storage and transport standards) or revised (utilization standards) (Bruce, Temminghoff, Hayward,
Schmidt, Munnings, Palfreyman & Hartley, 2018; Standards Australia, 2018).
Especially, an international certification scheme, a proof that tracks and traces the production of clean
hydrogen, has to be established. This is necessary because after injecting hydrogen into the grid, it cannot
be distinguished anymore from natural gas. Without such a scheme adverse selection would occur, which
means that clean hydrogen would not enter the energy market due to the higher costs of production.
Producers of emission free hydrogen receive these certificates which they can trade to compensate for the
higher costs (Moraga, Mulder and Perey, 2019).
32Despite the importance of a certification scheme to successfully inject clean hydrogen into the grid it is not
established yet. The COAG Energy Council advises to start quickly with a small certification scheme which
could be later expanded to include water consumption and other factors (COAG Energy Council, 2019, p.
55, 70, 82).
Based on the assessment of Moraga et al. (2019), there should be only one international certification scheme
with a high transparency. This would lead to a high level of trustworthiness as well as a high liquidity in
the market. Furthermore, the certifying agency should be in public hands and a mass-balancing approach
should be utilized.
5. Policy analysis
a) Energy policy
The department of industry, science, energy and resources is responsible for the national energy policy.
Following its “Energy policy blueprint - a fair deal on energy” (Australian government, 2019) its main
pillars are the following:
1. Reliable, secure and affordable energy supply: Pushing down the wholesale electricity price to
$70/MWh by promoting investments in the energy infrastructure
2. Putting consumers first: Monitor the electricity and gas markets to ensure a competitive and
transparent market with low energy prices
3. Meeting international commitments: Reduce emissions by 26-28% below 2005 levels by 2030
to reach the target of the Paris agreement
Despite these straightforward goals, Australia’s renewable energy policy is often called “complex” and
“fragmented”. This can be accounted for by the changing administrations with different views over the last
years. Environmental accountability instead has fallen onto individual states rather than the federal
government. As an example, with the Renewable Energy Targets already met for 2020, no further
renewable energy targets have been put in place, but individual states have set their own for 2030 and even
2050. Moreover, there has also been several changes in direction in the support of coal. This led to stop-
start policies where coal generators have been closed with little notice leading to unnecessary high
electricity prices, low reliability of supply and relying on private investors to flood into the market in
installing renewable capacity which introduces a lagged response (van der Vlies, 2019; Wood, 2019). The
33support of coal with the current administration will slow the increase of renewable energy generation as
seen in the past few years. This leaves a murky outlook for the future of Australia’s energy mix and suggests
that without dedicated energy policies to increase the share of renewables, hydrogen production is unlikely
to be competitive with the current policies.
b) Tax policy
Despite Australia’s hopes to launch a new export industry which it hopes will be a new source of economic
growth, there has been no mention of how Australia will tax it’s exports of hydrogen (COAG, 2019). As
mentioned in section 2, Australia does have a good experience in scaling up export industries such as for
LNG however, it does not have such a good reputation when it comes to deriving the benefits out of it’s
largest exporting industries. In a review on petroleum resource rent tax by the Australian Institute (2017)
they note that “despite huge increases in gas production, revenue derived from the exploitation of our
resources is declining”. Current arrangements around the PRRT are distorting investment and failing to
deliver benefits to the Australian community”. This is due to the fact the PRRT taxes the amount of profits
made by a gas company rather than on the output produced hence, companies can amend their balance
sheets to get away from paying tax. If Australia wants to benefit from exporting hydrogen it must have a
more efficient tax plan in place (Bruce, 2019).
c) Public investment funding gap
In terms of public investment from the government, funding for the hydrogen economy is relatively low
compared to other countries and current commitments is insufficient. Australia Renewable Energy Agency
(ARENA) aims to accelerate investment in renewable energy projects only until 2022. There have been
calls for ARENA’s function to be extended (Salmon, 2020).
Furthermore, ARENA current budget stands at $70m committed to scaling up hydrogen projects. This is
equivalent to the deployment of two 10MW or larger electrolyser plants. There seems to be a willingness
to produce hydrogen in Australia as the funding round attracted 36 possible projects totaling $3 billion
(ARENA, 2020). The budget for emerging hydrogen technologies $200m. As a comparison, Germany's
national hydrogen strategy is around €9 billion (A$14.75 billion), €7 billion of which for emerging
hydrogen technologies (Salmon, 2020).
However, there are signs of greater commitment from the federal government. The clean energy finance
corporation's, advancing hydrogen fund launched this year has a fund of $300m for “projects which advance
hydrogen production; develop export and domestic hydrogen supply chains, including hydrogen export
34industry infrastructure, establish hydrogen hubs and assist in building domestic demand for hydrogen”
(CEFC, 2020).
Public investments have been shown to encourage investments from the private sector by at least a factor
of three; total investment by ARENA of $1.63 billion has unlocked a private investment of $6.69 billion in
Australia renewable energy industry (ARENA, 2020). In energy related projects, the RBA notes that the
initial direct investment of $8.5 billion encouraged further investments of $25 to $30 billion private sector
investments (Atholia, 2020).
The Australian Hydrogen Council (Salmon, 2020) suggests a budget for hydrogen of at least $2 billion and
existing funding for ARENA should be increased by $200 million per year for the next two financial years.
d) Public investment funding gap
Private investment is also extremely important to sufficiently scale up the hydrogen industry. To meet the
Hydrogen Council’s estimates of providing up to 18% of the world’s final energy demand by 2050, global
annual investments of between US$20 to $25 billion are needed for a total investment of about $280 billion
by 2030 (COAG, 2019a). Although the investment required in Australia will only be a fraction of this, it
represents significant new volumes of capital.
As analyzed throughout the report, Australia does have a natural competitive advantage with large potential
land for both green and blue hydrogen production, relatively high capacity factors, an increasing fraction
of renewable energies and experience in scaling up export industries. However, the current fuel mix, the
state of electricity prices, unclear energy policy direction, public investment gap are potential risks for an
investor when making a decision.
There is a need for the government to incentivize investment by private sources and there are several
demand and supply side mechanisms which the government can implement in order to reduce the risks for
private investments. This can be done through grant funding, public private partnerships, tax incentives on
the supply side and grants, rebates and subsidies on the demand side (COAG, 2019a)
35You can also read