Communicating Renewable Energy in the National Action Plans of the Member States of the European Union - MDPI
←
→
Page content transcription
If your browser does not render page correctly, please read the page content below
sustainability

Article
Communicating Renewable Energy in the National
Action Plans of the Member States of the
European Union
András Vincze 1 , Nóra Hegedűsné Baranyai 2, *, Henrik Zsiborács 2 , Szilvia Csányi 2 ,
István Háber 3 and Gábor Pintér 2
 1    Department of Foreign Languages, University of Pannonia, Georgikon Faculty, 8360 Keszthely, Hungary;
      vinander@t-online.hu
 2    Department of Economic Methodology, Georgikon Faculty, University of Pannonia, 8360 Keszthely, Hungary;
      ifj.zsiboracs.henrik@gmail.com (H.Z.); szilvia.csanyi15@gmail.com (S.C.); pg@georgikon.hu (G.P.)
 3    Energia Design Building Technology Research Group, Szentágothai Research Centre, University of Pécs,
      Faculty of IT and Engineering, 7624 Pécs, Hungary; ihaber@mik.pte.hu
 *    Correspondence: baranyai@georgikon.hu

 Received: 16 December 2019; Accepted: 24 January 2020; Published: 29 January 2020

 Abstract: For implementing renewable energy policies it is necessary to convince the population of the
 appropriateness and usefulness of the ideas. The information provision needed for that requires the
 communication to be accessible and understandable to the target audience. This research examined
 the national renewable energy action plans of the member states of the European Union. The online
 accessibility of these documents and their readability were examined using a simple accessibility
 test and the Flesch and Flesch–Kincaid readability tests. The paper also addresses the relationship
 between the culturally-determined power distance indices and the economic and developmental
 characteristics of the countries and the readability values of their samples. The results showed that
 the examined documents could be easily accessed, but the action plans of all the member states were
 difficult to read. The emerging pattern suggested that the text samples of the countries with higher
 power distances were harder to interpret. Nevertheless, no significant relationship was detected
 by the correlation analyses between the power distance indices and the Flesch and Flesch–Kincaid
 readability scores, while strong relationships were detected between the Human Development Index
 (HDI) data and the results of both readability tests in the group of countries with the highest power
 distance values.

 Keywords: energy policy; renewable energy; communication; readability; culture; power distance

1. Introduction and Literature Review
     Besides the most commonly used energy sources, the world’s nations of today try to make use
of renewable sources of energy to replace fossil fuels. Renewables differ from non-renewable energy
by the fact that they are from sources whose supplies can be regarded as continuous from a human
perspective, i.e., they are capable of regeneration within a foreseeable period of time.
     The issue of the so-called energy transition has, of course, raised the attention of many, and as
we can experience it in our everyday lives and see and hear it in the media, there is an increasingly
stronger public outcry for switching to more sustainable energy systems based on renewable energy
sources. The main reason for this is the public perception that our current energy consumption and
production, based mainly on fossil fuels, is to blame for such harmful environmental processes and
changes as the ever-growing carbon dioxide emissions and the resulting climate change.

Sustainability 2020, 12, 970; doi:10.3390/su12030970                        www.mdpi.com/journal/sustainability
Sustainability 2020, 12, 970 2 of 24
Considering the enormous social, environmental, and economic importance of the issue, providing
stakeholders—and the public in general—with relevant information about the related policies of
the governments and supranational organisations has become crucial. However, the fact that such
communication takes place is not satisfactory by itself. The information given must be widely
accessible, clear, and comprehensible to the target audiences. Therefore, an investigation into how such
communication is carried out seems to be conducive to establishing if citizens’ rights to be informed
are fulfilled and if the clarity and comprehensibility of policy-related documents differ from country
to country and/or are influenced by cultural differences or other major economic or developmental
characteristics of the nations.
1.1. Renewable Energies and Renewable Energy Policies in the World
By now it has become evident that besides energy efficiency it is renewable energy sources (RES)
that play the key role in global energy transformation [1]. Their use has demonstrated a considerable
increase in recent years (as illustrated by Table 1), partly due to new inventions, technological
development, growing competition, and the resulting drastic drop in costs. Consequently, it is of little
surprise that in the field of investments in 2017 more money was invested in renewable energy-based
electricity capacities than on those based on fossil fuels. In the same year 70% of the increase in the net
electric energy capacity was based on RES, approximately 178 gigawatt [2].
Due to the extraordinary importance of energy it is natural that states have their own energy
policies, which, among others, determine principles, goals, and the ways and means of reaching
them. Such sophisticated energy policies are all the more important because they are required
by the increasingly large and complex systems in general [3]. Moreover, it is also becoming
self-evident—because of the trends mentioned above—that specific renewable energy policies are
also created.
Table 1. The annual growth of renewable energy consumption by regions of the world and their
consumption (based on the gross energy production from renewable sources, including wind,
geothermal, solar, biomass, and waste energy, but excluding electric energy transported across
borders) as a percentage of global renewable energy consumption in 2018.
Region Annual Growth 2018 Annual Growth 2007–2017 Share 2018
North America 9.6% 13.9% 21.2%
South and Central America 12.2% 16.4% 6.3%
Europe 6.1% 13.1% 30.7%
Commonwealth of Independent States 24.0% 14.9% 0.1%
Middle East 34.2% 42.1% 0.3%
Africa 18.5% 20.4% 1.3%
Asia, Australia, and Oceania 25.0% 23.2% 40.2%
World total 14.5% 16.4% 100.0%
European Union 4.8% 12.8% 28.4%
Hungary 9.9% 66.9% 0.1%
Source: the authors’ own work based on a report by BP [4].
As a means of influencing the market and the legal environments, the various energy policies have
a fundamental role [5]. Although the effectiveness of renewable energy policies is often questionable
and they may involve major fiscal and economic costs, and may thusly be controversial [6], more
and more countries are deciding to support RES. At the end of 2017 87 countries had valid goals
concerning the share of energy generated from renewable sources in their final energy consumption.
Regarding sector-specific goals, 146 nations had valid targets at the same time [7].
These policies, however, cannot only be meant solely for the promotion of the use of RES,
but they also have to contribute to the achievement of other social goals [8], and thus their creationSustainability 2020, 12, 970 3 of 24
may be motivated by several reasons and aims. Some of these are related to the urging pressure of
environmental problems. Efforts to mitigate climate change and its impacts, for example, are even
prescribed by several international conventions. Among these, the Paris Agreement under the United
Nations Framework Convention on Climate Change (UNFCCC) of 2015 is of paramount importance,
and as of November 2019 it has been signed by 195 UNFCCC members [9].
The renewable energy policies made by various nations and organisations focus on three
main sectors, which, together with their subsectors, cover most energy consumption. The most
emphasis is laid on electric energy production worldwide. This may be partly because this is the
most expensive, transportable, and versatile sort of energy, and there is also a proven relationship
between its consumption and the gross domestic product (GDP) [10], as well as economic growth [11].
Another important sector, still receiving much less attention, is that of cooling and heating, within
which heating accounts for the largest final energy consumption of all sectors, and in 2015 it was
responsible for more than 50% of the total energy use. The third great area and the second most
important regarding final energy consumption is transport, where 29% of the total energy consumption
occurred in 2015. This sector is still highly dependent on fossil fuels, as 96% of the energy used in
transport in the same year came from oil products [2,12].
Miguel Arias Cañete, former European Commissioner for Energy and Climate Action, said:
“Policymaking is not about what can be done in theory, but much inspired by practicalities and political
feasibility” [13]. In order to implement the objectives of the renewable energy policies, decision-makers
use numerous tools. They include, for example, different national and/or international targets and
contributions undertaken in connection with RES. The systems of means also depend on various
regulations to a great extent, including: feed-in tariffs, the payment of direct supports, the quota
obligations of electricity utility companies, net metering and billing, obligations related to transport and
heating, renewable energy credits, and systems of tendering. States often use the methods of tax-like
incentives and state financing, for example, investment or production tax credits, value-added tax
(VAT), energy tax, CO2 tax and other tax reductions, energy production payments, state investments,
loans, capital support, and other schemes. Of the above-mentioned ways, according to Kalkuhl and his
colleagues [14] and Parry [15] the direct methods are the most effective for reducing CO2 emissions.
1.2. The Renewable Energy Policy of the European Union
The European Union’s policy on RES is to a great extent based on the Union’s standpoint and
role concerning environmental and climate protection. The necessity of the reduction of greenhouse
gas emissions naturally led to a quest for alternatives, including renewable ones, capable of replacing
fossil fuels in the EU, too. The Kyoto Protocol, signed on 11 December 1997, provided the international
foundation on which the Union’s first specific policies for limiting the emissions of greenhouse gases
were created [16].
In the whole world it is the European Union where the most climate protection policies and
measures have been made and introduced [17,18]. As a result of this, an enormous amount of
practical experience has been accumulated in the EU in the past decades. All that knowledge, in turn,
affects every aspect of policy-making, resulting in remarkable outcomes in technology development,
the mitigation of environmental pollution, and the separation of economic growth and increasing
greenhouse gas emissions.
Between 1990 and 2013 the GDP of the 28 member states increased by 45%, while the emission of
greenhouse gases decreased by 19% [13]. This means that the European Union managed to prove that
it is possible to reduce greenhouse gas emissions during continuous economic development. This is
a great achievement, even if the few decades since the beginning of the processes aiming for energy
transition and decarbonisation of the EU, starting in the 1990s, have been too short to come to final
conclusions about the success of the implemented policies.
According to the renewable energy directive that defines the current EU renewable energy
policy [19], every member state has to create a national renewable energy action plan, in which theySustainability 2020, 12, 970 4 of 24
themselves may determine the means they wish to use to achieve their goals as well as the composition
of their energy mixes [20]. They are also allowed to decide on the percentage of renewable energy
in each sector except for transport, where in the case of every member state the ratio of the use of
bio-fuels has to reach 10%.
In order to reach their national targets the countries may use, among others, various support
systems and so-called flexibility measures, which are initiatives for cooperation with other member
states or third countries [21]. Support systems are the various tools of the promotion of renewable
energies, by which the price of such energy can be raised, its costs can be reduced, or its amount sold
can be increased by introducing obligations or any other means. Such solutions may include support
for investments, tax exemption and tax advantages, tax refunds, support systems related to renewable
energy obligations, and systems of price subsidies, including feed-in tariffs and the payment of grants.
Within the framework of the above-mentioned flexibility measures the directive makes it possible
for the individual states to achieve their defined national targets in collaboration with other countries.
As the member states have widely varying potentials for the generation of renewable energy, this
possibility is of enormous importance because it allows renewable energy to be produced at the location
where it can be done the most cost-effectively.
Due to the dynamics of renewable energies and the sectors associated with them, it soon became
necessary to rethink the provisions of the renewable energy directive of 2009 [22]. As a part of the
energy union programme of the European Commission, the package of proposals titled “Clean Energy
for All Europeans” [23], often simply referred to as “Winter Package”, was officially published on
30 November 2016. The package can be regarded rather as the result of organic evolution than
revolution, and that is why it has been criticised by many as not ambitious enough. Nevertheless, it has
become an important part of EU legislation related to energy, and it is a significant step towards the
realization of a more and more comprehensive energy union.
Based on the Winter Package, the new renewable energy directive creates a common framework
for the promotion of the use of renewable energy in the various sectors. Basically, it provides a legal
basis for the realisation of the main goals under the proposals [24]. First of all, the new directive sets
down the mandatory comprehensive target for the whole European Union that the share of energy
from RES within the energy mix has to be at least 32% by 2030. (This figure is even higher than the
original 27% of the Winter Package.) This is the first time that self-consumption has been regulated,
meaning that consumers or communities of consumers wishing to produce energy are taken into
account, and a comprehensive regulatory system for the whole Union has been created for the use of
renewable energy besides the generation and use of electric energy and transport.
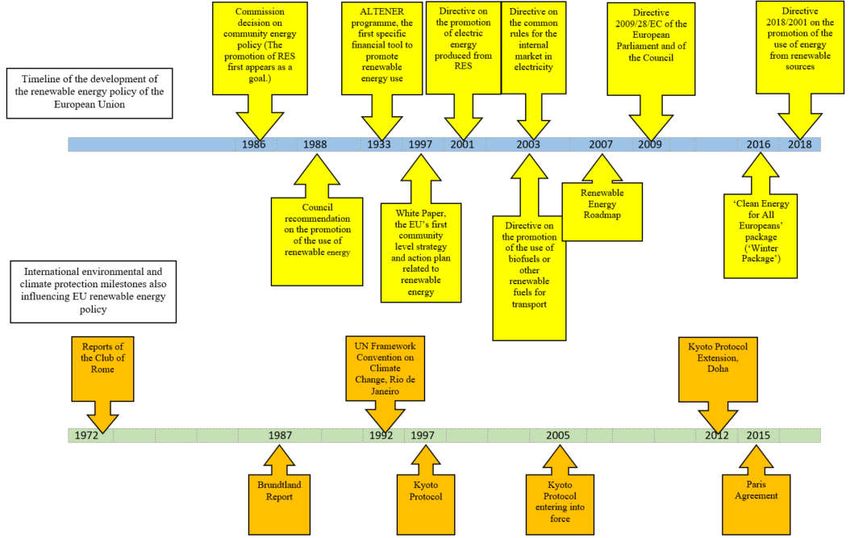
Regarding the development of the cause of renewable energy in the EU, which is illustrated by
Figure 1, it can be concluded that the renewable energy policy of the European Union has made great
progress from the beginning to the Winter Package, which will determine the future of the use of RES
in the Union in the next few decades.Sustainability 2020, 12, 970 5 of 24
Sustainability 2020, 12, 970 5 of 23
Figure
Figure 1. Timeline
1. Timeline of the
of the EUEU renewable
renewable energypolicy
energy policyininan
aninternational
international context.
context. Source:
Source:the
theauthors’
authors’own
ownwork
workbased on on
based a report by BP
a report by[4]
BP [4].Sustainability 2020, 12, 970 6 of 24
1.3. Policies and Communication
Policies, including renewable energy policies, are meant to be implemented in practice.
Although administrative and legislative measures are important steps in their realisation at the level of
each country, the enactment of law does not automatically lead to the successful implementation of the
policy. If the law, the regulations, and the system of support are not received with understanding and
acceptance by the affected parties, it may cause partial or complete failure of the policy. Research by
Rogers, Simmons, Convery, and Weatherall [25,26] also proved that besides financial support the
moral and intellectual backing of the local self-governments, economic actors, and the population is
extremely important for the success of local renewable energy projects.
Of course, communication, persuasion, and marketing and/or social marketing play a key role
at every level of the process. From the beginning, the birth of an idea, to the realisation of the
desired economic or social change, a wide range of people need to be convinced: from policy makers,
legislators, service providers, financing institutions, influencers, non-governmental organizations
(NGOs), local self-governments, and professional organisations to companies and individuals and
groups of individuals, who (in an ideal case) will be the beneficiaries of the changes [27]. It is obvious
that from the perspective of reaching a goal, communication and its quality, and whether the message
is received by the targeted groups or individuals are fundamental.
1.4. Readability and Measuring Readability
The question of readability is often raised in connection with the comprehensibility and clarity of
official communication and legislation. Readability has extensive literature in the United States and
recommendations, tests, and assessment methods are widely used for practical purposes. In spite
of the fact that concerning English there is much research done in the field of the assessment and
assessment methods of readability, this is not the case regarding other languages [28].
Before embarking upon an introduction of the methodologies of measuring readability, the notion
of readability itself needs to be clarified. According to DuBay’s [29] simple but useful definition,
readability is the characteristic of written texts that makes one text easier to read than others. As part
of his definition he also clarifies that readability is not to be confused with legibility. According to a
more comprehensive definition by Dale and Chall [30], readability refers to the entirety of the elements
(and their interplay) within a given printed text that determine with what success a particular group of
readers can read it. By “success”, the authors mean the level of comprehension, the optimal speed of
reading, and raising and maintaining interest.
As regards the research and practical use of readability thusly defined, it is worth going back to
DuBay [29], according to whom it was already in the second half of the 20th century that readability
formulas became widespread in the market and they started being used in many fields, including
journalism, research, the industry, law, insurance, healthcare, and even the US army in its technical
teaching materials. Norman Otto Stockmeyer [31], a professor emeritus of the Thomas M. Cooley Law
School and former president of Scribes—The American Society of Legal Writers, opines that it is
lawyers in particular who have to be especially careful to make sure that their readers can understand
their writings.
Loughran and McDonald’s [32] research demonstrated that readability and the assessment of
readability can have practical effects on business success, and they are closely related to the issue of
management too. Their project, in which the annual financial reports of companies were analysed,
proved that readability had a great impact on investors, i.e., better readability induced greater activity
among them. On the other hand, it was also established that companies with more democratic
management styles laid more emphasis on using simpler language. Firms with shareholder-friendly
cultures produced more easily readable reports. That observation has important implications for this
research too, since according to our hypothesis such differences between (organisational) cultures must
be perceivable also at the level of policy-making and legislation.Sustainability 2020, 12, 970 7 of 24
The measurement and formulas of readability can look back on a long history [29]. In connection
with the reading capabilities of the population of the USA, the first formulas were already developed
in the first half of the 20th century to predict the difficulty levels of written texts. Later, many started to
study the issue of readability, and by the 1980s about 200 different formulas had been created, with
more than a thousand articles on the topic. At that time there were also formulas for the assessment
of readability in Spanish, French, German, Swedish, Russian, Hebrew, Hindi, Chinese, Vietnamese,
and Korean [33].
Although science has given the world many methods and formulas to measure the readability
of texts, one of the most widely used applications is probably the readability assessment feature of
Microsoft Word. Upon completion of a full spellcheck on a Word document the appearing window
delivers readability statistics on the text. Unfortunately, the content of the service differs from language
to language. While in the case of the Hungarian language all what one gets is basically the number
characters, words, and sentences, for English texts the averages, the readability values, and the
percentage of sentences in passive voice are also given.
The readability figures thusly obtained for English texts in Microsoft Word are the scores of the
so-called Flesch and Flesch–Kincaid readability tests. The method developed by Rudolf Flesch in
1949 [31] works with the average number of syllables per word and the average number of words per
sentence in the text, and then draws conclusions regarding the reading difficulty. The higher the figure
is on a scale from 0 to 100, the easier the given text is to interpret.
The Flesch–Kincaid method was based on the research of J. Peter Kincaid in the 1970s. He changed
the formula by Flesch, so that a grade level (a level of education) necessary for the reading of the
examined text would be given. A higher score indicates the necessity of higher levels of schooling.
Stockmeyer also remarks that although neither of the two methods is 100% reliable, they are not worse
than any other general psychological tests in that respect, and they work well because they operate
with simple word and sentence lengths, which are the primary factors causing reading difficulty.
Nevertheless, one must be wary of striving only for the shortness of words and sentences, since that
may become counterproductive, because other factors need to be taken into account too, such as the
structure and layout of the texts, as well as the approach and the tone.
2. Materials and Methods
2.1. The Documents and Samples Examined
The subject of this research is the accessibility and quality of the communication related to the
use of renewable energy in the national action plans of the EU member states and the EU legislation
requiring them. These documents also comprise the corpus of the investigation. According to the
definition of the Hungarian concise dictionary of linguistic terms [34], a corpus is a collection of texts
that are selected and studied by scholars according to previously determined criteria.
The samples examined herein were chosen by the so-called varying probability sampling method,
as defined by Krippendorf [35]. This means that the units to be studied were selected according to
criteria we had established previously. These were the relevance from the perspective of the subject of
our research, comparability, and the linguistic aspects.
The most important criterion of relevance in our case was that the examined texts were all
determining the currently effective renewable energy policy of the EU and/or the respective policies of
the individual member states. By the linguistic criterion, we mean that for the investigation it was
indispensable to use the English translations of the originals. This was also crucial in order to comply
with the requirement of comparability, since a readability test can only deliver comparable results if
they are not distorted by differences between the languages. Regarding the criterion of comparability,
we considered it to be fortunate that all the documents studied showed similar genre-specific
features—they were all written for publication in an official and formal style. The homogeneity of
the samples was further enhanced by the fact that the European Commission had issued a detailedSustainability 2020, 12, 970 8 of 24
guide for the preparation of the national action plans in Commission Decision 2009/548/EC [36]. It was
also because of the aspect of comparability that the text excerpts actually analysed were all taken from
corresponding chapters of the renewable energy action plans.
As stated above, the corpus of the examinations was based on texts either by the European Union
or the member states. The first EU document was none other than the one calling for the national action
plans, Directive 2009/28/EC of the European Parliament and of the Council [19], the direct predecessor of
which was the Commission’s Renewable Energy Roadmap of 2007. As for the documents by the member
states, the investigation involved the national action plans in power at present. These accounted for the
lion’s share of the corpus. Concerning the document type, they were detailed reports submitted by the
specific countries under the stipulations of the Renewable Energy Directive [19].
The legal act that determines the current EU renewable energy policy directly and those of the
member states indirectly—by obliging them to create their national action plans—is Directive 2009/28/Ec
of the European Parliament and of the Council on the promotion of the use of energy from renewable
sources and amending and subsequently repealing Directives 2001/77/EC and 2003/30/EC [19]. As for
its genre, it belongs to the written, formal type of legal texts. Laws as documents [37] are characterised
by being general, looking forward, and always having some degree of obligatory force.
Together with regulations, decisions, opinions, and recommendations, EU directives belong to
the category of secondary EU law. EU directives are so-called unilateral acts that are binding for the
affected member states only regarding their goals, while the mode, form, and tools of reaching them is
left to the discretion of individual countries, together with fitting them into their own national legal
systems. Consequently, they are not as detailed as the regulations but rather set down general principles
concerning the expected objectives. In the case of the directives, the member states themselves have
to create the national legal acts that correspond to the respective directive within the framework of
their national legislations and before the set deadline. This may take place by supplementing and/or
amending existing acts or by completely new legislation. The obligations and rights deriving from
a directive become binding and applicable for the citizens of the member states only after the given
member states have transposed them. Since the countries have the possibility of certain consideration
related to the transposition of the directives, there is some opportunity to also take national differences
into account [38].
Besides prescribing the national renewable energy action plans, the renewable energy directive
also made provisions for the creation of a template according to which the member states would have
to prepare them (Commission Decision 2009/548/EC of 30 June 2009 [36]). The member states had
to present their national action plans concerning the use of renewable energy to the Commission by
30 June 2010. The action plans, together with any recommendations, were then sent by the Commission
to the European Parliament.
To sum up, the national renewable energy action plans, which were prepared by all the EU
member states and Iceland and Norway, are actually detailed roadmaps regarding how the given
countries wish to achieve their legally binding targets for 2020. The current target for the European
Union as a whole is that at least 20% of the energy consumed must come from renewable energy
sources. Within this common goal the targets set by the individual countries show great variation.
As is evident from the above, the action plans were primarily made for the Commission and the
European Parliament. Still, it cannot be said that they were only meant for the politicians and officials
of these two organs of the EU. The documents are widely available, and thanks to the Internet anyone
can easily find them. It can be assumed that they are read by all those who want to keep themselves
informed either for political, professional, or personal reasons concerning the member states’ plans
related to renewable energies, future possibilities, or just want to find out about the given countries’
commitments to the use of RES. Nevertheless, it must be noted that, since the national action plans
only contain information on principles, targets, and general information, the actual national support
systems, schemes, and other relevant legislation cannot be found in them, so they are not suitable for
direct personal or business decision-making.Sustainability 2020, 12, 970 9 of 24
2.2. The Accessibility Test
In the course of the research we first sought answers to the question of how easily available the
examined documents were to the wider audience, the general public. By doing so, what we hoped to shed
light on was the extent to which EU citizens’ rights to information under the Charter of Fundamental
Rights was observed regarding the renewable energy policies and the national action plans.
Of the news and information sources accessible to the average citizen this study only dealt with
the Internet, since—similarly to other parts of the world—in the European Union most people consider
the World Wide Web to be the main and most frequently used source of information. According to
data from Eurostat, concerning all of the 28 member states 89% of all households have access to the
Internet, which is used on a daily basis by 76% of the EU citizens aged 16–74 [39]. Based on this, it can
be duly assumed that most people also use the Internet to get to know the renewable energy policies of
the European Union as well as their respective countries.
As an element of the investigation, we examined by a simple method how many clicks it took
an average user to find a particular document by using the search engine of Google, whose market
share regarding the European search engines was more than 90% between August 2018 and August
2019 [40]. First, the search terms (e.g., EU renewable energy directive, the name of the given country
and renewable energy action plan (in English and in the official language of the specific country)) were
typed in, and then, in step two, clicking on search (click number 1) the user came to a page containing
the search results, where, in step three, clicking the link that seemed to be the most relevant (click
number 2) took one to further sites, until the required document or a link to a downloadable copy
of that was found. After that, in the final step, it was also established whether the documents were
accessible in a downloadable format or only to be read online.
Another exciting question was that of the languages, since in our increasingly globalised world it is
not only in the traditionally bi- or multilingual countries (e.g., Belgium) where it may become necessary
to provide information in more than one language, but for a variety of reasons citizens of other countries
might also be interested in a particular country’s renewable energy policy. Additionally, in many EU
member states there may be numerous residents who cannot speak the official languages of the given
countries, but they also have the right to be informed.
2.3. The Readability Tests
Investigating the communication of renewable energy in the member states of the European
Union and the accessibility of information, it seemed to be natural—besides the issue of the online
availability of the documents themselves—to explore how accessible the information in the national
action plans is to the lay reader in terms of readability and comprehensibility.
For this purpose the most obvious and—regarding the counting of the linguistic elements—also
the most reliable method [41] was the statistics feature of the Microsoft Word word processing software.
Microsoft Word uses two methods for testing readability. The Flesch Reading Ease Score (FRES) test
was developed by Rudolf Flesch [42]. The score is calculated according to the following formula:
Flesch Reading Ease Score = 206.835 − (1.015 × ASL) − (84.6 × ASW). (1)
Here, ASL means the average length of sentences, i.e., the total number of words divided by
the total number of sentences, while ASW stands for the average number of syllables per word, i.e.,
the total number of syllables divided by the total number of words. The score thusly obtained is a
number from 1 to 100, whose value is in an inverse relationship with the difficulty of reading the given
text. In the case of a score of 30 or below the text is very difficult to read, while texts with scores of
70 or higher are considered to be easy to interpret.
The Flesch–Kincaid readability test and the formula associated with it were created as a simplified
version of the Flesch readability index, and it is also based on the average sentence length and the
average number of syllables in the words of the analysed texts [43]:Sustainability 2020, 12, 970 10 of 24
Flesch-Kincaid Grade Level = (0.4 × ASL) + (12 × ASW) − 15.59. (2)
Here, grade level refers to a US school grade level minimally needed to be able to read and
comprehend the given text [44]. As the number can be really high, it may also be interpreted as the
number of years spent in education necessary to read a particular piece of writing. However, while it
is rather difficult
Sustainability to970
2020, 12, determine how much knowledge a person may be able to attain during 10 of8,2313.5,
or even 25 years of education and what texts one can understand with that knowledge, it can be said
thatnumber of years spentgrade
the Flesch–Kincaid in education
level cannecessary to read
be a useful toola for
particular piece of
comparative writing. However, while
examinations.
it is
The readability analysis herein consisted of six phases. First of all, due to to
rather difficult to determine how much knowledge a person may be able theattain during
subject of the8,research,
13.5,
i.e., the communication of the use of renewable energy in the EU countries’ renewable energysaid
or even 25 years of education and what texts one can understand with that knowledge, it can be action
that the Flesch–Kincaid grade level can be a useful tool for comparative examinations.
plans, it was obvious that the source to be studied was the national action plans themselves. The main
The readability analysis herein consisted of six phases. First of all, due to the subject of the
criteria of the selection of the actual samples taken from these were the relevance from the perspective
research, i.e., the communication of the use of renewable energy in the EU countries’ renewable
of the subject, comparability, and the linguistic aspects, as also mentioned earlier. Considering these,
energy action plans, it was obvious that the source to be studied was the national action plans
a chapter of the English translation of the action plans that provides a comprehensive presentation
themselves. The main criteria of the selection of the actual samples taken from these were the
of relevance
the countries’ fromplans related to their
the perspective of therenewable energy policies,
subject, comparability, andandthe also contains
linguistic relatively
aspects, as also long
passages
mentioned earlier. Considering these, a chapter of the English translation of the action plans that the
of continuous text, had to be chosen. The latter aspect was of utmost importance, since
performance
provides a of a readability presentation
comprehensive test requiresof coherent texts long
the countries’ plansenough
relatedforto analysis. According
their renewable energyto the
provisions
policies, ofand the Commission
also Decision,
contains relatively which
long had clearly
passages prescribed
of continuous text,the
hadstructure to be The
to be chosen. followed
latter for
theaspect
actionwasplans, it was importance,
of utmost the first chapter,
since titled “SummaryofofaNational
the performance readabilityRenewable
test requiresEnergy
coherentPolicy”
textsthat
satisfied these requirements.
long enough The totaltosample
for analysis. According included
the provisions theCommission
of the summarising chapters
Decision, of allhad
which 28 clearly
countries’
prescribed
action plans. the structure to be followed for the action plans, it was the first chapter, titled “Summary
of Secondly,
National Renewable
the selectedEnergy
chaptersPolicy” thattosatisfied
needed these requirements.
be converted The total
to a suitable format, sample included
followed by the third
the summarising chapters of all 28 countries’ action plans.
step: running the English-language spell checker of Microsoft Word on each text. In step four the data
were simplySecondly,
copied thefrom
selected chapters windows
the statistics needed todisplayed
be converted to end
at the a suitable format, followed
of the process. This wasby the
followed
third step: running the English-language spell checker of Microsoft Word on each
by the tabulation of the figures in the fifth step and the evaluation of the results, which was the sixth, text. In step four
the data were simply copied from the statistics windows displayed at the end of the process. This
final step.
was followed by the tabulation of the figures in the fifth step and the evaluation of the results, which
The following figure (Figure 2) summarises the process of the readability analyses.
was the sixth, final step.
Processing
Source Sample Preparation Readability
quantitative Evaluation
selection selection of files tests
data
- national - relevance - converting - running - retrieving - comparison
action plans from the files to the spelling readability -
perspective of Microsoft checker statistical interpretation
the topic Word format application data - examination
- of - tabulation of of
comparability Microsoft data relationships
- linguistic Word
aspects
Figure 2. The flowchart of the readability analysis. Source: the authors’ own work
Figure 2. The flowchart of the readability analysis. Source: the authors’ own work.
2.4.2.3. Statistical
Statistical methods
Methods
According
According to to Hunyadi
Hunyadi andand Vita
Vita [45]
[45] the
the relationshipswere
relationships wereanalysed
analysedbetween
betweenthe
theattributes.
attributes. In
In the
the selection
selection of the of the correlational
correlational methods
methods the measurement
the measurement scales
scales of attributes
of the the attributes
werewere taken
taken as aasbase.
a
base.
In the correlation analyses the relationship between two attributes was examined. The
dependent and the independent variables were differentiated. During the application of the
regression functions the greatest care was taken to use the function that provided the best fit. The
correctness of the regression models was tested by variance analysis, F-test (p < 0.05 indicated the
existence of a significant relationship). The higher the R2 value, the more closely the regression line
fits the set of points.Sustainability 2020, 12, 970 11 of 24
In the correlation analyses the relationship between two attributes was examined. The dependent
and the independent variables were differentiated. During the application of the regression functions the
greatest care was taken to use the function that provided the best fit. The correctness of the regression
models was tested by variance analysis, F-test (p < 0.05 indicated the existence of a significant relationship).
The higher the R2 value, the more closely the regression line fits the set of points.
3. Results
3.1. Results of the Accessibility Test
The renewable energy directive (2009/28/EC) [19] and the member states’ action plans for the
utilisation of energy from renewable sources are all easy to find for all on the Internet. During the
testing it was established that by a maximum of four mouse clicks all the documents were accessible,
and they were also all available for downloading; thus they could be saved for future study even
without Internet connection.
With regard to the languages it was observed that the national action plans were available, besides
English, in the/some of the official languages of the particular member countries, except for Greece
and Malta. Moreover, the national language versions could be accessed by fewer mouse clicks than
the English versions in the case of 19 out of the 28 states. Concerning the countries with more than
one official language, interesting differences were discovered. In the case of Belgium the plans can be
read in two of the official languages, French and Dutch, but not in the third official language, German,
spoken only by less than 1% of the population [46]. In contrast, apart from the official English language,
the Irish action plan is also available in the other official language of the country, Irish, which is only
used by 4.2% of the population on a daily basis [47]. The action plan of Luxembourg is only available
in German, besides the international English version, in spite of the fact that the country has three
official languages: Letzebuergesch, French, and German. As for the Finnish plan, it can be read in
Finnish and English but it is not available in Swedish, which is the second official language of the
country. Concerning the availability of the national renewable energy action plans in the languages of
other national minorities living in the member countries no data have been found on the Internet.
The summary of the renewable energy directive (2009/28/EC) can be read in all 24 official languages
of the European Union. Conversely, the full text is only available in 23; it is not in Irish. This may be
due to the statistical data on the use of the Irish language referred to above.
Besides all the above, however, it is also important to mention that if someone would like to use
the website of the European Commission instead of the Google search engine to access, for example,
the national action plan of Hungary in the national language, the search will be less convenient.
Opening the starting page of the official website [48], one has the possibility of choosing their national
language. Then, after selecting Topics one can choose Energy. At this point, however, an English page
opens, where there are no more language options. If the visitor of the website has not been discouraged
and can read English, they can proceed by clicking Renewable Energy to get to another English-only
page, where they can select the link that opens the next English-only page, which lists all the national
action plans. Here, one can access a further window, where they can download the required national
action plan.
In conclusion, as a result of the accessibility tests (shown in Table 2), it can be said that the
examined documents can be easily accessed and downloaded on the Internet, in most cases also in the
official languages of the respective countries. Nevertheless, the issue of the languages of the national
minorities, some of which are spoken by millions, raises an important question, the same way as the
fact that certain important pages of the European Commission can only be read in English.Sustainability 2020, 12, 970 12 of 24
Table 2. Results of the accessibility test.
Search Terms in National Languages
Country Clicks English Clicks Official/Further Language
/Name of Country + Renewable Energy Action Plan/
1. Austria 3 2 Österreich erneuerbare Energien Aktionsplan
2 Belgique plan d’action sur les énergies renouvelables
2. Belgium 3
2 België actieplan hernieuwbare energie
3. Bulgaria 4 3 Бългaрия плaн зa действие зa възoбнoвяемa енергия
4. Cyprus 4 3 Kύπρoς Σχέδιo ∆ράσης για τις Aνανεώσιµες Πηγές Eνέργειας
5. Czech Republic 2 2 Česká Republika akční plán pro energii z obnovitelných zdrojů
6. Denmark 3 2 Danmark handlingsplan for vedvarende energi
7. United Kingdom 3 3 UK renewable energy action plan
8. Estonia 4 2 Eesti taastuvenergia tegevuskava
9. Finland 4 2 Suomi uusiutuvaa energiaa koskeva toimintasuunnitelma
10. France 4 2 France plan d’action en faveur des énergies renouvelables
11. Greece 2 - Kύπρoς Σχέδιo ∆ράσης για τις Aνανεώσιµες Πηγές Eνέργειας
12. Netherlands 3 2 Holland actieplan hernieuwbare energie
13. Croatia 2 2 Hravatska akcijski plan obnovljivih izvora energije
3 Ireland renewable energy action plan
14. Ireland 3
2 Éire plean gníomhaíochta fuinnimh in-athnuaite náisiúnta
15. Poland 3 2 Polska plan działania w zakresie energii odnawialnej
‘
16. Latvia 3 2 Latvija atjaunojamās energijas rı̄cı̄bas plāns
‘
17. Lithuania 3 2 Lietuva atjaunojamās energijas rı̄cı̄bas plāns
- lëtzebuerger erneierbarer Energie Aktiounsplang
18. Luxembourg 4
3 Luxemburg Aktionsplan für erneuerbare Energien
19. Hungary 2 2 Hungary renewable energy action planSustainability 2020, 12, 970 13 of 24
Table 2. Cont.
Search Terms in National Languages
Country Clicks English Clicks Official/Further Language
/Name of Country + Renewable Energy Action Plan/
20. Malta 2 - Malta pjan ta ’azzjoni gh̄all-enerġija rinnovabbli
21. Germany 3 2 Deutschland Aktionsplan für erneuerbare Energien
22. Italy 3 2 Italia piano d’azione per le energie rinnovabili
23. Portugal 3 2 Portugal plano de ação para energias renováveis
24. Romania 2 6 România plan de act, iune pentru energie regenerabilă
25. Spain 3 3 España plan de acción de energías renovables
26. Sweden 3 2 Sverige handlingsplan för förnybar energi
27. Slovakia 3 2 Slovensko akčný plán pre obnovitel’né zdroje energie
28. Slovenia 2 3 Slovenija akcijski načrt za obnovljivo energijo
29. Directive 2009/28/EC (summary) 2 3 In the 24 official languages of the EU
30. Directive 2009/28/EC (full text) 3 4 In 23 official languages of the EU (no Irish)
Source: the authors’ own work.Sustainability 2020, 12, 970 14 of 24
3.2. Results of the Readability Tests
In the course of the readability tests of the samples from the 28 member states we examined
a collection of texts of 79,604 words in total. Their lengths varied from 408 (Luxembourg) to
7244 words (Romania).
Microsoft Word’s readability statistics provided us with 10 types of data about each text:
• the number of words;
• the number of characters;
• the number of paragraphs;
• the number of sentences;
• the average number of sentences per paragraph;
• the average number of words per sentence;
• the average number of characters per word;
• the percentage of passive sentences in the whole text;
• the Flesch Reading Ease score;
• the Flesch–Kincaid Grade Level.
After the examinations we tested how the results of the two readability tests related to each other.
The comparison of the Flesch and Flesch–Kincaid readability tests showed a very strong correlation
(R2 = 0.904) (Table A1).
As regards the readability of the samples, it can be concluded that all the analyses run delivered
results which seemed realistic, with one exception, and provided a suitable basis for further investigation.
Only the Latvian sample gave a Flesch readability score of 0.0, but its Flesch–Kincaid grade level
(24.3) also indicated a text which was extremely difficult to read. Moreover, the average number of
words per sentence had an extremely high value (42.4) too, which was obviously the main cause of the
bad readability results. Rechecking the sample, it could be established that the text could indeed be
characterised by the great length of its sentences.
Concerning all the samples, the Flesch reading ease scores ranged from 0.0 to 39.9. According to
Rudolf Flesch’s interpretation [49], scores between 0.0 and 30.0 indicate texts that are very difficult to
read and their comprehension requires at least a university degree. The values ranging from 30.00 to
50.00 signal the difficult-to-read category. To be able to understand texts in this it is “enough to be an
undergraduate”. According to the results of the tests, 26 out of the 28 samples (93%) fell into the very
difficult category, while only two (7%), those of the United Kingdom and Finland, reached the slightly
easier difficult level.
The Flesch–Kincaid readability values, correlating with the above scores, as seen before, also
showed difficult readability, with grade levels from 12.7 to 24.3. This means that without tertiary
studies one does not have much chance of understanding the texts, and what is more, in the case of
5 out of the 28 samples (17.86%) even 20 years of education would not be enough.
Table 3 shows the results of the two types of tests together. The ordinal numbers show the order
of reading ease from easier to more difficult (except for equal values, marked yellow). The easiest
10 samples are highlighted in green, while the most difficult 10 are in red. Comparing the two lists,
the most discrepancies can be seen in the middle (white) section, e.g., Estonia is 16th in the first table,
but it is only 22nd in the second one (marked blue).
After this, we compared the data delivered by the tests to the power distance values of the
countries based on Hofstede’s research [50]. Our hypothesis was that the two kinds of values were
related to each other. It was assumed that the action plans, which were all results of team work,
and although the European Commission decision stipulated what and how they had to contain, differed
from each other, reflecting the cultures that they were the products of. The assumption concerning the
translations was that they were the works of professional translators who were able not only to convey
the precise meaning of the original texts but also managed to preserve their other characteristics inSustainability 2020, 12, 970 15 of 24
their translations. This had to mean that the readability and comprehensibility of the English texts also
reflected the readability of the source language texts.
Table 3. The 28 samples in order of reading ease, from easiest to more difficult, according to the two
testing methods.
Ranking Country Flesch Country Flesch–Kincaid Ranking
United United
1 39.9 12.7 1
Kingdom Kingdom
2 Finland 38.1 Finland 13.9 2
3 Slovakia 25.5 Cyprus 14.9 3
4 Malta 22.5 Netherlands 15.0 4
5 Netherlands 21.4 Malta 15.2 5
6 Belgium 19.3 Belgium 15.5 6
7 Austria 18.5 Slovakia 15.6 8
8 Luxembourg 17.7 Austria 15.6 7
9 Cyprus 16.8 Luxembourg 16.1 9
10 Denmark 16.2 Germany 17.3 10
11 Germany 14.6 Romania 17.6 11
12 Lithuania 13.6 Denmark 17.7 12
13 Bulgaria 13.5 Lithuania 17.9 14
14 Hungary 13.5 Czech Republic 17.9 13
15 Czech Republic 13.4 Spain 18.5 15
16 Estonia 12.1 Sweden 18.6 16
17 Romania 11.4 Bulgaria 18.7 17
18 Spain 10.8 France 18.8 18
19 Sweden 10.3 Ireland 18.8 19
20 France 7.9 Hungary 19.5 20
21 Ireland 7.3 Italy 19.7 21
22 Greece 6.7 Estonia 19.8 22
23 Italy 6.2 Slovenia 19.9 23
24 Slovenia 6.1 Greece 21.2 24
25 Croatia 4.3 Croatia 21.3 25
26 Portugal 3.6 Poland 21.3 26
27 Poland 1.3 Portugal 21.8 27
28 Latvia 0.0 Latvia 24.3 28
Source: the authors’ own work.
As seen earlier, Loughran and McDonald’s [32] research demonstrated that the readability of the
texts they examined was related to the level of democracy of the management of the organisations
that had produced them. In addition, they also showed that the companies could expect greater
success among their clients if their written communication was easier to understand. In simpler
terms, this means that according to their findings a more democratic management style (characteristic
of lower power distance) means writing in a more comprehensible way, which will result in more
successful communication.
The countries were first listed according to their Flesch reading ease scores, from the easiest to the
more difficult ones, marking the ten easiest samples in green and the most difficult ten in red. (Certain
values occurred in the case of more than one sample.) Then, the same was done for the Flesch–Kincaid
grade levels and Hofstede’s power distance values [50]. In this part of the research Cyprus had to be
omitted because no power distance data were available for it. Table 4, thusly prepared, can be seen
below. The equal values are marked yellow.
The next table (Table 5), which combines the three lists, shows the same data in order of the power
distance values of the specific countries.Sustainability 2020, 12, 970 16 of 24
Table 4. Ranking on the bases of the Flesch Reading Ease Scores, the Flesch–Kincaid grade levels,
and the power distance values.
Ranking
Ranking
Ranking
Country Flesch Country Flesch–Kincaid Country Power Distance
1 United Kingdom 39.9 1 United Kingdom 12.7 1 Austria 11
2 Finland 38.1 2 Finland 13.9 2 Denmark 18
3 Slovakia 25.5 3 Netherlands 15 3 Ireland 28
4 Malta 22.5 4 Malta 15.2 4 Sweden 31
5 Netherlands 21.4 5 Belgium 15.5 5 Finland 33
6 Belgium 19.3 6 Slovakia 15.6 6 Germany 35
7 Austria 18.5 7 Austria 15.6 7 United Kingdom 35
8 Luxembourg 17.7 8 Luxembourg 16.1 8 Netherlands 38
9 Denmark 16.2 9 Germany 17.3 9 Luxembourg 40
10 Germany 14.6 10 Romania 17.6 10 Estonia 40
11 Lithuania 13.6 11 Denmark 17.7 11 Lithuania 42
12 Hungary 13.5 12 Lithuania 17.9 12 Latvia 44
13 Bulgaria 13.5 13 Czech Republic 17.9 13 Hungary 46
14 Czech Republic 13.4 14 Spain 18.5 14 Italy 50
15 Estonia 12.1 15 Sweden 18.6 15 Malta 56
16 Romania 11.4 16 Bulgaria 18.7 16 Spain 57
17 Spain 10.8 17 France 18.8 17 Czech Republic 57
18 Sweden 10.3 18 Ireland 18.8 18 Greece 60
19 France 7.9 19 Hungary 19.5 19 Portugal 63
20 Ireland 7.3 20 Italy 19.7 20 Belgium 65
21 Greece 6.7 21 Estonia 19.8 21 France 68
22 Italy 6.2 22 Slovenia 19.9 22 Poland 68
23 Slovenia 6.1 23 Greece 21.2 23 Bulgaria 70
24 Croatia 4.3 24 Croatia 21.3 24 Slovenia 71
25 Portugal 3.6 25 Poland 21.3 25 Croatia 73
26 Poland 1.3 26 Portugal 21.8 26 Romania 90
27 Latvia 0.0 27 Latvia 24.3 27 Slovakia 104
Source: the authors’ own work.
Table 5. The combined Flesch Reading Ease Scores, the Flesch–Kincaid grade levels, and the power
distance values in the order of the power distance from low to high.
Ranking Country Power Distance Flesch Flesch–Kincaid
1 Austria 11 18.5 15.6
2 Denmark 18 16.2 17.7
3 Ireland 28 7.3 18.8
4 Sweden 31 10.3 18.6
5 Finland 33 38.1 13.9
6 United Kingdom 35 39.9 12.7
7 Germany 35 14.6 17.3
8 Netherlands 38 21.4 15
9 Estonia 40 12.1 19.8
10 Luxembourg 40 17.7 16.1
11 Lithuania 42 13.6 17.9
12 Latvia 44 0.0 24.3
13 Hungary 46 13.5 19.5
14 Italy 50 6.2 19.7
15 Malta 56 22.5 15.2
16 Czech Republic 57 13.4 17.9
17 Spain 57 10.8 18.5
18 Greece 60 6.7 21.2
19 Portugal 63 3.6 21.8
20 Belgium 65 19.3 15.5
21 France 68 7.9 18.8
22 Poland 68 1.3 21.3
23 Bulgaria 70 13.5 18.7
24 Slovenia 71 6.1 19.9
25 Croatia 73 4.3 21.3
26 Romania 90 11.4 17.6
27 Slovakia 104 25.5 15.6
Source: the authors’ own work.Sustainability 2020, 12, 970 17 of 24
In order to verify the validity of the hypothesis that there is a connection between the power
distance and the readability values, correlation and regression analyses were carried out, in the course
of which polynomial regression produced the closest fit (Table A2) and the following results, displayed
in Table 6, were received.
Table 6. The results of the correlation analyses between the power distance values and the
readability scores.
Relationship R2 F p-Value
Power distance-Flesch index 0.136 1.896 0.172
Power distance-Flesch–Kincaid index 0.163 2.333 0.119
Source: the authors’ own work.
It can be established that regarding the entirety of the samples the significant relationship was
very weak between the power distance and the readability values.
The same analyses were also performed regarding the 2017 real GDP per capita [51], HDI [52] and
research and development (R&D) expenditure (% of GDP) [53] data of the member states examined
with the following results, shown in Table 7.
Table 7. The results of the correlation analyses between the GDP, HDI, and R&D expenditure (% of
GDP) values and the readability scores.
Relationship R2 F p-Value
GDP-Flesch index 0.140 1.951 0.164
GDP-Flesch–Kincaid index 0.256 4.138 0.029
HDI-Flesch index 0.152 2.145 0.139
HDI-Flesch–Kincaid index 0.263 4.277 0.026
R&D-Flesch index 0.097 1.292 0.293
R&D-Flesch–Kincaid index 0.147 2.074 0.148
Source: the authors’ own work.
In the case of the GDP data and the Flesch–Kincaid indices and that of the HDI data and the
Flesch–Kincaid indices only medium relationships were shown.
Then, the samples were divided into quartiles according to their power distance values after
Slovakia had been assigned a value of 25 on the basis of Bašnáková, Brezina, and Masaryk’s research [54],
and a pattern emerged, revealing that with the exception of Belgium, all the remaining countries’
samples in the last quartile had worse than average Flesch reading ease scores (13.915). Thus, it seemed
reasonable to revisit the countries in the last quartile, which was based on Hofstede’s power distance
values. It is, however, also worth noting that Belgium’s situation is special because among the power
distance data given by [50] the authors assigned two values to Belgium: one to the French (68) and one
to the Flemish speaking part (61) of the country. The value (65) used in this research was the average
of the two. Because of this uncertainty of the Belgian value it was decided that Belgium had to be
removed from among the samples examined. The EU countries divided into quartiles according to
their power distance values are shown in Table 8, below.You can also read