Renewable Energy across Queensland's Regions
←
→
Page content transcription
If your browser does not render page correctly, please read the page content below
Renewable Energy across
       Queensland’s Regions
       July 2018

Enlightening environmental markets

                                     Green Energy Markets Pty Ltd
                                     ABN 92 127 062 864
                                     2 Domville Avenue
                                     Hawthorn VIC 3122 Australia
                                     T +61 3 9805 0777
                                     F +61 3 9815 1066
                                     insight@greenmarkets.com.au
                                     greenmarkets.com.au
                                     Part of the Green Energy Group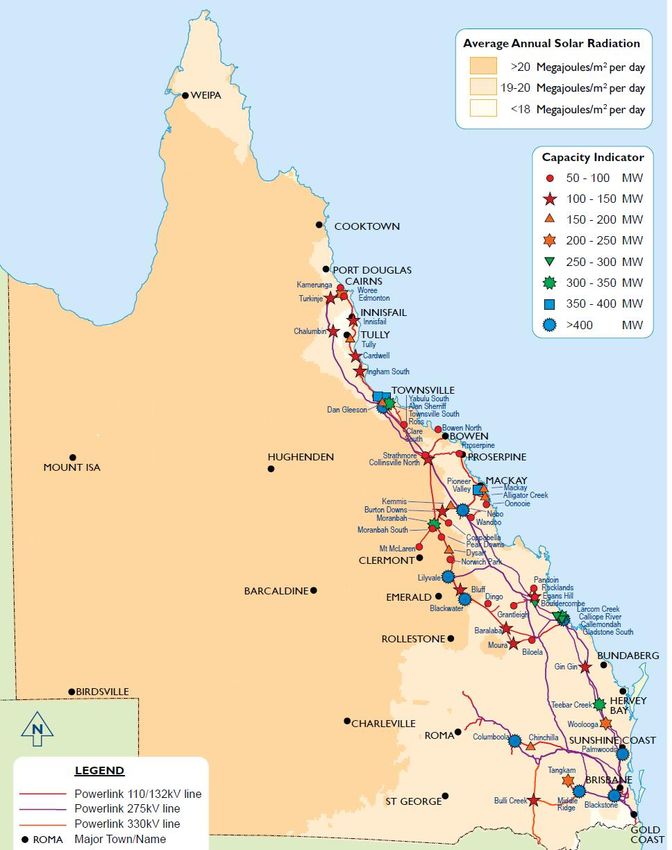
Green Energy Markets 1
Contents
1 Introduction ........................................................................................................................6
2 Overview of Renewable Energy across Queensland .....................................................8
   2.1 Large-scale projects ..................................................................................................................... 9
   2.2 Rooftop solar photovoltaics ........................................................................................................ 13
   2.3 Batteries-Energy Storage ........................................................................................................... 16
   2.4 The renewable energy resource ................................................................................................. 18
   2.5 Transmission .............................................................................................................................. 26
3 The renewable energy supply chain ............................................................................. 31
   3.1 Construction activity.................................................................................................................... 31
   3.2 Equipment manufacture - Solar .................................................................................................. 31
   3.3 Equipment manufacture - wind ................................................................................................... 33
   3.4 Estimating employment from renewable energy projects ........................................................... 34
4 Regional Profiles – Mackay-Whitsunday ...................................................................... 36
   4.1 Rooftop solar .............................................................................................................................. 36
   4.2 Utility-scale projects .................................................................................................................... 36
5 Regional Profiles – Townsville and the Dry Tropics ................................................... 38
   5.1 Rooftop solar .............................................................................................................................. 38
   5.2 Utility-scale projects .................................................................................................................... 38
   5.3 Battery manufacturing................................................................................................................. 39
6 Regional Profiles – Far North Queensland .................................................................. 41
   6.1 Rooftop solar .............................................................................................................................. 41
   6.2 Utility-scale projects .................................................................................................................... 41
7 Regional Profiles – Darling Downs ............................................................................... 43
   7.1 Rooftop solar .............................................................................................................................. 43
   7.2 Utility-scale projects .................................................................................................................... 43
8 Regional Profiles – Wide-Bay Burnett .......................................................................... 45
   8.1 Rooftop solar .............................................................................................................................. 45
   8.2 Utility-scale projects .................................................................................................................... 45
9 Regional Profiles – Central Queensland ...................................................................... 47
   9.1 Rooftop solar .............................................................................................................................. 47
   9.2 Utility-scale projects .................................................................................................................... 47
10 Regional Profiles – South East Queensland ................................................................ 49
   10.1        Rooftop solar ....................................................................................................................... 49
   10.2        Utility-scale projects ............................................................................................................ 49
11 Regional Profiles – Western Queensland .................................................................... 51
   11.1        Rooftop solar ....................................................................................................................... 51
   11.2        Utility-scale projects ............................................................................................................ 51
12 Appendix A – Definitions of regional boundaries ....................................................... 53
13 Appendix B – Listing of large-scale renewable energy projects in Queensland ..... 56

       Green Energy Markets                                                                                                                          2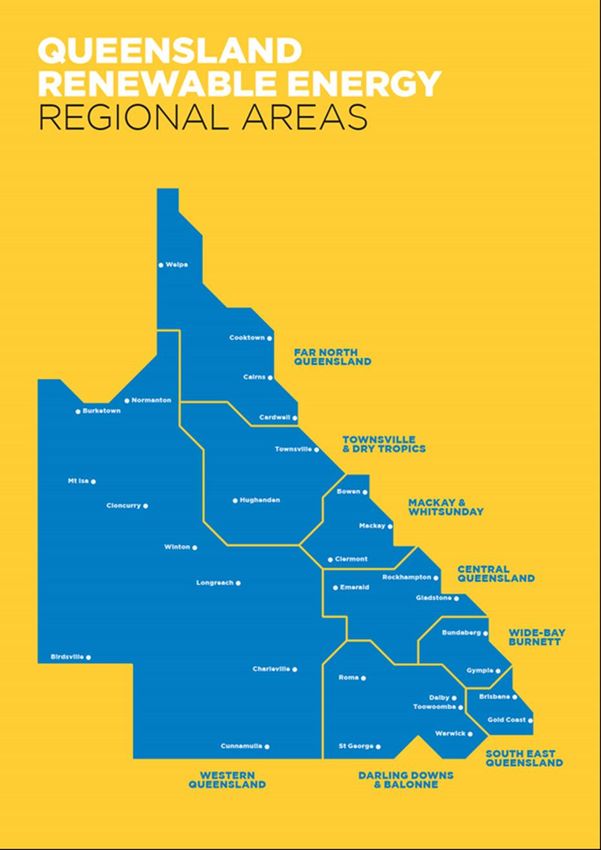
Disclaimer: The data, analysis and assessments included in this report are based
on the best information available at the date of publication and the information is
believed to be accurate at the time of writing. Green Energy Markets does not in any
way guarantee the accuracy of any information or data contained in this report and
accepts no responsibility for any loss, injury or inconvenience sustained by any users
of this report in relation to any information or data contained in this report.

Green Energy Markets                                                                     3
Figures
Figure 1-1 Geographical boundaries defining regions used in this report ............................................... 7
Figure 2-1 QLD renewable energy power generation and share of consumption ................................... 8
Figure 2-2 Queensland large-scale installed renewable energy by 2020 compared to past ................. 10
Figure 2-3 Renewable energy projects under development in Queensland in 2015 versus 2018 ........ 12
Figure 2-4 Queensland cumulative solar PV rooftop capacity and number of installations ................... 13
Figure 2-5 Number of solar PV systems and proportion of dwellings with solar by state ...................... 14
Figure 2-6 Projected cumulative rooftop solar capacity and systems to 2020 ...................................... 15
Figure 2-7 AEMO projected rooftop solar power generation and share to 2030 ................................... 16
Figure 2-8 Average price of lithium-ion battery pack per kWh of storage 2010-2017 ........................... 16
Figure 2-9 Average daily pattern of output from Kennedy wind turbines and solar farm....................... 17
Figure 2-10 Amount of energy storage required to ensure reliability and security at high levels of
renewable energy share of supply ........................................................................................................ 18
Figure 2-8 Intensity of solar radiation across the NEM states ............................................................... 19
Figure 2-9 Capacity factors of solar farms across Queensland compared to the international average of
2017 installations .................................................................................................................................. 20
Figure 2-10 Capacity factors of Qld committed wind farms compared to the international average of
2017 installations .................................................................................................................................. 21
Figure 2-11 Average wind speeds across the NEM states ................................................................... 22
Figure 2-12 Correlation of 2015/16 power output across wind farms in NEM relative to distance apart 23
Figure 2-13 Prospective suitable sites for pumped hydro facilities (red dots) ....................................... 25
Figure 2-14 Powerlink assessment of the generation capacity that can be absorbed on the QLD
transmission system excluding 275kV and 330kV substations ............................................................. 27
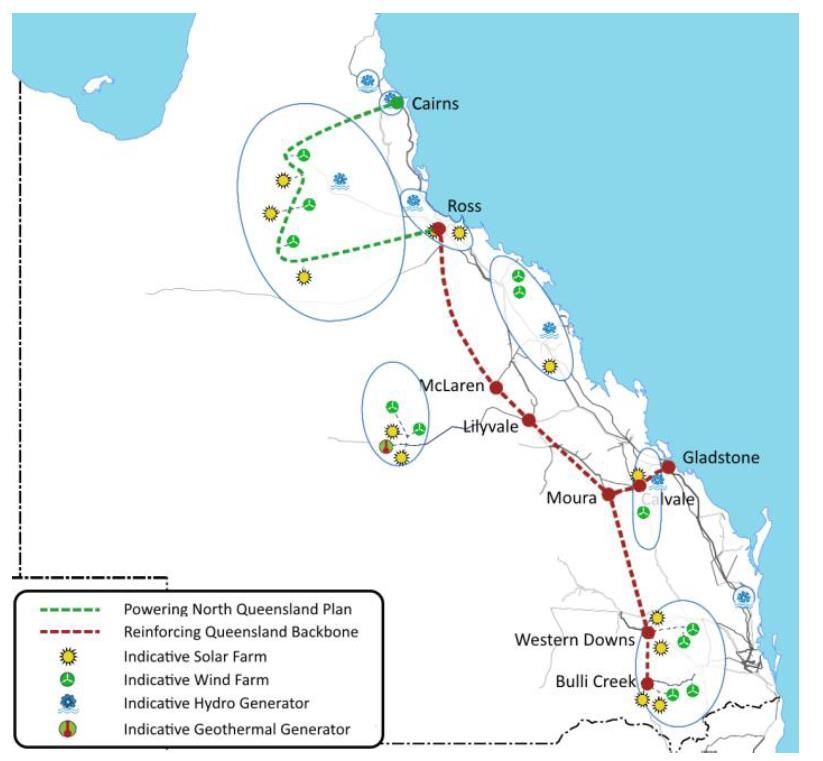
Figure 2-15 New transmission lines (dashed) identified by AEMO to support exploitation of areas with
high quality renewable energy resources ............................................................................................. 29
Figure 2-16 AEMO options to upgrade the NSW-Queensland Interconnector ...................................... 30
Figure 3-1 Breakdown of locally versus internationally sourced equipment (non-module) used in Broken
Hill and Nyngan Solar Farms ................................................................................................................ 33
Figure 12-1 Geographical boundaries defining regions used in this report ........................................... 54
Green Energy Markets 4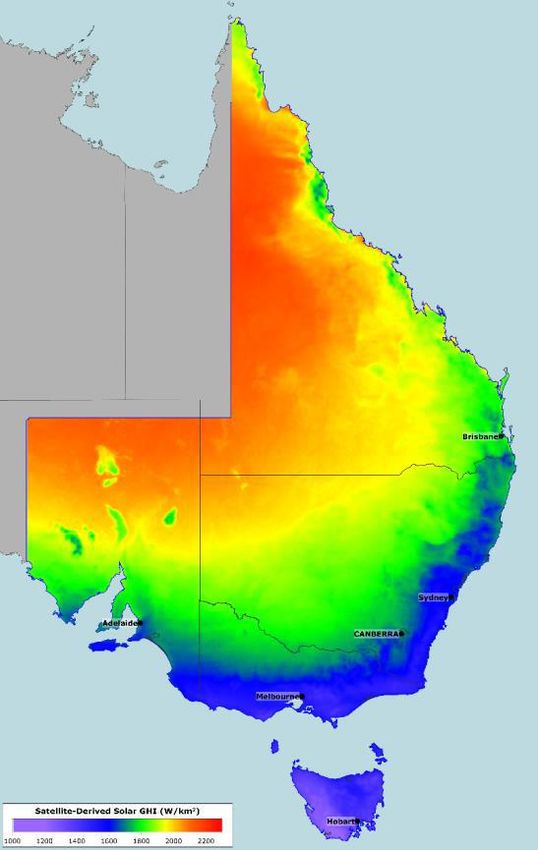
Tables

Table 2-1 Impact on retail electricity prices of 50% renewable energy target ......................................... 9
Table 2-2 Jobs and investment from projects built or under construction post-2015 ............................ 11
Table 2-3 Jobs and investment from projects currently under development ......................................... 12
Table 2-4 Estimated annual bill savings per solar system and state-wide ............................................ 14
Table 2-5 Estimated employment in sales, design and installation of rooftop solar in QLD .................. 15
Table 2-6 Number of transmission sites that can support different levels of new generating capacity . 26
Table 2-7 Recently completed solar farms with large downgrades to loss factors ................................ 28
Table 4-1 Uptake of rooftop solar PV in Townsville-Dry Tropics Region .............................................. 36
Table 4-2 Operational large-scale power projects in Mackay-Whitsunday Region ............................... 36
Table 4-3 Projects under construction and development in Mackay-Whitsunday Region..................... 36
Table 4-4 Employment, investment and emissions abatement flowing from projects under construction
and development in Mackay-Whitsunday Region ................................................................................. 37
Table 5-1 Uptake of rooftop solar PV in Townsville-Dry Tropics Region .............................................. 38
Table 5-2 Operational large-scale power projects in Townsville-Dry Tropics Region ........................... 38
Table 5-3 Projects under construction and development in Townsville-Dry Tropics ............................. 39
Table 5-4 Employment, investment and emissions abatement flowing from projects under construction
and development in Townsville-Dry Tropics region .............................................................................. 39
Table 6-1 Uptake of rooftop solar PV in Far North Queensland Region ............................................... 41
Table 6-2 Operational large-scale power projects in Far North Queensland Region ............................ 41
Table 6-3 Projects under construction and development in Far North Queensland .............................. 42
Table 6-4 Employment, investment and emissions abatement flowing from projects under construction
and development in Far North Queensland region ............................................................................... 42
Table 7-1 Uptake of rooftop solar PV in Darling Downs Region ........................................................... 43
Table 7-2 Operational large-scale power projects in Darling Downs Region ........................................ 43
Table 7-3 Projects under construction and development in Darling Downs .......................................... 44
Table 7-4 Employment, investment and emissions abatement flowing from projects under construction
and development in Darling Downs region ........................................................................................... 44
Table 8-1 Uptake of rooftop solar PV in Wide-Bay Burnett Region....................................................... 45
Table 8-2 Operational large-scale power projects in Wide-Bay Burnett Region ................................... 45
Table 8-3 Projects under construction and development in Wide-Bay Burnett region .......................... 46
Table 8-4 Employment, investment and emissions abatement flowing from projects under construction
and development in Wide-Bay Burnett region....................................................................................... 46
Table 9-1 Uptake of rooftop solar PV in Central Queensland Region ................................................... 47
Table 9-2 Operational large-scale power projects in Central Queensland Region................................ 47
Table 9-3 Projects under construction and development in Central Queensland region ...................... 48
Table 9-4 Employment, investment and emissions abatement flowing from projects under construction
and development in Central Queensland region ................................................................................... 48
Table 10-1 Uptake of rooftop solar PV in South-East Queensland Region ........................................... 49
Table 10-2 Operational large-scale power projects in South-East Queensland Region ....................... 49
Table 10-3 Projects under construction and development in South-East Queensland region .............. 50
Table 10-4 Employment, investment and emissions abatement flowing from projects under construction
and development in South-East Queensland region............................................................................. 50
Table 11-1 Uptake of rooftop solar PV in Western Queensland Region ............................................... 51
Table 11-2 Operational large-scale power projects in Western Queensland Region ............................ 51
Table 11-3 Projects under construction and development in Western Queensland region................... 52
Table 11-4 Employment, investment and emissions abatement flowing from projects under construction
and development in Western Queensland region ................................................................................. 52

      Green Energy Markets                                                                                                          5
1   Introduction

    Political leaders in Queensland and across Australia have tended to focus their attention
    on how difficult it might be for us to transition our electricity supply to low polluting
    alternatives. The emphasis has often been not on imagining the future we’d like to create
    and how new technology and ideas could get us there. Instead we’ve been trapped letting
    the past define what our future can be, rather than our abilities, our natural assets and
    our scientific understanding and technological capability. Our thinking has been
    dominated by what we might lose through change rather than what could be gained.
    This report provides a different perspective. Advancements in renewable energy
    technology have opened-up new possibilities for how Queensland and the country more
    broadly can power our economy and our way of life.
    Around Queensland many households and businesses are seizing the opportunities
    opened by these technological advancements. They are taking the initiative, some by
    installing solar on their rooftops. At a larger scale they are identifying areas rich in
    renewable energy resources. They are also working with communities, farmers,
    engineers and grid operators to prepare sites to host power stations that will produce
    copious amounts of energy without the pollution that undermines our children’s future.
    This report has sought to document the initiatives taking place in Queensland which are
    creating a new energy future. It details how these initiatives are now at a scale that could
    produce much of the electricity we need. In building this new energy future we will also
    provide significant employment and economic gains to regions all around the state.
    To help readers appreciate how these initiatives and the opportunities that flow from them
    are distributed around Australia, we have provided a break-down by several geographic
    regions detailed in Figure 1-1. The local government authorities that make up each of
    these regions are detailed in Appendix A.
    Transforming our energy system to one powered by renewable energy without pollution
    undoubtedly presents challenges, but they are challenges that we can overcome.

    Green Energy Markets                                                                      6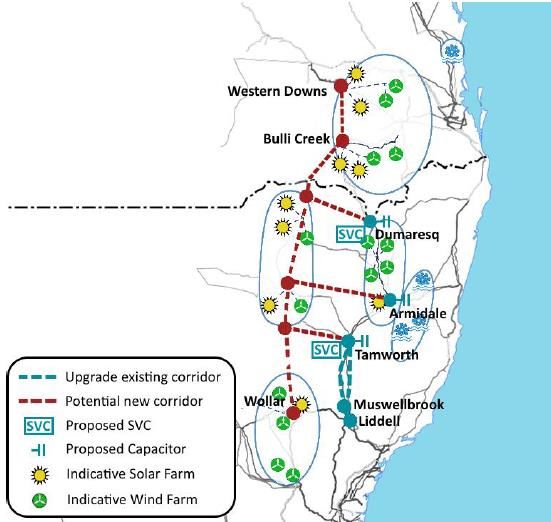
Figure 1-1 Geographical boundaries defining regions used in this report

Green Energy Markets                                                      7
2   Overview of Renewable Energy across Queensland

    Queensland has experienced a dramatic expansion of renewable energy project
    development activity within the space of just 3 years. At the same time its rooftop solar
    sector, which has led the rest of the country for many years, has experienced a revival of
    growth.
    Based on projects under construction, expected uptake of rooftop solar and the
    Queensland Government successfully concluding its 400MW renewable energy tender,
    renewable energy will surge from 7.4% of Queensland electricity consumption in 2015 to
    25.6% by 2020 (see Figure 2-1). After 2020 we can expect to see ongoing installations
    of rooftop solar PV, however there is no clear ongoing commercial incentive to install
    additional megawatt-scale utility projects after 2020. Consequently, it is highly likely that
    Queensland will fall well short of the government’s 2030 target for renewable energy to
    supply 50% of electricity consumption. Instead generation representing under 30% of
    electricity consumption is likely without new policy.
    However, this is not for lack of potential projects. This report details that Queensland’s
    pipeline of projects under development totals almost 15,000MW. While there are a range
    of constraints that would need to be overcome, if all projects proceeded they would be
    capable of producing an amount of electricity per annum equal to more than 90% of
    Queensland’s forecast 2030 electricity consumption.

    Figure 2-1 QLD renewable energy power generation and share of consumption

    Sources: Total electricity consumption is based on “native” electricity consumption taken from
    Australian Energy Market Operator’s March 2018 National Electricity Forecasting report as is
    expected electricity generation from rooftop solar in 2030. Rooftop solar generation in 2020 is based
    on Green Energy Markets estimates of likely installed solar PV capacity by 2020 multiplied by
    average capacity factors for rooftop solar. Generation for other fuel types is based on a combination
    of historical averages for renewable energy projects currently in operation, plus Green Energy
    Markets estimates of likely generation from projects under construction plus a likely fuel mix from
    the Government’s 400MW auction.
    Achieving 50% renewable energy by 2030 would have appeared to be a very difficult task
    when compared against what was in place in 2015. Yet in just the three subsequent years
    industry and government have put in place investments and processes to increase
    renewables output by 9,800GWh by 2020. Given what has been achieved in this period,

    Green Energy Markets                                                                               8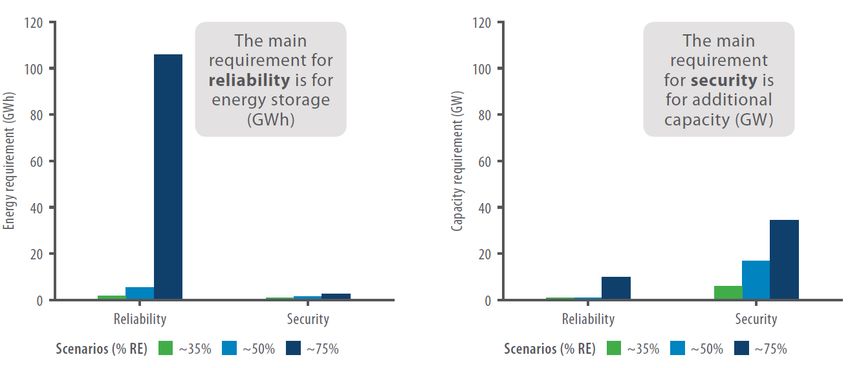
the remaining gap to 50% of 11,900GWh no longer appears so difficult, especially given
      the state has a 12-year lead time.
      According to economic modelling by Jacobs for the Queensland Government’s
      Renewable Energy Expert Panel, the cost of long-term power purchase agreements to
      support the financing of new projects to achieve the 50% target would be entirely offset
      by reductions in the wholesale price of electricity. Table 2-1 sets out the results from this
      modelling on how the 50% target would slightly reduce retail prices faced by different
      electricity consumer groups in Queensland. This was the case under two pathways
      considered: one that involved a building a constant amount of capacity each year (linear);
      and another that sought to defer much of the construction until closer to 2030 (ramp).
      Table 2-1 Impact on retail electricity prices of 50% renewable energy target
                                              Linear        Ramp
                                            pathway       pathway
       Residential tariffs: Average price
                                              -1.1%          -1.2%
       change (2020-2030)
       Commercial tariffs: Average
                                              -1.2%          -1.3%
       price change (2020-2030)
       Industrial tariffs: Average price
                                              -0.7%          -1.5%
       change (2020-2030)
      Source: Queensland Renewable Energy Expert Panel (2016) Credible pathways to a 50%
      renewable energy target for Queensland – Final Report
      The analysis by Jacobs indicated that the influx of additional supply from renewable
      energy projects would create substantial additional competition for the existing
      generators, forcing them all to reduce their market bid prices. This then flows through as
      lower energy costs in consumers’ retail bills. These lower wholesale electricity market
      prices then offset the extra cost consumers would bare through paying new renewable
      energy generators a long-term contract price to support financing and construction of
      these projects.
      It is worth noting that since the Expert Panel report was published it has become apparent
      that their cost assumptions for wind and solar were too high. Over the past twelve months
      power contract prices developers have been able to finance projects for are about 30%
      to 40% lower for wind, and about 50% lower for solar projects than what was thought to
      be the case when the Expert Panel produced their report. Part of the explanation for this
      large discrepancy is that in the lead-up to the development of Expert Panel report there
      had been very few projects built in Australia over the preceding two years. In addition,
      Australia’s construction and financing costs for the small number of large solar farms built
      at that time were abnormally high compared to international best practice. Since
      November 2016 there has been a considerable number of wind and solar projects
      committed to construction that have provided a much-improved picture of wind and solar
      farm economics.
      Section 2.1 provides further detail on the dramatic growth that has occurred in
      Queensland’s large-scale renewable energy sector. This concentrates on projects that
      are typically above 1 megawatt in capacity, but in some cases involve large rooftop solar
      installations greater than 100 kilowatts. Section 2.2 then details growth in Queensland’s
      smaller rooftop solar PV sector (projects below 100 kilowatts).

2.1    Large-scale projects
      The chart below illustrates that between 2010 and 2015 there was almost no growth in
      the amount of large-scale renewable energy capacity in the state. Much of the state’s
      renewable energy generating capacity was a legacy of hydro and bioenergy power plants
      first installed many decades ago. Historically there was a general belief that Queensland
      would capture only a small proportion of the investment stimulated by the national large-

      Green Energy Markets                                                                       9
scale Renewable Energy Target, due to the higher wind speed sites available across other states. However, the outlook has dramatically changed. As illustrated in Figure 2-2, by the end of 2020 the amount of large scale renewable energy projects installed in the state will have grown three and half times above what it was in 2015. Figure 2-2 Queensland large-scale installed renewable energy by 2020 compared to past Note: the installed capacity for 2020 includes projects that have become operational since the beginning of 2016 or are already committed to construction, plus the 400MW of projects that will flow from the Queensland Government’s current reverse-auction tender. Source: Green Energy Markets Power Plant Register Since the beginning of 2016, 2,445MW of renewable energy projects (larger than a megawatt) have either become operational or been committed to construction. As some context Queensland’s entire gas generating capacity is almost 2900MW and the coal fleet is 8,126MW. A regional breakdown on where this capacity is located, as well as the jobs and investment associated with these projects is provided in Table 2-2. These projects have created construction work that will stimulate over 5,600 job-years of employment. A job year represents a person working a 37.5-hour week for a year minus four weeks annual leave plus public holidays. It is estimated they will also provide around 273 ongoing full-time jobs in operating and maintaining these power projects (The geographical boundaries for the regions in the table below are shown in the map in Figure 1-1). On top of this we can also expect a further 400MW of project commitments flowing from the Queensland Government’s tender to award long-term contracts to new plants. Green Energy Markets 10
Table 2-2 Jobs and investment from projects built or under construction post-2015
                                          Construction                    Total project
                               Capacity                   Operational
 Region                                      jobs (job-                    investment
                                  (MW)                    jobs (FTEs)
                                                years)                            ($m)
 Central Queensland                 169             372             18            $255

 Darling Downs - Condamine          765           1,864             78          $1,422

 Far North Queensland               215             541             43            $470

 Mackay-Whitsunday                  498           1,095             50            $746

 South East Queensland               25              55              4              $41

 Townsville - Dry Tropics           569           1,268             57            $879

 Western Queensland                  50             110              5              $75

 Wide-Bay Burnett                   174             383             18            $263

 TOTAL                           2,465            5,687             273        $4,150
Source: Green Energy Markets’ Power Plant Register. For details on how employment estimated
see section 3.4 of this report.
While the capacity being committed to construction has dramatically surged, the amount
of additional capacity being identified and pursued for development managed to
substantially outpace it. Even with about 2,500MW of additional capacity being converted
from development to construction, the amount of renewable energy capacity in the
development pipeline is almost five times larger than what it was in 2015 and now stands
at just under 15,000MW (see Figure 2-3). A project under development can vary in terms
of readiness from simply having a site identified and land-holder consent, to a project that
has obtained all government approvals, a grid connection agreement and is on the verge
of being financed. Within the development pipeline over half the capacity already has
government development approval while another quarter have submitted applications for
approval. However, the vast majority of these projects will only proceed to construction if
there is new government policy to encourage further carbon pollution reductions in the
electricity sector or the closure of existing power plants.

Green Energy Markets                                                                      11
Figure 2-3 Renewable energy projects under development in Queensland in 2015 versus
2018
Sources: 2015 projects and capacity under development taken from Australian Energy Market
Operator, data for 2018 taken from Green Energy Markets’ Power Plant Register. A project under
development can vary in terms of readiness from simply having a site identified and land-holder
consent, to a project that has obtained all government approvals, a grid connection agreement and
is on the verge of being financed.
Table 2-3 provides a regional breakdown (see Figure 1-1 for map of these regions) on
the distribution of the renewable energy capacity under development, as well as the
associated construction and ongoing employment these projects would create if they
were to proceed.
Table 2-3 Jobs and investment from projects currently under development
Construction Operational Total project
Capacity
Region jobs jobs investment
(MW)
(job-years) (FTEs) ($m)
Central Queensland 1,853 4,077 185 $2,780
Darling Downs - Condamine 4,269 9,396 427 $6,411
Far North Queensland 1,553 3,537 184 $2,570
Mackay-Whitsunday 1,896 4,490 190 $3,323
South East Queensland 1,515 3,333 152 $2,273
Townsville - Dry Tropics 2,936 7,282 340 $5,765
Western Queensland 85 187 9 $128
Wide-Bay Burnett 761 1,673 76 $1,141
TOTAL 14,867 33,975 1,562 $24,389
Source: Green Energy Markets’ Power Plant Register. For details on how employment estimated
see section 3.4 of this report.
Green Energy Markets 12Readers should note that we have not included any solar thermal project within the
development pipeline. While a number of companies, including Solar Reserve and CWP
Renewables, are actively investigating development of such projects, no specific sites
have been publicly identified. However, we expect solar thermal development sites will
be announced in the future given this technology is:
• Technically well advanced with field-tested operational performance;
• Has the important advantage of being able to store energy relatively cheaply to
dispatch power on demand independent of weather conditions; and
• the Queensland Government has offered $50m of funding support for solar
thermal.
2.2 Rooftop solar photovoltaics
As shown in Figure 2-4, the uptake of rooftop solar PV systems in Queensland began to
rise significantly since 2010. The cumulative capacity at just over 2,000MW is now
noticeably larger than any individual conventional power station in the state (the biggest
is Gladstone at 1,680MW).
Figure 2-4 Queensland cumulative solar PV rooftop capacity and number of installations
Sources: Number of installations taken from Clean Energy Regulator’s installation data by
postcode. Information as at March 2018.
Queensland has the highest amount of rooftop solar capacity and the highest number of
installations in the country. As shown in Figure 2-5, there are around 550,000 systems
installed in the state, with systems installed on 29% of all residential dwellings in the state
(including flats and apartments). This is exceeded by just South Australia where 30% of
all dwellings have a solar system. These two states have the highest rate of household
solar system ownership in the world.
Green Energy Markets 13Figure 2-5 Number of solar PV systems and proportion of dwellings with solar by state
Sources: Number of installations taken from Clean Energy Regulator’s installation data by postcode
as at March 2018. Percentage of dwellings is derived from combining the installation data with the
Australian Bureau of Statistics 2016 Census data on number of dwellings excluding non-permanent
structures such as caravans but including flats and apartments.
The average capacity residential system in Queensland (3.3kW) would be expected to
deliver an average electricity bill saving of approximately $721 per annum based on a
composite of the 3 major retailers’ cheapest electricity tariffs (Origin Energy,
EnergyAustralia and AGL). The average sized solar system on commercial premises
(32.7kW) would be expected to save approximately $3,104 per annum. The overall state-
wide saving solar-system owners would make on electricity costs is estimated to be $414
million (based on current market tariffs and excluding the extra benefit of premium feed-
in tariffs).
Table 2-4 Estimated annual bill savings per solar system and state-wide
Average
Ave. Annual Statewide
annual bill
Sector system generation annual bill
saving per
size (kW) (MWh) savings
system
Residential 3.3 4,077 $721 $387,091,174
Commercial 23.6 9,396 $3,104 $26,876,461
TOTAL $413,967,635
Sources: Generation of systems based on Clean Energy Regulator estimates for average capacity
factors. Electricity prices for imports and exported feed-in based on an average of the AGL, Origin
and EnergyAustralia lowest post-discounted published offer as at January 2018. Commercial
systems assumed to only save the price of electricity paid under feed-in tariffs. Proportion of
residential system generation self-consumed or exported based on advice from the Alternative
Technology Association.
Figure 2-6 below details the actual number of systems and capacity in place in 2017 and
then Green Energy Market’s projections of the cumulative capacity and systems to be
installed in Queensland over the period to 2020, broken down by residential and
commercial. The number of commercial systems are very small relative to residential and
aren’t visible in the chart below, however in terms of generating capacity, the commercial
segment becomes increasingly significant to 2020.
Green Energy Markets 14Figure 2-6 Projected cumulative rooftop solar capacity and systems to 2020
Source: Green Energy Markets analysis
Our estimates suggest that Queensland is on track to install close to the Queensland
Government’s capacity target of 3,000MW of rooftop solar. However, the number of
systems we estimate will be installed by the end of 2020 - at close to 666,000 - falls short
of the government’s target for 1 million systems. To achieve 1 million systems would
require a five-fold increase in system installation rates over 2019 and 2020 compared to
what we currently expect to occur.
Table 2-5 details our estimates of the expected employment created in the sale, design
and installation of rooftop solar over the corresponding period. Solar installs have surged
in recent times driven by what have been large rises in wholesale electricity prices and
considerable media and political attention on electricity prices. Consequently, we believe
employment over 2018 will rise above 2017 levels to peak at approximately 1452 full time
equivalents.
Table 2-5 Estimated employment in sales, design and installation of rooftop solar in QLD
Period Jobs (FTEs)
2017 1,209
2018 1,452
2019 1,105
2020 1,118
Source: Green Energy Markets Analysis
However, wholesale prices have begun to fall over the last 12 months and are expected
to continue to fall due to the large influx of additional renewable energy capacity
completing construction over the next year, not just in Queensland but across the National
Electricity Market (NEM). This should ultimately flow through to end consumers’ bills in
the next few months and reduce the incentive and motivation for consumers to install
solar. Solar will still provide an attractive financial return for many consumers, but the
decline in retail power prices will mean the amount of systems and capacity installed in
2019 and 2020 will be lower than 2018 and employment will fall slightly to around 1,100
full-time equivalents.
Figure 2-7 illustrates the Australian Energy Market Operator’s (AEMO) forecast of the
amount of electricity Queensland will produce from rooftop solar systems to 2030. Our
own analysis indicates they have probably underestimated growth in solar capacity over
the next 3 years, but over the longer-term their forecast does not appear to be
Green Energy Markets 15unreasonable. They forecast that Queensland rooftop solar will provide 6,000 gigawatt-
hours of electricity in 2030 which would represent almost 11% of Queensland electricity
consumption that year.
Figure 2-7 AEMO projected rooftop solar power generation and share to 2030
Source: Australian Energy Market Operator National Electricity Forecasting Report – March 2018.
Proportion of total QLD electricity consumption based on AEMO’s “native” electricity consumption.
2.3 Batteries-Energy Storage
At this stage battery technology has only been deployed in small numbers. Although, as
illustrated in Figure 2-8 given the trajectory of substantial cost reductions of lithium-ion
batteries, they are expected to become an increasingly competitive option within the next
decade.
Figure 2-8 Average price of lithium-ion battery pack per kWh of storage 2010-2017
Note: these are wholesale prices for battery packs for electric vehicles offered to car companies
buying in bulk. They do represent the retail price of a fully installed residential battery system.
So far in Queensland there are just two examples of utility-scale battery deployments built
in conjunction with renewable energy plants. Both of them were supported through
funding from the Australian Renewable Energy Agency (ARENA).
The Lakeland solar project near Cooktown includes a battery system that allows this solar
power station to reinforce the network to improve power system reliability and quality at
Green Energy Markets 16this remote fringe of the national grid. This includes the ability to provide power to the
local area in the event it is disconnected from the main electricity system.
The other utility-scale battery is under construction as a sub-component of stage 1 of the
Kennedy Wind and Solar Energy Park near Hughenden. As shown in Figure 2-9 the
Kennedy Energy Park is characterised by wind patterns that tend to rise late in the
evening and stay high overnight before subsiding over the day. Meanwhile the solar farm
delivers power over daylight periods. Given this natural weather pattern, the battery only
needs to provide a short period of storage that helps bridge the dip in output over the
hours of 17:00 to 20:00 (5pm to 8pm).
Figure 2-9 Average daily pattern of output from Kennedy wind turbines and solar farm
Source: Windlab (2018) Kennedy Energy Park Knowledge Sharing Report (Financial Close).
While batteries haven’t yet dropped enough in cost to represent a viable commercial
option, most renewable energy projects recently proposed for development in
Queensland include plans that provide for the future incorporation of a battery system.
Batteries also provide the potential to offset the substantial cost involved in building and
maintaining electricity network infrastructure, particularly for residential homes. This
may represent the most viable option initially for the use of batteries. Their viability is
also assisted by the fact some households see batteries not just as a financial
investment, but also one that provides peace of mind and other non-financial benefits.
At this stage data on deployment of batteries in smaller scale residential and business
premises in Queensland is poor. Feedback from solar installers and battery suppliers is
that uptake to date is at a small scale of a few thousand systems per year in
Queensland.
It is important to note that we don’t need to wait until batteries drop further in cost before
deploying further renewable energy. The Australian body representing scientific and
engineering researchers – The Australian Council of Learned Academies – released a
report in 2017 which found that even with renewable energy representing 50% of
electricity supply, the amount of energy storage required to ensure reliability and
security of supply was relatively small (see Figure 2-10)1. By the time Australia might be
expected to reach 75% renewables share – it’s reasonably likely batteries will have
achieved substantial cost reductions that allow it to be affordably deployed at large
scale. In addition, pumped hydro and solar thermal can provide large-scale energy
storage at costs cheaper than batteries at present.
1
Godfrey, B., Dowling, R., Forsyth, M., Grafton, R.Q. and Wyld, I., (2017) The Role of Energy Storage
in Australia’s Future Energy Supply Mix. Report for the Australian Council of Learned Academies.,
www.acola.org.au
Green Energy Markets 17Figure 2-10 Amount of energy storage required to ensure reliability and security at high
levels of renewable energy share of supply
Source: Godfrey, B., Dowling, R., Forsyth, M., Grafton, R.Q. and Wyld, I., (2017) The Role of
Energy Storage in Australia’s Future Energy Supply Mix. Report for the Australian Council of
Learned Academies., www.acola.org.au.
The other major development of interest in batteries is the proposal to establish a
battery manufacturing facility in Townsville. The Imperium3 consortium, which includes
a battery technology company called Boston Energy and industrial equipment
manufacturer Siemens, is proposing a 15-gigawatt-hour per annum production plant
plus space for associated component manufacturers to set up nearby. According to the
consortium the facility would create up to 1000 direct jobs, plus an additional 1000 jobs
in direct support businesses. In April 2017 the Townsville City Council signed a
memorandum of understanding with Boston Energy to investigate the financial viability
of the project and has offered land at the former CSIRO Lansdown research station at
Woodstock. In addition, the Queensland Government committed $3.1 million towards a
feasibility study for a battery factory in Townsville.
2.4 The renewable energy resource
Solar
Figure 2-11 provides a map illustrating the intensity of solar radiation and therefore energy
hitting the surface across the states in the National Electricity Market. As you’d expect
the further north you go generally the higher the amount of solar energy available (darker
red colour). In addition the further you head away from the coast the higher the amount
of solar energy because there are less cloudy and rainy average conditions.
Green Energy Markets 18Figure 2-11 Intensity of solar radiation across the NEM states (red is higher, blue is lower) Source: Australian Energy Market Operator (2017) Integrated System Plan Consultation Green Energy Markets 19
Given Queensland’s northern orientation it naturally possesses a higher quality resource
than the other states within the NEM. This has been one of the primary reasons it has
attracted the vast majority of investment in solar farms so far across Australia. It has also
been a key factor in making rooftop solar PV financially attractive to both householders
and businesses to install. And it has made the state attractive to develop new solar farms.
What is worth noting is that Queensland’s high quality renewable energy resource
provides a major competitive advantage not just relative to other states in the NEM but
far more significantly in comparison with other countries. In practical terms this higher
intensity of solar energy means that for a given financial investment in solar modules,
Queensland sites will tend deliver more electricity generation over the year.
As illustrated in Figure 2-12, solar farms that spread across a wide area of Queensland
from Gatton Solar Farm in the south-east, to Kidston Energy Hub inland from Townsville,
and Longreach Solar Farm in the west, achieve levels of electricity output that are far
superior to the 2017 international solar farm average per unit of solar panel capacity
installed.
Figure 2-12 Capacity factors of solar farms across Queensland compared to the international
average of 2017 installations

Note: Capacity factors are a function of the annual AC electricity output divided by the
rated DC panel capacity of the solar farm operating at full capacity over an entire year.
Electricity output is prior to the effect of transmission losses.
Sources: International average capacity factor sourced from IRENA (2018) Renewable
power generation costs in 2017; Green Energy Markets Power Plant Register for
Australian solar farms.
Even though Gatton Solar Farm is within the green zone of the solar radiation map it
generates 23% more electricity per kilowatt or solar panel capacity than the international
average. Oakey Solar Farm within the Darling Downs-Condamine region generates 30%
more, Hamilton Solar Farm in Mackay-Whitsunday region generates 35% more,
Longreach Solar Farm in western Queensland generates 45% more and the solar
component of the Kidston Energy Hub will generate 49% more power than the
international average.

Green Energy Markets                                                                      20
Wind
Figure 2-14 overleaf provides a map illustrating the distribution of the wind resource
across the NEM states with red areas indicating area subject to high average wind speeds
and blue to purple indicating low wind speed areas, with green lying in between.
Historically wind farm development and investment in Australia has mainly been focussed
on: the yellow to red band near the Flinders Ranges fringing around Adelaide and to its
north; the yellow and red area to the west of Melbourne; and the yellow and red band
along the Great Dividing Range between Sydney and Canberra.
However, in the last two years Queensland has also attracted some significant wind farm
investment and developer interest. This was exemplified in August 2017 by the decision
of AGL to commit to construction Coopers Gap, Australia’s largest ever wind farm at the
time at 453MW. The other two major wind farm investments in Queensland have been
Mount Emerald and phase 1 of the Kennedy Wind Farm development – both of which are
located in the red and yellow zone that lies to the west of Cairns and Townsville in the
north of the state.
Figure 2-13 illustrates that these three wind farms committed to construction in the last
two years will achieve levels of output per unit of installed capacity that substantially
exceed the international average of wind farms installed in 2017 as tracked by the
International Renewable Energy Agency.
Figure 2-13 Capacity factors of Queensland committed wind farms compared to the
international average of 2017 installations

Note: Capacity factor is a measure of annual average electricity generation compared to the
output of a power station if it operated at its maximum rated capacity across the entire year. In
other words it is a measure of the utilisation of a power plant’s total installed capacity. Chart
above is based on estimated generation prior to the effect of transmission losses.
Sources: International average capacity factor sourced from IRENA (2018) Renewable power
generation costs in 2017; Green Energy Markets Power Plant Register for Australian wind farms.
Mount Emerald Wind Farm, in the Far North Region near Cairns is expected to
generate 20% more power than the international average, Coopers Gap Wind Farm
31% more and the wind turbines at the Kennedy Energy Park will generate 54% more.

Green Energy Markets                                                                           21
Figure 2-14 Average wind speeds across the NEM states
(red is higher, blue is lower)

Source: Australian Energy Market Operator (2017) Integrated System Plan Consultation

Green Energy Markets                                                                   22
What makes the exceptional international performance of the Kennedy Energy Park’s
stage 1 wind farm of particular interest is that is part of a far larger wind farm
development site of 1,200MW. As explained in section 2.5 of this report on
transmission infrastructure, this energy park mega development (which is also planned
to incorporate a very large solar farm), can only be unlocked with substantial upgrades
to transmission line capacity.
While it is only recently that Queensland has seen noticeable investment in wind farms,
the state has two major advantages that add to its attractiveness for wind farm
investment over other states.
The first is that developers of wind farms are now also looking to maximise the value of
their grid connection infrastructure by adding solar capacity. This means the financial
attractiveness of wind farm projects are now influenced by the quality of the solar
resource nearby to the grid connection. Queensland’s superior solar resource provides
an important advantage in this respect.
The second is that Queensland’s wind conditions are driven by different weather
systems than those driving the power output of wind farms in southern states. Put
simply, the wind in Queensland will often blow at high levels at different times than the
wind in South Australia, Victoria and NSW. This improves the financial attractiveness of
wind farm development in Queensland because it means they will producel electricity at
different times and are less likely to have to compete against the now quite substantial
wind farm capacity installed in southern states. Figure 2-15 illustrates that as wind
farms are distanced further apart the likelihood of them having similar levels of output at
the same time (per unit of capacity) declines.
Figure 2-15 Correlation of 2015/16 power output across wind farms in NEM relative to
distance apart

Source: Transgrid NSW (2018) Integrated System Plan Submission. The correlation coefficient is
a measure of the likelihood that two wind farms will have the same level of output at the same
time.
With several thousand megawatts of wind farm capacity operating or under construction
across Victoria and South Australia, they have the potential to have a very significant
impact in lowering prices when subject to windy conditions. This is the case not just in
their own state, but also other states around the NEM because they will export power
interstate. Because these two states’ wind farms are relatively close to one another they
tend to have high levels of output at the same time and so receive lower power prices.
Because Queensland wind farms are less likely to be generating at the same levels as
Victorian and South Australian wind farms simultaneously, they will therefore be more
likely to avoid these high wind-low power price events.

Green Energy Markets                                                                        23
This has an important benefit for consumers in that as wind farm capacity expands in
     Queensland, overall output across all wind farms in the NEM will become more steady.
     If transmission capacity interconnection across the states is expanded it will mean
     overall power across all wind farms is similar to a baseload coal generator, but without
     the pollution.
     Hydro
     The existing Burdekin Dam is being evaluated for the addition of a 50MW hydro power
     plant however, like much of the rest of Australia, Queensland is not considered to have
     significant potential for expansion of conventional large hydro-electric dams. This is due
     to concerns over downstream effects on water systems and soil salinity from irrigation,
     reliability of rainfall, loss of natural habitat and economic feasibility.
     However, what is considered feasible is the addition of smaller pumped hydro facilities
     which act much like a battery.
     Such facilities involve a closed loop water system with two water storage reservoirs.
     Water from a reservoir located at the bottom of a hilly/mountainous area is pumped up to
     a reservoir higher up. This pumping up of the water would occur at a time when supply
     of power was plentiful and cheap, which in the future might be during sunny or windy
     periods. Then when power was less plentiful or demand was high, the water would be
     released downhill to drive a hydro generator to produce electricity. Because such a
     system reuses water over and over again, it shouldn’t adversely affect riverine eco-
     systems, or downstream farming activities, and is less vulnerable to droughts.
     Australian National University has mapped the states of the National Electricity Market to
     identify sites that would be suitable for pumped hydro facilities. These involve a large
     height difference over a short distance (mountainous areas) and are located outside of
     ecologically sensitive areas such as national parks or can make use of existing water
     storages that don’t currently have a pumped system in place. Figure 2-16 shows in the
     red dots sites they identified as suitable for pumped hydro plants. This includes a very
     large number of sites around the east coast of Queensland that are reasonably proximate
     to grid infrastructure. According to the lead researcher Professor Andrew Blakers, this
     analysis indicates that, “Australia has so many good sites for PHES [pumped-hydro
     energy storage] that only the best 0.1% of them will be needed [to accommodate a power
     system of 100% renewable energy].”2
     The Queensland Government’s Powering Queensland Plan 3 includes a feasibility study
     to assess options for the deployment of new hydro-electric and pumped storage
     generation capacity in the state, but the report is yet to be released.

2Blakers (2017) There are 22,000 possible sites for pumped hydro storage across Australia, ARENA
Wire - https://arena.gov.au/blog/andrew-blakers/

3
  Powering North Queensland Plan -
https://www.dnrme.qld.gov.au/__data/assets/pdf_file/0003/1253541/Fact-sheet-Powering-North-
Queensland-Plan.pdf

     Green Energy Markets                                                                     24
Figure 2-16 Prospective suitable sites for pumped hydro facilities (red dots) Source: Australian National University College of Engineering and Computer Sciences (2017) Atlas of Pumped Hydro Sites - http://re100.eng.anu.edu.au/research/phes/ Green Energy Markets 25
2.5 Transmission
Queensland’s transmission business Powerlink recently assessed the amount of
generating capacity it believes could be supported at various sections of its network, as
shown in the map at Figure 2-17 Table 2-6 converts this into numerical form to provide
a quantification of the total amount of renewable energy capacity that could be
supported across different sections or sites within the transmission network.
Table 2-6 Number of transmission sites that can support different levels of new generating
capacity
Non-Synchronous
Number of
Supportable Capacity Total MW
sites
(MW)
50-100 18 1,350
100-150 13 1,625
150-200 6 1,050
200-250 3 675
250-300 3 825
300-350 4 1,300
350-400 3 1,125
400+ 8 3,200
Note: This tally is not comprehensive because it leaves out the high voltage 275 and 330kV
substations which Powerlink believes will generally accommodate generation levels in excess of
400MW as well. Wind and solar farms use power conversion technology that is “non-
synchronous”.
The table and map suggest there is room to support substantial additional renewable
energy capacity in the network. However, it is important to note that determining how
much new power generation can be feasibly and economically connected to the network
is complex and there are interaction effects that can come into play.
As detailed earlier in Table 2-3 the pool of projects that developers are seeking to
pursue in Queensland is very large at close to 15,000MW. This comes on top of the
almost 3,600MW already operational or under construction plus the 2,000MW and
growing rooftop solar. To put this into context the current average annual electricity
demand of Queensland is 6,050MW and peak demand has historically fallen below
9,000MW.
While the more than 20,000MW of combined renewable energy capacity would never
come close to generating at maximum capacity all at the same time, this large
imbalance between what is proposed and overall demand is suggestive of notable
physical constraints for many projects within the development pipeline. Expansion of
network capacity both within Queensland and better interconnection across the overall
NEM will assist in effectively harnessing the available wind and solar resources and
smooth out variability.
For a number of locations within Queensland it is already evident that network capacity
would need to be upgraded to enable further projects currently in development to
proceed. It is important to note that since Powerlink’s assessment was prepared, a
number of projects have already been connected that reduce the remaining capacity
that can be absorbed without curtailment. While there remains available capacity on the
main transmission trunk there is also an issue of increasing transmission losses.
Transmission lines lose some of the electricity they transport as heat, with losses
tending to be greater the longer the distance from the generator to the electricity load
and the closer the line is to its capacity limits.
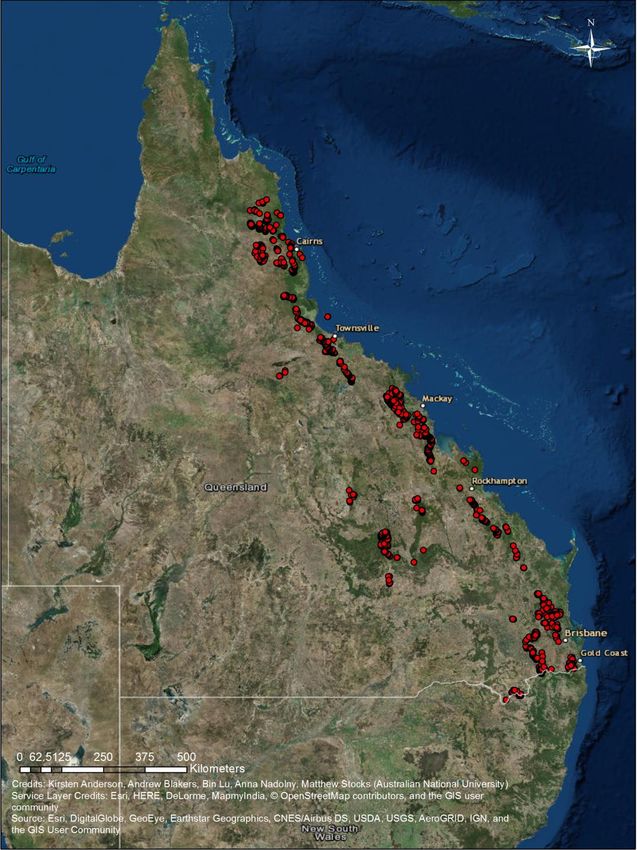
Green Energy Markets 26Figure 2-17 Powerlink assessment of the generation capacity that can be absorbed on the QLD transmission system excluding 275kV and 330kV substations Source: Powerlink (2017) Generation Capacity Guide – June 2017 Green Energy Markets 27
Table 2-7 provides five examples of solar farms recently completed in Queensland that
    have incurred large downgrades in the transmission loss factor applying to their output
    compared to the prior year. The loss factor is the proportion of the power plants’ output
    that AEMO believes will be left over for end consumers after transmission losses. In the
    case of Clare Solar Farm close to 13% of its output is expected to be lost via
    transmission. For all the others, more than 10% of generation will be lost.
    Table 2-7 Recently completed solar farms with large downgrades to loss factors
                                                 New
                                                          Old loss         %
     Project                  Region             loss
                                                           factor    change
                                                factor

     Barcaldine               Western QLD           0.8934      0.9689        -7.8%

                             Townsville-Dry
     Clare                                          0.8727      0.9823       -11.2%
                                Tropics
                             Townsville-Dry
     Hughenden                                      0.8979      1.0115       -11.2%
                                Tropics
                             Townsville-Dry
     Kidston                                        0.8979      1.0115       -11.2%
                                Tropics

     Longreach                Western QLD           0.8934      0.9689        -7.8%

    Note: Loss factors greater than one are possible because in some cases a generator – if not too
    big – located in an area distant from other generation sources will actually reduce the level of
    transmission losses involved in serving the nearby electricity load.
    Source: Australian Energy Market Operator.
    Such levels of transmission losses aren’t necessarily a show-stopper for the viability of
    these projects. But they indicate that if any further projects sought to connect nearby,
    they would see losses increase to very high levels. These act to nullify any advantage
    from the high quality solar resource available in the area and would likely be of such a
    high level that they would make further projects unviable.
    In addition to challenges over losses, there are projects or collections of projects within
    a resource rich region where the size of projects proposed are an order of magnitude
    greater than the available grid capacity.
    A prime example lies in a region inland in between Cairns and Townsville and above
    Hughenden. The wind resource map in Figure 2-14 and solar resource map in Figure
    2-11 illustrate it is characterised by areas of red indicating both high intensity wind and
    solar resources. The region has two projects already connected or about to be
    connected to the network – the 50MW Kidston Phase 1 Solar Farm and phase 1 of the
    Kennedy hybrid wind-solar park (combined 58.2MW). The high capacity factor of
    Kidston’s solar farm (see Figure 2-12) and Kennedy’s wind farm (see Figure 2-13)
    provide a practical demonstration of the world class nature of the renewable resources
    in this area.
    However, both these projects have vastly larger amounts of capacity identified for future
    development. Kidston’s phase 2 involves a 250MW pumped hydro plant as well as a
    270MW solar farm. In addition, a 150MW wind farm is also being evaluated. Phase 2 of
    Kennedy involves a hybrid wind and solar park of 1,200MW. In addition another wind
    farm in the region– Forsayth – is under development.
    These projects are distant from the main transmission backbone illustrated in Figure
    2-17. For the far larger potential of these projects to be exploited, as well as other
    projects in the Far North, significant upgrades to transmission infrastructure will be
    required. Powerlink is undertaking the ‘Genex Kidston Connection Project’4 to plan a

4
  Genex Kidston Connection Project see: https://www.powerlink.com.au/projects/genex-kidston-
connection-project

    Green Energy Markets                                                                           28
You can also read