Upper North Island Supply Chain Strategy - Sapere Research ...
←
→
Page content transcription
If your browser does not render page correctly, please read the page content below
Disclaimer- This report was prepared for Sapere Research Group, to
inform their work on the Upper North Island Supply Chain Strategy.

It does not represent the views of the Ministry of Transport.

     Upper North Island Supply Chain Strategy

     Infrastructure

     Gary Blick and David Moore
     30 June 2020
Contents
Glossary of Abbreviations ......................................................................................................................................................... 4

Executive summary ...................................................................................................................................................................... 5

1.      Purpose and scope............................................................................................................................................................. 8

                 1.1         Purpose of this report ................................................................................................................................ 8
                 1.2         Scope of this report .................................................................................................................................... 8

2.      Approach ............................................................................................................................................................................... 9

                 2.1         Steps in the analysis ................................................................................................................................... 9
                 2.2         Period of analysis ......................................................................................................................................... 9
                 2.3         Building on prior studies .......................................................................................................................... 9
                 2.4         The base case ................................................................................................................................................ 9
                 2.5         Options and sites .......................................................................................................................................10
                 2.6         Responsibilities ...........................................................................................................................................10

3.      Outlook for freight growth and vessel size ............................................................................................................11

                 3.1         Forecasting growth in container freight ...........................................................................................11
                 3.2         Sizing the future freight task.................................................................................................................13
                 3.3         The container forecast is the most critical .......................................................................................14
                 3.4         Outlook for larger container vessels ..................................................................................................15
                 3.5         Implications for POAL ..............................................................................................................................15

4.      Port infrastructure requirements ................................................................................................................................16

                 4.1         Approach ......................................................................................................................................................16
                 4.2         Ports of Auckland – the base case ......................................................................................................17
                 4.3         Northport option .......................................................................................................................................22
                 4.4         Port of Tauranga option .........................................................................................................................25
                 4.5         Northport and Port of Tauranga option ...........................................................................................30
                 4.6         Firth of Thames option ............................................................................................................................33
                 4.7         Manukau Harbour option ......................................................................................................................35
                 4.8         Summary of port infrastructure costs ................................................................................................38

5.      Rail infrastructure requirements .................................................................................................................................39

                 5.1         Method ..........................................................................................................................................................39
                 5.2         Base case .......................................................................................................................................................40
                 5.3         Northport option .......................................................................................................................................41
                 5.4         Port of Tauranga option .........................................................................................................................43
                 5.5         Firth of Thames option ............................................................................................................................44
                 5.6         Manukau Harbour option ......................................................................................................................45
                 5.7         Summary of rail infrastructure costs ..................................................................................................46

6.      Road infrastructure requirements ..............................................................................................................................47

1                                                                                                                                           © 2020 Sapere Research Group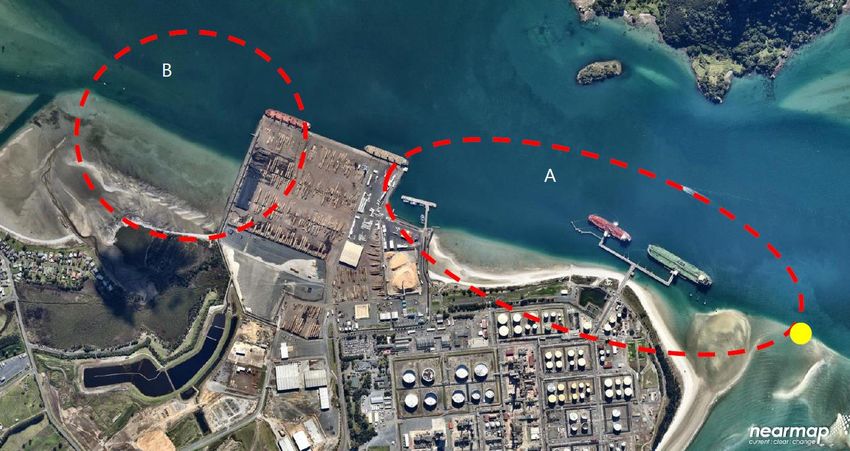
6.1         Method ..........................................................................................................................................................47
                6.2         Traffic modelling under redevelopment scenarios ......................................................................48
                6.3         Road infrastructure required for existing ports .............................................................................50
                6.4         Road connections required for new ports .......................................................................................52
                6.5         Summary of road infrastructure costs ...............................................................................................53

7.     Conclusions .........................................................................................................................................................................54

Appendix A:                 Port capacity plots .....................................................................................................................................56

Tables
Table 1 Technical inputs from expert contributors .......................................................................................................10
Table 2 Container freight forecasts for Ports of Auckland – compounding annual growth rates .............12
Table 3 Container freight forecasts for Ports of Auckland – size of future freight task .................................13
Table 4 Bulk freight forecasts for Ports of Auckland – size of future freight task ............................................13
Table 5 Vehicle import forecasts for Ports of Auckland – size of future freight task ......................................13
Table 6 Cost estimates of port infrastructure requirements .....................................................................................38
Table 7 Cost estimates of rail infrastructure for Northport .......................................................................................42
Table 8 Cost estimates of rail infrastructure for Port of Tauranga .........................................................................43
Table 9 Cost estimates of rail infrastructure for Firth of Thames ............................................................................44
Table 10 Cost estimates of rail infrastructure for Manukau Harbour ....................................................................45
Table 11 Cost estimates of rail infrastructure requirements .....................................................................................46
Table 12 Number of trucks per day forecast in 2053...................................................................................................47
Table 13 Waterfront redevelopment land use assumptions .....................................................................................48
Table 14 Average Travel Speeds in the Auckland CBD, 2036 (km per hour) ......................................................49
Table 15 Cost estimates for road infrastructure for the Northport option .........................................................50
Table 16 Cost estimates for road infrastructure for the Port of Tauranga option ...........................................51
Table 17 Cost estimates for road connections to new ports ....................................................................................52
Table 18 Cost estimates of road infrastructure requirements ..................................................................................53
Table 19 Summary of infrastructure costs by option (real, 2019, $b) ...................................................................54
Table 20 Summary of landside infrastructure projects................................................................................................55

2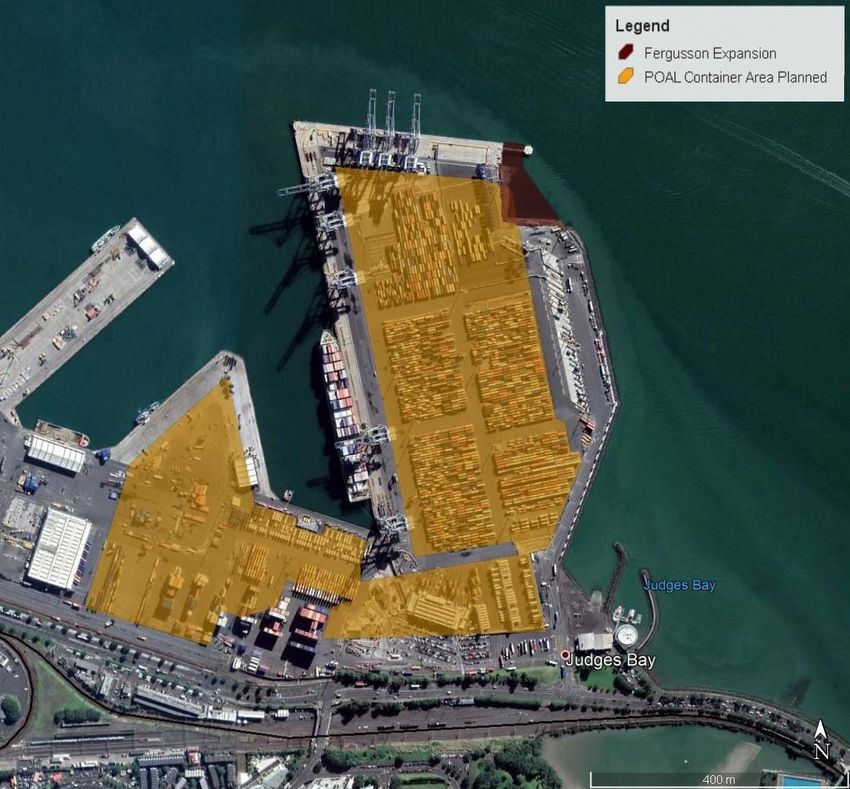
Figures
Figure 1 Container freight forecast scenarios for Ports of Auckland – comparison of trend growth ......12
Figure 2 Ports of Auckland plan for expanded container terminal operations .................................................17
Figure 3 Freight forecasts with estimates of Ports of Auckland operating capacity .......................................18
Figure 4 A concept for required container terminal area, assuming unconstrained expansion to 2079 20
Figure 5 Cost estimate of port infrastructure for the base case ..............................................................................21
Figure 6 Northport areas considered for potential expansion .................................................................................22
Figure 7 Northport expansion – concept layout for forecast freight task, 2079 ...............................................23
Figure 8 Cost estimate of port infrastructure for the Northport option ..............................................................24
Figure 9: Port of Tauranga areas considered for potential expansion ..................................................................25
Figure 10 Port of Tauranga expansion – concept layout for forecast freight task, 2079 ...............................27
Figure 11 Cost estimate of port infrastructure for Port of Tauranga option (total development cost) ...28
Figure 12 Cost estimate of port infrastructure for the Port of Tauranga option ..............................................29
Figure 13 Northport expansion under split option – concept layout for forecast freight task, 2079.......31
Figure 14 Port of Tauranga expansion under split option – concept layout for forecast freight task,
2079 .................................................................................................................................................................................................32
Figure 15 A new port on the Firth of Thames – potential sites (concept only) .................................................33
Figure 16 Cost estimate for a new port on the Firth of Thames..............................................................................34
Figure 17 A new port on Manukau Harbour – potential sites (concept only) ....................................................35
Figure 18 Cost estimate for a new port on the Manukau Harbour ........................................................................37
Figure 19 Representation of North Auckland Line (Auckland section) and additional lines ........................42
Figure 20 Movements from POAL site in passenger car units, 2048 .....................................................................49
Figure 21 Summary of infrastructure costs by option .................................................................................................54
Figure 22 Capacity plot for Northport expansion option ...........................................................................................56
Figure 23 Capacity plot for Northport expansion option – additional expansion to the east and west .56
Figure 24 Capacity plot for Port of Tauranga expansion option .............................................................................57
Figure 25 Capacity plot for Northport – shared expansion option ........................................................................57
Figure 26 Capacity plot for Port of Tauranga – shared expansion option ..........................................................58

                                                                                                                                                                                                      3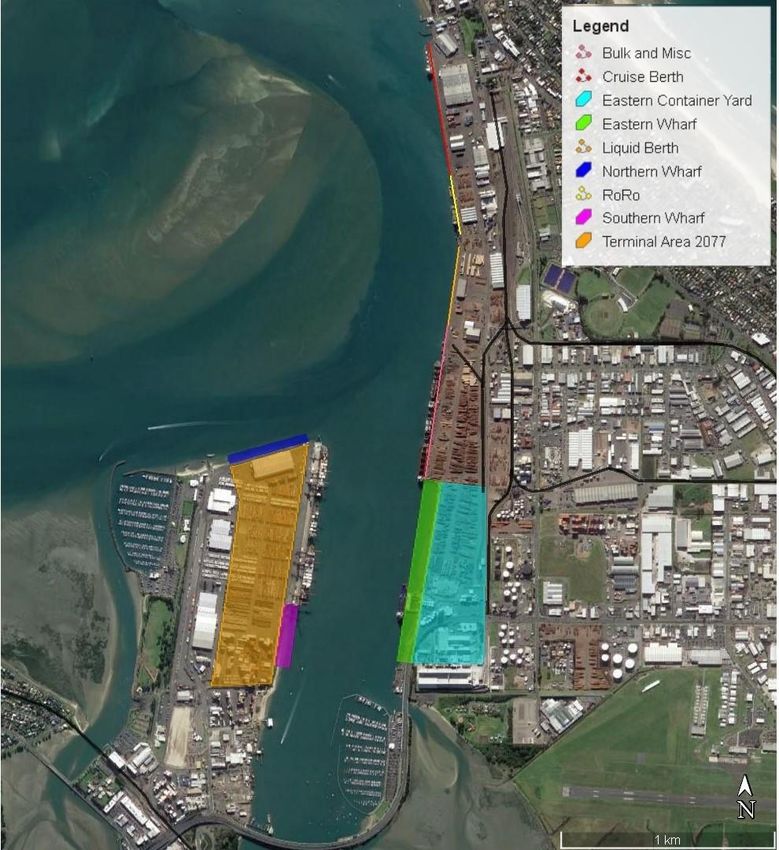
Glossary of Abbreviations
Abbreviation   Stands for

AC             Auckland Council

AT             Auckland Transport

AUP            Auckland Unitary Plan

BOPRC          Bay of Plenty Regional Council

CBA            Cost Benefit Analysis

GDP            Gross Domestic Product

MACA           Marine and Coastal Area (Takutai Moana) Act

MBIE           Ministry of Business, Innovation and Employment

MMH            Marsden Maritime Holdings Limited

MoT            Ministry of Transport (New Zealand)

NRC            Northland Regional Council

NZTA           New Zealand Transport Agency

POAL           Ports of Auckland Limited

PoT            Port of Tauranga Limited

RMA            Resource Management Act 1991

TEU            Twenty-foot Equivalent Unit

UNISCS         Upper North Island Supply Chain Strategy

4
Executive summary
This report accompanies the integrative report that summarises the findings of a collective of
consultants led by Sapere Research Group (Sapere) in relation to the Upper North Island Supply Chain
and the options for a full move of the freight operations of the Ports of Auckland Ltd (POAL). This
study has been directed to consider five options for the relocation of the POAL freight task:

    •    Northport expansion
    •    Port of Tauranga expansion
    •    a shared increase in capacity at both Northport and Port of Tauranga
    •    a new port on the Firth of Thames, and
    •    a new port on the Manukau Harbour.

This report documents the work within the infrastructure workstream, with respect to matters of
capacity and cost for port, rail and road infrastructure for each option. Sapere, as the lead consultancy,
has been responsible for commissioning advice from technical experts, obtaining the necessary inputs,
interpreting the findings, and preparing a set of infrastructure cost schedules and this report.

The period of analysis is 60 years, in line with that selected for the cost benefit analysis. This timeframe
is appropriate given the long lived nature of the infrastructure assets being considered. The resulting
set of infrastructure cost schedules are inputs into the cost benefit analysis workstream.

Forecasts of freight growth relate to the base case, in which POAL is assumed to be able to expand on
the Waitematā Harbour to handle growth for 60 years. Containerised freight, comprising imports and
exports, is of primary focus given volumes involved, land area needed, and the growth outlook. The
forecasts were prepared for the period from 2018 to 2079, with a focus on two forecasts scenarios.

    •    Medium growth – a compounding annual rate of growth of 2.26 per cent. This is referred to
         as the calibrated forecast.
    •    Low growth – a compounding annual rate of growth of 0.75 per cent. This is referred to as
         the officials’ agreed forecast.

Port infrastructure capacity requirements

Two sets of port consultants were commissioned to assess and advise on long-term port capacity and
infrastructure costs: Advisian (marine and coastal engineers) and Black Quay (strategic and operational
port planners). Their estimates of capacity, concept layouts and costings take into account the forecast
freight task, existing infrastructure, scope for expansion and potential environmental constraints.

With respect to POAL, the findings are that the freight operations are constrained on several fronts,
including container terminal capacity and the berths and channel access needed to accommodate
larger container vessels. Plans to address these constraints rely on resource consents being obtained.
Assuming the consents can be obtained, the container terminal may have capacity for around 30 years
under the calibrated forecast for freight growth. After that, a substantial amount of land reclamation
would be necessary. For comparative purposes, the base case assumes that POAL would be able to
remain and expand on the Waitematā Harbour to accommodate the increasing volume of freight over
60 years, while acknowledging that POAL has a 30-year plan in place only.

                                                                                                           5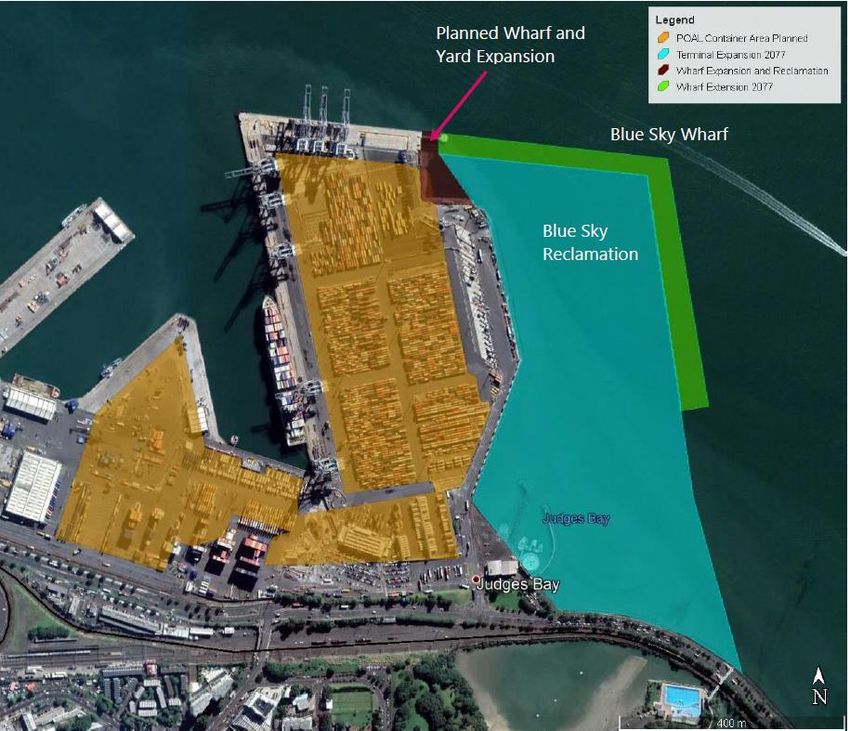
With respect to existing port options, there would be insufficient capacity at either Northport or the
Port of Tauranga to absorb all of the long-term freight task from POAL. Under the option of a shared
increase in capacity, Northport and Port of Tauranga could accommodate the freight task at 60 years,
at which point these ports would likely be at, or near, full capacity with little or no room to expand. It
is possible that fewer containers could be handled at Northport, to create some room for growth, but
those containers would instead need to be handled at the Port of Tauranga, which would also be
approaching its practical limit. The new port options, on the Firth of Thames or the Manukau Harbour,
would have sufficient capacity for the long term, to 60 years and well beyond. The concept design is
for an island port, near to shore, that allows for capacity to be built in stages, expanding as needed.

The capacity conclusions from this work are detailed in the integrative report.

Landside infrastructure capacity requirements

The table below summarises the road and rail infrastructure requirements identified for each option.

Summary of landside infrastructure requirements

    Option             Road infrastructure                          Rail infrastructure

    Northport          •   Additional works along SH1 between       •   Capacity additions on the North
                           SH15 and Te Hana are likely to be            Auckland Line (rail loops).
                           required, with safety improvements.      •   Construction of:
                       •   Corridor widening and rerouting at the       -   the Marsden Point spur
                           Brynderwyn Hills would be needed
                                                                        -   a third main line from Swanson to
                           and is assumed to be brought forward.
                                                                            Avondale,
                       •   SH1 Warkworth to Wellsford project is
                                                                        -   a new line from Avondale to
                           assumed to be brought forward.
                                                                            Southdown.

    Port of Tauranga   •   Additional works on SH1/ SH29 from       •   Capacity additions (rail loops) on:
                           south of Cambridge to Tauriko are            -   the East Coast Main Trunk
                           likely to be necessary and are treated
                                                                        -   the North Island Main Trunk
                           as being brought forward.
                                                                            (Whangamarino).
                       •   Additional works at the SH2/Dive
                                                                    •   Construction of a fourth main line
                           Crescent interchange, adjacent to the
                                                                        from Westfield to Pukekohe.
                           Port operations at Sulphur Point.

    Northport and      •   Additional works assumed to still be     •   Capacity additions scaled back to
    Port of Tauranga       brought forward for traffic increases.       match each port’s share of freight task.

    Firth of Thames    •   A new roading link from Mill Road to     •   Construction of a new line to a new
                           the Firth of Thames site will be             port on the Firth of Thames,
                           required, with a bypass of Clevedon.         connecting from the North Island
                           An improved connection from Mill             Main Trunk.
                           Road to the Southern Motorway is
                           also likely to be necessary.

    Manukau Harbour    •   A new arterial standard roading link     •   Construction of a new line to a new
                           from Roscommon Road/Wiri Station             port on the Manukau Harbour,
                           Road is assumed to be required. An           connecting from the North Island
                           improved connection to SH20, in the          Main Trunk.
                           form of an upgraded interchange at
                           Lambie Drive.

6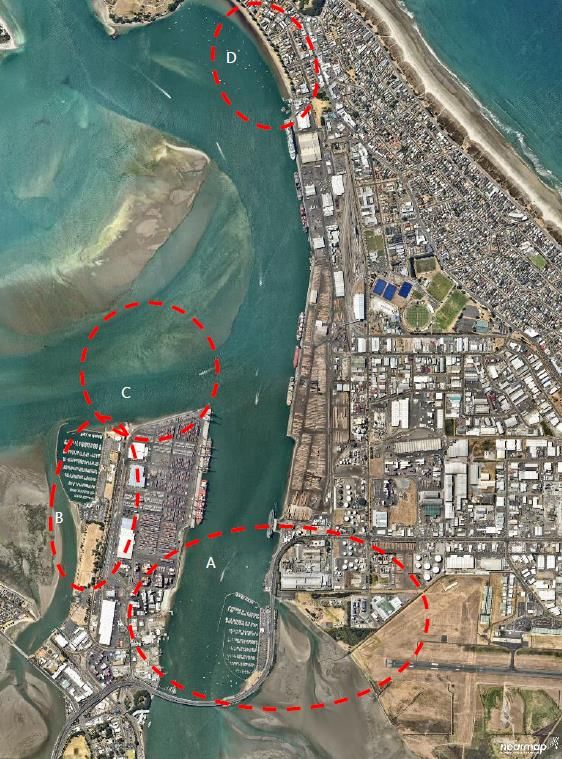
Summary of infrastructure cost estimates

Cost schedules for port, rail and road infrastructure for each option were prepared as an input into the
cost benefit analysis. The figures are in 2019 dollars on a non-discounted basis.

The charts and table below summarise the cost estimates for each option, split out by port, rail and
road infrastructure. The road costs for existing ports are largely treated as being brought forward,
under the assumption they would otherwise occur later in the period of analysis. The figures on the
left are for the calibrated freight forecast and those on the right are for the officials’ agreed forecast.

Summary of infrastructure costs by option

 $ billion (real, 2019)
   20
               Calibrated freight forecast                                        Officials’ agreed forecast
   18
   16
   14
   12
   10
    8
    6
    4
    2
    0

                                             port          rail    road

Source: Sapere

Summary of infrastructure costs by option (real, 2019, $b)

 Option                                Calibrated freight forecast                          Officials’ agreed forecast

                                   Port             Rail          Road    Total     Port         Rail      Road      Total

 Port of Tauranga                    2.6             2.0           1.5      6.2       1.3          0.5         1.5        3.3

 Manukau Harbour                     6.5             2.0           2.8    11.3        5.1          2.0         2.8        9.8

 Northport and Tauranga              2.6             5.5           4.6    12.8        1.8          5.2         4.6       11.6

 Northport                           2.5             7.5           3.1    13.1        1.6          4.9         3.1        9.6

 Firth of Thames                     6.0             8.7           2.7    17.4        4.1          8.7         2.7       15.5

Source: Sapere

                                                                                                                                7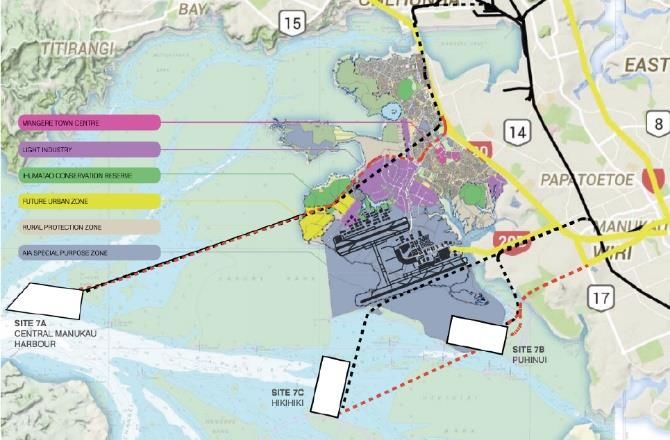
1. Purpose and scope
This section outlines the purpose and scope of this report.

1.1 Purpose of this report
This report accompanies the integrative report that summarises the findings of a collective of
consultants led by Sapere Research Group (Sapere) in relation to the Upper North Island Supply Chain
and the options for a full move of the freight operations of the Ports of Auckland Ltd (POAL).

This study has been directed to consider five options for the relocation of the POAL freight task:

    •    Northport expansion
    •    Port of Tauranga expansion
    •    a shared increase in capacity at both Northport and Port of Tauranga
    •    a new port on the Firth of Thames, and
    •    a new port on the Manukau Harbour.

This report documents the work undertaken within the infrastructure workstream, with respect to
matters of capacity and cost for port, rail and road infrastructure for each option. It documents the
steps involved in preparing a set of infrastructure cost schedules as inputs into the cost benefit
analysis workstream.

1.2 Scope of this report
This report comprises the following elements.

    •    A summary of inputs from other workstreams, such as findings from the freight modelling
         and traffic modelling workstreams, that provide assumptions and context for this work.

    •    A summary of the specialist inputs and advice commissioned for this workstream, from a
         range of contributors with the necessary expertise and technical skills.

    •    Documenting the inputs, analysis and judgments involved in preparing a set of cost
         schedules for the port, rail and road infrastructure requirements for each of the specified
         options over the long term.

    •    Documenting the issues and conclusions with respect to current and potential future
         capacity, including possible constraints, under each of the specified options.

8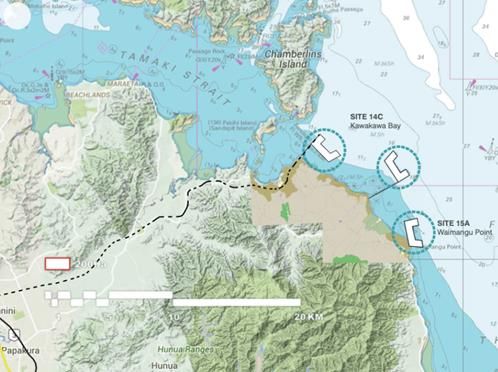
2. Approach
This section outlines the overall approach to this workstream.

2.1 Steps in the analysis
The preparation of the schedules of infrastructure costs generally involved the following steps.

       •    Identifying the current and planned infrastructure capacity for port, rail, road under each of
            the five options as well as in the base case.

       •    Considering the additional infrastructure capacity that would be required over the period of
            analysis for each option in the event of a full move of the freight operations of the POAL.

       •    Determining whether that additional capacity would trigger infrastructure costs that would
            not otherwise occur in the period of analysis and, if so, estimating those costs.

The schedules of infrastructure costs were prepared using today’s dollars, on a non-discounted basis.

2.2 Period of analysis
The period of analysis is 60 years, in line with that selected for the cost benefit analysis. This timeframe
is appropriate given the long lived nature of the infrastructure assets being considered.

2.3 Building on prior studies
The starting point has been the 2019 consultants’ report to the UNISCS Working Group.1 The
approach is to build on that work, in terms of the identified infrastructure requirements, while
accounting for two important differences: the scope of options and the period for analysis.

       •    This work examines new port options (Firth of Thames, Manukau Harbour) and existing port
            options (Northport, Tauranga), whereas the 2019 report focused on existing port options.

       •    The period of analysis for this work is 60 years whereas the 2019 report used 30 years.

The 2016 Port Future Study has also been drawn upon as a starting point for the new port options. 2

2.4 The base case
In the base case, POAL is assumed to remain and expand on the Waitematā Harbour for 60 years for
the purpose of estimating a counterfactual infrastructure cost so that the incremental cost of each
option can be identified and compared. This assumption requires that constraints that POAL may face,
with respect to its ability to expand, are put aside.

1   EY (2019) Economic Analysis of Upper North Island Supply Chain Scenarios, 9 August 2019
2   EY (2016) Consultant’s report to the Port Future Study, June 2016

                                                                                                             9
2.5 Options and sites
The options for expansions at the existing ports of Northport and Tauranga are similar to those
considered in 2019. The options for a new port are based on the 2016 Port Future Study, which
identified three sites on the Manukau Harbour and two sites on the Firth of Thames as potential
locations. To keep the analysis manageable, the approach has been to focus on the site that was
ranked highest in the 2016 study: Puhinui on the Manukau Harbour and Kawakawa Bay on the Firth of
Thames. The sites of focus are intended to be representative of the general costs in each area. The
potential feasibility of the other sites considered in 2016 is not being ruled out here.
2.6 Responsibilities
Sapere, as the lead consultant, has been responsible for the following.
• Commissioning advice from technical experts with relevant experience, outlined in Table 1
below, and working with them to provide the necessary inputs and interpret the findings.
• Preparing a set of infrastructure costs schedules, by drawing on cost estimates prepared by
port and rail specialists and by benchmarking road costs against prior business cases.
• Documenting the above work and in this report.
Table 1 Technical inputs from expert contributors
Infrastructure Contributors Outputs
Port Advisian • Report on port capacities and infrastructure requirements
at POAL, Tauranga and Northport.
Black Quay Consulting • Report on the long-term container vessel outlook.
• Port Future Study recap and an assessment of port capacity
at POAL and Tauranga.
• A desktop review of the two alternative port options
presented in the Port Future Study.
eCoast • Modelling report on the Manukau Harbour entrance with
estimates of dredged channel infilling.
Rail Rail Infrastructure • Report on rail connections and routes for the new port
Consultants (RIC) NZ options and the base case.
Murray King & Francis • A rail capacity model.
Small Consultancy, KiwiRail • High-level estimates of rail infrastructure costs for
Northport and Tauranga options.
Murray King & Francis • Rail market shares for each option.
Small Consultancy and
Richard Paling Consulting
Road Flow Transportation • Traffic assessment of each option, with infrastructure
Specialists requirements identified.
Source: Sapere
103. Outlook for freight growth and vessel size
The outlook for the growth in freight volumes informs conclusions about the capacity of POAL and the
infrastructure capacity needed for other port options to accommodate the future freight task.
3.1 Forecasting growth in container freight
Forecasts for freight growth at POAL use the Ministry of Transport freight model, as updated for the
2019 National Freight Demand Study. The forecasts relate to the base case, in which POAL is assumed
to be able to expand on the Waitematā Harbour to handle growth for 60 years. Containerised freight,
comprising imports and exports, is of primary focus given volumes involved, the land area needed,
and the growth outlook. Three forecasts were prepared for the period to 2079, with 2018 as the base.
• Medium growth – a compounding annual rate of growth of 2.26 per cent. This is referred to
as the calibrated forecast.
• Higher growth – a compounding annual rate of growth of 2.51 per cent. This is referred to as
the calibrated (higher growth) forecast. It uses higher population and GDP growth rates.
• Low growth – a compounding annual rate of growth of 0.75 per cent. This is referred to as
the officials’ agreed forecast.
To put these rates in context, annual growth in container freight in the Upper North Island ports has
averaged over 4 per cent across 2012 to 2019. This study focuses on the calibrated forecast (medium
growth) as being the most plausible rate of growth for container volumes over the long-term. The
decision to focus on the calibrated forecast takes into account port planning assumptions used in
Australia and advice from a port planner with extensive international experience. Detailed analysis has
been included for the low growth forecast at the request of officials.
Summary of freight forecast differences
The low growth forecast is based on officials’ agreed assumptions for population and GDP
growth and supply and demand drivers within the model. This results in a forecast of freight
growth that is materially lower than in prior studies and lower than trend growth in the Upper
North Island. The lower growth rate arises because the model assumes that domestic supply of
goods grows in line with domestic demand and this results in low growth in import volumes.
The calibrated (medium growth) forecast adjusts the model’s demand and supply drivers to
better reflect trend import flows through the ports. The model treats the demand for, and
supply of, manufactured and retail goods as being dependent on a weighted relationship to
regional population and GDP growth. The adjustment is that the demand for manufactured
and retail goods continues to grow strongly as the economy develops but the capacity to
supply these goods domestically grows more modestly. The resulting imbalance is met by
imports, as has been the case in New Zealand for some time. This outcome is consistent with
the economy continuing to focus more on services with a reduced focus on manufacturing.
The high growth calibrated forecast is designed to test the impact of population and GDP
growth being higher than in the calibrated forecast. It uses slightly higher, but still plausible,
assumptions about long-run population and GDP growth.
11Table 2 summarises the average annual growth rates of the forecasts over the 60-year timeframe. The
average annual growth rates over 30 years are also shown, to enable a comparison with figures used
in the 2019 consultants’ report commissioned by the Working Group, which used a 30-year timeframe.
This comparison shows that the calibrated forecast for this study has a similar annual rate of growth to
the lower figures used in the 2019 consultants’ report commissioned by the Working Group.
Table 2 Container freight forecasts for Ports of Auckland – compounding annual growth rates
Scenario Over 30 years Over 60 years
Officials’ agreed forecast (low growth) 0.86% 0.75%
Calibrated forecast (medium growth) 2.18% 2.26%
Calibrated forecast (higher growth) 2.43% 2.51%
Working Group Consultants’ report (2019) – low 2.24% n/a
Working Group Consultants’ report (2019) – high 3.06% n/a
Sources: Freight modelling workstream outputs; EY (2019) consultants’ report to the UNISCS working group – rates derived
from the range of TEU volumes reported for 2018 and 2049.
Figure 1 compares the trend growth rate for each forecast, over 30 years, with a range derived from
the figures in the 2019 consultant’s report to the Working Group. Of note, the calibrated forecasts sit
either side of the lower end of the forecast range for container freight used in the 2019 report.
Figure 1 Container freight forecast scenarios for Ports of Auckland – comparison of trend growth
Index, base = 100
300
250
200
150
100
50
2019 forecast range Officials' agreed forecast Calibrated forecast Calibrated (higher) forecast
0
0 1 2 3 4 5 6 7 8 9 10 11 12 13 14 15 16 17 18 19 20 21 22 23 24 25 26 27 28 29 30
Year
Sources: Freight modelling workstream; EY (2019) with additional analysis by Sapere
123.2 Sizing the future freight task
The future freight task represents the volume that would need to be accommodated over 60 years,
either at POAL or one of the port options. As well as the import and export of containers, the freight
task also comprises bulk freight (i.e. importation or transhipment of cement, sand, grains and the
export of scrap metal) and vehicle imports (all motorised vehicles). Results are shown for the medium
and officials’ agreed forecast and include transhipments.
Container freight is measured by twenty-foot equivalent units (TEU). Container freight grows to 3.84
million TEU in 2079 in the calibrated forecast, or 3.8 times the volume in 2020. Under the officials’
agreed forecast, container freight reaches 1.53 million TEU in 2079, or 1.6 times the volume in 2020.
Table 3 Container freight forecasts for Ports of Auckland – size of future freight task
2020 2079 Ratio of 2020 to
Forecast
million TEU million TEU 2079
Calibrated 1.01 3.84 3.8 times
Officials’ agreed 0.99 1.53 1.5 times
Source: Sapere
Bulk freight, under the calibrated forecast, grows to 4.63 million tonnes in 2079, or 2.7 times the
volume in 2020. Under the officials’ agreed forecast, bulk freight reaches 2.67 million tonnes in 2079,
or 1.6 times the volume in 2020.
Table 4 Bulk freight forecasts for Ports of Auckland – size of future freight task
2020 2079 Ratio of 2020 to
Forecast
million tonnes million tonnes 2079
Calibrated 1.71 4.63 2.7 times
Officials’ agreed 1.68 2.67 1.6 times
Source: Sapere
Vehicle imports are assumed to grow at the rate used for container imports in each forecast. Under
the calibrated forecast, vehicle imports, reach 1.68 million in 2079, or 5.3 times that of 2020. Under the
officials’ agreed forecast, vehicle imports reach 0.48 million in 2079, or 1.6 times that of 2020.
Table 5 Vehicle import forecasts for Ports of Auckland – size of future freight task
2020 2079 Ratio of 2020 to
Forecast
million vehicles million vehicles 2079
Calibrated 0.31 1.68 5.3 times
Officials’ agreed 0.30 0.48 1.6 times
Source: Sapere
133.3 The container forecast is the most critical Of these forecasts, the container forecast is the most critical, given POAL constraints and the outlook for growth. The container trade also requires considerable investment in berthage, automation and other infrastructure. In contrast, vehicles require a wharf to pull alongside, and yardage for temporary parking, but can be driven off and out of the way, promptly. To this end, we sought an external expert view on the long-term outlook for global and regional container trade. This view, in effect, points to use of the calibrated forecast (medium growth) over the officials’ forecast (low growth) for this study. Black Quay perspective on the outlook for container trade Black Quay are specialist consultants, providing advanced port planning and specialist advisory services to clients around the world. The company has presence in Australia, the United States and the United Kingdom and planning studies delivered over the last five years include assignments in Australia, North America and the Middle East. Black Quay regularly prepares global and regional forecasts of container trade, based on research into consumption, manufacturing and industrial trends. Outlooks for containerised trade for western nations over the last five years have generally followed an annual average growth rate of between 2.6 per cent and 3.4 per cent. Black Quay has not prepared forecasts for this study but offers the following high-level opinion. Black Quay advises that global growth rates for container trade will likely reduce over time, as a result of the container market maturing and less potential for further products to be containerised. Balancing this, container consumption per capita in western countries is still growing and healthy growth is expected in the medium term. There is no reason to expect that New Zealand would be different. Black Quay expects a generalised reduction for Australia from 2.6 per cent per year in the short to medium term, to between 2.0 per cent and 2.26 per cent per year in the long term. This view factors in near-term Covid19 impacts and reflects the growing reality of Australasia being connected to Asia from an economic perspective. Black Quay’s view is that Asia will represent more than 90 per cent of Australasian trade in the medium term. Black Quay considers that an annual growth rate of 1 per cent or less into the long term would be implausible and out of step with their port planning work elsewhere. In Black Quay’s view, basing a regional port strategy for the long term on an annual container growth rate of 1 per cent or below would be high risk and would not appear to fully consider long-term population trends, consumerism trends, ageing and disruptive manufacturing techniques and the development of emerging industries. Black Quay advises that it is important to identify the future freight volume at which a pre-determined long-term relocation plan would be triggered. This volumetric trigger approach acknowledges the uncertainty of long-run forecasts and allows for some flexibility to react to sustained upside or downside surprises in trend growth of freight. Source: Black Quay memo, May 2020. 14
3.4 Outlook for larger container vessels
Container vessels continue to grow in size, driven by economies of scale and competitive pressures.
Larger vessels mean larger loads, fewer visits and longer time to unload in port. The ability to
accommodate these larger vessels is one dimension of port capacity, with the implications being:

    •    entrance channels need sufficient width and depth to enable access

    •    more depth necessary at vessel berths and in turning bays

    •    longer vessel berths needed alongside the wharves.

Cascading effects across the global container vessel fleet are likely to increase the upper end of the
fleet visiting New Zealand, as well as the average vessel size. An outlook prepared by Black Quay
concludes that vessels of 7,500 to 8,000 TEU added on New Zealand routes (after 2019), will gradually
be replaced in the medium term (15-30 years) by vessels of 8,500 TEU and above, with a maximum
size of 11,000 TEU. Longer term (30-50 years), a small number of dimension-specific 13,000 to 14,000
TEU vessels will be operated on the primary Australasian services and would represent a significant
component of overall service capacity.

3.5 Implications for POAL
POAL is, currently, constrained to vessels under 6,000 TEU and this has likely contributed to low
growth in container volumes and an increasing loss of market share to the Port of Tauranga, which
can accommodate these larger vessels. As examples, Maersk first sent a 9,500 TEU ship to Tauranga in
2016 and has been making regular calls since, with a successful trial of an 11,300 TEU ship in 2017.

Black Quay concludes that POAL is currently at a critical disadvantage, relative to the Port of Tauranga,
in accommodating larger container vessels. The POAL 30-year plan provides for the construction of a
third berth for container vessels and for the entrance channel to be dredged in two phases. Those
plans are contingent on obtaining resource consents. If both stages of POAL’s planned dredging are
consented, then visits of some 11,000 TEU vessels would become possible, however, it is Black Quay’s
view that access would be significantly limited in terms of specific vessel dimensions and operating
parameters (i.e. weight limits and a limited tidal window).

POAL would still be at a disadvantage relative to the Port of Tauranga in future, in terms of channel
depth. The extent of this disadvantage depends on the future size of vessels, but the disadvantage
could become more apparent in the short to medium term. Should container vessels increase to
13,000 to 14,000 TEU in size, and up to 380m long and a 15.5m draft, access to POAL would not be
possible without sizeable increases in channel depth and berth length beyond that allowed for in the
30-year plan and the current resource consent applications.

                                                                                                         15
4. Port infrastructure requirements This section provides an overview of the specified port options, with a focus on the capacity and infrastructure that would likely be needed to accommodate the long-term freight task. 4.1 Approach Two sets of specialist consultants were commissioned to assess and advise on long-term port capacity and infrastructure costs: Advisian (marine and coastal engineers) and Black Quay (strategic and operational port planners). The approach was to allocate the options to these port consultants in line with their prior experience, with both being asked to independently examine capacity at POAL. Advisian was commissioned to examine planned and potential capacity at POAL, the Port of Tauranga and Northport, and to identify and cost the infrastructure required for the forecast freight task. Consultants from Advisian and Sapere undertook site visits to the Port of Tauranga, Northport and POAL in February 2020. Each visit involved engagement with representatives of the port management team, a presentation on the current state and planned capacity developments and a guided tour of the port. The results of the capacity assessment undertaken by Advisian were reflected back to the ports, as an opportunity to identify any material issues of interpretation. Black Quay was commissioned to provide a view on capacity at POAL, in light of information provided, and to revisit their work for the 2016 Port Future Study on the potential sites for a new port on the Manukau Harbour and the Firth of Thames. Black Quay reviewed the cost estimates for a new port at those sites, as prepared for the 2016 Port Future Study. That work assumed a container terminal capacity of 10 million TEU to accommodate the entire long-term freight task of the Upper North Island in the long term (i.e. the combined freight task of POAL and the Port of Tauranga). Black Quay provided advice on scaling back that capacity to 5 million TEU, to reflect the focus of this study being on the future freight task of POAL. This exercise involved differentiating between elements that are fixed and those that are scalable, while recognising that a new build involves cost loaded upfront. In addition, a marine consultancy, eCoast, was commissioned to undertake detailed numerical modelling with respect to a dredged channel at the entrance to Manukau Harbour. The purpose was to provide an indication of sedimentation and the impact of extreme storm events on a dredged channel and to provide insight into the likely requirements for maintenance dredging. The estimates of capacity, concept layouts and costings were prepared by the port consultants, taking into account the forecast freight task, existing infrastructure, scope for expansion and potential environmental constraints. The capacity plots for the existing ports are included as Appendix A. Sapere combined the results into a schedule of port infrastructure costs for input into the cost benefit analysis, with some adjustments for consistency and completeness (e.g. allowing for planning costs), cost escalation (inflating 2016 estimates to today) and phasing over time. A set of cost estimates were also produced for the officials’ agreed freight forecast, by scaling back capacity requirements to reflect the relatively lower freight growth path under that forecast. 16
4.2 Ports of Auckland – the base case
This section considers the capacity of POAL to accommodate the long-term freight task. The purpose
is to assess when the freight operations of the port might need to move and determine a base case to
inform the cost benefit analysis of the port options.

         Plans to address constraints and increase capacity
The freight forecasts assume that POAL can remain and expand on the Waitematā Harbour to
accommodate the increasing volume of freight over 60 years. However, the POAL freight operation is
currently constrained on several fronts, including container terminal capacity and the berths and
channel access to accommodate larger container vessels.

The POAL 30-year plan provides for an increase in capacity at the Fergusson Container Terminal. The
first stage involves constructing a third berth, automating the container yard and finishing some
reclamation. A second stage involves relocating the administration block to extend the reefer space,
constructing rail-mounted gantry and automating the rail yard. The 30-year plan also provides for the
Freyberg Wharf to be converted to container terminal operations and for the channel to be dredged
in two stages. Some of these steps require resource consents to be obtained (e.g. dredging work).
Figure 2 shows the planned expansion of container operations: the Fergusson Container Terminal is
on the right and the Freyberg Wharf is the triangular wharf.

Figure 2 Ports of Auckland plan for expanded container terminal operations

Source: Advisian

                                                                                                       17
Thirty years of port capacity plausibly remains
The port consultants were asked to independently assess the POAL 30-year plan and to offer a view
on future capacity to accommodate the container trade. The consultants differentiate between a peak
or maximum capacity, at which a port can operate for short periods, and an effective or sustainable
operating capacity. The latter is the level at which a port can operate reliably and economically,
beyond which there are increasing risks from congestion for productivity, safety and profitability.
The port consultants recommended that the concept of operating capacity be adopted for port
planning purposes. That is, it would be prudent to avoid using peak or best-case maximum capacities
in planning for the long term. The views offered by the port consultants suggest a planning
assumption of 2.04 to 2.24 million TEU per year for the future combined operating capacity of the
Fergusson Container Terminal and the Freyberg Wharf.
The estimates of annual operating capacity can be compared with the freight forecasts to determine
how long growth may be accommodated. Figure 3 plots the forecasts of TEU volumes per year against
the low and high estimates of future annual operating capacity.
Figure 3 Freight forecasts with estimates of Ports of Auckland operating capacity
TEU million
5.0
4.5
4.0
3.5
3.0
2.5
2.0
1.5
1.0
0.5
0.0
2030
2018
2020
2022
2024
2026
2028
2032
2034
2036
2038
2040
2042
2044
2046
2048
2050
2052
2054
2056
2058
2060
2062
2064
2066
2068
2070
2072
2074
2076
2078
operating capacity (low) operating capacity (high) Officials' agreed forecast
Calibrated forecast Calibrated (higher) forecast
Note: Operating capacity shown represents future capacity under current plans; capacity in 2020 is approximately 1m TEU
Sources: Sapere; Port consultant estimates
18The conclusion is that the POAL plan will enable sufficient operating capacity for approximately 30
years from 2020, with the range being 31 to 35 years of capacity, under the calibrated freight forecast
(medium growth), depending on the estimate of effective operating capacity. The range is 28 to 32
years of capacity under the higher growth calibrated forecast.
This conclusion assumes that constraints, such as channel dredging to enable larger vessels to access
the harbour entrance, will be addressed (i.e. that the necessary consents will be obtained). Under the
officials’ agreed forecast, using officials’ agreed assumptions, there is sufficient long-run capacity,
although, as noted above, this is less plausible.
The POAL base case as a baseline to test other options
At the heart of a robust cost benefit analysis is a base case against which to compare the proposed
alternative options. This base case is sometimes referred to as the “counterfactual”, “status quo”, or
“do minimum” scenario. The base case allows decision-makers to see the incremental effects of doing
something by accounting for the likely effects of not doing anything.
Establishing the base case is not straightforward. The Treasury’s guidance on cost benefit analysis
notes that this is particularly difficult when the “do nothing” scenario is likely to evolve over the period
of analysis. This study considered two base cases: constrained and unconstrained.
A constrained base case would involve limiting expansion, possibly in line with the POAL 30-year plan.
The assumption would be that any necessary resource consents sought by POAL for major expansion
would not be granted, for example, due to environmental and/or societal considerations. In contrast,
an unconstrained base case assumes that POAL would receive necessary consents to expand as
needed over the long term.
In practical terms, having two base cases would be analytically unwieldy and create confusion rather
than clarity. In addition, the need for comparability with previous work, particularly the Working Group
study, suggests a single base case.
A simplifying assumption of further port expansion to meet
60-year needs
This study uses an unconstrained base case, where POAL is assumed to be able to remain and expand
on the Waitematā Harbour for the 60-year period of analysis. In effect, the constraints that have been
previously identified around the ability of POAL to accommodate the future freight task have been put
to one side, to assess the incremental impacts of the relocation of freight operations.
Accommodating the growth in container volumes out to 2079, as determined in the calibrated
forecast, would require an expansion to the port precinct, beyond that envisaged for in the POAL 30-
year masterplan. Marine and coastal engineers Advisian have concluded that this would involve
substantial reclamation into the Waitematā Harbour.
This future reclamation may not necessarily extend beyond the north face of the Fergusson Wharf.
Such an expansion could, potentially, involve extending the container terminal an estimated 800
metres east of the existing Fergusson North Wharf with an associated 24 hectares of reclamation to
obtain enough berth capacity to service vessels until 2079. In effect, this would see the Fergusson
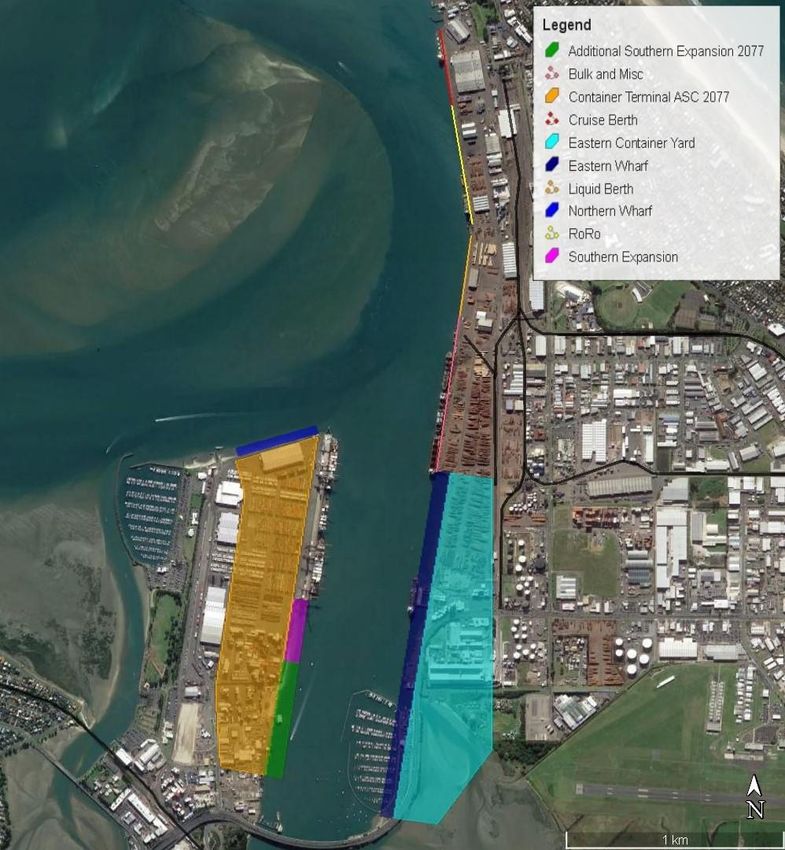
19Container Terminal approximately doubling in size. Figure 4 shows what this scale of expansion could look like, for illustrative purposes. This does not represent a concept plan or a worked up plan or a proposal from POAL but, rather, highlights the extent of development that might be needed. Reclamation is a controversial issue. This level of reclamation may prove very difficult to consent, particularly as expansion eastward will have coastal impacts on the sediment flow through the Waitematā Harbour, potentially causing siltation to occur around Mechanics Bay and Judges Bay. Such an expansion of the port precinct would also likely require the relocation of existing facilities at Mechanics Bay and Judges Bay. Figure 4 A concept for required container terminal area, assuming unconstrained expansion to 2079 Source: Advisian Note: This is not a plan or proposal from POAL 20
Figure 5 shows the detail underpinning the cost estimate of the required port infrastructure for POAL in the modelled base case.

Figure 5 Cost estimate of port infrastructure for the base case

Source: Advisian

21                                                                                                                                 © 2020 Sapere Research Group
4.3 Northport option
Northport is located at Marsden Point, on the southern side of the entrance to Whāngārei Harbour.
While Northport has some room to expand in a physical sense, identified environmental constraints to
both the west and the east mean that the scope to expand the port is limited.

The areas to the east and the west of the Northport precinct were considered by Advisian in their
assessment of the potential for Northport to expand to accommodate the future freight task of POAL,
under the calibrated forecasts. Figure 6 shows these areas, labelled A and B. Area A is to the east of
the existing wharves, where Northport has consent to extend the wharf by 270 metres and to
undertake associated reclamation. Area B is to the west, where Northport has plans for a 300 metre
expansion with reclamation.

Figure 6 Northport areas considered for potential expansion

Source: Advisian                                         Note: Limit of eastward expansion is shown as yellow dot

Northport could provide sufficient berth capacity until around 2060, under the calibrated freight
forecast, which is not materially longer than the estimated capacity remaining at POAL. Northport
could comfortably accommodate container trade of 2.6 million TEU per year, if required to handle the
POAL future freight task, whereas that task would reach 3.8 million TEU in 2079 under the calibrated
forecast and 4.4 million TEU in 2079 under the calibrated (higher growth) forecast.

To accommodate the future freight task, marine and coastal engineers conclude that Northport would
need a 2km long quay, involving dredging and reclamation that expands beyond identified
constraints. To the west, those constraints include residential areas and wetlands associated with an
estuary. To the east, expansion would need to be into the area occupied by Refining NZ’s liquids
berths and well beyond, with significant impacts on coastal processes that would affect the
surrounding coastline and entrance channel. This would require detailed investigation to determine
the extent of these impacts. Figure 7 shows what that scale of expansion would entail.

22                                                                                 © 2020 Sapere Research Group
Figure 7 Northport expansion – concept layout for forecast freight task, 2079

Source: Advisian

23                                                                              © 2020 Sapere Research Group
Figure 8 shows the detail underpinning the cost estimate of the required port infrastructure.

Figure 8 Cost estimate of port infrastructure for the Northport option

Source: Advisian

24
4.4 Port of Tauranga option
The Port of Tauranga is located on the south east side of Tauranga Harbour. The port has the largest
container terminal operation at Sulphur Point, on the eastern side of the channel, with bulk freight,
such as log exports, on the eastern Mount Maunganui side of the channel. The areas considered for
possible expansion are shown in Figure 9.

Figure 9: Port of Tauranga areas considered for potential expansion

Source: Advisian

     •    Area A is to the south of the existing berths at Sulphur Point and Mount Maunganui and
          would enable expansion of the bulk and container terminals within existing port precincts
          and adjacent industrial areas. It will involve dredging the channel and berth pockets and
          relocating the marina. However, this expansion will not be possible until the airport either
          changes current flight operations, adjusts the location of the runway, or is relocated to
          outside of the city, due to air-draught restrictions surrounding the approach flight path.

25                                                                          © 2020 Sapere Research Group
• Area B is located to the west of the Sulphur Point container terminal and would involve
constructing a new quay line where the boat ramp and marina are currently located. This will
allow for connectivity to the existing container terminal. Significant dredging would be
required to widen the creek to allow for a berth pocket sufficient for container vessels. It has
been assumed that current flow through the creek would not be strong enough to flush
sediment from the berths and therefore maintenance dredging would also be required. It is
believed that there would not be significant impacts on existing coastal processes. The land
is not owned by the port, and the expansion would involve the relocation of the marina and
public boat ramp. For these reasons, this Area B is less desirable than Area A.
• Area C would involve reclamation to the north of the Sulphur Point to create additional
hardstand and enable a continuous quay line. However, there is a channel that runs adjacent
to the northern breakwater where strong currents from tidal flows are common. Expansion
northward into the tidal channel would change tidal flow paths both to the northeast onto
the Mount Maunganui foreshore and to the west into the estuary. Locally it would impact
the entrance to the adjacent marina, possibly causing siltation and presenting a navigation
hazard to recreational boating. Even with detailed modelling, there would still be a
significant risk to existing coastal processes. Therefore, no reclamation north of Sulphur
Point has been considered.
• Area D involves expanding the Mount Maunganui wharves north up to Pilot Bay. However,
this is a popular tourist beach, which is quite shallow and with residential areas adjacent,
thus requiring significant dreading and reclamation. Compared to Area A, Area C is less
desirable due to the proximity of residential areas leading to significant consenting issues.
Marine and coastal engineers, Advisian, conclude that the Port of Tauranga would be able to
accommodate its own long-term freight task, with capacity of up to approximately 5.0 million TEU.
This would involve expansion within the existing port precinct, with the identified areas, beyond
current expansion plans, being a northern berth on Sulphur Point and between the liquids berth and
Mount Maunganui Wharves with associated terminal backing. It also assumes conversion to
automated stacking cranes. This development would have little impact on current operations at the
port or the surrounding infrastructure
To accommodate the freight task for the minimum test of 60 years, an additional 3.8 million TEU on
top of its own long-term freight task, the Port of Tauranga would need significant expansion, into
industrial areas on each side of the estuary channel. The necessary addition of berths and container
facilities to the south and east of the port precinct would likely impact on flight paths from the nearby
airport. The implication of this expansion is that the airport runway, bridge marina and highway would
need to be relocated to accommodate the growth, triggering further infrastructure costs.
Marine and coastal engineers advise that the associated increase in shipping activity would be
challenging, given tidal currents, with a risk of congestion affecting vessel operations and limiting port
capacity. Even if this long-term capacity can be realised, Tauranga would have few remaining options,
other than expanding to the west of Sulphur Point, into the reserve and marina.
26You can also read