Resilient Cornwall Risk Based Evidence Profile 2018 Incorporating the Fire and Rescue, Community Safety and Localism Services - Cornwall Council
←
→
Page content transcription
If your browser does not render page correctly, please read the page content below
Resilient Cornwall
Incorporating the Fire and Rescue, Community Safety and Localism Services

Risk Based Evidence Profile 2018

Acknowledgements
Produced by Sophie Coles and Vanessa Bailey with special thanks to the
following people and teams for providing data and advice to help produce this
document:

Business Systems and Assurance Team

Amethyst Community Safety Intelligence Team

Sarah Noakes, Customer Access and Digital Services

Resilience and Emergency Management Team

Mike Cartwright, Traffic Monitoring Engineer, Cormac

Helen Galligan, Senior Highway Design Technician, Cormac

Donald Greig, Performance and Analysis Support Officer, Devon and Cornwall
Police

Marie Woltman, Road Safety Data Analysis and Performance Officer, Devon
County Council

                                       2
Contents
Acknowledgements                                                                  1

Contents                                                                          3

Introduction                                                                      5

Executive summary                                                                 8

Our prevention priorities                                                        10

Incident infographics                                                            11

Injury road traffic collisions                                                   15
  Injury collisions and casualties                                               15
    Fatal collisions and casualties                                              17
    Serious collisions and casualties                                            18
    Slight collisions and casualties                                             19
  Road safety prevention priorities                                              20
  Collision causes                                                               21
    Contributory factors                                                         21
    Enforcement                                                                  22
    Driving behaviour                                                            23
  Where did collisions happen?                                                   25
  Priority Road User Groups                                                      27
    Motorcyclists and pedal cyclists                                             28
    Older drivers                                                                32
    Young car drivers and passengers                                             35
    Pedestrians                                                                  38

Accidental dwelling fires                                                        40
   Fatal fires in Cornwall                                                       41
    Factors that make someone more vulnerable to fire                            42
    Emollient creams                                                             43
    Who is most likely to have an accidental dwelling fire?                      45
    Who is most likely to be injured in accidental dwelling fires in Cornwall?   45
    What is the cause of most accidental dwelling fires?                         48

Threats and opportunities                                                        50
   Broadening health and well-being agenda                                       50

                                         3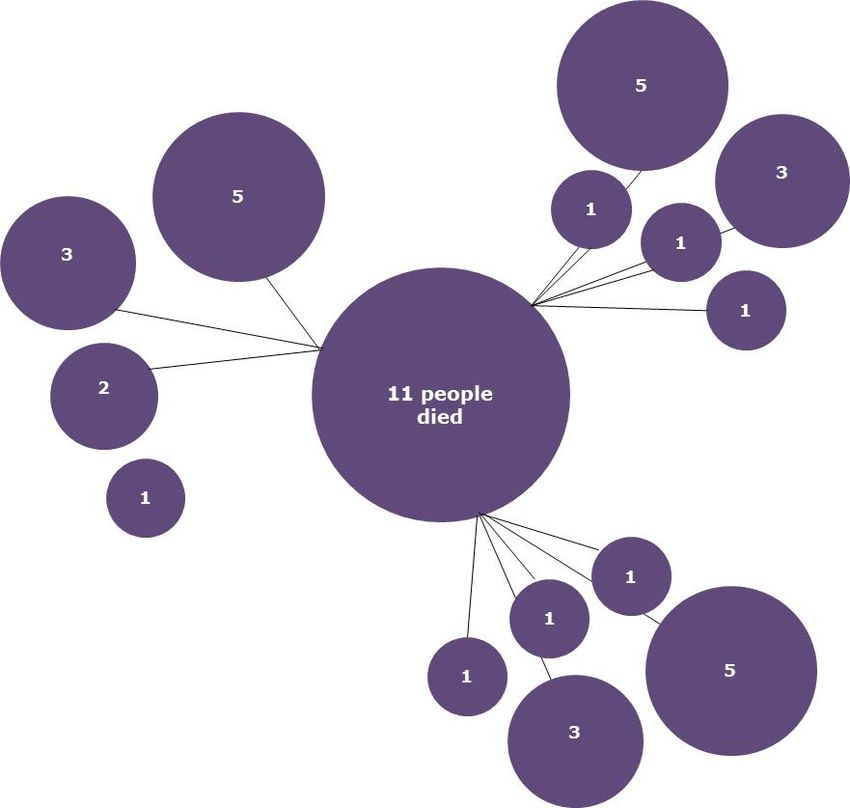
Grenfell tower                                                              50
   Fire sector reform: the three pillars of reform                             51
   Efficiency and collaboration                                                511

Cornwall community profile                                                      53

Appendix                                                                        58
 Appendix 1. Data tables for incidents                                         588
   Road traffic collisions and casualties: Department for Transport severity
   definitions                                                                 58

                                         4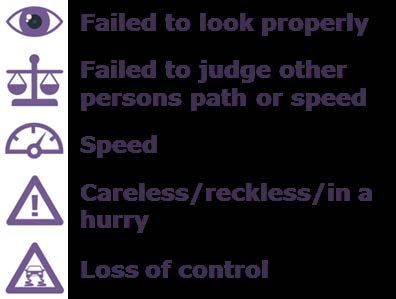
Introduction
The information in the Risk Based Evidence Profile (RBEP) has been provided to
support managers within Resilient Cornwall who are responsible for tackling a
range of issues.

Resilient Cornwall is a service of Cornwall Council which focuses on ‘our place’,
delivering services to develop and maintain our spaces and places so they are
clean and sustainable, with safe, active and resilient communities. It
incorporates the former Fire and Rescue, Community Safety and Localism
services.

This report provides information about fires, road traffic collisions and other
types of incidents which are dealt with by the service so that we can better
understand how we can address these issues. This analysis is based on the most
current data available to the service. All fire and rescue data is based on the
period 1st April 2016 to 31st March 2017 and all road traffic collision data is from
1st January 2016 to 31st December 2016 1.

The document enables us to identify what the biggest risks are for fire, rescue
and road safety, where and when they occur and who is most affected or
vulnerable to them. It also provides information about future threats and
opportunities which are likely to affect the service over the next few years.

This information plays a key role in the development of our Service Plan
(incorporating our Integrated Risk Management Plan 2) and ensures we follow an
evidence led approach to managing our activities and resources. All fire and
rescue authorities have a statutory responsibility to produce an Integrated Risk
Management Plan that sets out how it will address locally identified risks and this
document forms the first part of this process.

This document is one of two needs assessments produced within Resilient
Cornwall which informs our Service Plan/ Integrated Risk Management Plan. The
other is the Safer Cornwall Strategic Assessment which can be accessed through
the Safer Cornwall website - safercornwall.co.uk. The Strategic Assessment
provides a profile of crime, substance use and anti-social behaviour in Cornwall
and highlights the priorities for the Safer Cornwall Partnership.

In addition to our RBEP we also produce a Prevention Tool which highlights those
at greatest risk of accidental dwelling fires; a Protection Matrix which highlights
high-risk businesses and Risk Profiles for each community fire station. All of

1
  Information accurate as of 1st August 2017: some subsequent changes are possible as
further incident information becomes available such Coroner’s findings.
2
    Cornwall Fire and Rescue’s IRMP is integrated within the Resilient Cornwall Service Plan.

                                                   5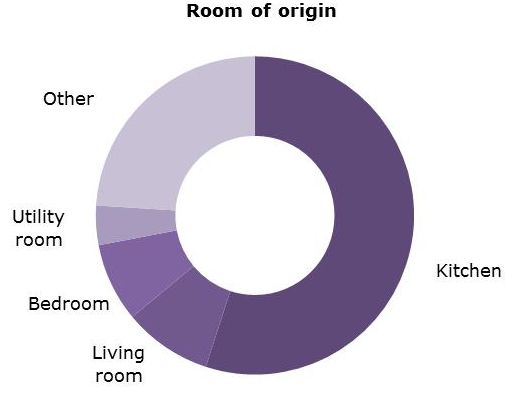
these tools and products inform the service’s Integrated Risk Management Plan,
team plans, initiatives and various campaigns.

As a service we assess our priorities for prevention activity using our
‘Prioritisation Matrix’ tool. This allows us to assess the extent of and impact on
the community and our service of all fire, rescue and road safety incidents. We
refresh this tool each year to determine our prevention priorities and to ensure
our resources are targeted at the greatest risk. These incidents are then given a
priority category of: very high, high, medium or standard risk.

The diagram on the next page shows where the Prioritisation Matrix and Risk
Based Evidence Profile fit within the service’s evidence profile and how it is used
across the service.

                                         6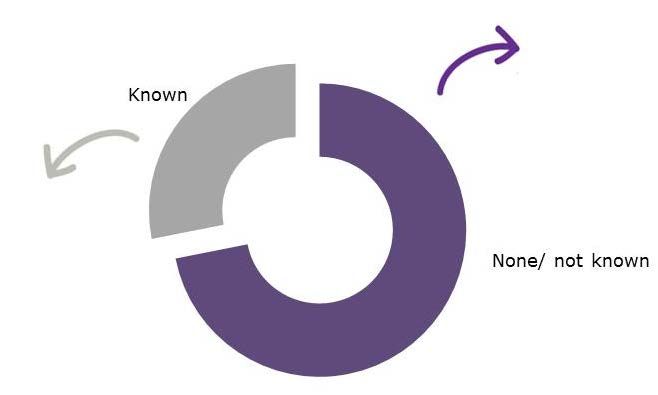
Executive summary
The top two priorities for prevention activity are road traffic collisions and
accidental dwelling fires. These incident types have a high frequency and are
associated with the highest rates of deaths and serious injuries of all fire, rescue
and road safety incidents.

Road traffic collisions resulting in injury (commonly referred to as ‘injury
collisions’) have significantly decreased 3 over the past five years despite an
increase in traffic. Last year 22 people died in road traffic collisions in Cornwall
and serious injuries appear to have continued to increase since 2009,
however the way incidents are recorded has changed and this may be
influencing some of this change. In 2016 the Police started recording collisions
using a new system called CRASH. The Department for Transport has stated
that collisions in 2016 have been correctly recorded and are working to re-
classify historical data. It is unclear whether the shift to this new system has
influenced some of the increase in serious collisions and we will not understand
the full extent until all data has been re-classified.

Accidental dwelling fires have decreased over the past five years but these
changes are not statistically significant. Last year there were 256 accidental
dwelling fires, three people died and one person was seriously injured in dwelling
fires in Cornwall. Although, we have seen a reduction in the number of these
fires over recent years, the number accidental of people killed or seriously
injured has remained relatively unchanged over the past eight years.

Although the priorities for prevention activity are broadly the same as last
year there have been some changes within the medium and standard risk
rankings. Other human rescues have moved up to medium risk; this category
has a high frequency and involved two deaths and 18 serious injuries over the
last three years. Carbon monoxide has also moved up to medium risk, although
this incident type has a low frequency there were six serious injuries within this
category last year. Deliberate primary fires have dropped down to standard risk;
there have been no deaths over the past three years due and two serious
injuries in this category.

New analysis using the customer profiling tool, Acorn, has provided a better
understanding of the types of households that experience an accidental dwelling
fire in Cornwall. We know that deprived households, elderly people and
people living in social housing experience the highest rates of house fires in
Cornwall. People living in social housing in Cornwall have double the rate of

3
 *Significance and expected limits are based on a Poisson test, as advised by The Royal
Society for the Prevention of Accidents (ROSPA) for incidents of this nature.
accidental dwelling fires. It has also highlighted that some of our most serious
fires, deaths and injuries have occurred in affluent elderly, rural pensioner and
greenbelt family households. Although this is based on a small number of fires it
has shown that households that do not fall within our expected definition
of high risk can also experience very serious and fatal house fires.

New research 4 from Kent Fire and Rescue Service has shown that people do
not behave as we expect them to when they experience a fire in their home.
This has raised questions about the best way to advise the public on dealing with
a house fire. An estimated 70% of fires are extinguished by people in their
homes and are not reported to the fire and rescue service. Evidence shows that
people do not panic and they behave rationally. The vast majority of those
that were injured tackling a fire in their home would do the same again.

Analysis of fire data in Cornwall has highlighted some gaps in the information
collected regarding human factors in accidental dwelling fires. Two thirds of
accidental dwelling fires in Cornwall logged in our Incident Recording System
(IRS) have no human factors attributed to them which needs further work to
understand why.

There have been a number of political and social changes over the past year
impacting on the service at a local and national level. Recent legislation
introduced by the government will change the way fire and rescue services in
England are governed and operate. There are three main pillars of reform which
these changes come under, these are: workforce reform, efficiency and
collaboration and accountability and transparency.

Following the recent tragedy at Grenfell the service has experienced an increase
in requests from the public, partners and central government about fire safety
and building regulations. The growing public and political awareness of this
issue is likely to lead to further work over the next few years particularly
regarding social housing.

Over recent years the impact the fire and rescue service has on health and
well-being has been widely recognised. As part of this role the service is now
expanding the remit of the work it carries out in peoples’ homes. These visits will
be known as ‘safe and well visits’ and will encompass a range of health advice as
well as fire safety.

As the population of Cornwall increases the proportion of older people is also
growing. This change in demographics is likely to place an increasing demand
on services, such as our ‘safe and well visits’, as older people are supported to
remain in their own homes.

4
 Why human behaviour really matters: Kent Fire and Rescue Service, National Fire Chief Council
Conference, October 2017

                                               9
Our prevention priorities
Incident infographics
                         Very high priority - Injury road traffic collisions

                                          1203 injury road traffic collisions
Collisions in 2016

                                                  277 people seriously injured
                                                                                                    24 per
                                                                                                    week
                                                                   22 people died
                                                                                                Average number of
                                                                                                 injury collisions
Trend & cause
 Priority groups

                     In 2016/17 we needed…
Resources

                              1986 hours                     4079 firefighter                     487 appliance
                                                              attendances                           call outs
                        (Total firefighter & officer hours
                       spent actively attending incident)                      …to attend to these incidents
                     All figures quoted are based on Stats 19 data and includes injury collisions that have been recorded by
                     Devon & Cornwall Police from 1st January to 31st December 2016 except ‘resources’ section which only
                     includes incidents attended by fire and rescue personnel between 01/04/2016 and 31/03/17. Does not
                                      include damage-only collisions or collisions not recorded by the police
Incidents 16/17
High priority – accidental dwelling fires
256 fires 5 per
1 person seriously injured week
3 people died Average number of
accidental dwelling fires
These fires in Cornwall are
reducing
Trend & cause
2010 2014 2017
Only 2% classified ‘high’ severity
Where known: Two thirds of
accidental
Distraction (14%)
Human factors
dwelling fires
Sleep not drugs/ have no human
alcohol (4%)
factors attributed
Other medical (4%) to them
Disabled (1%)
Excessive/
dangerous storage
(1%)
In 2016/17 we needed…
Resources
3614 hours 3281 firefighter 386 appliance
(Total firefighter & officer hours attendances call outs
spent actively attending incident)
…to attend to these incidents
All figures quoted are based on incidents attended by fire and rescue personnel between
01/04/2016 and 31/03/17 and are taken from our Incident Recording System (IRS). Does
not include incidents not reported or attended.
12Medium priority incidents
691 other
301 other human 26 carbon
accidental fires**
Incidents 16/17
rescues* monoxide
incidents
*All rescues including lift
release, effecting entry and ** Includes wildfires,
hazardous material incidents chimney & vehicle fires
Trend
There has been no Other accidental There has been no
change to other fires have reduced change to carbon
human rescues over the past year monoxide incidents
Other human rescues 14 other accidental
6
seriously injured
fires
Impact
0 6 other human
Other accidental fires
seriously injured rescues
Carbon monoxide 6 1 carbon monoxide
seriously injured per week
Other human Other accidental
Carbon monoxide
rescues fires
Resources
1779 hours 6741 firefighter 28 appliance
(Total firefighter & officer hours attendances call outs
spent actively attending incident)
All figures refer to 2016/17 and based on incidents attended by fire and rescue personnel
between 01/04/2016 and 31/03/17 from our Incident Recording System (IRS).
13Standard priority incidents
507 automatic 96 flooding &
fire alarms water rescues
114 deliberate
Incidents
primary fires
82 animal
231 deliberate 112 accidental assistances
secondary fires non domestic fires
There has been no Deliberate Flooding & water
Trend
change to secondary fires rescues and
deliberate primary have reduced over accidental non-
fires & automatic the past year domestic fires have
fire alarms reduced
Deliberate primary 2 flooding &
fires water rescues
2 accidental non
Impact
domestic fires
1 9 automatic fire
seriously injured alarms
Accidental non- Flooding & Deliberate
domestic fires water rescues secondary fires
Resources
3927 hours 675 firefighter 252 appliance
(Total firefighter & officer hours attendances call outs
spent actively attending incident)
All figures refer from 1st April 2016 to 31st March 2017 and based on incidents
attended by fire and rescue personnel between 01/04/2016 and 31/03/17 from our
Incident Recording System (IRS).
14Injury road traffic collisions
Injury collisions and casualties
In Great Britain in
2016, 136,621
injury collisions
were recorded by
the police, of which
1,695 resulted in at
least one fatality 5.
In Cornwall, the
police recorded
1203 injury
collisions, of which
22 resulted in at
least one fatality 6.
There has been a
38% decrease in
the number of
injury collisions and
a 21% increase in
the number of KSI
collisions 7 on roads
in Cornwall since
2006, while traffic
has increased by
11%
The Department for
Transport (DfT) has
calculated the
average societal
cost of a road traffic
collision taking into account various factors. Using 2016 figures, it estimates that
the average value of preventing a fatal collision is £1.8 million, a serious collision
is £210,000, and a slight casualty is £16,000. Based on these figures, the
5
https://www.gov.uk/government/statistics/reported-road-casualties-great-britain-annual-report-
2016
6
Data tables and severity classification definitions can be seen in Appendix 1
7
It is common practice to combine the fatal and serious collisions and casualties into what’s
known as ‘killed and seriously injured’, or KSIs – see severity definitions in Appendix 1 for detailed
descriptions of each classification.
15average value of preventing injury collisions in Cornwall in 2016 is approximately
£130 million.
Cornwall Fire and Rescue Service (CFRS) does not attend all road traffic
collisions (RTCs), but the service is responsible for education, training, and
publicity (ETP) for preventing collisions as part of its wider community safety
activities. ETP forms one third of the ‘three Es’, all jointly responsible for road
safety and prevention work: the three Es are:
• Engineering in the form of Highways England and Cormac;
• Enforcement in the form of Devon and Cornwall Police; and
• ETP (Education, training and publicity) as delivered by Resilient Cornwall,
including CFRS
CFRS attended just 14% of injury collisions in 2016. The visual below
show that the service attends a higher proportion of higher severity collisions:
10 of 22
11%
21%
All police-recorded injury collisions
16Fatal collisions and casualties
In Cornwall, there were 22 fatal collisions and 22 people fatally injured on
roads in 2016. Last year we reported 8 fatal collisions and 9 people fatally
injured for the calendar year 2015, which was an unusually low number of
fatalities.
The change in fatal
collisions shows a
marked decrease
when plotted
against a traffic
growth index
starting from 2006.
National
Nationally, 1,792
people were killed
in reported road
traffic accidents in
2016, 4% higher
than 2015, but this
change is not
statistically
significant: the
trend in road
deaths has been
broadly flat since
2010 and reduced
by 44% since 2006.
Benchmarking 8
Cornwall ranks 9 9th
out of 21 shire
authorities 10 and
110th out of 152
local authorities
across Great
Britain.
8
Takes into account population, traffic volume, and road length
9
First rank represents the lowest rate of collisions
10
Shire authorities included are: West Sussex, Somerset, Warwickshire, Shropshire,
Wiltshire, Oxfordshire, County Durham, Suffolk, Cumbria, and Lincolnshire
17Serious collisions and casualties
In Cornwall, there were 247 serious collisions and 277 people seriously injured
on the roads in 2016. This compares to 186 serious collisions and 219 people
seriously injured in 2015.
New
While there is recording
evidence of a system
significant increase
in collisions since
2009, any
comparison
between 2015 and
2016 should be
interpreted with
caution.
This is because of
a change to the
system used for
recording collisions
by around half of
all police
authorities,
including Devon
and Cornwall 11.
It is thought that
some serious
injuries were
misclassified as
slight before the
police force
changed to the
new recording
system, and so the
number of people
seriously injured
would have been
underestimated as
a result.
11
Changes to planned statistical releases, Road accidents and safety statistics, DfT:
https://www.gov.uk/government/collections/road-accidents-and-safety-statistics#publications-
2017
18National
Nationally, 24,101 people were seriously injured in reported road traffic
accidents in 2016, 9% higher than 2015.
Benchmarking 12
Cornwall ranks 13
16th out of 21 New
shire 14 authorities recording
and 108th out of system
152 local
authorities across
Great Britain,
taking into
account
population, traffic
volume, and road
length.
Slight collisions
and casualties
In Cornwall, there
were 934 slight
collisions and 1484
people with slight
injuries from road
traffic collisions in
2016. Last year
we reported 1037
slight collisions
and 1499 people
with slight injuries
for the calendar
year 2015.
Once again, any
comparison
between 2016 and
2015 should be
treated with caution: some serious injuries are likely to have been classified as
slight injuries in collisions prior to the new recording system 2016. Additionally,
not all collisions where people are slightly injured are reported to the police.
12
Takes into account population, traffic volume, and road length
13
First rank represents the lowest rate of collisions
14
Shire authorities included are: West Sussex, Somerset, Warwickshire, Shropshire,
Wiltshire, Oxfordshire, County Durham, Suffolk, Cumbria, and Lincolnshire
19Road safety prevention priorities
The high risk driving behaviours are:
More information about these is contained in the ‘collision causes’ section.
The Priority Road User Groups (PRUGs) are:
More information about these is contained in the Priority Road User Group
section.
20Collision causes
Contributory factors
The high risk driving behaviours come from the top ten contributory factors
recorded for collisions in Cornwall. They are shown in the bar chart below:
‘travelling too fast for conditions’ and ‘exceeding speed limit’ are combined to
create a new factor: ‘speed’, which ranks third:
• Economic activity: collisions increase as economic development
increases, while during economic stagnation, collisions involving high-
risk groups and the riskier driving behaviours are disproportionately
reduced
• Distance people travel
• Mix of transport modes used
• Behaviour of drivers, riders and pedestrians
• Mix of groups of people using the road (for example: changes in the
number of newly qualified or older drivers)
• External effects such as the weather, which can influence behaviour.
We are looking at speed during 2018: we aim to compare the proportion of KSIs
that happen on roads of different speed limits, where police allocated the
contributory factor exceeding speed limit.
Last year, around 60% of injury collisions in Cornwall involved people
from the Priority Road User Groups (PRUGs), so further analysis has
attempted to identify the common driving errors and behaviours contributing to
the other 40% of collisions.
The police report that it can be difficult to find any one party to blame for a
collision, so the reporting form gives space to attribute contributory factors to
individuals involved. That is, a particular road user is allocated one or more
contributory factors in a collision.
The police can choose up to six contributory factors from a list of 78, including
one free-text factor if something happened that is not on the list. Contributory
factors can be allocated to injured or uninjured driver, riders, pedestrians, and
passengers.
21Contributory factors fall into various categories, such as human (for example:
failing to look properly or losing control); environmental (for example: objects in
the carriageway); and vehicle defects (for example: worn tyres).
Overall, the evidence
suggests that collisions are
less about the state of the
road and more about
people’s behaviour, as
shown in the pie chart here:
87% of all contributory
factors in collisions in
Cornwall.
Enforcement
The graph below shows the top ten motoring offence prosecutions in Devon
and Cornwall during 2015-2016. 15
All minor motoring offences where the offender indicates a guilty plea are dealt
with at the Bodmin court. This is the majority of these offences.
15
Note: it is not possible to identify rtc-related offences; this is only prosecutions – fixed penalty
notices are dealt with separately and the police don't have data for that.
Data source: Force prosecution recording system – NSPIS Case
Data processing:
Qlikview Court Cases report
Case created date between 1st April 2014 and 31st March 2016
Home office offence codes 170, 802 to 825
Data limitations: In 2016 a new Force prosecution data system went live. Data extraction from this
system is still under development. The latest prosecution data we have available is given. There is
no way of identifying where the offence occurred from the data available to us, so figures are
given for the Force area only.
22Driving behaviour
Research16 conducted by the London School of Economics and Political Science
(LSE) in partnership examines how, as road users, we can all sometimes engage
in ‘combative driving’, and at other times we can co-operate with other drivers in
‘considerate driving’. Focus groups discussed driving behaviour, using helmet-
mounted camera footage in structured interviews, and the researchers used the
results to shape the surveys of nearly 9,000 people from 15 European countries.
The LSE lists seven driving personalities, which “emerge in different situations
when drivers interact with others on the road”. They are, as quoted directly from
the LSE 17:
• The Teacher: needs to make sure other drivers know what they have
done wrong and expects recognition of his/her efforts to teach others.
• The Know-it-all: thinks he/she is surrounded by incompetent fools
and contents themselves with shouting condescendingly at other
drivers while being protected in their own car.
• The Competitor: needs to get ahead of all other drivers and is
annoyed when someone gets in the way of that. He/she might
accelerate when someone tries to overtake them or close a gap to
prevent anyone from getting in front of them.
• The Punisher: wants to punish other drivers for any perceived
misbehaviour. Might end up getting out of his/her car or approaching
other drivers directly.
• The Philosopher: accepts misbehaviour easily and tries to rationally
explain it. Manages to control his/her feelings in the car.
• The Avoider: treats misbehaving other drivers impersonally,
dismisses them as a hazard.
• The Escapee: listens to music or talks on the phone to insulate
him/herself. Escapees distract themselves with selected social
relationships so that they do not have to relate to any of the other
drivers on the road. It’s also a strategy for not getting frustrated in the
first place.
Rather than personality types that we embody permanently, these are ‘scripts’
that we can adopt for a short time, for example to negotiate a roundabout, or
could be our general orientation at the start of the journey.
16
The Ripple Effect of Drivers’ Behaviour on the Road: A Study on Drivers’ Behaviour Executive
Summary, http://www.goodyear.eu/corporate_emea/images/3.12.2015%20-
%20Executive%20Summary%20-%20FINAL_tcm2447-180821.pdf.
17
You Auto Know: Which Driving Personality are You?, London School of Economics,
http://www.lse.ac.uk/newsAndMedia/news/archives/2015/09/YouAutoKnowWhichDrivingPersonalit
yAreYou.aspx, 1st September 2016.
23The authors conclude that there is a need for initiatives to be tested to
‘encourage greater awareness of the perspectives of the other drivers
we interact with. Drivers themselves create the very environments they often
find stressful and to which they can respond combatively’ and ‘Just as combative
driving can generate a chain of indirectly reciprocal provocations between
drivers, considerate driving can create a ripple effect of safer journeys.’
24Where did collisions happen?
The map here shows where collisions
occurred during 2016.
We counted the number of collisions that
occurred on each road and ranked them in
descending order. This list shows the top
ten:
Top 10 roads
A30
A39
A390
A38
A388
A389
A3047
A3058
B3254
A394The DfT: ‘although all accidents have a cause and that cause is often someone
making a mistake or exhibiting dangerous or thoughtless road behaviour, when
and where fatalities occur is essentially random’ 18.
Cormac’s Engineering Design Group have analysed the A and B Roads for the
local authority in terms of their collision history and produced the following top
ten. The majority of the A30 and A38 are trunk roads and are maintained
by Highways England and therefore were not included in the analysis. 19
Rank Road section description
1 A388 (part) Carkeel to Viverdon Down
2 A3073 Bude
3 B3271 Saltash
4 B3277 Chiverton Cross to St Agnes
5 A3059 St Columb to Newquay
6 A3075 Chiverton Cross to Newquay
7 B3298 Scorrier
A390 (part) Chiverton Cross Roundabout A30/A390
8
junction to Truro A39 Arch Hill roundabout
9 A3082 St Blazey
10 A3047 Redruth and Camborne
18
https://www.gov.uk/government/uploads/system/uploads/attachment_data/file/533293/rrcgb-
main-results-2015.pdf
19
Information provided by Helen Galligan from Cormac’s Engineering Design Group, who notes the
following: “A ranking was based on a combination of accident numbers and accident rate to avoid
bias towards very high flow or very low flow roads. The Local Authority roads have been ranked
using collision data over a six year period (1 October 2008 to 30 September 2014). It should be
noted that this list is not a perfect measure for ranking of roads as there is always an element of
skew, that is, accidents are relatively random events and have the tendency to fluctuate over time
through simple random variation; this will particularly be evident on relatively short stretches of
road.”Priority Road User Groups
The Priority Road User Groups (PRUGs) are motorcyclists, pedal cyclists, younger
and older drivers, and pedestrians. These are determined using police recorded
injury collisions data, STATS19.
The service also adopts national campaigns and initiatives, for example road
users using mobile phones, wearing seatbelts, and workplace driving.
Evidence for these campaigns is driven by national research.
Information for targeting education, training and publicity initiatives
The following pages summarise the results of analysis police records of collisions
in Cornwall.
Notes:
• It is common practice to combine the fatal and serious collisions and
casualties into what’s known as ‘killed and seriously injured’, or KSIs:
information refers to all injury collisions, unless marked as KSIs.
• Each table of information has two sets of contributory factors listed.
These are: on average, how many contributory factors were allocated to
the PRUG; and how many were allocated to others involved? For example
for every ten contributory factors allocated to road users involved in a
collision with an pedal cyclist, an average of four contributory factors were
allocated to the pedal cyclist and six were allocated to other road users
involved.• To help us understand who we should be focusing our prevention activities
on we have also used the Acorn customer segmentation toolkit. This
software allows us to identify a customer type based on the road user’s
postcode. By classifying road users in this way we are able to understand
more about behaviour and lifestyles which provides valuable information
about how to develop our prevention activities. Detailed descriptions for
each group can be found in the Appendix.
Motorcyclists and pedal cyclists
• Motorcycles make up less than 1% of traffic, but are involved in more
than 15% of injury collisions and almost 30% of KSI collisions.
• Pedal cycles make up less than 0.5% of traffic, but are involved in
almost 6% of injury collisions and more than 7.5% of KSI collisions.
This means that not only are they more likely to be involved in collisions than
any other road user, when they are involved they are more likely to be injured.
Within the motorcycling community, there are two distinct groups: smaller
and larger bikes, which differ in characteristics.
28Motorcycles up to125cc
2016 Comparison with 5 year average (2012-2016)
KSI collisions Injury collisions
Who should be targeted?
Age: 16-28
Acorn groups:
Owner occupiers in small towns and villages
Labouring semi-rural estates
Larger families in rural areas
Contributory factors (CFs)
Police allocated 6 in every 10 CFs to this group in injury collisions
Top 5 allocated to this group: Top 5 allocated to others involved:
Inexperienced or learner driver/rider Failed to look properly
Careless/Reckless/In a hurry Failed to judge other persons path or speed
Travelling too fast for conditions Following too close
Not displaying lights at night or in poor visibility Travelling too fast for conditions
Slippery road (due to weather) Poor turn or manoeuvre
Circumstances Road
30mph Dry or wet/damp
Average of 2 vehicles involved
Manoeuvre: going straight ahead or turning right 60mph
Junction type:
Not within 20 metres of a junction
T & staggered junction
Weather: fine without high winds
29Motorcycles over 125cc
2016 Comparison with 5 year average (2012-2016)
KSI collisions Injury collisions
Who should be targeted?
Age: 18-65
Acorn groups:
Owner occupiers in small towns and villages
Fading owner occupied terraces
Semi-skilled workers in traditional neighbourhoods
Larger families in rural areas
Contributory factors (CFs)
Police allocated 6 in every 10 CFs to this group in injury collisions (7/10 in KSI collisions)
Top 5 allocated to this group: Top 5 allocated to others involved:
Careless/Reckless/In a hurry Failed to look properly
Travelling too fast for conditions Poor turn or manoeuvre
Loss of control Careless/Reckless/In a hurry
Failed to judge other persons path or speed Distraction in vehicle
Exceeding speed limit Failed to judge other persons path or speed
Circumstances Road
30mph
Average of 2 vehicles involved Dry or wet/damp
Manoeuvre: going straight ahead or turning right 60mph
Junction type:
Not within 20 metres of a junction
T & staggered junction
Weather: fine without high winds
30Pedal cyclists
2016 Comparison with 5 year average (2012-2016)
KSI collisions Injury collisions
Who should be targeted?
Age: 6-65 with peaks around 11-20 and 36-50
Acorn groups:
Owner occupiers in small towns and villages
Larger families in rural areas
Semi-skilled workers in traditional neighbourhoods
Retired and empty nesters
Fading owner occupied terraces
Low income large families in social rented semis
Contributory factors (CFs)
Police allocated 4 in every 10 CFs to this group in injury collisions
Top 5 allocated to this group: Top 5 allocated to others involved:
Failed to look properly Failed to look properly
Loss of control Failed to judge other persons path or speed
Failed to judge other persons path or speed Careless/Reckless/In a hurry
Cyclist entering road from pavement Poor turn or manoeuvre
Careless/Reckless/In a hurry Too close to cyclist, horse or pedestrian
Circumstances Road
Average of 2 vehicles involved
30mph Dry or wet/damp
Manoeuvre: going straight ahead or turning right 60mph
Junction type:
Not within 20 metres of a junction
T & staggered junction
Weather: fine without high winds
31Older drivers
Older drivers are often identified as a priority road user because old age can
bring about an increased likelihood of experiencing a collision, as well as
an increased risk of death or more serious injuries when collisions do
occur.
National figures show that casualties aged over the age of 60 have increased
while fatalities overall have remained stable over the past three years. The DfT
notes that a population increase in this age group may partly explain the slight
upturn in fatalities seen in this age group in the past few years.
In Cornwall, the risk of injury increases with age in this group, so drivers aged
over 75 should be prioritised for prevention activity over those aged between
61 and 75.
32Drivers aged 61-75
2016 Comparison with 5 year average (2012-2016)
KSI collisions Injury collisions
Who should be targeted?
Acorn groups:
Farms and cottages
Retired and empty nesters
Owner occupiers in small towns and villages
Semi-skilled workers in traditional neighbourhoods
Larger families in rural areas
Contributory factors (CFs)
Police allocated 6 in every 10 CFs to this group in injury collisions (7/10 in KSI collisions)
Top 5 allocated to this group: Top 5 allocated to others involved:
Illness or disability, mental or physical Travelling too fast for conditions
Loss of control Loss of control
Fatigue Slippery road (due to weather)
Poor turn or manoeuvre Exceeding speed limit
Distraction in vehicle Road layout (eg bend, hill, narrow road)
Circumstances Road
Average of 2 vehicles involved
30mph Dry or wet/damp
Manoeuvre: going straight ahead or turning right 60mph
Junction type:
Not within 20 metres of a junction
Weather: fine without high winds
33Drivers aged 76+
2016 Comparison with 5 year average (2012-2016)
KSI collisions Injury collisions
Who should be targeted?
Acorn groups:
Retired and empty nesters
Owner occupiers in small towns and villages
Farms and cottages
Contributory factors (CFs)
Police allocated 7 in every 10 CFs to this group in injury collisions
Top 5 allocated to this group: Top 5 allocated to others involved:
Illness or disability, mental or physical Failed to look properly
Failed to look properly Careless/Reckless/In a hurry
Failed to judge other persons path or speed Failed to judge other persons path or speed
Loss of control Poor turn or manoeuvre
Poor turn or manoeuvre Slippery road (due to weather)
Circumstances Road
Average of 2 vehicles involved 30mph Dry or wet/damp
Manoeuvre: going straight ahead or turning right 60mph
Junction type:
Not within 20 metres of a junction
T & staggered junction
Weather: fine without high winds
34Young car drivers and passengers
Young car drivers and passengers are a particularly important road user group
as they are significantly over-represented in road traffic collisions and the
most likely age group to experience a collision 20.
Nationally, the number of fatalities and casualties involving young car drivers is
seeing a long-term downward trend with 2013 seeing the lowest number on
record. Despite young car drivers constituting only 7% of all UK licence-holders,
they were involved in 20% of all fatal collisions nationally.
Nationally, there has also been a decline in the number of young adults (aged
17-20) holding driving licences. It has been suggested that this is part of a
wider, global social trend of lower licence-holding amongst young people, and
may explain why risks for this age-group have extended to around age 30 in
Cornwall.
National initiatives for younger car drivers and passengers are targeted to those
aged 17 to 24, but in Cornwall the age group extends from 17 to 30. For
prevention purposes, a need has been expressed to break this group into two
groups for easier targeting, so infographics are produced for 17 to 19 year olds
who are likely to still be in education, and those aged 20 to 30.
20
Facts On Young Car Drivers, Department for Transport, (2015).
35Young car drivers and passengers aged 17-19
2016 Comparison with 5 year average (2012-2016)
KSI collisions Injury collisions
Who should be targeted?
Acorn groups:
Owner occupiers in small towns and villages
Farms and cottages
Semi-skilled workers in traditional neighbourhoods
Larger families in rural areas
Retired and empty nesters
Contributory factors (CFs)
Police allocated 6 in every 10 CFs to this group in injury collisions (8/10 in KSI collisions)
Top 5 allocated to this group: Top 5 allocated to others involved:
Careless/Reckless/In a hurry Failed to look properly
Exceeding speed limit Failed to judge other persons path or speed
Loss of control Careless/Reckless/In a hurry
Slippery road (due to weather) Travelling too fast for conditions
Travelling too fast for conditions Loss of control
Circumstances Road
Average of 2 vehicles involved 30mph Dry or wet/damp
Manoeuvre: going straight ahead 60mph
Junction type:
Not within 20 metres of a junction
Weather: fine without high winds
36Young car drivers and passengers aged 20-30
2016 Comparison with 5 year average (2012-2016)
KSI collisions Injury collisions
Who should be targeted?
Acorn groups:
Owner occupiers in small towns and villages
Farms and cottages
Semi-skilled workers in traditional neighbourhoods
Contributory factors (CFs)
Police allocated 6 in every 10 CFs to this group in injury collisions (8/10 in KSI collisions)
Top 5 allocated to this group: Top 5 allocated to others involved:
Loss of control Aggressive driving
Careless/Reckless/In a hurry Failed to look properly
Poor turn or manoeuvre Careless/Reckless/In a hurry
Impaired by drugs (illicit or medicinal) Poor turn or manoeuvre
Travelling too fast for conditions Slippery road (due to weather)
Circumstances Road
30mph Dry or wet/damp
Average of 2 vehicles involved
Manoeuvre: going straight ahead 60mph
Junction type:
Not within 20 metres of a junction
Weather: fine without high winds
37Pedestrians
In 2014, pedestrian casualties had the largest rise of any of the road user
groups in Great Britain, but this dropped in 2015 only to return to 2014 levels in
2016. In Cornwall, there has been a steady decrease in the number of
pedestrian casualties overall, but pedestrian casualties killed or seriously
injured did not change significantly over the same period.
38Pedestrians
2016 Comparison with 5 year average (2012-2016)
KSI collisions Injury collisions
Who should be targeted?
Age: 11-16 and 71+
Acorn groups:
Owner occupiers in small towns and villages
Retired and empty nesters
Semi-skilled workers in traditional neighbourhoods
Labouring semi-rural estates
Poorer families, many children, terraced housing
Contributory factors (CFs)
Police allocated 4 in every 10 CFs to this group in injury collisions (5/10 in KSI collisions)
Top 5 allocated to this group: Top 5 allocated to others involved:
Failed to look properly Failed to look properly
Pedestrian wearing dark clothing at night Careless/Reckless/In a hurry
Dangerous action in carriageway (eg playing) Other
Failed to judge vehicles path or speed Dazzling sun
Careless/Reckless/In a hurry Impaired by alcohol
Circumstances Road
Average of 1 vehicle involved 30mph Dry or wet/damp
Junction type:
Not within 20 metres of a junction
Weather: fine without high winds
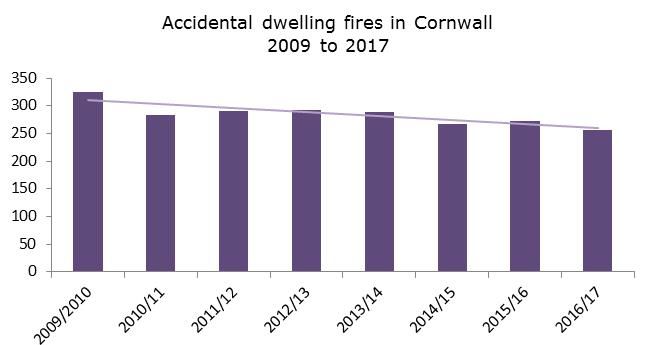
39Accidental dwelling fires
Nationally, accidental dwelling fires have continued to follow a downward trend
and the latest figures for Cornwall show that the number of accidental dwelling
fires reduced by 17 incidents on the previous year. Last year there were 256
accidental dwelling fires during which three people died, one person was
seriously injured, 28 people were injured slightly and five people were rescued.
Although, the 2016/17 figure is lower than the average for the past five years,
statistically it is not significantly lower. Cornwall currently has the second lowest
rate of house fires in the South West region 21.
New evidence suggests that the proportion of incidents reported to the fire and
rescue service each year is actually substantially lower than the number that are
occurring in people’s homes. National evidence22 shows that 70% of fires are
extinguished by people in their homes and are not reported to the fire and
rescue service. This new research has raised questions about the best way to
advise the public on dealing with a house fire.
While the number of accidental dwelling fires has declined the number of
people killed or seriously injured in house fires in Cornwall has
remained relatively unchanged over the past eight years. However, it
should be noted that these numbers are very low and therefore can fluctuate
year-on-year.
New figures from the Home Office show that while the number of fires has fallen
nationally the number of people aged 65 and over killed in a fire has risen
by 22% between 2014/15 and 2016/17 23.
21
Ranked second out of five fire authorities in the South West.
22
Why human behaviour really matters: Kent Fire and Rescue Service, National Fire Chief Council
Conference, October 2017
23
Fire and rescue service funding needs to address increased elderly risk factor, Local Government
Association, October 2017
40Fatal fires in Cornwall
National and local fire data confirms that it is often the most vulnerable, elderly
and those in poor health that are at greatest risk of dying in a house fire. Over
the past five years, 11 people have died and 13 people have been seriously
injured in accidental dwelling fires in Cornwall.
Property
type
Bungalow – single occupancy
Human
factors Not known/ none House– single
occupancy
Caravan/ mobile
home
Disabled
Flat/
Self-contained
maisonette
sheltered
Falling housing
asleep/
asleep (not
drugs/
alcohol) Bedroom
Other Utility
medical
condition Living room
Bathroom
Fire start
location
Kitchen
The most common cause of fatal fires in Cornwall is ‘careless handling’,
followed by ‘cooking – chip pan/ deep fat fryer’ and ‘person too clost to heat
source’. Prevention activities to prevent deaths from fires in the home should
focus on improving residents’ behaviour in these areas.
We also know that six out of the eleven people that died had smoke alarm
systems fitted in their homes. Although, it is unknown if all of these alarms
were in good working order. We do know that at one fatal incident alarms were
sounding but that neighbours reported that the occupant did not leave the
41property. Two thirds of homes where accidental dwelling fires have occurred had
smoke alarm systems fitted.
New research carried out by Derbyshire Fire and Rescue Service has also
highlighted that many children are not woken by the sound of a smoke
alarm. The study 24 found that 80% of children aged 2 to 13 did not respond to a
traditional smoke alarm sounding.
Factors that make someone more vulnerable to fire
In 2014 a study 25 was published which examined all fire deaths in the South
West of England to try to identify any contributory factors. This report was based
on 88 fire deaths that occurred between 2008 and 2013. It found that there
were seven common factors (see diagram below) that were identified. The most
common factor, living alone, was identified in 53% of cases.
Living
alone
Poor Older
house- people
keeping
Common factors in
fire deaths in the
South West
Limited
Drugs
mobility
Mental
Alcohol
health
24
‘Most children sleep through smoke alarms’, The Guardian, February 2017
25
Fatal fires in the South West: A collaborative review. (2014). South West UK Fire & Rescue
Services
42Emollient creams
Paraffin based emollient creams have been highlighted as a potential fire risk,
particularly for vulnerable patients. The government has advised patients against
smoking or using naked flames near to medical dressings or bedding that has
been in contact with emollient creams.
The advice comes after a number of vulnerable people have died who were using
emollient creams. Investigations have shown that the emollient creams acted as
an accelerant to the fire and were a likely contributory factor in these deaths.
43Accidental dwelling fires
2016 Comparison with 5 year average (2012/13 - 2016/17)
KSI casualties All accidental dwelling fires
Who should be targeted?
Age: 60+ (very high risk: 85+)
Acorn groups: Key risk factors:
Pensioners in social rented flats Living alone
Poorer social renting families Limited mobility
Younger social renting adversity Smoking
Struggling owner occupier families Alcohol
Older people in social rented estates Hoarding
Struggling social renting families Mental health
Young renters in flats Drugs*
Deprived younger families *prescription and illegal
Elderly in terraced estates
Retired couples in social rented estates
Contributory factors – factors with fatalities in bold
Cause
Cooking
Faulty equipment
Faulty electrical supplies
Carelessness/negligence/loss of control
Too close to heat source
Main source
Cooking appliance
Human factors (where known)
Distraction
Falling asleep/ asleep
Other medical condition
Accidental dwelling fires (ADF)
ADF with fatal/serious injury
44Who is most likely to have an accidental dwelling fire?
To help us understand who we should be focussing our prevention activities on
we have used the Acorn customer segmentation toolkit. This software allows us
to identify which households are at greatest risk of fires in Cornwall. This is
based on a classification system that puts each household into one of 62
different household types. By classifying households in this way we are able to
understand more about similar patterns in behaviour and lifestyles which
provides valuable information when developing our prevention activities. The
following information is based on analysis of accidental dwelling fires that have
occurred in Cornwall over the past five years 26. For more information about
these household types, how best to reach them and how Acorn works please
read the Acorn User Guide.
Analysis of accidental dwelling fires in Cornwall shows that older people, those
living in social housing, young renters in flats and those that are most
financially stretched have experienced the highest rates of accidental dwelling
fires in Cornwall. Evidence shows that people that live in social housing are
twice as likely to experience an accidental dwelling fire in comparison with
the Cornwall average.
Who is most likely to be injured in accidental dwelling fires in Cornwall?
Further analysis has been carried out to understand who is most likely to be
killed or injured in an accidental dwelling fire in Cornwall. This has shown that
households that do not fall within our expected definition of high risk
can also experience very serious and fatal house fires. Although deprived
households, elderly people and people living in social housing experience the
highest rates of house fires, we have experienced a number of deaths and
serious injuries in homes that do not fall into these categories. Although only a
small sample size, evidence shows that affluent elderly households rank
highest for injuries due to accidental dwelling fires in Cornwall over the last five
years.
Who has experienced the most serious accidental dwelling fires?
Over recent years, fire and rescue services have developed a better way of
recording fire severity in order to understand more about serious fires and how
to tackle them. Within the South West we classify all accidental dwelling fires as
26
Analysis based on 1377 accidental dwelling fires in Cornwall where a unique property reference
number (UPRN) could be obtained. 11% of these incidents had no UPRN listed so could not be
included in the results. Where very low numbers of fires have occurred (less than 5 over 5 years)
these types have been excluded.
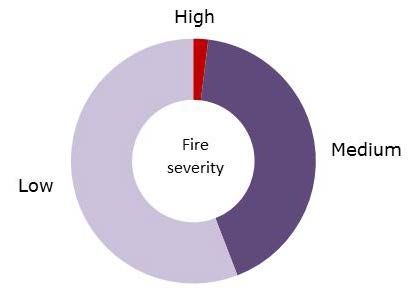
45high, medium or low severity. This helps us to understand more about
differences between the most serious and least serious fires and how to prevent
them. The majority of fires last year were classified as low (56%) or medium
severity (42%). A small number of fires last year were deemed to be of high
severity (2%) and this picture has been consistent over the past five years.
This analysis shows that although it is typically people in social housing, older
people and poorer families at greatest risk, affluent elderly households and
young families have also experienced some of the most serious accidental
dwelling fires in Cornwall.
The following table shows the Acorn household types that experience the highest
rates of accidental dwelling fires, the most serious injuries and the most serious
fires in Cornwall. More detailed descriptions about these household types can be
found in Acorn User Guide.
46Table - Acorn groups at greatest risk of accidental dwelling fires
Households in Fires Fatalities Fire liklihood Injury severity Fire severity ranking
Acorn type
Cornwall (5 years) (5 years) (1 most likely) (1 most likely) (1 most likely)
Pensioners in social rented flats 4,644 64 1 1 4 7
Poorer social renting families 4,138 51 0 2 9
Younger social renting adversity 1,475 18 0 3
Struggling owner occupier families 2,261 26 0 4
Older people in social rented estates 1,588 18 0 5
Struggling social renting families 6,320 63 0 6
Young renters in flats 2,272 21 0 7
Deprived younger families 2,881 24 0 8
Elderly in terraced estates 3,600 29 0 9
Retired couples in social rented estates 1,260 10 0 10
Affluent elderly 17,096 56 3 1 5
Rural pensioners 23,748 80 2 2 1
Green-belt families 24,486 87 2 3 2
Post industrial pensioners 7,830 36 0 5 8
Younger privately rented adversity 4,318 27 0 6
Contented elderly 1,274 9 1 7
Young professionals 5,866 21 0 8
Young families in terraces 17,954 81 0 9 3
Conventional middle-agers 6,407 27 0 10
Renting young families 12,013 80 0 4
Struggling social renting families 6,320 63 0 6
Asset-rich retirees 11,615 34 0 10What is the cause of most accidental dwelling fires?
The majority of accidental dwelling fires in Cornwall start in the kitchen, followed
by the living room and then the bedroom. Three quarters of all kitchen fires
in Cornwall are started by cooking appliances. In the living room heating
equipment is the most commonly identified ignition source followed by smoking
and then electricity supply. Within the bedroom domestic style appliances are
listed as the most common ignition source followed by smoking and then heating
equipment.
Just over two-thirds of accidental dwelling fires have no human factors
attributed to them in Incident Recording System (IRS). Where factors have
been identified distraction has been the biggest cause of these fires, followed by
sleeping (not drugs or alcohol) and other medical conditions. Further work needs
to be undertaken to determine if these cannot be determined by the officer in
charge or whether they are not being recorded after further investigation has
taken place.
Human factors listed in accidental dwelling fires
Two thirds of
accidental dwelling
fires have no
human factors
attributed to them
Known
Distraction (14%) None/ not
Sleep not drugs or alcohol known
(4%)
Other medical condition (4%)
Disabled (1%)
Excessive/ dangerous storage
(1%)
Household type and make-up can present its own individual risks in terms of
means of escape and exposure to potential fire risks. The majority (70%) of
accidental dwelling fires in Cornwall occur in single occupancy homes.
Over the past five years the service has also attended 37 fires in caravans/mobile homes used as permanent dwellings. Over the same period there have
been 29 accidental dwelling fires in properties of 4 more storeys high and two of
in buildings 10 or more storeys high.
Just under two-thirds of our accidental dwelling fires were attended by the
service within 10 minutes and one quarter between 10-15 minutes. There
appears to be no clear link between response times provided by the
service and severity of injury or incident in accidental dwelling fires.
Analysis of our fatal and serious injuries shows that the majority of incidents
where a fatal or serious injury occurred were attended by the service within a 10
minute response time. We also know that the majority of our high severity fires
were attended by the service within 10 minutes.
Where should we be targeting?
To help us prioritise the households at greatest risk of a fire we have created our
Prevention Tool. The tool uses a range of data and information about high risk
factors for accidental dwelling fires to help identify the homes most likely to
experience a fire. This information is used by operational staff to direct and
prioritise our living safe and well visits and ensures we focus our resources on
the most vulnerable households.
49Threats and opportunities
Broadening health and well-being agenda
Over recent years the impact the fire and rescue service has on health and well-
being has been widely recognised and our remit has broadened. To
acknowledge this change the ‘home fire safety check’ visits we carry out in
thousands of homes across Cornwall are now being called ‘safe and well’ visits
and will cover a much wider range of issues than fire safety.
In Cornwall we have identified five
behaviours that lead to five health
conditions (cardiovascular disease, cancer,
mental illness, lung disease and
musculoskeletal problems) that cause the
majority of deaths and disability in
Cornwall and 20% of NHS costs are
associated with these behaviours 27. These
are: smoking, physical inactivity,
unhealthy diets, excess alcohol, and
lack of social connections. All of these
behaviours will be addressed as part of
our new safe and well visits.
A recent review found that fire and rescue
services response to medical/ co-
responder incidents not only helped to
save lives but also helped public services
to save money. Firefighters co-responding
to critical incidents do not only improve
survival probability and life expectancy.
An evaluation of a number of fire and
rescue services in the UK found that for every £1 invested in co-responding the
return on investment is between £5.67 and £14.40 28.
Grenfell tower
Following the devastating fire at Grenfell Tower where at least 80 people are
believed to have died there has been a growing pressure on councils to assure
residents and social housing tenants that they are safe. Following this tragedy,
27
Vision for Cornwall Evidence Base, 2017, Cornwall Council
28
Broadening Responsibilities, National Joint Council, January 2017
50You can also read