5 Comprehensive Monitoring of Wildfires in Europe: The European Forest Fire Information System (EFFIS) - European Commission
←
→
Page content transcription
If your browser does not render page correctly, please read the page content below
5
Comprehensive Monitoring
of Wildfires in Europe:
The European Forest Fire
Information System (EFFIS)
Jesús San-Miguel-Ayanz et al.*
European Commission, Joint Research Centre
Italy
1. Introduction
Fires are an integral component of ecosystem dynamics in European landscapes. However,
uncontrolled fires cause large environmental and economic damages, especially in the
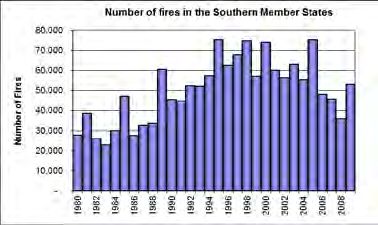
Mediterranean region. On average, about 65000 fires occur in Europe every year, burning
approximately half a million ha of wildland and forest areas; most of the burnt area, over
85%, is in the European Mediterranean region. Trends in number of fires and burnt areas in
the Mediterranean region are presented in Fig. 1.
Recent analyses of the available data in the European Forest Fire Information System (EFFIS)
show that over 95% of the fires in Europe are human-induced. The split of causes shows that
most of them are due to misuse of traditional practices of straw burning of shrub-burning to
recover areas for cattle feeding.
Although European countries have collected information on forest fires since 1970s, the lack
of harmonized information at the European level has prevented a holistic approach for
forest fire prevention in the Region. The European Forest Fire Information System (EFFIS)
has been developed jointly by the European Commission (EC) services (Directorate General
Environment and the Joint Research Centre) and the relevant fires services in the countries
(forest fires and civil protection services) in response to the needs of European bodies such
as the Monitoring and Information Centre of Civil Protection, the European Commission
Services and the European Parliament.
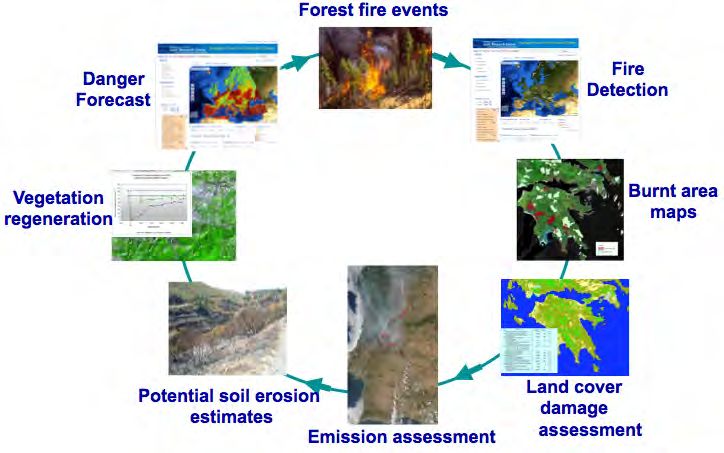
EFFIS is a comprehensive system covering the full cycle of forest fire management, from
forest fire prevention and preparedness to post-fire damage analysis (see Fig. 2). The system
is providing information to over 30 countries in the European and Mediterranean regions,
*Ernst Schulte2, Guido Schmuck1, Andrea Camia1, Peter Strobl1, Giorgio Liberta1, Cristiano Giovando1,
Roberto Boca1, Fernando Sedano1, Pieter Kempeneers1, Daniel McInerney1, Ceri Withmore1,
Sandra Santos de Oliveira1, Marcos Rodrigues1, Tracy Durrant1, Paolo Corti1, Friderike Oehler1,
Lara Vilar1 and Giuseppe Amatulli1
1European Commission, Joint Research Centre, Italy
2European Commission, Directorate General for Environment, Italy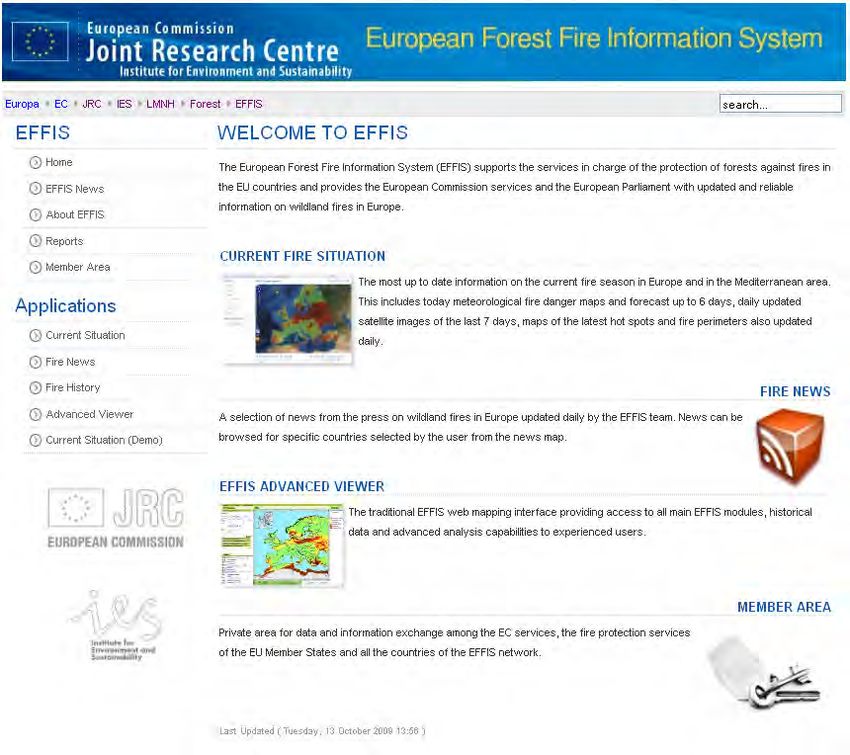
88         Approaches to Managing Disaster – Assessing Hazards, Emergencies and Disaster Impacts

and receives detailed information of forest fire events from 22 European countries. It
supports forest fire prevention and forest fire fighting in Europe through the provision of
timely and reliable information on forest fires.

Fig. 1. Number of fires and burnt areas in the European Mediterranean region (source
European Commission, 2010)

Fig. 2. Fire cycle monitored in EFFIS
This chapter presents the main components of EFFIS and the first steps towards establishing
a comprehensive monitoring of forest fires in Europe and describes the different modules of
the system. These include: Fire Danger Forecast, Active Fire Detection, Rapid Damage
Assessment and post-fire modules dealing with the analysis of land cover damages, post-
fire soil erosion, emissions estimates and dispersion of the smoke plume, and finally the
monitoring of vegetation recovery in large burnt areas.
EFFIS core applications are based on the use of remote sensing and geographic information
systems. Fire danger forecast is computed from two meteorological forecast models,
handled by the French Météo-France and the Deutsche Wetter Dienst (DWD), the later
providing weather forecast up to one week in advance. These data are used to compute a
Comprehensive Monitoring of Wildfires in Europe:
The European Forest Fire Information System (EFFIS)                                           89

common European fire danger index based on the Canadian Fire Weather Index (FWI).
Near-real time applications such as active fire detection and rapid damage assessment make
use of data provided by the MODIS sensor, on board of the NASA TERRA and AQUA
satellites for the detection of hot spots (active fires) and the mapping of burnt areas; two full
mosaics of Europe are processed daily, providing information on burnt areas produced by
large fires (over 40 ha). The system architecture is based on web data services that permit
access to information in real time through web mapping and web feature services†; the
EFFIS web interface is presented in Fig. 3.

Fig. 3. EFFIS web interface
This information is then integrated into national geographic information systems for further
analysis at the country level.
Despite the maturity of the system, the further development of EFFIS continues through the
incorporation of new modules such as those that will be used for the assessment of socio-
economic impact of forest fires as well as the harmonization of fire causes; it must be noted
that over 95% of the fires in Europe are caused by humans.
The long time-series of fire data in EFFIS - over 25 years for Mediterranean countries – is
used to model the potential effect of climate change regarding fire danger in the
Mediterranean region and the expected impact in terms of burnt areas in the region.

†   http://effis.jrc.ec.europa.eu
90             Approaches to Managing Disaster – Assessing Hazards, Emergencies and Disaster Impacts

2. EFFIS system architecture
EFFIS has been designed as a modular geographic information system. It consists of Web
based modules, a data processing chain and spatial databases that store, process and
disseminate forest fire information at a pan-European scale. The underlying system is
driven by software tools that process meteorological and optical satellite image data on a
daily basis to produce fire danger forecast and information on the perimeters of burnt areas.
EFFIS also provides access to a historical spatial database of forest fire information in
Europe that scientists and policy makers can use for retrospective analysis.
EFFIS can be considered to function as two inter-dependent systems within a GNU/Linux
environment running on two 64-bit Red Hat Linux servers. The ‘back-end’ modules are
scheduled to run on a daily basis to download and process spatial datasets to produce the
forest fire information. The ‘front-end’ components of EFFIS consist of web-based mapping
tools that publish the EFFIS layers and allow users to query and analyse the information
through a web-browser. There are also tools to retrieve and aggregate forest-fire event news
per country. These two main components are discussed in what follows.

2.1 Processing
All of the spatial and associated attribute data are stored in ORACLE Spatial, a relational
database management system, while the MODIS satellite imagery are stored as flat files.
Several Python and Bash Shell scripts that are based on the GDAL/ORG geospatial library
(Anon, 2011) have been developed to pre-process and manage raster and vector spatial
datasets that are updated on a daily basis or in some cases at a higher frequency.
Linux Bash scripts have been developed to download Moderate-resolution Imaging
Spectroradiometer (MODIS) TERRA & AQUA satellite image data from the German
AeroSpace Centre (DLR) receiving station. The satellite scenes are mosaicked to produce
pan-European mosaics at 250 meters spatial resolution, which are then incorporated into the
'Current Situation' Web viewer. They are also used as a basis for the Rapid Damage
Assessment (RDA) mapping, which is carried out by a fire expert on a daily basis during the
fire season. This process involves the delineation of the extent of forest fire events based on
the semi-automatic classification of MODIS satellite imagery using ancillary spatial datasets.
The RDAs are stored directly in Oracle Spatial from where they are also published in a
variety of formats. In addition, a fully automated processing chain is used to extract, store
and publish the MODIS hot spots data (i.e. active fires, detected from satellite imagery as
areas significantly hotter than the surrounding background. See paragraph “Active Fire
Detection”).

2.2 Web-based tools
The EFFIS website is developed within the Joomla! Content Management System. The web-
mapping interface is the core tool of the EFFIS front end and in particular the ‘Current
Situation’ Map Viewer‡, which is a ‘light’ client, built using a number of JavaScript libraries
that include OpenLayers, jQuery, along with Python and PHP/Mapscript on the server side.

‡   http://effis.jrc.ec.europa.eu/current-situation
Comprehensive Monitoring of Wildfires in Europe:
The European Forest Fire Information System (EFFIS)                                        91

The viewer provides direct access to the FWI as WMS, the locations of the hot spots and
Burnt Area as well as the daily MODIS mosaics. It also allows the user to query and retrieve
attribute information from the datasets.
The EFFIS website also provides access to a fire news geolocated feed (GeoRSS). These fire
news data are detected on a daily basis from a plethora of news feed on the web. The back
end of EFFIS provides a section to geoparse, translate and archive the fire news in the
database. The main aim of collecting the fire news data is to provide ancillary information to
the fire expert that performs the rapid damage-assessment mapping, and a synoptic view of
press information to forest fire managers.
GeoServer and UMN Mapserver are both used for the management and publication of the
fire danger forecast and the other fire-related layers in a wide range of formats including
INSPIRE and Open Geospatial Consortium (OGC) standards such as:
•   Web Map Services (WMS) which render map data in a pictorial image format over the
    internet;
•   Web Feature Services (WFS) that encode vector data using Geographic Mark-up
    Language (GML);
•   Web Coverage Services (WCS) that disseminates gridded or raster data. ---

2.3 Future advances
Exploratory research is currently on-going to integrate Volunteered Geographic Information
(VGI) and Web2.0 services into the EFFIS processing work flow. This has the specific aim to
harness a new resource of spatially referenced information in the form of photographs from
services such as Flickr and Panoramio, tweets from Twitter and potentially videos from
YouTube. Although these services are relatively new, their use is increasing and they have
the potential to provide contextual information that can provide news alerts and ancillary
information during the fires and in post-fire events.
Other research aims to utilise in-situ meteorological data from meteorological sensors using
the OGC Sensor Observation Service (SOS) specification. These sensor data can be used to
produce more localized estimates of the Fire Weather Index and its related sub-indices.

3. The European Fire Database
The European Fire Database is the largest repository of information on individual fire events
in Europe. It is the end product of a long collaboration between European countries and the
European Commission on forest fires.
Since 1989 several regulations have supported the creation of forest fire information systems
in the countries to monitor and evaluate the effectiveness of the measures taken at the
European level. To this end the countries had to make available to the EC a minimum
common set of data on forest fires. Thus a first fire database was established with
information on forest fires, their size and causes. The systematic collection of a core set of
data on each fire event started covering at that time six Member States of the Union:
Germany, Portugal, Spain, France, Italy and Greece.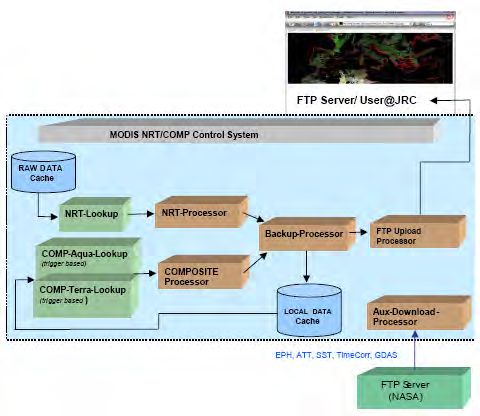
92             Approaches to Managing Disaster – Assessing Hazards, Emergencies and Disaster Impacts

Since 2000, the forest fire data provided each year by individual EU Member States and
other European countries have been checked, stored and managed by JRC within EFFIS. The
database is now known as the European Fire Database, and the number of Member States
and other participating European countries that contribute to it has been gradually
increasing.
Today the database reflects the efforts of the 22 contributing countries that have been
regularly supplying fire data: Bulgaria, Croatia, Cyprus, Czech, Estonia, Finland, France,
Germany, Greece, Hungary, Italy, Latvia, Lithuania, Poland, Portugal, Romania, Slovakia,
Slovenia, Spain, Sweden, Switzerland and Turkey, and contains over 2 million individual
wildfire event records, of which about 1.66 million are classified as forest fires.
Each country has its own internal rules of reporting on individual fire events. Some store
very detailed information and have complex databases for this purpose; others record only
minimal and basic information. The European Fire Database therefore contains a number of
commonly gathered characteristics of each fire, all of which can be supplied by all countries.
The four main types of information collected are: time of fire, location of fire, size of fire, and
cause of fire.
Time of fire
“Date and time of first alert” reflect the local date and time at which the official forest fire
protection services were informed of the outbreak of the fire. The “Date and time of first
intervention” are the local date and time on which the first fire-fighting units arrived on the
scene of the forest fire. And, the “Date and time of fire extinction” are the local date and
time on which the fire was completely extinguished (i.e. when the last fire-fighting units left
the scene of the forest fire).
Location of fire
Wildand fires in Europe are traditionally geo-located by recording the administrative unit
where they started. Two different administrative levels are requested to be specified in
order to allow the maximum detail to be recorded for each fire event in the country.
A first administrative level is the province. The Nomenclature of Territorial Units for
Statistics (NUTS) is a breakdown of territorial units established by the European Office for
Statistics (EuroStat) for the production of regional statistics for the European Union. NUTS-3
level corresponds in most EU countries to the administrative level of provinces. The country
provincial code and NUTS-3 code are requested. A second administrative level of
information requested is that of the commune, corresponding to the Eurostat NUTS-5 level.
This level is much more detailed than the province and is requested also in the Country
nomenclature to facilitate the correct attribution of codes and the cross checking of codes
with names.
With the widespread use of GPS devices, the location of the ignition point given as
geographical coordinates (latitude, longitude) is becoming more widely applied on a routine
basis in many countries. When the coordinates provided are projected, the projection
parameters are also requested. The geographical coordinates do not replace the specification
of the administrative units.
Comprehensive Monitoring of Wildfires in Europe:
The European Forest Fire Information System (EFFIS)                                               93

Size of fire

Fire size is broken down into burnt land cover categories whose definition can be found in
the Forest Focus Regulation§, which is compliant with FAO definitions.

Where possible, the burnt area is subdivided into the 4 land cover categories “Forest”,” Other
Wooded Land”,” Other Non-wooded Natural land” and “Agricultural and Other Artificial land.” If
this is not possible a hybrid category may be used.
The category “agriculture and other artificial land” should be excluded in the reported burnt
area statistics. It was introduced to enable its separation from the other categories to
produce comparable statistics. Thus, since a fire may cover more than one type of land, the
reported “total area burnt” is calculated as the sum of the burnt areas of forest, other
wooded land and other non-wooded natural land. The burnt area of agricultural and other
artificial land burned is not included in the numbers reflecting the burnt area.
Cause of fire

The 4 EU categories for the presumed cause are the following: 1-Unknown; 2-Natural cause
(e.g. lightening, volcano); 3-Accidental cause or negligence, meaning connection to a human
activity but without any intention of causing the fire (e.g. accidents caused by power lines,
railways, works, bonfires, etc.); and 4-Deliberate cause or arson.
Since the currently available information on fire causes in individual countries is much
more detailed than simply the 4 classes given above, cause categories following the
scheme adopted by the country are also requested in addition to the 4 EU cause codes,
together with a full list of local cause codes and descriptions. Based on this, a new scheme
to be eventually adopted as a common fire causes classification system in Europe has been
proposed.

3.1 Status and content of the database
Information on individual fire events is recorded every year by individual countries and is
provided to the JRC, which maintains the database. Contributions from the countries are
voluntary, and back-dated data are also accepted if they can be supplied. The submitted
data are then pre-processed and validated. The pre-processing includes, for example,
changes in the data structure and formats to comply with the harmonized database.
The checks done in the validation phase include checks for temporal plausibility and
consistency (extinction time must occur after alert time, for example), location details
(correct NUTS codes) and size (plausible size of fire given the time taken to extinguish it).
After being checked, requests for clarification may be sent to the country. After the quality
checking phase has been finalized the data is transferred into the consolidated European
Fire Database which is stored in an Oracle space.

§Regulation (EC) No 2152/2003 of the European Parliament and of the Council of 17 November 2003

concerning monitoring of forests and environmental interactions in the Community (Forest Focus), OJ L
324, 11.12.2003, p. 1-8.
94 Approaches to Managing Disaster – Assessing Hazards, Emergencies and Disaster Impacts
The database currently contains about 1.66 million forest fire records. However, since also
purely agricultural fires are stored if the country reports them, the total number of records
including agricultural fires is just over 2 million records (Fig. 4).
25 180000
Number of participating countries
Number of forest and wildland fires
160000
Number of agricultural and other fires
20
Number of fire records in database
140000
Number of participating countries
120000
15
100000
80000
10
60000
40000
5
20000
0 0
19 80
19 92
200 4
1981
1982
1983
1984
1985
1986
1987
1988
1989
1990
1991
1993
1994
1995
1996
1997
1998
1999
2000
2001
2002
2003
2005
2006
2007
2008
2009
Fig. 4. Evolution of the European Fire database
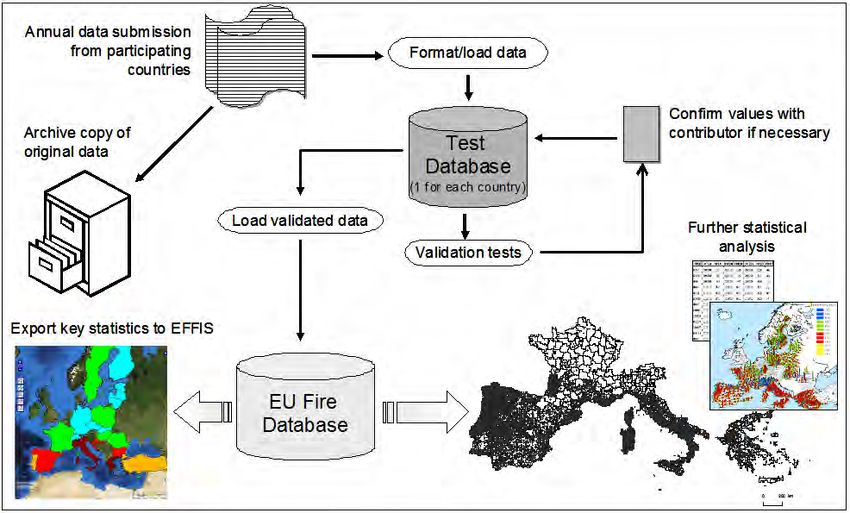
The data are then ready to be used for further statistical analysis (Fig. 5). Key summary
statistics are exported to the EFFIS web viewer and the information is made available to the
public through the web interface**, which allows the users to retrieve general information
such as maps of the number of fires, burnt area and average fire size for a selected year and
for the countries for which data are available. The data can be displayed at different spatial
aggregation level such as country, NUTS1, NUTS2 or NUTS3 and may be filtered to exclude
fires below a certain size, while an interactive graphical facility allows the user to display
the same fire statistics over time.
3.2 Analysis of spatial and temporal distribution of forest fires
The Mediterranean region of Europe, particularly the countries of Portugal, Spain, Italy and
Greece and southern France, is by far the most affected by forest fires. From 1980 until 2009
fires have burnt an average of circa 480,000 ha of land per year in this region alone, with an
annual average of 50,000 occurrences (European Commission, 2010). In this region, the
majority of the fires (over 70%) occur between June and October, exhibiting different
temporal trends in relation to the northern European countries, where the majority of fires
occur in springtime.
The analysis of the spatial and temporal trends of forest fires is crucial to understand their
underlying driving factors and the resulting environmental and socio-economic impacts,
and for planning appropriate fire prevention and management. The analysis presented here
focuses on the number of fires and burnt area in the European Mediterranean region
(EUMed).
** http://effis.jrc.ec.europa.eu/fire-historyComprehensive Monitoring of Wildfires in Europe: The European Forest Fire Information System (EFFIS) 95 Fig. 5. Process control from data submission to storage, analysis and display 3.2.1 Analysis of number of fires and burnt area in the EUMed region The general trend observed in the annual number of fires recorded between 1985 and 2009 is a slight increase, with strong fluctuations (Fig. 6). In the 90’s a substantial increase can be observed, while in the last 10 years (i.e. since 2000), the number of fires tends to decrease, except for the years 2003 and 2005 which were affected by extreme weather events. The sharp increase recorded in the 90’s might simply reflect changes in the reporting systems in the countries triggered by specific EC Regulations. In addition to this, many authors associate this trend with fuel accumulation related to land cover changes such as the expansion of shrublands and abandonment of agricultural lands (Carmo et al. 2011, Lloret et al. 2002, Romero-Calcerrada et al. 2010). The burnt area, on the other hand, exhibits a decreasing trend since 1985, with strong annual fluctuations (Fig. 6). Besides the influence of weather conditions in fire spread and burnt area annually, this decrease can also be related to the implementation of fire prevention strategies and to the improvement in fire detection and fire-fighting techniques during the last years. 3.2.2 Seasonal trends The months with higher number of fires and burnt area in EUMed between 1985 and 2009 were August, July and September (Fig. 7). Nearly 73% of the fires and nearly 85% of the burnt area occurred between June and October. March had the highest number of fires and burnt area among the spring months.
96 Approaches to Managing Disaster – Assessing Hazards, Emergencies and Disaster Impacts
1200000 80000
70000
1000000
60000
800000
50000
Number of fires
Burned area (ha)
600000 40000
30000
400000
20000
200000
10000
Burned area
0 0
N of fires
1985
1986
1987
1988
1989
1990
1991
1992
1993
1994
1995
1996
1997
1998
1999
2000
2001
2002
2003
2004
2005
2006
2007
2008
2009
Years
Fig. 6. Total annual number of fires and annual burnt area in the EUMed region from 1985
until 2009
35000 3000
30000 2500
25000
Burned area (ha)
Number of fires
2000
20000
1500
15000
1000
10000
5000 500
0 0
Burned area
r
t
r
il
ry
ly
ay
ne
er
r
y
ch
be
us
be
be
pr
ar
Ju
ob
ua
M
Ju
ar
em
ug
em
em
A
nu
Number of fires
ct
br
M
A
ov
Ja
pt
O
ec
Fe
Se
D
N
Month
Fig. 7. Annual average (1985–2009) number of fires and burnt area per month in the EUMed
regionComprehensive Monitoring of Wildfires in Europe: The European Forest Fire Information System (EFFIS) 97 4. Fire Danger Forecast The Fire Danger Forecast module of EFFIS was initially established as a unified platform for the implementation of selected national fire weather indices throughout Europe. It enabled the extraction of coherent information for Europe and the inter-comparison of fire danger levels among European countries or regions. It has been designed to be a common reference for fire danger assessment, supporting cooperation among national services during major events or in case of trans-border fires. Fire danger rating in EFFIS does not intend to replace the systems used by the countries, but to complement them by providing a harmonized European-wide assessment of fire danger. Fire danger assessment and forecast provided by EFFIS is therefore used as a reference information source which may be coupled with the other systems operated locally by individual countries or regions, which may be more or less advanced. In addition to the daily support, the information is particularly useful in case of assistance requests by a country during major fires under severe conditions. The European maps of fire danger assessment and forecast are used a common baseline to evaluate the situation and its likely development. 4.1 Fire danger rating methods During the first years of EFFIS, a number of selected national fire danger indices were implemented, and in 2007 a decision was taken to focus research and development efforts on components of the Canadian Fire Weather Index system (Van Wagner 1987), of the Canadian Forest Fire Danger Rating System, the national system of fire danger assessment in Canada (Stocks et al. 1989). The FWI System has six components rating fuel moisture content and potential fire behavior in a common fuel type (i.e., mature pine stand) and in no slope conditions. Calculations are based on daily noon measurements of air temperature, relative humidity, wind speed and previous 24-h precipitation. The first three components of the FWI are numerical rating of the moisture content of forest floor layers with different drying rates and at various depths. The Fine Fuel Moisture Code (FFMC) rates the moisture of litter and other dead fine fuels at the top of the surface fuel layer; the Duff Moisture Code (DMC) rates the moisture of the loosely compacted organic layer of moderate depth; the Drought Code (DC) represents the moisture content of the deep layer of compact organic matter. The three moisture codes carry different useful information as indicators of the ease of ignition and flammability of fine fuels (FFMC), fuel consumption in medium-size woody material and moderate duff layers (DMC), fuel consumption in large logs and amount of smoldering in deep duff layers (DC) (Alexander 2008). The last three codes of the FWI are fire behavior indices rating the expected rate of fire spread (Initial Spread Index - ISI) from the combination of FFMC and wind speed, the fuel available for combustion (Build Up Index - BUI) from the combination of DMC and DC, and the fire line intensity (FWI), which is the final index that combines ISI and BUI and renders the energy output rate per unit length of the fire front according to Byram’s formulation (Byram 1959). Each individual component of the FWI system is a fire danger index, revealing different aspects of fire danger which are finally difficult to synthesize with one single number
98         Approaches to Managing Disaster – Assessing Hazards, Emergencies and Disaster Impacts

(Alexander 2008). It is important to keep in mind that the FWI output only depends on
weather observations and does not consider differences in fuel types or topography. It
provides a uniform, relative way of rating fire danger through fuel moisture and fire
behavior potential (Van Wagner 1987). The FWI has a number of desirable properties
(Fogarty et al. 1998). In particular, it is relatively simple to implement, is based on
sound scientific principles and carries meaningful information to fire managers which
can be directly correlated with fire behavior characteristics, and it is thereby easy to
interpret.
Although the application of the FWI system in EFFIS during the last years has confirmed its
robustness and validity for Europe, research work is still on-going to enhance its application
in the European environment.

4.2 Data input
Fire danger assessment is done in EFFIS with weather forecasts and with observed synoptic
weather data. Daily observations from a few hundreds synoptic weather stations are
interpolated on a 50x50 km2 grid over Europe. The database has been set up and is being
primarily used by the project MARS (Monitoring Agriculture with Remote Sensing) of the
JRC. Weather forecast data are received daily from Météo-France and Deutsche Wetter
Dienst (DWD).
Daily forecast data of 0-24, 24-48, 48-72 hours from Météo-France are re-sampled on the
EURAT5 grid of spatial resolution 0.5°x0.5°. The data are received daily and are used to
calculate FWI values and generate EU maps of 1, 2 and 3 days forecast. DWD provides
forecast data from the global model with spatial resolution of 0.36°x0.36° and up to 174
hours forecast with 3 hour time step. These data are received daily and used to generate
maps of 1 to 6 days forecasts of FWI.
Weather forecast data are downloaded daily from the FTP servers of the meteorological
services and stored with the results of the data processing in an Oracle workspace. Fire
danger maps are updated daily from 1st of March until 31st of October. They are made
accessible through the EFFIS Web interface and are also sent via email to the EC services
and to the national fire services.

4.3 Fire danger classes
In the current EFFIS implementation of the FWI, 5 fire danger classes are defined with
simple FWI thresholding, irrespectively of the fuel types. The FWI value for the highest fire
danger class limit has been set on the basis of the analysis of fire danger conditions observed
during about 2000 large fires of more than 500 hectares occurred in Europe during 20 years,.
After that, the geometric progression described in Van Wagner (1987) has been applied to
establish 5 lower danger classes. The lowest 2 classes have then been aggregated into one
“Very Low” danger class. The resulting FWI ranges and classes are given in Table 1.
Efforts continue to enhance the operational use of the FWI system within EFFIS and to
further refine the definition of the fire danger classes following alternative approaches
(Camia and Amatulli 2010).
Comprehensive Monitoring of Wildfires in Europe:
The European Forest Fire Information System (EFFIS) 99
Fire Danger Class FWI ranges (upp er bou nd s excluded)
Very low < 5.2
Low 5.2 - 11.2
Moderate 11.2 - 21.3
High 21.3 - 38.0
Very high >= 38.0
Table 1. FWI ranges defining the fire danger classes in EFFIS
5. Active fire detection
The basis for the detection of active fires from satellite imagery is the identification of hot
spots through the use of spectral-band thresholds or contextual fire-detection algorithms
(San-Miguel-Ayanz et al. 2005). Contextual algorithms provide a more consistent
performance for regional and global applications than simple thresholding algorithms.
These contextual algorithms identify as hot spots (active fires) areas that are significantly
hotter than the surrounding ones (i.e. the contextual background).
In EFFIS, active fire detection is based on the use of the MODIS thermal activity product
(Justice et al. 2002b). The original contextual algorithm used for fire detection in the MODIS
thermal activity product was improved by Giglio et al. (2003) allowing the detection of
smaller and cooler fires, as well as the significant reduction of the rate of false alarms.
The MODIS active fire product is used for the automatic geo-location of active fires in EFFIS.
This product is further filtered with the use of the CORINE land cover database and other
ancillary datasets (e.g. digital elevation model, road and street maps) with the aim of
reducing the number of false alarms coming from industrial and urban areas and
distinguishing forest fires from other types of fires (e.g. agricultural fires). The EFFIS active
fire product is also used as ancillary information for the mapping of burnt areas.
6. Burnt area mapping
6.1 Rapid Damage Assessment
The MODIS sensor on board of the TERRA and AQUA NASA satellites is used in EFFIS for
continuous monitoring and mapping of fires of about 40 ha or larger in Europe. The module
for the mapping of burnt areas and assessment of forest damages is referred to as Rapid
Damage Assessment (RDA). Testing on the use of MODIS data for mapping burnt areas in
Europe was performed between the years 2000 and 2002, and the first map of burnt areas
using this imagery was obtained in 2003. Until then maps of fire perimeters (burnt areas) were
obtained only at the end of the fire campaign, i.e. end of September/October. After 2003 the
processing chain was further automated to process MODIS data in near-real time. Daily, two
full image mosaics the European territory are processed in EFFIS to derive burnt area maps.
Currently, the processing chain includes a data pre-processing sub-system, which is
operated by the German Aerospace Agency (DLR). Images are acquired year round,
although the core of the real-time processing is carried out from May to the end October
every year. The scheme of satellite imagery reception and transmission of the pre-processed
products to JRC is presented in Fig. 8. These include radiometrically calibrated, geolocated
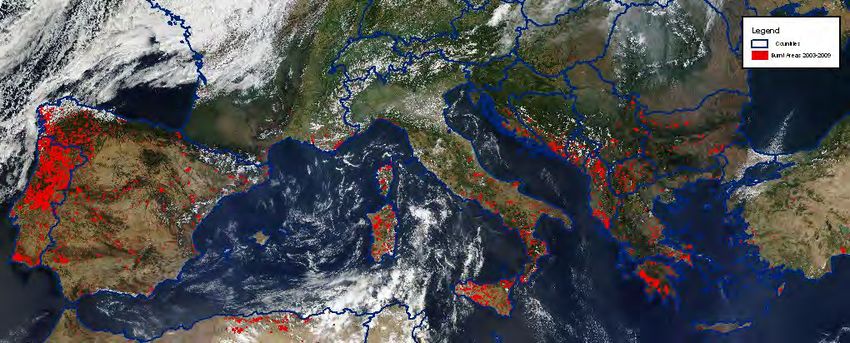
and atmospherically corrected reflectances.100 Approaches to Managing Disaster – Assessing Hazards, Emergencies and Disaster Impacts Fig. 8. Pre-processing of MODIS data for EFFIS (source: San-Miguel-Ayanz et al. 2009) The spatial resolution of the MODIS data permits the accurate mapping of fires of approximately 40 ha or larger, although smaller fires are often detected and mapped. The information on the perimeters of these fires is updated twice daily and available in the “current situation’ page of EFFIS. Fires are mapped using a semi-automatic procedure. Fires are first mapped on the basis of an unsupervised procedure that uses a combination of band thresholds and ancillary information from the CORINE Land Cover, the active-fire detection product, and the news application, which are described in previous sections of this chapter. Fires that are mapped by the unsupervised procedure are visually verified, and the processing of the images continues for those true fires with the aid of a seeded region-growing algorithm (Salvador Civil et al. 2002). Information from the RDA is published in EFFIS web site and transmitted to the Monitoring and Information Centre of EC Civil Protection Unit and to the civil protection and forest fire services in the European countries. The acceptance of the RDA products by the scientific community and the final users in the EC and the countries required a thorough assessment of their quality. Although a validation exercise was performed in 1998, the validation of the EFFIS burnt area product is a continuous process that is still on-going, in conjunction with the validation of the global
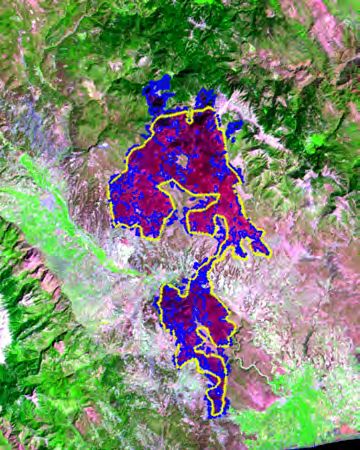
Comprehensive Monitoring of Wildfires in Europe:
The European Forest Fire Information System (EFFIS)                                         101

burnt area product of MODIS (Justice et al. 2002a). Specific validation of RDA was
performed in the case of large fire events such as those in Portugal (2003), north-western
Spain (2006), and Greece (2007) (Boschetti et al. 2008) and in the case of very large fires such
as those in southern Spain and Portugal in 2004 that burnt approximately 25000 ha each.
The cumulative impact of burnt areas in the European Mediterranean region, as mapped in
EFFIS from 2000 to 2009, is presented in Fig. 9.

Fig. 9. Cumulative impact of forest fires in the 2000-2009 period

6.2 High resolution burnt area mapping
As mentioned in the previous section, the EFFIS Rapid Damage Assessment burnt area
maps are based on 250-m spatial resolution bands from the Moderate Resolution Imaging
Spectroradiometer (MODIS). The methodology and the spatial resolution of this sensor
allows mapping burnt areas of about 40 ha or larger. This figure accounts for about 75% of
the total area burnt every year in the Southern European Union (European Commission,
2008). Burnt areas smaller than 40 ha, however, make up a significant share of the total burnt
area in the Europe. In regions such as the north-western Iberian Peninsula and Italy, these
fires are frequent and highly relevant from ecological, social and economic perspectives.
With this in mind, the European Parliament, in its resolution of 2006, called for the
improvement of the burnt area assessments already provided by EFFIS. The improvement
of remote sensing-based burnt-scar mapping capabilities in order to consistently map areas
larger than 10 ha would imply the detection of nearly 90% of fires over Europe.
In this context EFFIS has explored the potential of higher spatial resolution remote sensing
data for burnt-scar mapping. The rationale for estimating burnt areas at higher spatial
resolution lays in the assumption that increased spatial detail could result in an improved
capability for the detection of smaller burnt scars and a more precise delineation. Initial
results using a bagged artificial neural network classifier (Sedano et al. in press) on IRS-
AWIFS imagery acquired at the end of the fire-prone European summer season have shown
that, in general, AWIFS-based burnt scars maps provide a more detailed delineation of
burnt area polygons and non-burnt islands within the burnt perimeter. Fig. 10 shows the
level of detail provided by MODIS as compared to that derived from AWIFS.
102        Approaches to Managing Disaster – Assessing Hazards, Emergencies and Disaster Impacts

Fig. 10. Perimeter of burnt areas obtained from MODIS (yellow) and AWIFS (blue) in one of
the large fires in the Peloponnese province, Greece in 2007
The results obtained so far in a full exercise of mapping burnt areas for the year 2009,
however, do not clearly support the improved capability of AWIFS imagery for mapping
smaller burnt scars. The acquisition of higher spatial resolution imagery generally implies
lower revisit period and lower restricted spectral payloads. This trade-off imposes
additional constrains. First the higher spatial resolution is obtained at the expense of a
reduced spectral resolution and lower revisit period as compared to lower spatial resolution
sensors. This limits the amount of available spectral information for automatic image
classifications. Second, as a consequence of the lower revisit period, a continuous image
acquisition plan is not feasible. Instead, image acquisition must be concentrated at the end of
the fire season. This restricted acquisition period complicates obtaining full cloud free
coverage over large study regions. It also increases the potential time lag between fire events
and image acquisition, increasing the chance that the spectral signal of the burnt scar fades
away over time. The lack of cloud free information, the time lag between forest fire and
image acquisition date and the presence of fires after the image acquisition dates can results
in the under detection of a considerable number of burnt-scars of various sizes. On the other
side, the presence of undetected cloud shadows and shaded slopes can result in the
overestimation of small burnt scars.
These present limitations are likely to be reduced as the availability of medium-resolution
earth observation sensors increases, and the combination of images from different sensors
give access to more complete and cloud free coverage at one or several periods during the
fire season. Until this scenario becomes reality, initiatives relying on coarse resolution
satellite data remain the most solid option for large-scale burnt scar mapping and
monitoring.
Comprehensive Monitoring of Wildfires in Europe:
The European Forest Fire Information System (EFFIS) 103
7. Forest fire emissions
Combustion of fuels in forest fires emits gases and particles. These emissions do have an
important effect on the local population, especially in the case of wildland-urban interface
fires and may constitute a large portion of the country’s emissions in case of large fire
episodes such as those of Portugal in 2003 or Greece in 2007.
As mentioned in a previous section, the frequency and extent of fires in Europe varies
greatly from year to year, reflecting year-to-year climatological variability, with an average
of about half a million hectares in the last 20 years (this excludes fires in the European part
of Russia). On average, during the period 2000 to 2009 about 60000 fires occurred annually
in Europe and they, burned about half a million hectares of land every year. However, the
areas burnt have exceeded 700000 ha in 2003 or nearly one million ha in 2007 (European
Commission, 2009).
Emissions from forest fires depend on (1) the duration and intensity of the fire, (2) the total
area burnt by the fire, and (3) the type and amount of vegetation that was burnt. This latter
term is often referred to as fuel load. Of these three terms, the one that is best known is the
total burnt area. EFFIS currently uses the state of the art in calculating emissions from open
vegetation fires, which follows the work of Seiler and Crutzen (1980). The formula is:
Ex = A B C EF (1)
Where:
- Ex emission of compound x
- A burnt area (m2)
- B fuel load (g dry matter m-2)
- C burning efficiency
- EF emission factor (g g-1 dry matter burnt)
Each of the components of the fuel classes is attributed a specific burning efficiency and
emission factor for gas-phase or aerosol compounds. These values depend upon whether the
fire is flaming or smoldering, which is related with the diameter of the fuel type (Lenhouts,
1998). Emission factors for CO, CH4, VOC, NOx, N2O and SOx are taken from literature. If
no local data on aboveground fuel load is available, default values can be applied. Values of
total biomass for five biomes (boreal forest, temperate forest, Mediterranean forest,
shrubland, grassland/steppe) and factors for each biome allow for the derivation of
aboveground biomass as well as the assumed fraction of biomass burnt in a fire. The content
of Carbon in a fuel is obtained by multiplying the value of biomass by the coefficient 0.45.
The burning efficiency depends on the meteorological conditions and determines the type of
combustion, which may lead to flaming or smoldering fire.
Depending on the available data, these factors can be computed with more or less detail.
Burnt areas may be available as a geographic layer or as a global value for a country or a
region. In the case of available geographical information of the burnt areas, the pre-fire
vegetation can be classified into fuel types and distinctive fuel loads can be used for
estimating emissions. The European Fuel Map available in EFFIS, which was derived from
the combination of the CORINE Land Cover database and the Potential/Natural Vegetation
Map of Europe (Sebastian-Lopez et al. 2002), is used for this purpose. The fuel categories in104 Approaches to Managing Disaster – Assessing Hazards, Emergencies and Disaster Impacts the map are those of the US National Fire Danger Rating System (NFDRS) (Burgan 1988). This allows for the allocation of above ground biomass to each fuel type. A conversion factor is subsequently used to determine the assumed fraction of biomass burnt in a fire. As mentioned above, the values of Biomass are converted into Carbon values through the multiplication by 0.45. The series of burnt area statistics from the European Forest Fire Information System (EFFIS) provide a consistent database of burnt area perimeters that can be used for the calculation of emissions. As presented above, the maps of burnt areas in EFFIS have been systematically produced since the year 2000 and have been contrasted with national statistics. Burning efficiency depends on the meteorological conditions during the fire. In EFFIS, average conditions for the summer time, when most fires in Europe occur, are used to derive the combustion efficiency. A new methodology has recently been developed for EFFIS (Liousse et al. 2011). This allows the precise estimation of emission on the basis of information on the time of the fire, the progression of the fire front and expansion of the fire perimeter, and the total fire duration. This will become operational in 2012. According to EFFIS estimates (European Commission, 2008), the CO2 emissions during catastrophic fires in Greece was in the range of 4.5 Mt until end of August 2007, representing some 4% of the total annual CO2 emissions of this country. A similar share of fire emissions to total emissions of CO2 was observed in Portugal during heavy fire campaigns in 2003 and 2005 (Barbosa et al. 2009). For August 2003, the contribution of forest fire emissions in Southern Europe to observed particulate levels of PM2.5 appeared to be comparable to anthropogenic emissions, and they seemed to result in significant impacts on radiative properties of large areas of Europe (Hodzic et al. 2007). Fig. 11 presents the estimation of forest fire emissions in EFFIS in the last years. Fig. 11. Burnt areas (ha) and CO2 emission estimates (Tg) in the European Mediterranean region
Comprehensive Monitoring of Wildfires in Europe:
The European Forest Fire Information System (EFFIS)                                         105

8. Soil erosion estimation
Soil erosion is another major negative outcome of forest fires, particularly in the
Mediterranean region. Furthermore, the damage represented by soil erosion is usually
irreversible. This is why it is of utmost importance to assess the potential soil loss in fire-
affected areas, and to identify areas where critical prevention measures should be applied
after the fire season to avoid further damage.
The susceptibility of a burnt area to soil erosion depends on the intensity of the fire and the
degree to which the vegetation cover is removed. The more intense the burning of the
vegetation cover, the more the soil remains exposed to winds and rainfall. Within Europe,
the risk of water-driven soil erosion is particularly high in the Mediterranean region where
autumn rain storms often follow summer wild fires (Pausas and Vallejo 1999). Steep slopes
not only favour the spread of wildfires, but are also most susceptible to soil erosion by water
run-off when the soil lays bare after a fire.
While models assessing potential wind-induced erosion on a large scale do not exist yet,
several methodologies to model water-driven soil erosion have been established. To
estimate potential post-fire soil erosion, EFFIS is using the Revised United States Land Use
Erosion (RUSLE) model which has been developed for the European scale. RUSLE is a
physical process model built on three conceptual stages estimating daily total overland flow
runoff, sediment transport and long-term average erosion rates. The output of the model is
soil erosion estimate in tons per hectare per year, at a one kilometre grid resolution.
EFFIS offers the possibility of estimation of the potential for soil erosion for individual fire
events grouped by their year of occurrence. This is done by summing the estimated
potential soil erosion of all pixels within the burnt area perimeter.

9. Conclusions
The current chapter presented the fire monitoring in Europe through the European Forest
Fire Information System (EFFIS). The system is the result of a long collaboration between the
European Commission and the national fire services in the European countries. The
monitoring of fires in Europe and the development of EFFIS paralleled trends marked by
the development of environmental, forest protection, and civil protection policies in Europe
(San-Miguel-Ayanz et al. in press). Its initial steps date back to 1998, when first discussions
about its implementation took place between the EC and the national fire services. EFFIS
became operational in 2000. Since then, new modules to enhance data processing and the
dissemination of information, as well as the monitoring of forest fires were added to the
system. These developments also paralleled the fast progress on information and
communication systems, especially in the areas of remote sensing and geographic
information systems.
EFFIS is a dynamic system that continues to be developed through the incorporation of
subsystems for the monitoring of diverse phases of forest fires. EC services and the
European Parliament (EP) have supported its development through time. The EP in its
resolutions of 2006 and recently in 2011, (European Parliament 2006, 2011) has called for
further enhancement and a continued legal basis for the operation and further development
of EFFIS. Following the EP resolution of 2006, new modules in the areas of forest fire
106         Approaches to Managing Disaster – Assessing Hazards, Emergencies and Disaster Impacts

emissions, analysis and harmonization of fire causes, and the assessment of the socio-
economic impact of forest fires were developed and will be shortly included in the system.
Based on research activities of the EC Joint Research Centre, the system serves as repository
of research findings in the field of forest fires, and acts as the means to incorporate those
into operation.
The forest fire and civil protection services of the European countries are at the core of the
system, as testers and critical users of it; they provide essential feedback on the usability of
the information retrieved in EFFIS. As mentioned above, the system provides a basis for
collaboration among the countries. Recently an agreement has been established with the
Food and Agriculture Organization of the United Nations for the extension of the system to
Northern African and near-East Mediterranean countries. The first steps for this will be
taken already in 2011.
Future climate change scenarios combined with other factors such as land cover change and
population exodus from rural areas may lead to increase fire activity in Europe. It is thus
essential that the means be put in place for forest monitoring to enhance the collaboration of
the countries on forest fire management.

10. References
Alexander, M.E. (2008). Proposed revision of fire danger class criteria for forest and rural areas in
         New Zealand. Christchurch: National Rural Fire Authority, Wellington, in
         association with the Scion Rural Fire Research Group.
Anon. (2011). Open Source Geospatial Fundation (OSGEO). GDAL-OGR: Geospatial Data
         Abstraction Library / Simple Features Library Software, July 2011.
         http://www.gdal.org.
Barbosa, P., Camia, A., Kucera, J., Liberta, G., Palumbo, I., San-Miguel, J., Schmuck, G.
         (2009). Assessment of Forest Fire Impacts and Emissions in the European Union
         Based on the European Forest Fire Information System. In: Developments in
         Environmental Science, Volume 8, 197, A. Bytnerowicz, M. Arbaugh, A. Riebau and
         C. Andersen (Editors), Elsevier.
Boschetti, L., Roy, D., Barbosa, P., and Boca, R. (2008). A MODIS assessment of the summer
         2007 extent burned in Greece, International Journal of Remote Sensing, 29 (8), pp.
         2433-2436.
Burgan, Robert E. (1988). Revisions to the 1978 National Fire-Danger Rating System. Res. Pap.
         SE-273. Asheville, NC: U.S. Department of Agriculture, Forest Service,
         Southeastern Forest Experiment Station. 39 pp.
Byram, G.M. (1959). Combustion of forest fuels. In K.P. Davis (Ed.), Forest Fire: Control and
         Use. McGraw-Hill, New York, pp. 155-182.
Camia A., Amatulli G. (2010). Climatology of FWI over Europe: fire danger anomalies and
         index percentile rankings. In: Viegas D.X. (Ed.) VI International Conference on Forest
         Fire Research. Coimbra, Portugal.
Carmo, M., Moreira, F., Casimiro, P., Vaz, P. (2011). Land use and topography influences on
         wildfire occurrence in northern Portugal. Landscape and Urban Planning 100: 169–
         176.
European Commission, (2008). Forest Fires in Europe 2007. Office for Official Publications of
         the European Communities, Luxembourg, EUR 23492 EN, p. 77.
Comprehensive Monitoring of Wildfires in Europe:
The European Forest Fire Information System (EFFIS) 107
European Commission, (2009), Forest Fires in Europe 2008, Office for Official Publications of
the European Communities, Luxemburg, EUR 23971 EN, p. 77.
European Commission (2010). Forest Fires in Europe 2009. Publication Office of the European
Union, Luxembourg, EUR 24502 EN. p. 83.
European Parliament, (2006). EP resolution on natural disasters (fires and floods) in Europe this
summer, OJ C 193E, 17.8.2006, p. 322–325.
European Parliament, (2011). EP resolution on Commission Green Paper on forest protection and
information in the EU: preparing forests for climate change, P7_TA-PROV(2011)0226
Fogarty, L.G., Pearce, H.G., Catchpole, W.R., Alexander, M.E. (1998). Adoption vs
Adaptation: lessons from applying the Canadian Forest Fire Danger Rating System
in New Zealand. In 3rd Int. Conf. on Forest Fire Res. and 14th Conf. on Fire and Forest
Met. Luso-Coimbra, Portugal pp. 1011-1028.
Giglio, L., Descloitres, J., Justice, Ch. O., and Kaufman, Y.J. (2003). An enhanced contextual
fire detection algorithm for MODIS, Remote Sensing of Environment, 87 (2-3), pp. 273-
282.
Hodzic A., Madronich S., Bohn B., Massie S., Menut L., and Wiedinmyer C. (2007). Wildfire
particulate matter in Europe during summer 2003: Meso-scale modeling of smoke
emissions, transport and radiative effects, Atmospheric Chemistry and Physics, 7, pp.
4043–4064.
Justice, C., Lewis, P., and Roy, D. (2002a). Burned area mapping using multitemporal
moderate spatial resolution data A-bi-directional reflectance model-based
expectation approach. Remote Sensing of the Environment, 83, 263–286.
Justice, C.O., Giglio, L., Korontzi, S., Owens, J., Morisette, J.T., Roy, D., Descloitres, J.,
Alleaume, S., Petitcolin, F., and Kaufman, Y. (2002b). The MODIS fire products,
Remote Sensing of Environment, 83 (1-2), p. 244-262.
Kirkby, M.J., Jones, R.J.A., Irvine, B., Gobin, A, Govers, G., Cerdan, O., Van Rompaey, A.J.J.,
Le Bissonnais, Y., Daroussin, J., King, D., Montanarella, L., Grimm, M., Vieillefont,
V., Puigdefabregas, J., Boer, M., Kosmas, C., Yassoglou, N., Tsara, M., Mantel, S.,
Van Lynden, G.J. Huting, J. (2004). Pan-European Soil Erosion Risk Assessment: The
PESERA Map, Version 1 October 2003. Special Publication Ispra 2004 No.73
(S.P.I.04.73). European Soil Bureau Research Report No.16, EUR 21176, 18pp.
Leenhouts, B. (1998). Assessment of biomass burning in the conterminous United States.
Conservation Ecology [online] 2(1):1. http://www.consecol.org/vol2/iss1/art1
Liousse, C., San-Miguel-Ayanz, J., Camia, A., Guillaume B., (2011). A new methodology for
the near-real time estimation of smoke plume emissions from forest fires in the
European Forest Fire Information System. In: Proceeding 8th International Workshop
EARSeL, Special Interest Group on Forest Fires, Stresa.
Lloret, F., Calvo, E., Pons, X., Diaz-Delgado, R. (2002). Wildfires and landscape patterns in
the Eastern Iberian Peninsula. Landscape Ecology 17: 745-759
Pausas, J.G. and Vallejo, V. R. (1999). The role of fire in European Mediterranean
ecosystems. In: Chuvieco, E. (Ed.) Remote Sensing of large wildfires in the European
Mediterranean Basin, pp. 3 - 16. Springer Verlag, ISBN 3-540-65767-3 Berlin.
Romero-Calcerrada, R., Novillo, C.J., Millington, J.D.A., Gomez-Jimenez, I. (2008). GIS
analysis of spatial patterns of human-caused wildfire ignition risk in the SW of
Madrid (Central Spain), Landscape Ecology 23, pp. 341–354.108 Approaches to Managing Disaster – Assessing Hazards, Emergencies and Disaster Impacts
Salvador Civil, R. and San-Miguel-Ayanz, J., (2002). An extension of a non-parametric
clustering algorithm to derive radiometrically homogeneous objects pointed by
seeds, International Journal of Remote Sensing, Vol.23, No. 6, pp. 1197-1205.
San-Miguel-Ayanz, J., Pereira, J. M. C., Boca, R., Strobl, P., Kucera, J., Pekkarinen A. (2009).
Forest Fires in the European Mediterranean Region: Mapping and Analysis of
Burned Areas, in Chuvieco E. (Ed.), Earth Observation of Wildland Fires in
Mediterranean Ecosystems, Springer, pp. 189-204.
San-Miguel-Ayanz, J., Ravail, N., Kelha, V. Ollero, A. (2005). Active fire detection for fire
emergency management: Potential and limitations for the operational use of remote
sensing, Natural Hazards, 35 (3), pp. 361-376.
San-Miguel-Ayanz, J., Schulte, E., Schmuck, G, Camia, A. (in press). The European Forest
Fires Information System in the context of environmental policies of the European
Union, Forest Policy and Economics.
Sebastian Lopez, A., San-Miguel-Ayanz, J., Burgan, R. (2002). Integration of satellite sensor
data, fuel type maps, and meteorological observations for the evaluation of forest
fire risk at the pan-European scale, International Journal of Remote Sensing, Vol. 23,
No. 13, pp. 2713-2719.
Sedano, F., Kempeneers, P., Strobl, P., Vogt, P., San Miguel, J. (in press). Towards a pan-
European burnt scar mapping methodology based on single date high resolution
optical remote sensing data. International Journal of Applied Earth Observation and
Geoinformation.
Seiler, W. and P. J. Crutzen (1980). Estimates of gross and net fluxes of arbon between the
biosphere and the atmosphere from biomass burning, Climatic Change 2, pp. 207–
247.
Stocks, B.J., Lawson, B.D., Alexander, M.E., Van Wagner, C.E., McAlpine, R.S., Lynham, T.J.
Dubé D.E. (1989). The Canadian Forest Fire Danger Rating System: An overview.
The Forestry Chronicle 65, 258-265.
Van Wagner, C.E. (1987). Development and Structure of the Canadian Forest Fire Weather Index
System. Ottawa, Ontario: Canadian Forestry Service, p. 37You can also read