Transportation Research Part A - UQ eSpace
←
→
Page content transcription
If your browser does not render page correctly, please read the page content below
Transportation Research Part A 94 (2016) 295–307

                                                      Contents lists available at ScienceDirect

                                          Transportation Research Part A
                                       journal homepage: www.elsevier.com/locate/tra

How does our natural and built environment affect the use of
bicycle sharing?
Iderlina Mateo-Babiano ⇑, Richard Bean, Jonathan Corcoran, Dorina Pojani
School of Geography, Planning and Environmental Management, The University of Queensland, Australia

a r t i c l e       i n f o                           a b s t r a c t

Article history:                                      Public bicycle-sharing programs (PBSP) are short-term bicycle hire systems. In recent years
Received 22 October 2015                              their popularity has soared. This study examined Brisbane’s CityCycle scheme, the largest
Received in revised form 30 August 2016               PBSP in Australia, and investigated the role of (natural and built) environmental features on
Accepted 18 September 2016
                                                      usage. The study addressed four research questions: (1) What are dynamics of PBSP use in
                                                      terms of travel time, speed, and distance? (2) What is the relationship between PBSP par-
                                                      ticipation and cycling infrastructure? (3) How does land-use affect PBSP usage? (4) How
                                                      does topography affect PBSP usage? To answer these four questions, the authors analysed
                                                      large existing datasets on CityCycle usage, land-use, topography, and cycling infrastructure,
                                                      which were each obtained through multiple sources. Correlation and regression analysis
                                                      were employed to establish significant relationships amongst variables. It was found that:
                                                      most users take short trips within the free initial period provided under the CityCycle
                                                      scheme and do not incur any charges other than for membership; PBSP use is strongly cor-
                                                      related with the length of off-road bikeways near each CityCycle station; CityCycle is more
                                                      frequently used on weekends and for recreational purposes; loop journeys, which are also
                                                      associated with leisure trips, are popular in Brisbane, especially on weekends; leisure trips
                                                      are taken at a relatively slower pace than utilitarian trips; during weekdays, a trimodal
                                                      peak is clearly evident, with PBSP commute trips in the morning and evening peaks and
                                                      a smaller but significant peak around lunchtime; and users avoid returning CityCycle bicy-
                                                      cles to stations located on hilltops. These findings can collectively enhance both the siting
                                                      and design of PBSP, thereby optimizing investments in sustainable mobility.
                                                                                                           Ó 2016 Elsevier Ltd. All rights reserved.

1. Introduction

   Public bicycle-sharing programs (PBSP) are short-term bicycle hire schemes designed to complement mainstream trans-
port modes. In one form or another, PBSP have existed for more than fifty years (Midgley, 2011), but it is only in the last
decade that a rapid uptake has ensued in various cities across Europe, America, Asia and Australia (Corcoran and Li,
2014). The specificity of modern PBSP, compared to rental bicycle systems, is that stations can be accessed at any time
and are fully automated and computerized. This allows for system-wide management allied with the capacity to monitor
the state of the system in real-time (Borgnat et al., 2009).
   The key phases that PBSP have undergone are referred to as generations. These include the first generation ‘white bikes’;
the second generation of coin-deposit systems; and the third generation, or information technology (IT) based systems.

 ⇑ Corresponding author at: School of Geography, Planning and Environmental Management, The University of Queensland, St Lucia Campus, Queensland
4072, Australia.
   E-mail address: i.mateobabiano@uq.edu.au (I. Mateo-Babiano).

http://dx.doi.org/10.1016/j.tra.2016.09.015
0965-8564/Ó 2016 Elsevier Ltd. All rights reserved.
296                               I. Mateo-Babiano et al. / Transportation Research Part A 94 (2016) 295–307

Recent technological and operational improvements are currently paving the way for a fourth generation, known as demand-
responsive, multimodal PBSP (Shaheen et al., 2010). In its contemporary incarnation, PBSP has grown from an estimated
70,000 bicycles operating in 78 cities in 2009 (Midgley, 2009) to 139,300 bicycles operating in 125 cities in 2010
(Shaheen et al., 2010). As of 2016, a total of 1090 PBSP have been implemented in 60 countries worldwide (Meddin and
DeMaio, 2016).
    PBSP are increasingly framed as a climate-smart, sustainable form of transport investment. By encouraging cycling, they
are purported to offer cities an opportunity to achieve transport, health and emissions goals (Kahn, 2012; DeMaio, 2009;
Cavill et al., 2007; Lee and March, 2010; Shaheen et al., 2010). There is evidence that, upon the implementation of a PBSP,
cities experience an increase in bicycle use and also in private bicycle ownership (Castillo-Manzano et al., 2015; Fishman
et al., 2014). In Barcelona a 1% increase in the bicycle trip share was observed after the introduction of Bicing (Romero,
2008); in Paris, Vélib led to an increase of 1.5% and Lyon’s Vélo’v was followed by a 2% increase in bicycle trip share
(Nadal, 2007).
    However, to date there is surprisingly limited evidence on the factors that influence PBSP use patterns and ridership
levels. This article aims to redress this research gap through an examination of Brisbane’s CityCycle scheme, the largest PBSP
in Australia. The authors focus on environmental factors: in particular, incorporating both the natural (e.g. topography) and
the built environment (e.g. land use, infrastructure). Personal and cultural characteristics which might also affect users’ rela-
tion to PBSP (Fishman et al., 2015) are not considered in this article.
    The study addresses four research questions: (1) What are the dynamics of PBSP use in terms of travel time, speed, and
distance? (2) What is the relationship between PBSP participation and cycling infrastructure? (3) How does topography
affect PBSP usage dynamics? (4) How does land use affect PBSP usage dynamics? To answer these questions, datasets
describing CityCycle usage, land use, topography, and cycling infrastructure were each obtained and spatially integrated.
The findings of this study have the potential to inform design and planning of PBSP, in their capacity to support planning
for sustainable transport infrastructure. Perhaps most importantly, this study provides a starting point for a large-scale anal-
ysis of PBSP performance worldwide to support smarter and innovative urban systems.
    This article is arranged in the following manner: The next section summarizes our current knowledge on PBSP, which is
arguably limited. This review of the literature is followed by an overview of our case study context, the various data sets
drawn upon, and the study methods. The article concludes with a discussion of the findings and charts some avenues of
future research.

2. Literature review

    A review of the available literature suggests that features of both the natural and the built environment (i.e., land use,
topography, and cycling infrastructure) influence users’ decision to use PBSP, as well as their choice of route (Schoner and
Levinson, 2013). The impact of built environment attributes (such as bicycle lanes, land uses, urban location, residential den-
sity, and the like) has been studied more extensively, while the impact of the natural environment (including topography,
slope, and weather) is under-researched.
    Two studies, one of the Capital Bikeshare scheme in Washington DC and the other of the Bixi scheme in Montreal, found a
significant correlation between the presence of bicycle lanes and PBSP usage (Buehler and Pucher, 2011; Buck and Buehler,
2012; Faghih-Imani et al., 2013). However, it remains unclear whether only segregated or off-road lanes were considered in
these studies. A study of the Bicing scheme in Barcelona found that the proximity of stations to specific land uses, such as
retail shops, schools, and employment centres, determined peak bicycle use (Kaltenbrunner et al., 2010). Another study set in
Barcelona found that stations generally become more active as one moves from the outward edges of the city into the down-
town. Also, the more central stations become noticeably more active as the day advances (Froehlich et al., 2009).
    A study of PBSP spatial and temporal dynamics in London, Minneapolis, Boston, Denver, and Washington DC found
significant variations in flow volumes over the course of a day. All five cities exhibit a trimodal distribution on weekdays,
with strong peaks at the morning and evening rush hour, and a slightly lower peak at lunchtime, contrasting with the more
normal distribution that dominates weekends - the hallmark of tourist and/or leisure activities. Usage is concentrated at the
major activity nodes and commuter stations. The systems show similarity in the distribution of journey displacements and
durations, despite differing climates and spatial extents (Zaltz et al., 2013). A study of the Vélo’v scheme in Lyon confirmed a
trimodal distribution of trips on weekdays (Borgnat et al., 2009).
    Higher residential densities around stations significantly increase the likelihood of PBSP use (Fuller et al., 2013;
Bachand-Marleau et al., 2011). The siting of PBSP stations adjacent to affordable housing or within minority neighbourhoods,
such as in the case of the NiceRide scheme in Minneapolis, can potentially tap into latent demand (Buck, 2013). Also, prox-
imity of stations to public transport stations increases the likelihood of PBSP use as commuters can seamlessly switch
between modes (Rissel, 2003; Martens, 2004). More generally, residential density, land use diversity, and street design
(the 3D paradigm) influence the distance that cyclists and pedestrians are willing to travel from an origin to a destination
point (Cervero and Kockelman, 1997; Hess et al., 2000; Krizek, 2003). Not only do land uses need to be mixed but also
complementary (i.e. residential and retail, but not agricultural and industrial) in order to link potential PBSP origins and
destinations (Ahillen et al., 2016).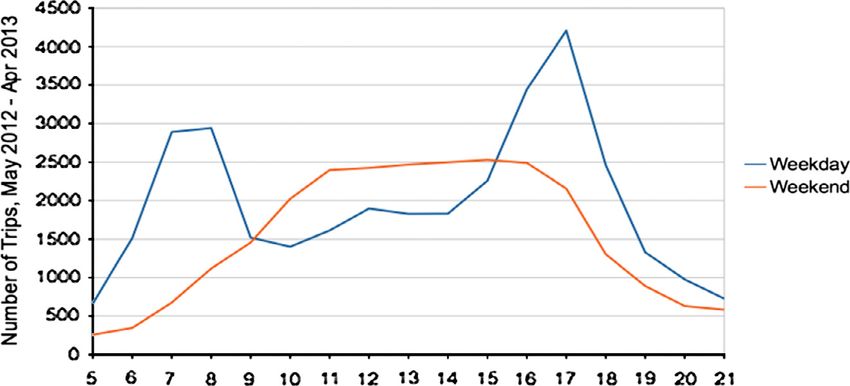
I. Mateo-Babiano et al. / Transportation Research Part A 94 (2016) 295–307                                       297

   As for the effect of topography, weather, and holidays, one study identified slopes of more than 4% as a key barrier for
PBSP users (Midgley, 2011). A study of Brisbane’s CityCycle found that public holidays, weekends and to a small extent
warmer temperatures exert a significant and positive effect on PBSP usage. Rainfall and higher wind speeds were found
to both have significant negative effects on PBSP usage. School holidays impose a significant positive influence (Corcoran
et al., 2014).
   While previous studies have provided valuable information, several gaps remain in our understanding of PBSP. For exam-
ple, more research is needed on: the relationships between station activity and proximity to specific cycling infrastructure;
the relationships between land use characteristics and PBSP location and use; the socio-economic characteristics of PBSP
users; the effect of station type (i.e. source or sink, otherwise known as station origin or destination relative to elevation);
characteristics of loop journeys; and the effect of scheme-specific policies (i.e. hire and return policy). The present study
addresses some of these issues in order to move the scholarly study of PBSP forward and inform future public bicycle sharing
and cycling policies. Specifically, the issues addressed here include the impact of cycling infrastructure, land use, and
topography on PBSP usage. In addition, the study investigates PBSP usage characteristics, including travel time, speed,
and distance.

3. Case study: Brisbane’s CityCycle

3.1. Context

    Brisbane is a city of 1.2 million located in eastern Australia, in the state of Queensland. It is the third largest city in
Australia in terms of population, and the centre of the continent’s fastest growing region. The population density is relatively
low: 845 inhabitants per sq. km. The city is crossed by a large snaking river (Brisbane River), and lies on a flood plain. The
Central Business District (CBD) is tucked into a curve on the Brisbane River. World Expo 88 created extensive access to the
river, making available parklands and places to meet and be entertained; as a result, the local population now enjoy a
friendly and relaxed outdoor lifestyle (Sanderson, 2003; Ganis et al., 2014).
    Brisbane City Council reports that there are approximately 1000 km of segregated and non-segregated bikeways
(see Table 1). The available cycling infrastructure is concentrated in the city centre, with 10% of the on-road bikeways
and 7% of the off-road bikeways located within little more than 1% of the total urban area. Some portions of Brisbane are
hilly but the all year-round subtropical climate makes the area conducive to cycling.
    While Australian cities have generally been slow in taking up PBSP, Brisbane was the second city in the country, after
Melbourne, to adopt one such scheme. The CityCycle Scheme is Australia’s largest PBSP and one of the twenty largest
schemes worldwide (O’Brien, 2013). Classified as a third-generation PBSP, CityCycle began operations in October 2010
and by the end of April 2012, its 150 stations covered an area of 17.2 sq. km – a small portion of the total City of Brisbane
area of 1338.1 sq. km (Fig. 1). The CityCycle bicycles are pedal-powered (no e-bikes are available in the system). They are
designed for urban use and have three gears. The use of helmets while cycling is required by law in Australia. The CityCycle
area encompasses 105.5 km of segregated and non-segregated bikeways. As in most third-generation schemes, CityCycle’s
fees are based on time usage; the first 30 min of any journey are free and fees apply thereafter. Up until December 2013,
the scheme’s operating hours were between 5.00 am and 10.00 pm. Thereafter, the scheme began to operate 24/7
(Brisbane City Council, 2013). The operating company is JCDecaux. The implementation of a PBSP in Brisbane has resulted
in a slight increase in cycling rates. Between May 2012 and April 2013, more than 220,000 journeys were taken by PBSP.
However, overall cycling rates remain relatively low in the city: less than 2% of the overall commute modal share (though
as high as 7% in a few inner-city suburbs) (Australian Bureau of Statistics, 2011). To date, there is a limited understanding of
the factors that encourage or discourage CityCycle’s use (Fishman, 2016).

3.2. Data and methodology

   This study draws on two key datasets: (1) CityCycle usage data, and (2) land use, transport infrastructure, and topo-
graphic data. The data were obtained from a number of sources, including:

  The City of Brisbane for CityCycle usage data. These operational data include the date- and time-stamped origin and
   destination for each trip taken. A unique ID is attached to every user. In total, 221,286 unique journeys taken between
   May 2012 and April 2013 were examined.
  OpenStreetMap (2013) for GIS data on bikeway location and type. The authors downloaded OpenStreetMap data for a
   geographical bounding box containing the CityCycle area. These data were then used to extract GIS shapefiles of
   off-road, on-road, and on-verge bikeways.1 Buffers of 400 m were created around each of the 150 CityCycle stations and
   then the length of the bikeways within each buffer was calculated.2 The term ‘‘buffer” in this case refers to circles centred

  1
    The R package ‘‘osmar” was employed to transform OpenStreetMap data into ‘‘SpatialPoints,” ‘‘SpatialLines,” and ‘‘SpatialPolygons.” These objects are
suitable for processing with the R packages ‘‘sp” and ‘‘rgeos.” All data for this study was transformed to the EPSG:3113 projected coordinate reference system
(also known as ‘‘Brisbane City Survey Grid”, GDA94/BCSG02); this way measurements around Brisbane could be made in metric units.
  2
    The R packages ‘‘sp” and ‘‘rgeos” were used for this purpose.
298 I. Mateo-Babiano et al. / Transportation Research Part A 94 (2016) 295–307
Table 1
Length of bikeway by bikeway type in Brisbane and CityCycle areas. Spearman correlation of station usage and
infrastructure type.
a
Correlation coefficient with usage considering infrastructure of this kind within 400 m of each station.
⁄ Statistically significant value (p < 0.05).
on the PBSP stations. The 400 m radius was set based on the theoretical minimum of a pedshed, or walkable catchment,
which is equivalent to a five-minute radial walking distance from any identified centre (Howard, 2008; Perry, 1929). Plan-
ning for CityCycle in the City of Brisbane has assumed that station access would be achieved mainly by walking. Based on an
assumed average walking speed of about 1.3 m/s, 5 min of walking is generally considered acceptable in the urban areas of
car-oriented places such as Australia and North America. This translates to about 400 m in terms of walking distance
(Levinson, 1992; El-Geneidy et al., 2014). Most transit firms, too, consider 400 m a reasonable access/egress standard
(Ammons, 2001; Lee, 2005). If the buffer perimeter intersected with the Brisbane River, only the length of bikeways on
the station side of the river was calculated - unless the station was next to a bridge and thus cyclists could easily cross
the river and use bikeways on both sides. Out of 150 stations, only 16 were next to bridges.
Brisbane City Council Bikeways Spatial Data (October 2011) for GIS data on bikeway location and type. These data are freely
available from an Australian government website (data.gov.au, 2013). They were cross-referenced with the OpenStreet-
Map dataset. Bikeways in this dataset are split into many categories, which differ from the OpenStreetMap categories. The
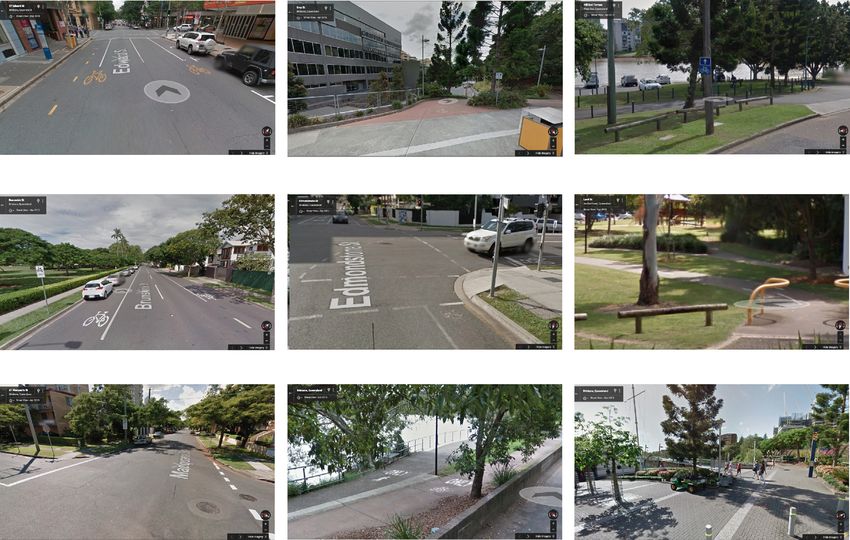
breakdown of bikeway categories and their corresponding lengths is provided in Table 1; examples of each category are
shown in Fig. 2. By way of explanation: (a) Bicycle Awareness Zones (BAZ) refer to roads with yellow painted bicycle sten-
cils. They are analogous to the ‘‘sharrows” used in Canada and the United States.3 Currently BAZ infrastructure constitutes
38% of available bikeway infrastructure within the CityCycle area. (b) Bicycle paths are dedicated exclusively to cyclists. (c)
Bicycle routes denote streets that have less vehicle traffic and are suitable for cycling. No specific facilities are provided. Blue
and white bicycle signs are present on the side of the road. (d) Bicycle lanes are dedicated on-road cycling facilities, usually
painted in green to improve bicycle awareness and traction for cyclists in wet conditions. (e) Connect is considered any
infrastructure connecting two of the other types. (f) Informal on-road and (g) Informal off road bikeways do not consist
of any infrastructure; they merely denote a popular route for cyclists. (h) Separated pathways are off-road paths dedicated
to cyclists and they go side-by-side with pedestrian paths. Lastly (i) Shared pathways are off-road paths shared by cyclists,
pedestrians, and other slow-moving vehicles (Brisbane City Council, 2016).
Australian Bureau of Statistics (ABS 2011) for 2011 census data. The data was downloaded at mesh block level. A mesh block
is the smallest spatial unit for which census data is available in the 2011 Australian census. The data contained in mesh
blocks included population, area, land use type, and dwelling counts.
Geoscience Australia (2015) for 5 m Digital Elevation Model (DEM) data.4 DEM is a digital model or 3D representation of a
terrain’s surface created from terrain elevation data. The LiDAR data does not cover all of Australia but includes areas of Bris-
bane relevant to this study. The decision to employ terrain elevation rather than slope or extension was to validate the
source-sink ratio of Brisbane’s CityCycle. Earlier studies have also used terrain elevation to analyse its impact on bikeshare
usage (see for example Midgley, 2011). In addition, slope and elevation are linked: studies which investigate the effect of
topography on bikeshare demand compute the slope by using terrain elevations (Wygonik et al., 2014).
The study employed several quantitative methods to analyse the collected data and answer the research questions. The
methods were the following:
To describe the travel time, speed, and distance of PBSP use: Descriptive statistics were employed to understand the current
PBSP trip patterns and dynamics. The performance of CityCycle in terms of time, speed, and distance was benchmarked
3
A study in Canada found that sharrows offered no objective safety benefit and that separated tracks away from motor vehicles were the safest of all facilities
(Harris et al., 2013).
4
http://www.ga.gov.au/metadata-gateway/metadata/record/gcat_89644.I. Mateo-Babiano et al. / Transportation Research Part A 94 (2016) 295–307 299
Fig. 1. The CityCycle scheme, station location and land use types.
(a) Bicycle Awareness Zone (b) Bicycle Path (c) Bicycle Route
(d) Bicycle Lane (e) Connect (f) Informal Off Road
(g) Informal On Road (h) Separated Pathway (i) Shared Pathway
Fig. 2. Types of bikeway infrastructure and treatment. Source: Google Street View.300 I. Mateo-Babiano et al. / Transportation Research Part A 94 (2016) 295–307
Table 2
Length of bikeway by location type in Brisbane and CityCycle areas. Spearman correlation of station usage and location
type.
Bikeway location Length in City of Length in Correlation P-value for
type Brisbane area CityCycle area Coefficient1 correlation
(km) (km) coefficient
Off Road 323.6 21.9 0.38I. Mateo-Babiano et al. / Transportation Research Part A 94 (2016) 295–307 301
0.01
Washington DC
Boston
London
Brisbane
0.001
New York
Minneapolis
1e-04
Density
1e-05
1e-06
1e-07
100 1000 1800 3600 10000
Time (seconds)
Fig. 3. Trip density versus travel time in Brisbane and five comparison cities.
4.1. Travel time, speed, and distance of PBSP use
The average travel time for Brisbane’s CityCycle users is 19 min, 57 s. Only 7% of journeys last longer than 30 min, thus
incurring fees. Compared to other cities for which data is available, the frequency of trips lasting longer than 30 min is some-
what lower in Brisbane than Boston (12%), Washington DC (9%), London (10%), and Minneapolis (13%) while New York City
has a similar share to Brisbane, contextualising the understanding of PBSP use in the larger context.8 Note however that New
York City’s Citbike is free to use for the first 45 min, instead of the typical first 30 min free ride employed by most other bike-
share schemes.
Fig. 3 depicts the functional relationship between trip density and trip duration.9 Clearly, the density of trips lasting more
than 60 min follows a power law relationship (trip density = trip timeb); this confirms prior findings (see Jurdak, 2013). The
value of the exponent b in the present study is 2.2 for Boston, 2.1 for Washington DC, 2.7 for London, 2.6 for Minneapolis,
2.8 for New York City, and 2.5 for Brisbane. The higher values for Boston and Washington DC are as expected given that both
schemes have the same the pricing (for registered users). After the first 90 min, a flat charge of 6 USD applies for every extra half
hour; after three hours, the charge is 28.50 USD. In London and Brisbane, the charges increase with time, so a trip of more than
three hours in London costs at least 57 USD (1GBP = 1.6 USD, 2013 figures) and in Brisbane at least 35 USD (1AUD = 1USD, 2013
figures). This power-law relationship provides useful insights on the effects of pricing schemes.
Travel speeds and trip frequencies are highest during the morning and evening peak periods. A trimodal weekday peak is
clearly evident, reflecting PBSP commute trips in the morning and evening peak periods and a smaller but significant peak
around lunchtime (see Fig. 4a and b). This also confirms prior findings (see Zaltz et al., 2013; Borgnat et al., 2009). The dis-
tances travelled are shorter on weekends than weekdays. Weekend trips are also slower than weekday trips, especially Sun-
day trips. Fig. 5 illustrates the distance data on weekends and weekdays. Weekend peaks are considerably less pronounced.
The graphs in Figs. 4 and 5 suggest that the CityCycle scheme is mainly a weekend use, often high-load-factor system,
geared toward leisure users (O’Brien et al., 2014). Possible explanations for this outcome include: (a) a high proportion of
white, young, well-educated, middle- to upper-income male users (Shaheen, 2014); (b) choice of more direct routes on flat
terrain and avoidance of traffic lights; and (c) commute trips may simply be faster than leisure trips. However, user surveys
would need to be conducted in order to confirm these explanations.
4.2. Impact of cycling infrastructure on PBSP use
The correlations between CityCycle usage (including both hires and returns) and the length of the correlations between
CityCycle usage (including both hires and returns) and the length of bikeways by bikeway type (within the 400 m station
buffer), which occur while using Brisbane City Council Bikeways Spatial Data, are presented in Table 1. The correlations
between CityCycle usage (including both hires and returns) and the length of bikeways (by on road, off road or on verge type,
8
However, in New York trips of less than a minute are not recorded.
9
This was done using the standard kernel density estimate function in the R ‘‘stats” package, which allows for the comparison of the probability of trips in
any two cities. Trips longer than 24 h were excluded as this was assumed to be grossly atypical or a recording error.302 I. Mateo-Babiano et al. / Transportation Research Part A 94 (2016) 295–307
10.00
9.50 Monday
Great circle speed (km/h)
9.00
Tuesday
8.50
Wednesday
8.00
7.50 Thursday
7.00
Friday
6.50
Saturday
6.00
5.50 Sunday
5.00
5.00
6.00
7.00
8.00
9.00
10.00
11.00
12.00
13.00
14.00
15.00
16.00
17.00
18.00
19.00
20.00
21.00
Time of the day
(a) Travel speed
Time of the day
(b) Trip frequency
Fig. 4. (a) Travel speed by time of day; (b) Trip frequency by time of day.
2
1.9 Monday
1.8 Tuesday
Wednesday
Distance (Km)
1.7
1.6 Thursday
Friday
1.5
Saturday
1.4
Sunday
1.3
1.2
5.00
6.00
7.00
8.00
9.00
10.00
11.00
12.00
13.00
14.00
15.00
16.00
17.00
18.00
19.00
20.00
21.00
Time of the Day
Fig. 5. Trip distance by time of the day.I. Mateo-Babiano et al. / Transportation Research Part A 94 (2016) 295–307 303
Table 3
The effect of cycling infrastructure and topography on PBSP use.
Dependent variable: “frequency of PBSP station usage”
Independent variable Coefficient t value Sig.
Shared Pathway 2.3009 8.474 < 0.001
Informal On Road -1.7789 -2.289 0.02
Separated Pathway 6.7845 4.270 < 0.001
Elevation -55.681 -3.029 0.003
Intercept 2721 11.530 < 0.001
R² = 0.43; n (valid) = 150; all coefficients are significant at p < 0.05.
Regression equation:
Frequency of use = 2.3009 ⁄ length (Shared Pathway) 1.7789 ⁄ length (Informal On Road) + 6.7845 ⁄ length (Sepa-
rated Pathway) 55.681 ⁄ Elevation + 2721.
within the 400 m station buffer) are presented in Table 2. As seen with both datasets, most correlations are positive while
half are significant at the p = 0.05 level. This means that PBSP use at a station tends to increase when more cycle-friendly
infrastructure is provided in the station vicinity, as the most significant correlations are for bikeway types such as shared
pathway, bicycle path, and separated pathway. One reason to explain the coefficients which are weak and non-significant
is the way cycling routes are developed in Brisbane. Cycling routes tend to include a combination of several cycling infras-
tructure types but lack the appropriate treatment at transition points to ensure connectedness and directness of route,
resulting in discontinuous routes. Further investigation to examine the impact of different infrastructure types and route
directness and connectivity on PBSP usage is imperative (see for example, in Buehler and Pucher, 2012; and Schoner and
Levinson, 2014).
A very important exception is the correlation between station usage and length of off-road bikeways, which is relatively
strong. The Pearson correlation coefficient is 0.62. This is similar to the Pearson correlation coefficient between station usage
and bicycle lane length (0.64) calculated in a prior study (Buck and Buehler, 2012), thus providing further empirical evidence
that the presence of cycling tracks fully segregated from motor vehicles boosts PBSP use and cycling rates in general. This is
further supported by examining the correlation between usage and length of segregated cycleways (marked with the
‘‘cycleway” attribute ‘‘track”) within a 400 m buffer from the OpenStreetMap data. The Spearman correlation coefficient
in this case is 0.43 (p < 0.01).
Table 3 shows the results of the regression analysis linking PBSP station usage frequency with the length of bikeways (by
type) and the station elevations. In combination, these variables, which are all significant, explain 43% of the variation in
usage. The regression coefficients work in the expected directions. High quality, safe cycling infrastructure (i.e., shared path-
ways and separated pathways) in the proximity of PBSP stations increases usage. Low quality cycling infrastructure (e.g.,
informal on road paths) decreases usage. In the case of Brisbane, the computed effect of ‘‘informal on road” infrastructure
might be spurious because there are only a few paths designated as such, and the reasons cyclists do not use those as much
might have more to do with a hilly topography, the impact of which is discussed later.
4.3. Impact of land use on PBSP use
The study of O’Brien et al. (2014) suggest that commuter cyclists are likely to use PBSP bicycles to travel between their
home or transport hub and their office while utility cyclists are likely to use PBSP bicycles to undertake weekday home-
shopping trips. Leisure cyclists are likely to engage in weekend home-park-home trips for fun and exercise while tourist
cyclists are likely to use PBSP bicycles to reach beach resorts or explore the city (O’Brien et al., 2014). Some of these assump-
tions are empirically validated in this study.
Land use types, especially residential vs. commercial, help explain PBSP commuting flows. The relationships between
origin-destination land use pairs are shown in Fig. 6. The weekday travel data plotted by hour shows that morning trips
are more likely to feature residential-to-commercial flows. Conversely, evening trips are more likely to feature
commercial-to-residential flows. Commercial-to-commercial land use trips are popular both on weekdays and weekends.
More trips originate from residential areas during weekdays than weekends, reflecting work commutes. Trips originating
from parks are more common during weekends, reflecting leisure activities.
Stations which are located near South Bank and the Botanic Gardens (nos. 119, 95, 6, 98 and 20), are the most popular on
both weekends and weekdays. The city core is associated with both work and recreation trips. One station in the centre (no.
115) records 8 times the usage on weekdays as on weekends due to the commercial nature of the surroundings. Similarly,
another station (no. 132), which is located near a cluster of commercial buildings, records 6 times the usage on weekdays as
on weekends. At the other extreme, two stations (nos. 84 and 88), which are located next to ferry terminals, achieve twice as
much usage on weekends as on weekdays. A station (no. 72) which is located near a popular park area (New Farm Park),
achieves 2.5 times the usage on weekends as on weekdays. Another station (no. 110), which is next to a park in a central304 I. Mateo-Babiano et al. / Transportation Research Part A 94 (2016) 295–307
100%
90%
80%
70%
Other
Proportion of trips 60% Commercial → Commercial
50% Residential → Commercial
40% Commercial → Residential
Park → Commercial
30%
Commercial → Park
20%
Park → Park
10%
0%
5 6 7 8 9 10 11 12 13 14 15 16 17 18 19 20 21
WEEKDAY Hour of day (beginning)
100%
90%
80%
70%
Other
Proportion of trips
60% Commercial → Commercial
50% Residential → Commercial
40% Commercial → Residential
Park → Commercial
30%
Commercial → Park
20%
Park → Park
10%
0%
5 6 7 8 9 10 11 12 13 14 15 16 17 18 19 20 21
WEEKEND Hour of day (beginning)
Fig. 6. Trips by origin and destination land use type and time of day.
neighbourhood (West End), is used five times as much on the weekends as on weekdays. This is due to the presence of a large
farmers’ market in the area on Saturday mornings.
Loop journeys – journeys that start and end at the same station – are of particular interest because they are generally
associated with leisure and weekend trips. In Brisbane they are very popular in recreational areas such as the Botanical Gar-
dens (stations 6, 19, 20, and 21) and New Farm Park (stations 72, 83, and 84). Generally, loop journeys are more likely to
begin or end in a park (6% loops) compared to commercial land use zones (4% loops). On Sundays and Saturdays, 11% and
9% of journeys, respectively, are loop journeys, compared to the weekday average of just 6%. The overall proportion of loop
journeys in Brisbane is 7%, compared to 10% in Minneapolis, 7% in Boston, 5% in Washington DC, 3% in London, and 3% in New
York City.
Table 4 shows the average travel time, distance, and speed for the most popular journeys, broken down by land use types
(excluding loops). The data show that PBSP trip characteristics vary based on land uses. Trips involving parks, either as origin
or destination, are generally slower and longer than trips involving other land uses such as commercial or residential. Clearly,
leisure trips are taken at a relatively slower pace than utilitarian trips.
4.4. Impact of topography on PBSP use
Urban topography (i.e. hilliness) is important for PBSP designers as it affects where sink and source stations can be
located. In the case of CityCycle, a wide range of hire/return ratios is observed across the 150 stations. For example, station
78 located in a central commercial neighbourhood (Fortitude Valley) has twice as many hires as returns; for station 40 in theI. Mateo-Babiano et al. / Transportation Research Part A 94 (2016) 295–307 305
Table 4
Trip journey data by land use type.a
a
Loop trips.
CBD the ratio is 1.9. At the other end of this spectrum, station 75, also in Fortitude Valley, has 1.9 times as many returns as
hires.
The correlation between the local elevation and a station’s hire/return ratio is strong (Spearman’s correlation coefficient is
0.69) implying that users avoid returning CityCycle bicycles to stations at higher elevations, thus leading to rebalancing
issues, as mentioned. In the regression analysis reported in Table 3, which combined elevation with other dependent vari-
ables (cycling infrastructure type), the coefficient for the elevation variable was negative. In Brisbane’s context, this means
that, as expected, PBSP usage decreases further from the river, accounting for a hillier terrain but also poor cycling infras-
tructure in the CBD and some inner city neighbourhoods such as Fortitude Valley, which are relatively flat.
As a clear example, station 53 at the north end of the Story Bridge is at an elevation of 32 m, which is the second highest
station in the network. It is a local maximum in terms of elevation and its hire return ratio is 2.1.
For each origin-destination pair, the correlation between the ratio of the number of trips in each direction and the gra-
dient (based on a great circle path) was calculated. This was calculated for each pair with at least 50, 100 and 200 trips
(resulting in 316, 108 and 16 pairs respectively). The Spearman correlation coefficient was between 0.21 and 0.26, indi-
cating a weak correlation between this ratio and the gradient. For instance, station 127 near the east end of the Eleanor Scho-
nell Bridge is the highest in the network at an elevation of 35 m while the station near the west end of the bridge
approximately 1000 m away is at an elevation of 7 m. Thus the average gradient is approximately 2.8%. There are 1.9 times
as many trips in the downhill direction between the two stations as in the uphill direction.
This pattern does not always hold, as considering station 25 on the periphery of the CBD and station 95 in South Bank
nearby, the average gradient is 2.1% but there are 2.1 times as many trips in the uphill direction as in the downhill direction.
The ‘‘terrain” function from the ‘‘raster” package in R was used to calculate the slope in the immediate neighbourhood of
each station. This was used in a regression of the frequency of occurrence of each origin-destination pair in the data versus
several variables: the length of shared pathway and separated pathway around each station, the elevation of each station, the
distance between the stations, the slope around each station, and the gradient between the two stations. The regression
found only very weak results with an R-squared value of 0.07 considering all trips. In particular, the gradient and slope vari-
ables were not at all significant. This is partly due to the low numbers of frequency of occurrence of pairs in the data; for
instance, the most popular trip is from station 32 to station 115 with 475 occurrences. Also, the slope variable is not a sig-
nificant variable in the regression equation to estimate the frequency of usage of any single station.
Thus, from these results we can conclude that for pairs of stations, there is generally a slight preference for trips to be
taken in the downhill direction, but the data is insufficient for a useful regression equation to be constructed with the vari-
ables we have considered.
These findings have policy implications. To rebalance the network, strategies can be adopted such as awarding bonus
minutes to users who return their bicycles at elevated stations. This policy applies in the Brussels PBSP scheme, Villo!
(Eltis, 2012). More recently, this strategy has also been adopted in Brisbane’s CityCycle in designated bonus time stations
(Brisbane City Council, 2015).
5. Conclusion
As a promising path toward urban sustainability, PBSP are being embraced by cities across the globe. However, their per-
formance and interaction with the surrounding environment (built and natural) remains poorly understood. By focusing on
Brisbane’s CityCycle program, this study sheds some light on these issues.
The authors found that: most users take short trips within the free initial period provided under the CityCycle scheme and
do not incur any charges other than for membership; PBSP use is strongly correlated with the length of off-road bikeways
near each station; inner city stations proximate to off-road infrastructure are the most active; CityCycle is more heavily used
on weekends for recreational purposes; loop journeys, which are also associated with leisure trips, are popular in Brisbane,
especially on weekends; leisure trips are taken at a relatively slower pace than utilitarian trips; during weekdays, a trimodal306 I. Mateo-Babiano et al. / Transportation Research Part A 94 (2016) 295–307
peak is clearly evident, with PBSP commute trips in the morning and evening peaks and a smaller but significant peak around
lunchtime; and users avoid returning CityCycle bicycles to stations located on hilltops.
Most of these findings corroborate prior findings, including: a significant correlation between the presence of bicycle
lanes and PBSP usage (Buehler and Pucher, 2011; Buck and Buehler, 2012; Faghih-Imani et al., 2013); PBSP stations being
more active proximate to off-road cycling infrastructure and absence of motor vehicles10 (Kaltenbrunner et al., 2010;
Froehlich et al., 2009; Cervero and Kockelman, 1997; Hess et al., 2000; Krizek, 2003; Ahillen et al., 2016); a trimodal distribution
during weekdays (Zaltz et al., 2013; Borgnat et al., 2009); a significant correlation between higher residential densities, such as
in the urban core, and PBSP usage (Fuller et al., 2013; Bachand-Marleau et al., 2011); slopes as a key barrier for PBSP users
(Midgley, 2011); and weekends being positively correlated to PBSP usage (Corcoran et al., 2014). The added value of the present
study is that the factors influencing PBSP performance and use were analysed in a holistic, rather than piecemeal, fashion for the
same system.
These findings have important policy implications. For example, it is crucial that new stations be planned near off-road
bikeways. Locating stations near less safe types of cycling infrastructure will only yield an insignificant improvement in
cycling rates. More off-road or segregated bikeways need to be provided in the inner city, where CityCycle has the potential
to perform better due to high population density and population flows. Nearby areas with recreational facilities and park
land uses (i.e. South Bank and Botanic Gardens) have higher usage rates due to the cycling infrastructure present there. Also,
more attention must be paid to the connection of popular origins and destinations by adding stations or bicycles in those.
Stations located at higher elevations – a common issue in a hilly city – might need to be rebalanced by offering users bonus
minutes for returning bicycle on hilltops. CityCycle must cater to recreational users – the scheme’s main patrons – by pro-
viding more stations and bicycles near leisure origins and destinations, such as parks. Also, non-resident users (i.e., tourists)
must be able to join the scheme as easily as possible. However, CityCycle commuters must be accommodated too, by pro-
viding better information on safe routes starting from each station and by applying traffic-calming features near stations in
residential and commercial zones.
The foregoing recommendations are subject to the qualification that case study results might not be fully applicable to
other settings (see for example Mateo-Babiano, 2015). Other cities with PBSP can certainly draw inspiration from this study’s
methods and findings. However, they are urged to perform a similar analysis of their local data in order to understand the
needs and preferences of their PBSP participants.
To extend this research, the authors recommend the following:
(a) Extend the analysis to examine weather patterns and census data on population density, socioeconomic variables, and
commute modal shares;
(b) Examine the actual route taken between each pair of stations rather than using the ‘‘great circle” gradient; and
(c) Implement a user survey to investigate the perceived impact of the built and natural environment.
References
Ahillen, M., Mateo-Babiano, I.B., Corcoran, J.J., 2016. The dynamics of bike-sharing in Washington, DC and Brisbane, Australia: implications for policy &
planning. Int. J. Sustain. Transport. http://dx.doi.org/10.1080/15568318.2014.966933.
Ammons, D., 2001. Municipal Benchmarks: Assessing Local Performance and Establishing Community Standards. Sage, Thousand Oaks, CA.
Australian Bureau of Statistics, 2011. Census of Population and Housing (Accessed 18 November 2013).
Bachand-Marleau, J., Lee, B., and El-Geneidy, A. 2011. Towards a better understanding of the factors influencing the likelihood of using shared bicycle
systems and frequency of use. Transport Research Board, 91st Annual Meeting, Washington D.C.
Borgnat, P., Abry, P., Flandrin, P., Rouquier, J.B., 2009. Studying Lyon’s Vélo’v: a statistical cyclic model. In: European Conference on Complex Systems.
Brisbane City Council, 2013. Citycycle Bike Share to be Made Available 24/7 (Accessed 14 August 2016).
Brisbane City Council, 2015. CityCycle Bonus Stations. Available at:
(Accessed 18 October 2015).
Brisbane City Council, 2016. Cycling Rules, Signs and Safety Tips. Available at: (Accessed 20 August 2016).
Brisbane City Council, 2013. New City Centre Master Plan (Accessed 5 December 2013).
Buck, D., Buehler, R., 2012. Bike Lanes and Other Determinants of Capital Bikeshare Trips. Transportation Research Board 91st Annual Meeting, Washington
DC, 2012. (Accessed 15 November 2013).
Buck, D., 2013. Encouraging equitable access to public bikesharing systems. ITE J. 83 (3), 24–27.
Buehler, R., Pucher, J. 2011. Cycling to Work in 90 large American Cities: New Evidence on the Role of Bike Paths and Lanes. Springer Science Business Media,
LLC. (Accessed 5 October 2015).
Buehler, R., Pucher, J., 2012. Cycling to work in 90 large American cities: new evidence on the role of bike paths and lanes. Transportation 39 (2), 409–432.
Capital Bike Share, 2013. Trip History Data (Accessed 11 November 2013).
Cavill, N. et al, 2007. Cycling and health: what’s the evidence? Cycl. Engl., 5–43
Cervero, R., Kockelman, K., 1997. Travel demand and the 3Ds: density, diversity, and design. Transport. Res. Part D: Transp. Environ. 2 (3), 199–219.
Corcoran, J.J., Li, T., 2014. Spatial analytical approaches in public bicycle sharing programs. J. Transp. Geogr. 41, 268–271.
10
In the case of Brisbane, the stations around South Bank and the Botanic Gardens, which are relatively close to the centre of the scheme, achieve high usage
rates due to the off-road infrastructure and absence of motor vehicles in the vicinity. Conversely, the stations in the Brisbane CBD proper (for example, stations
1–5 and 7–18) have low usage rates as no off-road infrastructure is present there, despite the high population density and population flows in the area.I. Mateo-Babiano et al. / Transportation Research Part A 94 (2016) 295–307 307
Corcoran, J.J., Li, T., Rhodes, E., Charles-Edwards, E., Mateo-Babiano, I.B., 2014. Spatio-temporal patterns of a Public Bicycle Sharing Program: the effect of
weather and calendar events. J. Transp. Geogr. 41, 292–305.
Castillo-Manzano, J.I., Castro-Nuño, M., López-Valpuesta, L., 2015. Analyzing the transition from a public bicycle system to bicycle ownership: a complex
relationship. Transport. Res. D 38, 15–26.
Data.gov.au, 2013. Brisbane City Council Bikeways Data (Accessed 27 November 2013).
DeMaio, P., 2009. Bike-sharing: history, impacts, models of provision, and future. J. Pub. Transport. 12 (4), 41–56.
El-Geneidy, A., Grimsrud, M., Wasfi, R., et al, 2014. New evidence on walking distances to transit stops: identifying redundancies and gaps using variable
service areas. Transportation 41 (1), 193–210. http://dx.doi.org/10.1007/s11116-013-9508-z.
Eltis, 2012. Uphill bonus for Villo! users in Brussels (Belgium) (Accessed 5 December
2013).
Faghih-Imani, A., Eluru, N., El-Geneidy, A., Rabbat, M., Haq, U., 2013. How Does Land Use and Urban form Impact Bicycle Flows: Evidence from the Bicycle-
sharing System (BIXI) in Montreal. Technical Paper, Department of Civil Engineering and Applied Mechanics, McGill University (Accessed 16 November 2013).
Fishman, E., Washington, S., Haworth, N., 2014. Bike share’s impact on car use: evidence from the United States, Great Britain, and Australia. Transport. Res.
D 31D, 13–20.
Fishman, E., Washington, S., Haworth, N., Watson, A., 2015. Factors influencing bike share membership: an analysis of Melbourne and Brisbane. Transport.
Res. A 71, 17–30.
Fishman, E., 2016. Bikeshare: a review of recent literature. Transp. Rev. 36 (1), 92–113.
Froehlich, J., Neumann, J., Nuria, O., 2009. Sensing and predicting the pulse of the city through shared bicycling. In: 21st International Joint Conference on
Artificial Intelligence, Pasadena, California, USA, July 11–17.
Fuller, D., Gauvin, L., Kestens, Y., Daniel, M., Fournier, M., Morency, P., Drouin, L., 2013. Impact evaluation of a public bicycle share program on cycling: a case
example of BIXI in Montreal, Quebec. Am. J. Public Health 103 (3), e85–e92. http://dx.doi.org/10.2105/AJPH.2012.300917.
Ganis, M., Minnery, J., Mateo-Babiano, I.B., 2014. The evolution of a Masterplan: Brisbane’s South Bank, 1991–2012. Urban Pol. Res. 32 (4), 499–518.
Geoscience Australia, 2015. Digital Elevation Model (DEM) of Australia Derived from LiDAR 5 Metre Grid (Accessed 27 August 2016).
Harris, M.A., Reynolds, C.C.O., Winters, M., Cripton, P.A., Shen, H., Chipman, M.L., Cusimano, M.D., Babul, S., Brubacher, J.R., Friedman, S.M., Hunte, G., Monro,
M., Vernich, L., Teschke, K., 2013. Comparing the effects of infrastructure on bicycling injury at intersections and non-intersections using a case-
crossover design. Injury Prevent. 19, 303–310.
Hess, P.M., Moudon, A.V. et al., 2000. Measuring Land Use Patterns for Transportation Research. Transportation Research Board, Washington D.C.
Howard, E., 2008. The three magnets and the town-country Magnet from ‘Garden Cities of To-morrow’. Sustain. Urban Dev. Reader, 11–14.
Hubway Data Challenge, 2013. Hubway Data Visualization Challenge (Accessed 2 June 2013).
Jurdak, R., 2013. The Impact of cost and network topology on urban mobility: a study of public bicycle usage in two US cities. PLoS ONE 8 (11), e79396.
Kahn, R., 2012. Bicycle sharing in the USA: state of the art. ITE J. 82 (9), 32.
Kaltenbrunner, A., Meza, M., Grivolla, J., Codina, J., Banches, R., 2010. Urban cycles and mobility patterns: exploring and predicting trends in a bicycle-based
transport system. Pervasive Mobile Comput. 6 (4), 455–466.
Krizek, K., 2003. Residential relocation and changes in urban travel: does neighborhood scale urban form matter? J. Am. Plan. Assoc. 69 (3), 265–281.
Lee, A., March, A., 2010. Recognising the economic role of bikes: sharing parking in Lygon Street, Carlton. Aust. Planner 47 (2), 85–93.
Lee, B.H.Y., 2005. Parcel-Level Measure of Public Transit Accessibility to Destinations. In: Levinson, D.M., Krizek, K.J., (Eds.) Access to Destinations (Default
Book Series, Volume), pp. 215–242.
Levinson, H., 1992. Urban mass transit systems. In: Edwards, J.D. (Ed.), Transportation Planning Handbook. Prentice-Hall, Englewood Cliffs, NJ.
Martens, K., 2004. The bicycle as a feedering mode: experiences from three European countries. Transp. Res. Part D 9 (4), 281–294.
Mateo-Babiano, I.B., 2015. Public bicycle sharing in Asian cities. J. Eastern Asia Soc. Transport. Stud. 11, 60–74.
Meddin, R., DeMaio, P., 2016. The Bike-sharing World Map (Accessed August 2016).
Midgley, P., 2009. The role of smart bike-sharing systems in urban mobility. Journeys 2, 23–31.
Midgley, P., 2011. Bicycle-sharing Schemes: Enhancing Sustainable Mobility in Urban Areas. United Nations, Department of Economic and Social Affairs
(Accessed 5 December 2013).
MinnPost, 2014. System Data. Accessible at: (Accessed 22 January 2014).
Nadal, L., 2007. Bike sharing sweeps Paris off its feet. Sustain. Transp. 19, 8–12.
NYC Bike Share, 2014. System Data. Accessible at: (Accessed 21 April 2014).
O’Brien, O., 2013. The top 20 World Bike Share Cities (Accessed 5 December 2013).
O’Brien, O., Cheshire, J., Batty, M., 2014. Mining bicycle sharing data for generating insights into sustainable transport systems. J. Transp. Geogr. 34, 262–273.
OpenStreetMap, 2013 (Accessed 27 November 2013).
Perry, C., 1929. The neighborhood unit. The Urban Design Reader, 54–65.
Pulliam, H.R., 1988. Sources, sinks, and population regulation. Am. Nat. 132, 652–661.
Regue, R., Recker, W., 2014. Proactive vehicle routing with inferred demand to solve the bikesharing rebalancing problem. Transport. Res. Part E: Logist.
Transport. Rev. 72, 192–209.
Rissel, C., 2003. Ride your bike: healthy policy for Australians. Health Promot. J. Aust. 14 (3), 151–153.
Romero, C., 2008. Spicycles in Barcelona. Presentation at Spicycles Conference, Bucharest, Romania, December 2008. Accessible at: .
Sanderson, R., 2003. Queensland shows the world: regionalism and modernity at Brisbane’s World Expo’ 88. J. Aust. Stud. 27 (79), 65–75.
Shaheen, S., Guzman, S., Zhang, H., 2010. Bikesharing in Europe, the Americas, and Asia: past, present and future. Transp. Res. Rec. 2143, 159–167.
Shaheen, S., 2014. Public Bikesharing in North America During a Period of Rapid Expansion: Understanding Business Models, Industry Trends and User
Impacts. Mineta Transportation Institute, MTI Report 12-29 .
Schoner, J., Levinson, D., 2013. Which Station Access Trips and Bike Share Route Choice. University of Minnesota Digital Conservancy (Accessed 01 September 2016).
Schoner, J.E., Levinson, D.M., 2014. The missing link: bicycle infrastructure networks and ridership in 74 US cities. Transportation 41 (6), 1187–1204.
Transport for London, 2013. Transport for London Developer’s Area (Accessed 1 July 2013).
Wygonik, E., McCormack, E., Rowe, D.H., 2014. Bike-share planning in cities with varied terrain. ITE J. 84 (7), 31–35.
Zaltz, A.M., O’Brien, O., Strano, E., Viana, M., 2013. The structure of spatial networks and communities in bicycle sharing systems. PLoS ONE 8 (9), e74685.
http://dx.doi.org/10.1371/journal.pone.0074685.You can also read