Domain randomization enhanced deep learning models for bird detection
←
→
Page content transcription
If your browser does not render page correctly, please read the page content below
www.nature.com/scientificreports
OPEN Domain randomization‑enhanced
deep learning models for bird
detection
Xin Mao1, Jun Kang Chow1, Pin Siang Tan1, Kuan‑fu Liu2, Jimmy Wu1, Zhaoyu Su1,
Ye Hur Cheong1, Ghee Leng Ooi1, Chun Chiu Pang3,4 & Yu‑Hsing Wang1*
Automatic bird detection in ornithological analyses is limited by the accuracy of existing models,
due to the lack of training data and the difficulties in extracting the fine-grained features required to
distinguish bird species. Here we apply the domain randomization strategy to enhance the accuracy
of the deep learning models in bird detection. Trained with virtual birds of sufficient variations in
different environments, the model tends to focus on the fine-grained features of birds and achieves
higher accuracies. Based on the 100 terabytes of 2-month continuous monitoring data of egrets, our
results cover the findings using conventional manual observations, e.g., vertical stratification of egrets
according to body size, and also open up opportunities of long-term bird surveys requiring intensive
monitoring that is impractical using conventional methods, e.g., the weather influences on egrets,
and the relationship of the migration schedules between the great egrets and little egrets.
Bird detection, including bird localization, classification, counting and density estimation, is crucial for different
applications of ornithological studies, such as investigating the stopover pattern of b irds1–3; exploring the long-
term influence of climatic change on the arrival behavior of migrant birds4 and identifying the habitat selection of
different bird species5,6. However, such research remains challenging as manual observation by experts, which is
time-consuming and labor-intensive, is the primary method for bird detection. Consequently, the collected data
are often fragmentary and of low-frequency and coarse-spatial-resolution7, resulting in a lack of training data.
Although radar s canning8,9 and traditional computer vision t echniques10–12 have been applied to automate bird
detection, these techniques are highly influenced by the environment (e.g., trees and buildings)13,14 and ineffec-
tive in extracting fine-grained features that are needed by experts to distinguish bird s pecies15. The emergence
of deep learning16–24, specifically models used for object detection25–28, has provided opportunities to enhance
the efficiency and accuracy of bird detection a lgorithms14,29–31. For instance, deep learning-based semantic seg-
mentation models are used to detect birds and other objects (sky, cloud, forest and wind turbine) from images
taken at wind f arms29–31; different deep learning-based object detection models (e.g., Faster R-CNN32, YOLO33
and RetinaNet34) are evaluated for detecting birds from aerial photographs collected by an unmanned aerial
vehicle14. However, these studies focus on distinguishing birds from other objects, instead as classifying different
bird species. Some studies focus on bird species classification, e.g., LeNet, a simple deep learning-based classi-
fier was used for classifying hawk and crow from images35. Other training strategies have also been developed
to extract fine-grained features for deep learning-based image c lassification15,36–40. Nevertheless, most of these
strategies are inappropriate for the bird detection in this project. For instance, the feature maps produced by
bilinear convolutional neural networks that generate second order bilinear features to describe two-factor varia-
tion (e.g., “style” and “content”)36,37 are extremely high-dimensional and require excessive computational memory.
Next, the limited amount of labeled bird detection data may cause overfitting and restricts the applicability of the
domain-specific transfer learning39,40. In addition, objects of low spatial resolution might reduce the c apacity41
of the weak s upervision15,34 in extracting the fine-grained features.
Thus, alternatives are urgently needed to tackle the aforementioned challenges. We first designed and installed
a tailor-made Green AI Camera (see Fig. 1a and “Methods”) at the study site, i.e., Penfold Park, Hong Kong,
China (see Fig. 1b), to automate the data collection steps of the bird videos. In addition to saving manpower
for manual bird detection, months-long data that were automatically acquired by this advanced vision sensing
device enabled comprehensive analyses on bird behavior. Next, we adopted domain randomization to enhance
1
Department of Civil and Environmental Engineering, The Hong Kong University of Science and Technology,
Hong Kong, SAR, China. 2Division of Integrative Systems and Design, The Hong Kong University of Science and
Technology, Hong Kong, SAR, China. 3School of Biological Sciences, The University of Hong Kong, Hong Kong,
SAR, China. 4Hong Kong Bird Watching Society, Hong Kong, SAR, China. *email: ceyhwang@ust.hk
Scientific Reports | (2021) 11:639 | https://doi.org/10.1038/s41598-020-80101-x 1
Vol.:(0123456789)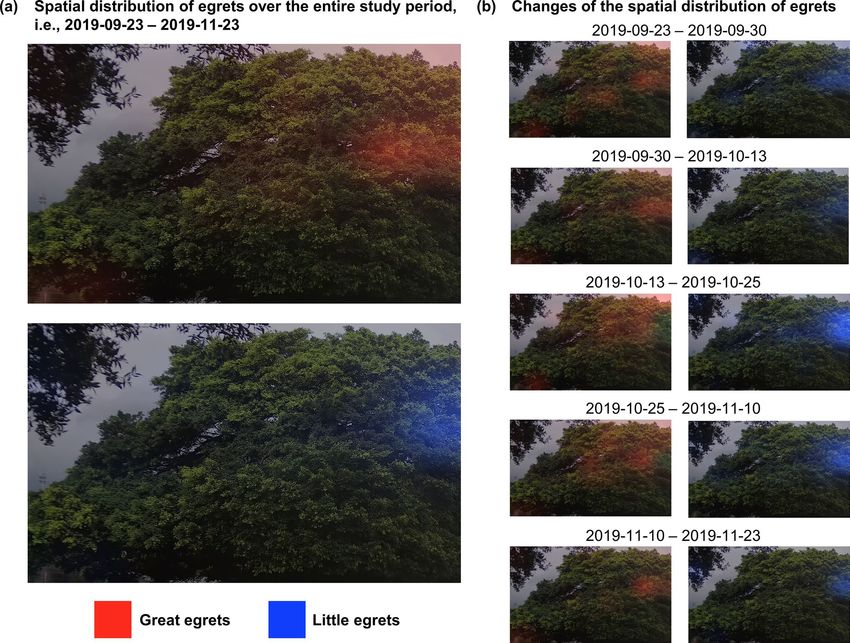
www.nature.com/scientificreports/

                                           Figure 1.  Penfold Park, the study site: (a) Green AI camera used to automatically record bird videos at this
                                           study site; (b) aerial view of the study site. The orange region represents the viewpoint of Green AI Camera; and
                                           (c) trees at the centre of the pond, which is the background image recorded by Green AI Camera.

          Scientific Reports |   (2021) 11:639 |                https://doi.org/10.1038/s41598-020-80101-x                                                 2

Vol:.(1234567890)
www.nature.com/scientificreports/
Figure 2. Application of domain randomization to enhance the accuracy of the detection models. Virtual great
egret (a) and little egret (b) were created with the open-source 3D graphics toolset Blender. Synthetic image (c)
was generated by merging virtual 3D models and 2D background images. When merging, we applied a large
variety of the prominent features, such as body size and pose, at different camera viewpoints and locations at the
images, in order to force the models to focus on the fine-grained bird features, which are essential features used
by experts for bird identification.
the accuracy of deep learning models for bird detection from the recorded video data, which is the main focus
of this study. Domain randomization, which makes use of virtual objects and/or environments to augment the
data variability for model training, are found to be effective in building models that are generalized to different
complex real-world circumstances42. For example, domain randomization with synthetic data helps to train
robotic manipulation for grasping specific o bjects43 and for learning collision a voidance44 and gets promising
results. Inspired by these studies, we generated synthetic data by creating virtual birds (great and little egrets
shown in Fig. 2) in different environments so as to further augment the data size, and at the same time, to ensure
sufficient variations for rendering the fine-grained bird features, i.e., neck and head, that are used by experts to
distinguish bird species. Then, we pretrained the Faster R-CNN32 (a deep learning detection model; see Fig. 3a)
with the synthetic data, i.e., virtual birds with different real-world backgrounds, followed by fine-tuning the
model with real data collected at the test site. Based on the detection results of the continuously monitored data,
we conducted analyses to study the bird behaviour, that were practically difficult in the past due to expensive
data collection and limited labeled data. Our results not only provide more evidence to support previous stud-
ies (e.g., nest site selection of the great egrets and little egrets), but also reveal interesting findings (e.g., weather
influences and daily schedule of egrets), suggesting the potential applications of our proposed innovation for
better habitat management, conservation policies and protection measures.
Results
Performance evaluation of the domain randomization‑enhanced deep learning model. We
selected Faster R-CNN32 to detect different bird species from real images, including great egrets, little egrets
and other birds (mainly black-crowned night herons). ResNet-5045 was used as the backbone for feature extrac-
tion, and Feature pyramid network (FPN)46 was applied to efficiently extract multiscale features. The real-world
data was collected with the Green AI Camera (see “Methods”). The labeled data were split into 900, 100 and
110 images as the training, validation and testing sets (see Methods). With domain randomization, we gener-
ated 1000 synthetic images for model pretraining, then fine-tuned the model with the 900 real images. Figure 4
depicts an example of the detection result, and the analysed video is provided in the Supplementary Video. The
domain randomization-enhanced model is capable of distinguishing and localizing bird species with high pre-
diction scores under different backgrounds (e.g., clear sky, and partially covered by leaves and branches), achiev-
ing a mean average precision (mAP, at the intersection over union of 0.5) of 87.65% (see “Methods”).
We next examined the advantages of domain randomization on augmenting the detection accuracy. Figure 5
depicts the perception achieved by the models in distinguishing bird species, based on the feature maps computed
at the last layer of the ResNet-50 backbone, together with the baseline model (Faster R-CNN trained with real
images only) for comparison. We observe that the domain randomization-enhanced model focuses on the subtle
features of the neck and head, which are the essential fine-grained features used by the experts to distinguish
bird species. On the other hand, the baseline model tends to identify bird species from the color and textural
features of the body, which may not be the optimal criteria. It should be noted that the bird size, which is one of
the features used by human experts, is not considered by the deep learning models as the observed size could
change over the distance from camera, and the depth information is unavailable from the images.
We further examined the effectiveness of domain randomization by performing quantitative evaluation. In
addition to the baseline model (Faster R-CNN trained with real images only), the weakly supervised method
based on attention m echanism15 (Fig. 3b), which locates the “parts” of birds and then extract the fine-grained
features, was also used as a training strategy for comparison. We used a small subset of the real images for the
comparison to highlight the strength of the domain randomization under a limited amount of labeled data, which
Scientific Reports | (2021) 11:639 | https://doi.org/10.1038/s41598-020-80101-x 3
Vol.:(0123456789)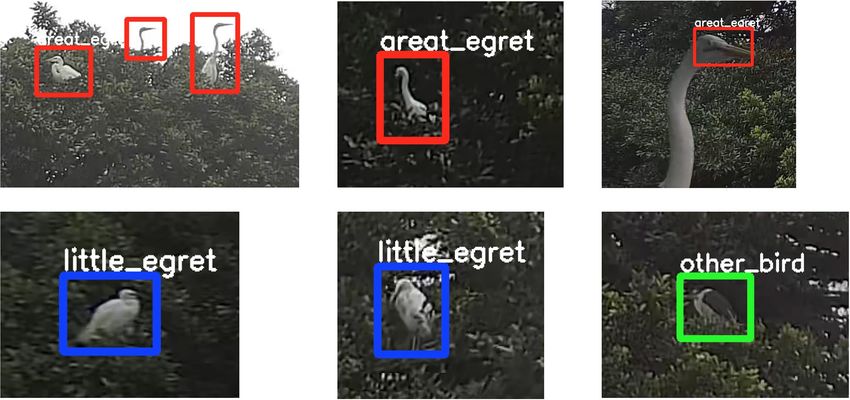
www.nature.com/scientificreports/
Figure 3. Object detection model used in this study for bird detection and the performance results of the
related experiments: (a) Faster R-CNN, which is the state-of-the-art model in most object detection tasks. In this
study, we selected ResNet-50 as the backbone for feature extraction (represented by the “convolutional layer”
stage of the figure). We also attached Feature Pyramid Network to Faster R-CNN to render effective fusion of
multiscale information; (b) Object detection models trained with the attention mechanism (represented by the
dotted region), which was used for the performance comparison with our proposed domain randomization-
enhanced deep learning model; and (c) precision-recall curve (at IoU = 0.5) for Case 1 (baseline), Case 2
(domain randomization), Case 3 (attention) and Case 4 (attention + domain randomization).
is a common challenge in most of the fine-grained visual recognition tasks39. The training set was made up of
60 real images (136 great egrets, 43 little egrets and six other birds) and 1000 synthetic images; the validation
set comprised 40 real images (85 great egrets, 12 little egrets and eight other birds) and the test set comprised
40 real images (124 great egrets, 21 little egrets and 10 other birds), respectively. Summarizing, we considered
four cases in our comparison:
1. Case 1 (baseline): Faster R-CNN, trained with the real images only.
2. Case 2 (domain randomization): Faster R-CNN, pretrained with the synthetic images, and fine-tuned with
the real images.
3. Case 3 (attention): Faster R-CNN with attention mechanism, trained with real images only.
4. Case 4 (attention + domain randomization): Faster R-CNN with attention mechanism, pretrained with the
synthetic images, and fine-tuned with the real images.
We used mAP (IoU = 0.5) to evaluate the performances of all the four cases based on the test set (see “Meth-
ods”). The reported mAPs (± standard deviation) of the four cases are 0.342 ± 0.017, 0.397 ± 0.017, 0.329 ± 0.031
and 0.385 ± 0.036. For referencing, the precision-recall curve (at IoU = 0.5) for all four cases is also presented
(see Fig. 3c), which indicates information about the trade-off between precision and recall values at different
sensitivity threshold. The domain randomization-enhanced model (Case 2) achieves the most balanced result,
with better precision scores at a wide range of recall scores between 0.11 and 0.58. Consistent with the previ-
ous analysis, Case 2 outperforms the baseline model (Case 1), asserting the effectiveness of the synthetic data
with sufficient variations in enabling the models to focus on the fine-grained features of the birds. Although
Scientific Reports | (2021) 11:639 | https://doi.org/10.1038/s41598-020-80101-x 4
Vol:.(1234567890)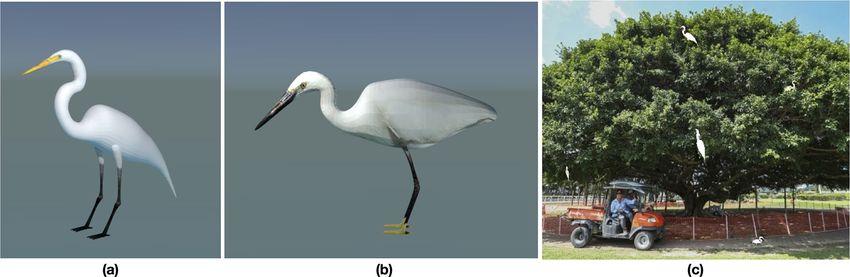
www.nature.com/scientificreports/
Figure 4. Example of bird detection result. The blue, orange and green bounding boxes are used for the
predictions of the great egrets, little egrets and other birds.
the attention mechanism-based model has state-of-the-art performance in some fine-grained visual categori-
zation tasks15, overall the model performance is unstable in our study, represented by the relatively low mAP
and high standard deviation of Cases 3 and 4. We believe that the failure in gaining advantage of the attention
mechanism is due to the restricted resolution of the regional feature maps of the birds (output of the “region of
interest pooling” stage shown in Fig. 3b)39,41, as the original dimension of bird is small (i.e., about 0.095% of the
image size, see “Methods”).
Analyses of the egret behaviour. Our analyses focus on the great egrets and little egrets because they
are the dominant species at the study site, according to the on-site monitoring and the observations during data
annotation. The following analyses are based on the detection results of the videos recorded within the periods
2019-09-23–2019–11-26, which is about 2 months, and the data size is about 100 terabytes.
Figure 6a presents the daily counts of all birds, great egrets and little egrets during the study period based
on the detection results. The daily counts (vertical axis of Fig. 6a) are inferred from the maximum number of
birds detected in a single frame per day and presumed as the number of birds staying at the study site. The great
egret numbers increase and then decrease during the period 2019-09-23–2019-09-30. This trend repetitively
occurs at the periods 2019-09-30–2019-10-13, 2019-10-13–2019-10-25, 2019-10-25–2019-11-10 and 2019-11-
10–2019-11-23. This observation is consistent with the weekly count of the great egrets in Hong Kong between
1958 and 1998, as documented by the Hong Kong Bird Watching S ociety47. We also notice a surge of the great
egret counts between the end of October and the beginning of November, which can be explained by the influx
of the migratory population during this period47. For the little egrets, our analysis shows that similar trend of
counts as the great egrets exists, with the Pearson correlation coefficient of 0.89, suggesting the highly-correlated
migratory activities between the two species. While supporting the existence of migratory population of the lit-
tle egrets47,48, this finding also motivates us to conduct more studies about the migratory behaviour of and the
interaction between egrets.
We scaled down the monitoring duration to observe the daily schedule of egrets. For each individual day,
we calculated the backward 1-h moving average of the bird counts for each time point, then presumed the time
point with the maximum average value in the morning and evening as the departure and return time of the
egrets. The departure times of the great egrets and little egrets are similar during the study period (from 04:33 to
07:31, see Fig. 6b), supported by the hypothesis testing HT1 (p-value = 0.296, which is not statistically significant
to reject that the departure times are similar; see “Methods”). On the other hand, the little egrets return later
than the great egrets on most of the days (from 16:03 to 19:10, see Fig. 6b), with the reported p-value = 0.098
(marginally significant to reject that the little egrets return earlier than or at the same time as the great egrets,
in HT2). We believe that the daily schedule of the egrets are highly related to the prey availability in different
foraging habitat preferences (e.g., at Hong Kong, little egrets mostly forage at commercial fishponds and great
egrets forage at mudflats49,50).
In addition to the temporal perspective, we analysed the spatial distribution of egrets at the study site via
heatmap visualization (see “Methods”). We observe some horizontal overlap for the great egrets and little egrets
in the middle right regions of the trees (see Fig. 7a). However, in terms of elevation, the coverage of the great
egrets is wider, i.e., from the middle to the top of trees (Fig. 7a), whereas the little egrets mainly stay around the
middle region of the trees (Fig. 7a). This pattern of vertical stratification, to a certain extent, is consistent with
the observations of other s tudies51–53, where birds align themselves vertically according to the actual body size
Scientific Reports | (2021) 11:639 | https://doi.org/10.1038/s41598-020-80101-x 5
Vol.:(0123456789)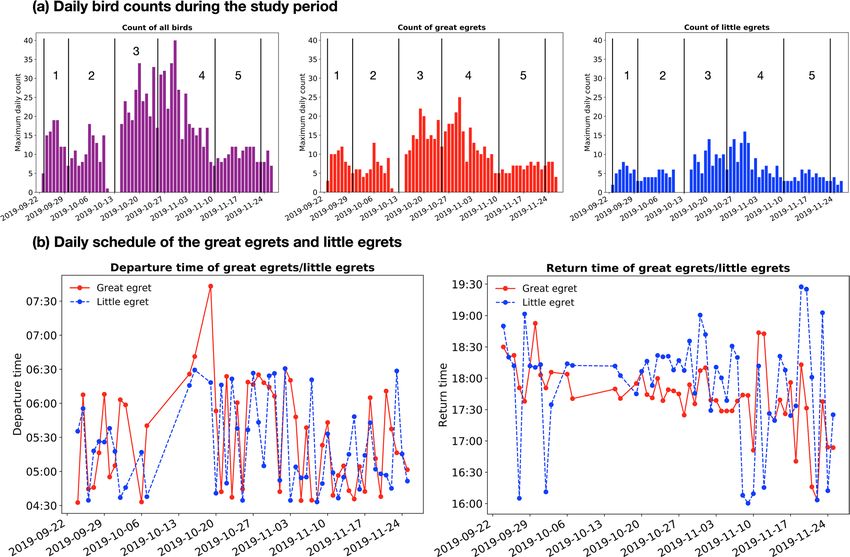
www.nature.com/scientificreports/
Figure 5. Visualization of the perception made by detection models for distinguishing bird species. We
compared our proposed method with the same architecture that is trained with real images only (known as the
baseline model). For examples of different bird species (first column), the feature maps (response of the model)
of the baseline model and domain randomization-enhanced model are shown in second and third column,
respectively. The viridis colormap is used to illustrate the intensity of the response, where yellow represents the
strongest response. The feature maps are overlaid on the bird images to depict the features used by the baseline
model (forth column) and the domain randomization-enhanced model (fifth column) for bird detection. We
realize that model pretraining with the synthetic images forces the model to focus on the fine-grained features,
such as neck shape and beak color, which are the crucial features used by experts for bird identification.
(not the body size represented in images, which is influenced by the distance to the camera). Furthermore, we
split the testing periods according to the trends observed in the bird counts (Fig. 6a) to identify the spatial change
of the egret hotspots (Fig. 7b). For great egrets, the hotspot near the middle right region of the trees remains
relatively constant in size and intensity, whereas the hotspots at the top of the trees (vulnerable to wind) shrink
and grow over time, and similar changes are observed for the little egrets. Based on the aerial view (Fig. 1b),
we observe that the hotspots (at the middle right region of Fig. 7b) are sheltered from wind/gales in the north/
south direction, which renders this location a favorable habitat for egrets to inhabiting, breeding and hatching.
We attempted to probe the relationship between weather factors and bird activities (reflected from the bird
counts) by building a multivariable linear regression model. The weather data were collected from the Hong
Kong Observatory Open D ata54. We used the natural logarithm of the total bird counts to reflect its proportional
Scientific Reports | (2021) 11:639 | https://doi.org/10.1038/s41598-020-80101-x 6
Vol:.(1234567890)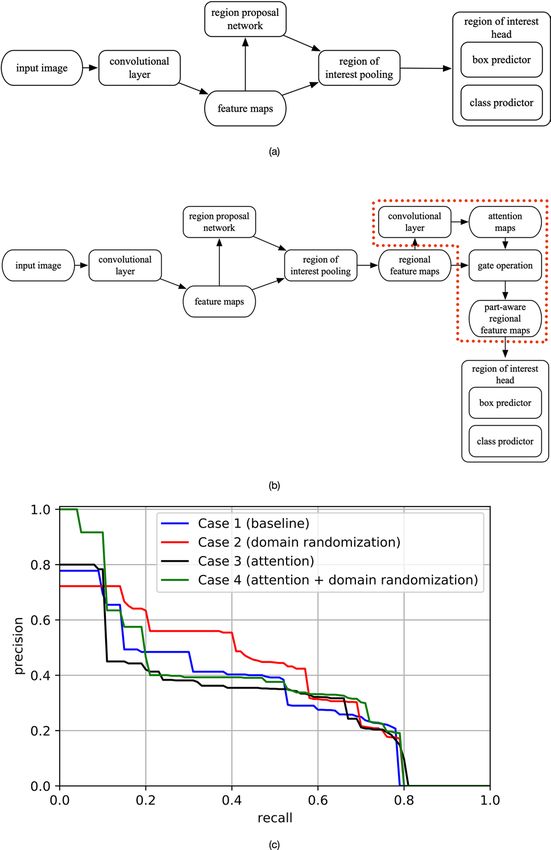
www.nature.com/scientificreports/
Figure 6. Analyses of the egret behaviour from the temporal perspective: (a) Daily bird counts during the
study period. The bar graphs show the counts of all birds, great egrets and little egrets. We observe the bird
counts increase from 2019-09-23 to 2019-09-27 and then decreases from 2019-09-27 to 2019-09-30. Such a
trend repetitively occurs at the periods 2019-09-30–2019-10-13, 2019-10-13–2019-10-25, 2019-10-25–2019-
11-10 and 2019-11-10–2019-11-23. All these sub-periods are separated with black lines in the figure. We also
realize a surge in bird counts between the end of October and the beginning of November, which is believed
to be attributed to the presence of migratory population; (b) Daily schedule of the greats and little egrets. The
departure and return time of the egrets are estimated from the peak hourly counts in the morning and evening,
respectively.
change over the study period. We detrended the data based on the hypothesis testing HT3 (p-value = 0.025,
which is statistically significant to reject that the time has no influence on the regression; see “Methods”). Table 1
summarizes the multivariable linear regression analysis. We realized that the influence of the combined weather
factors is highly statistically significant (p-value of the F-test = 0.002) and undertook further analysis on each
factor. Total Bright Sunshine (p-value = 0.031) is statistically significant in affecting bird activities, consistent
with previous studies reporting that sunlight influences migration, foraging and other activities of b irds55–57
Prevailing Wind Direction (EW, p-value = 0.011) is also statistically significant, suggesting that wind has nega-
tive effect on nestlings s urvival51. Although several studies suggested that temperature and humidity might play
crucial roles and affect the bird behaviour58,59, e.g., varying air temperature and humidity might influence water
temperature, that possible alter the activity levels of forage fishes, which in turn affects the foraging efficiency
of egrets60, our results in Table 1 shows that the Daily Mean Temperature (p-value = 0.080) and Mean Relative
Humidity (p-value = 0.089) are just marginally significant. While supporting the influence of some weather fac-
tors in affecting the bird behaviours, more rigorous analysis (e.g., collecting in situ measurements using a local
weather station) is required to provide evidence to validate the hypothesis.
Discussion
Here we leverage domain randomization to enhance the accuracy of the bird detection models. We create syn-
thetic data, i.e., virtual egrets merged on real background, to tackle the lack of labeled bird data. Importantly, we
demonstrate that by pretraining deep learning models with synthetic data of sufficient variations, we can force
the model to focus on the fine-grained features of the great egrets and little egrets, which are the crucial features
used by human experts for bird detection. This could be useful and applicable for the detection of other bird
species with limited labeled data, of which the features are highly similar (e.g., species under the same family).
We explore the application of domain randomization-enhanced deep learning models based on the 2-months
monitoring data of one testing site. Our findings provided multiple potential advantages over conventional
monitoring by the visual technique and human endurance. Our deep learning-based object detection enables
Scientific Reports | (2021) 11:639 | https://doi.org/10.1038/s41598-020-80101-x 7
Vol.:(0123456789)www.nature.com/scientificreports/
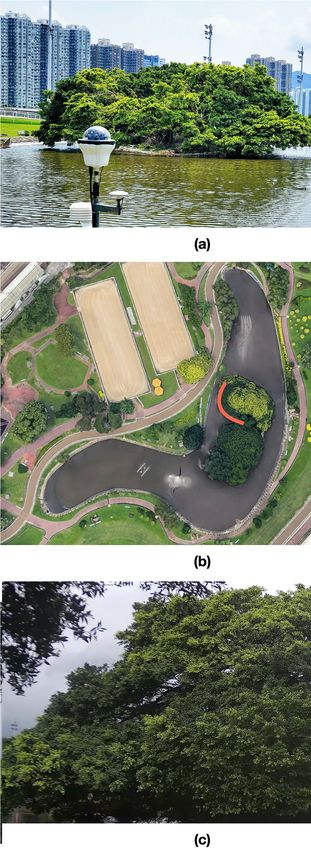
Figure 7. Spatial distribution of the great egrets (red) and little egret (blue) at the study over (a) the entire
study period; and (b) the testing periods split based on the results observed at Fig. 6a to observe the associated
changes. The intensity of hotspot reflects the bird counts at a region, which could be used as an indicator to
study the nest site selection and habitat preference of different bird species.
extreme intensive surveys for bird count of different species, behavioural study, spatial preferences and inter- and
intra-specific interaction, under different weather conditions (i.e., 12 weather factors were used in this study). In
our study, for instance, an influx of the total bird counts might indicate the presence of migratory birds, which
could be useful for the study of the bird migratory behaviour and pattern. This new technology could therefore
be applied in important breeding, stopover or wintering sites, e.g. the RAMSAR wetlands or Important Bird and
Biodiversity Areas (IBAs), in order to monitor their number, and arrival and departure times. A high speed and
resolution camera could further allow assessment of their diets and the search time for prey items. Ornithologists
could also examine the hotspots of the bird intensity maps and the influence of different weather factors (e.g.,
wind intensity, relative humidity, temperature) to investigate the nest site selection and habitat preferences of
certain bird species across different periods, e.g., during the breeding season. Furthermore, the daily record of
the bird departure and return times facilitates the planning of environmental monitoring and audit. Construction
activities, which inevitably create noise, could be scheduled at periods with the least numbers of birds, thereby
minimizing disturbance to birds during inhabiting, foraging and breeding activities. Following this study, the
established framework can be applied to other sites for monitoring same/different bird species, so as to implement
more thorough investigation to obtain more conclusive evidences in studying the bird behaviour. Furthermore,
datasets of different bird species can be continuously collected and annotated to augment the size of training
set. While automating the bird detection, more sophisticated deep learning models and training strategies can
also be implemented to enhance the model accuracy. To summarise, this study presents a paradigm shift from
the conventional bird detection methods. The domain randomization-enhanced deep learning detection models
(together with the Green AI Camera) enables wide-scale, long-term and end-to-end bird monitoring, in turn
formulating better habitat management, conservation policies and protective measures.
Scientific Reports | (2021) 11:639 | https://doi.org/10.1038/s41598-020-80101-x 8
Vol:.(1234567890)www.nature.com/scientificreports/
Overall model fit
Number of observations 62
R2 0.434
p-value (F-test) 0.002
Parameter estimates
Dependent variable ln (count of all birds)
Independent variable Coefficient p-value (Student’s t-test)
Mean pressure (hPa) − 0.0098 0.814
Absolute maximum daily temperature (°C) 0.2460 0.121
Daily mean temperature (°C)** − 0.8448 0.080
Absolute minimum daily temperature (°C) 0.0005 0.997
Mean dew point (°C) 0.7026 0.127
Mean relative humidity (%)** − 0.1921 0.089
Mean amount of cloud (%) − 0.0029 0.695
Total rainfall (mm) − 0.0105 0.447
Total bright sunshine (hours)* − 0.1303 0.031
Mean wind speed (km/h) 0.0109 0.322
Prevailing wind direction (EW, °)* 0.0070 0.011
Prevailing wind direction (NS, °) 0.0019 0.514
Table 1. Multivariable linear regression analysis. Results of the overall model fit and parameter estimates
are compiled to examine the weather influence on the bird activities. Hypothesis testings were carried out
at a significant level of 0.05. Bold values indicate the p-values less than 0.05 (statistically significant) and
0.10 (marginally significant). *Individual weather factors that are statistically significant to the count of all
birds (p-value < 0.05). **Individual weather factors that are marginally significant to the count of all birds
(p-value < 0.10).
Methods
Data collection and annotation. We invented a tailor-made Green AI Camera (see Fig. 1a). The “Green”
term refers to the application related to environmental monitoring and ecological conservation, and the “AI”
term, that represents Artificial Intelligence, refers to the combination of different types of machine learning and
deep learning algorithms used to analyse the huge amounts of data generated from this data collection system.
Green AI camera exhibits several advantages to meet the needs of long-term monitoring at outdoor areas: (i)
automatic continuous recording; (ii) high-resolution videos; (iii) high-frame rate videos; (iv) huge local data
storage; and (v) protection over harsh environments (e.g., extreme weather conditions). As shown in Fig. 1a, six
cameras of 4 K resolution are used to continuously render videos of wide field of view. The videos are acquired
at a rate of 25 frames per second with High Efficiency Video Coding (also known as H.265) for preserving the
visual quality of high-resolution inputs. The external part of the Camera is an optical window composed of two
parallel curved surfaces, that provides protection to the electronic sensors and detectors, and at the same time,
ensures clear and distortion free field of view.
In this project, we installed the Green AI Camera at Penfold Park, Hong Kong, China (22° 23′ 57.22″ N, 114°
12′ 24.42″ E; see Fig. 1b for the aerial view of the study site) to monitor the bird behaviour at trees in the centre
of a pond (see Fig. 1c for the recorded background image). The dominant bird species found at this park are
great egrets (Egretta alba) and little egrets (Egretta garzetta). Other birds includes black-crowned night herons
(Nycticorax nycticorax), Chinese pond herons (Ardeola bacchus) and eastern cattle egrets (Bubulcus ibis)7. The
data used in this study covered two periods, i.e., 2019-05-13–2019-09-13 and 2019-09-23–2019-11-26 (62 days);
the recorded time for each day was from 04:00 to 20:00, as the usage of infrared is prohibited at the study site
(which is completely dark at night). For the first period, we annotated 900 images from the data period of 2019-
05-13–2019-06-08 for model training, 100 images from the data period of 2019-08-01–2019-08-17 for model
validation, and 110 images from the data period of 2019-08-18–2019-09-13 for model testing. For the second
period, this 2-months continuous monitoring data was used for the analyses of the egret behaviour, based on
the detected egrets from the trained model. We annotated images by drawing bounding boxes for the observed
birds; three labels, which were great egrets, little egrets and other birds (most of them were black-crowned night
herons), were used, and the bird counts for each label were 2591, 1401 and 372. Our labels were sent for review
by ornithologists for verification. The image dimension was 2139 × 1281 pixels; both length and width of the
bounding boxes of birds were within the range of 42 and 160 pixels, and the average and maximum sizes of birds
were ~ 0.095% and 2.94% of the image, respectively.
Domain randomization. Domain randomization enables the generation of 3D models with desired fea-
tures and rendering them on specific 2D backgrounds. We used the open-source 3D graphics toolset Blender
(v2.79) to create virtual birds, i.e., a great egret and a little egret. Other birds, such as black-crowned night her-
ons, were not considered as their features are highly distinctive compared to egrets. During the development of
the virtual images, we applied a large variation of the prominent features (e.g., pose, and body size presented
Scientific Reports | (2021) 11:639 | https://doi.org/10.1038/s41598-020-80101-x 9
Vol.:(0123456789)www.nature.com/scientificreports/
in images due to varying distanced from camera), and environmental and operational conditions (e.g., light-
ing condition, camera viewpoint and bird location in images), which in turn forced the models to focus on the
fine-grained bird features. We used Inverse Kinematics to adjust the armature (bones) of the birds to create dif-
ferent poses. Then, we carefully selected background images that contained no real egrets for creating synthetic
images. We merged the 3D models onto the 2D backgrounds, by pasting the virtual egrets using Gaussian paste,
Poisson paste and direct paste, at any reasonable location of the images. When pasting, the bird size distribu-
tion was set as uniform, ranging from 0.04% to 0.56% of the background dimension. Other attributes included
applying light at a uniform distribution between 0.6 and 1.0 of the maximum light values of Blender, and setting
the camera viewpoint as a uniform joint distribution of the three Euler angles. All these computing procedures
were deployed by creating a python plug-in for Blender. A total of 1000 synthetic images was created for model
pretraining.
Network architecture and training details. We selected Faster R-CNN32 (Fig. 3a) for performing object
detection, due to its satisfactory performance in similar tasks14. Faster R-CNN is a two-stage detector. In the
first stage, Faster R-CNN extracts feature maps from input image using a convolutional layer (see Fig. 3a of the
manuscript) and proposes potential image regions that contain target objects with a regional proposal network.
In the second stage, based on the proposed regions, Faster R-CNN extracts the bounding box and the category
information of objects using a region of interest head. In this study, the term “convolutional layer” refers to a
feature extraction backbone used to extract and learn features from inputs; a ResNet-5045, of which the residual
networks have been useful, was used as the backbone in this study. Furthermore, we adopted Feature Pyramid
Network46, which uses a top-down structure with lateral connections to produce feature maps at all scales, to
fuse the multi-scale information46, so as to enhance the detection of tiny objects in small scale (birds only occupy
small areas of the recorded images). The overall architecture of our model was similar to the R etinaNet34, except
that the cross entropy was used as the loss function in our model, instead of the focal loss. The focal loss, which
was used to tackle the problem of imbalanced datasets, was not considered as the usage of synthesized datasets
has balanced the proportion of the great egrets and little egrets.
We applied stochastic gradient descent as the optimizer for model training, with a weight decay of 0.0001, a
momentum of 0.9 and a learning rate of 0.0005. We first pretrained the Faster R-CNN with the synthetic images,
then fine-tuned the pretrained model with the real images. The training was deployed with two GeForce RTX
2080 Ti GPUs and the batch size was two per GPU. For comparison, we used the attention mechanism15 to build
similar object detection models (see the dotted region in Fig. 3b for the attention mechanism) under the same
training settings.
Model evaluation metrics. We adopted the commonly used mean average precision (mAP) to evaluate
the model performance. The mAP metric jointly takes precision, recall and intersection over union (IoU) into
consideration, where precision measures how relevant the predictions are based on all the retrieved instances;
recall reflects the fractions of the relevant instances that are actually retrieved; and IoU defines the ratio inter-
section and union of the predicted and ground-truth bounding boxes. For a specific IoU, mAP is computed by
averaging the precision value over the recall values from 0 to 1. For all analysed cases, we trained the model ten
times and ran inference for all the individual trained models. The mAP (IoU = 0.5) was reported in the format of
“mean ± standard deviation”. We also plotted the precision-recall curves (at IoU = 0.5) for all four cases.
Perception made by models for bird detection. We attempted to visualize the feature maps produced
by deep learning models, to shed light on how models localize and classify different bird species. However, noise
is presented in the feature maps. Such noise effects are located at the null space of the matrix of the affine trans-
formation operator following these feature maps in the network, and are set to zero vectors by the affine trans-
formation and eventually omitted by the network. Therefore, in order to effectively visualize the feature maps
without the noise influence, we split the features into row space and null space of the aforementioned matrix,
followed by extracting the row-subspace features to visualize the model-related information61. Supposing that
the matrix of the affine transformation operation is A, the feature maps are x , the coordinates of x in the row
subspace are x , the feature maps in the row subspace are xr and the feature maps in the null subspace are xn, the
decomposition could be performed by the following Eqs. 61:
AAT
x = Ax (1)
xr = AT
x (2)
xn = x − xr (3)
After extracting the row-subspace features, the dimensions of the remaining feature maps were in the hun-
dreds, which is difficult to visualize. Therefore, we applied principal component analysis (PCA) to reduce the
dimensions of the remained feature maps to three and then used the weighted average of these three dimensions
for visualization. As the first dimension usually carries the most important information, we applied the heaviest
weight on the first dimension, followed by the second and third dimensions. The weights used herein were the
coefficients used to convert RGB images to grayscale images:
V = 0.7152V1 + 0.2126V2 + 0.0722V3 (4)
Scientific Reports | (2021) 11:639 | https://doi.org/10.1038/s41598-020-80101-x 10
Vol:.(1234567890)www.nature.com/scientificreports/
where V is the weighted feature map, and V1, V2 and V3 are the first, second and third dimensions after applying
PCA.
Heatmap showing the spatial distribution of egrets. Heatmaps were created to visualize the spatial
distribution of egrets based on the random field theory. We first partitioned the recorded video frames into cells
of 200 × 200 pixels. For each grid, we applied a spatial smoothing to estimate the count of the kth bird species
(k = 1 for the great egret, k = 2 for the little egret) at time t :
n
xt,pi ,k = e−βd (pi ,pj ) c t, pi , k (5)
j=1
where xt,pi ,k is the count of the kth bird species of cell pi at time t , after spatial
smoothing
over all n cells; d pi , pj
is the Euclidean distance between the central points of the cells pi , pj ; c t, pi , k is the number of birds located at
the corresponding cell; and β is a smoothing constant, satisfying β ≥ 0. Following that, we applied an exponential
smoothing on xt,pi ,k:
st,pi ,k = xt,pi ,k + (1 − )st−1,pi ,k (6)
where st,pi ,k is the count of the bird species of cell pi at time t after spatial and temporal smoothing; and α
kth
is a smoothing constant, with 0 ≤ ≤ 1. After computing all st,pi ,k , we averaged them over time to create the
heatmaps within a specified period.
Statistical analyses. We computed the Pearson correlation coefficient to identify the correlation between
the counts of the great egrets and little egrets. The daily schedule of the great egrets and little egrets were studied
with two hypothesis testings using the following null hypotheses: (i) the departure time of the great egrets and
little egrets are same (HT1, tested with a two-tailed Student’s t-test); and (ii) the return time of the great egrets
is equal to or later than the little egrets (HT2, tested with a one-tailed Student’s t-test). A significant level of 0.05
was chosen for all hypothesis testings. We also built a multivariable linear regression model to study the weather
influence on bird activities. Prior to that, hypothesis testing (HT3) was conducted with a two-tailed Student’s
t-test to examine whether data detrending was required, by stating a null hypothesis of “the time does not have
influence on the bird count-weather relationship”. Detrending was conducted to eliminate the time factor that
might bias the bird counts:
ln ÿt = ln yt − α
2 t 2
1 t − α
0 − α (7)
ẍti = xti − γ 0i − γ 1i t − γ 2i t 2 (8)
where yt and ÿt are respectively the original and detrended bird counts at the time step t ; xti and ẍti are respec-
tively the original and detrended ith weather factor at t , and α
0 , α
1, α
2, γ 0i , γ 1i and γ 2i are the regression coef-
ficients. The multivariable linear regression model was then built with detrended ÿt and ẍti:
n
ln
ÿ t = β
i ẍti (9)
i=1
where ÿ t is the fitted bird counts at time step t , n is the total number of weather factors and β i is the regression
coefficient.
Received: 27 August 2020; Accepted: 11 December 2020
References
1. Yong, W., Finch, D. M., Moore, F. R. & Kelly, J. F. Stopover ecology and habitat use of migratory Wilson’s warblers. Auk 115, 829–842
(1998).
2. Cherry, J. D. Fat deposition and length of stopover of migrant white-crowned sparrows. Auk 99, 725–732 (1982).
3. Woodrey, M. S. & Moore, F. R. Age-related differences in the stopover of fall landbird migrants on the Coast of Alabama. Auk 114,
695–707 (1997).
4. Murphy-Klassen, H. M., Underwood, T. J., Sealy, S. G. & Czyrnyj, A. A. Long-term trends in spring arrival dates of migrant birds
at delta marsh, Manitoba, relation to climate change. Auk 122, 1130–1148 (2005).
5. Bollinger, E. K. Successional changes and habitat selection in hayfield bird communities. Auk 112, 720–730 (1995).
6. Marzluff, J. M., Knick, S. T., Vekasy, M. S. & Schueck, L. S. Spatial use and habitat selection of golden eagles in Southwestern Idaho.
Auk 114, 673–687 (1997).
7. Anon. Summer 2018 Report: Egretry Counts in Hong Kong with particular reference to the Mai Po Inner Deep Bay Ramsar Site.
Hong Kong Bird Watch. Soc. Agric. Fish. Conserv. Dep. Hong Kong Spec. Adm. Reg. Gov. (2018).
8. Sutter, E. Radar als Hilfsmittel der Vogelzugsforschung. (Verlag Nicht Ermittelbar, 1957).
9. Lack, D. & Varley, G. Detection of birds by radar. Nature 156, 446–446 (1945).
10. Abd-Elrahman, A., Pearlstine, L. & Percival, F. Development of pattern recognition algorithm for automatic bird detection from
unmanned aerial vehicle imagery. Surv. Land Inf. Sci. 65, 37 (2005).
11. Wu, T., Luo, X. & Xu, Q. A new skeleton based flying bird detection method for low-altitude air traffic management. Chin. J.
Aeronaut. 31, 2149–2164 (2018).
12. T’Jampens, R., Hernandez, F., Vandecasteele, F. & Verstockt, S. Automatic detection, tracking and counting of birds in marine
video content. in 2016 Sixth International Conference on Image Processing Theory, Tools and Applications (IPTA) 1–6 (2016).
Scientific Reports | (2021) 11:639 | https://doi.org/10.1038/s41598-020-80101-x 11
Vol.:(0123456789)www.nature.com/scientificreports/
13. May, R., Steinheim, Y., Kvaløy, P., Vang, R. & Hanssen, F. Performance test and verification of an off-the-shelf automated avian
radar tracking system. Ecol. Evol. 7, 5930–5938 (2017).
14. Hong, S.-J., Han, Y., Kim, S.-Y., Lee, A.-Y. & Kim, G. Application of deep-learning methods to bird detection using unmanned
aerial vehicle imagery. Sensors 19, 1651 (2019).
15. Hu, T. & Qi, H. See Better Before Looking Closer: Weakly Supervised Data Augmentation Network for Fine-Grained Visual Clas-
sification. Preprint at https://arxiv.org/abs/1901.09891 (2019).
16. Wen, B., Li, K., Zhang, Y. & Zhang, B. Cancer neoantigen prioritization through sensitive and reliable proteogenomics analysis.
Nat. Commun. 11, 1–14 (2020).
17. Zheng, X. et al. Deep learning radiomics can predict axillary lymph node status in early-stage breast cancer. Nat. Commun. 11,
1–9 (2020).
18. Dwivedi, S. K., Tjärnberg, A., Tegnér, J. & Gustafsson, M. Deriving disease modules from the compressed transcriptional space
embedded in a deep autoencoder. Nat. Commun. 11, 1–10 (2020).
19. Golestani, N. & Moghaddam, M. Human activity recognition using magnetic induction-based motion signals and deep recurrent
neural networks. Nat. Commun. 11, 1–11 (2020).
20. Wu, S. et al. Artificial intelligence reveals environmental constraints on colour diversity in insects. Nat. Commun. 10, 4554 (2019).
21. Park, S., Kwak, W. & Lee, H. K. Accelerated spin dynamics using deep learning corrections. Sci. Rep. 10, 13772 (2020).
22. Eun, D. et al. Deep-learning-based image quality enhancement of compressed sensing magnetic resonance imaging of vessel wall:
Comparison of self-supervised and unsupervised approaches. Sci. Rep. 10, 13950 (2020).
23. Lee, C. et al. Classification of femur fracture in pelvic X-ray images using meta-learned deep neural network. Sci. Rep. 10, 13694
(2020).
24. Adhikari, B. A fully open-source framework for deep learning protein real-valued distances. Sci. Rep. 10, 13374 (2020).
25. Zou, Z., Shi, Z., Guo, Y. & Ye, J. Object Detection in 20 Years: A Survey. Preprint at https://arxiv.org/abs/1905.05055 (2019).
26. Jiao, L. et al. A survey of deep learning-based object detection. IEEE Access 7, 128837–128868 (2019).
27. He, K., Girshick, R. & Dollár, P. Rethinking Imagenet Pre-training. in Proceedings of the IEEE International Conference on Computer
Vision 4918–4927 (2019).
28. Szegedy, C. et al. Going Deeper with Convolutions. in Proceedings of the IEEE conference on computer vision and pattern recognition
1–9 (2015).
29. Yoshihashi, R., Kawakami, R., Iida, M. & Naemura, T. Evaluation of Bird Detection using Time-Lapse Images Around a Wind
Farm. in European Wind Energy Association Conference (2015).
30. Takeki, A. et al. Detection of Small Birds in Large Images by Combining a Deep Detector with Semantic Segmentation. in 2016
IEEE International Conference on Image Processing (ICIP) 3977–3981 (2016).
31. Takeki, A. et al. Combining deep features for object detection at various scales: finding small birds in landscape images. IPSJ Trans.
Comput. Vis. Appl. 8, 5 (2016).
32. Ren, S., He, K., Girshick, R. & Sun, J. Faster R-CNN: Towards real-time object detection with region proposal networks. IEEE
Trans. Pattern Anal. Mach. Intell. 39, 1137–1149 (2017).
33. Redmon, J., Divvala, S., Girshick, R. & Farhadi, A. You Only Look Once: Unified, Real-time Object Detection. in Proceedings of
the IEEE conference on computer vision and pattern recognition 779–788 (2016).
34. Lin, T.-Y., Goyal, P., Girshick, R. B., He, K. & Dollár, P. Focal loss for dense object detection. Preprint at https://arxiv.org/
abs/1708.02002(2017).
35. LeCun, Y., Bottou, L., Bengio, Y. & Haffner, P. Gradient-based learning applied to document recognition. Proc. IEEE 86, 2278–2324
(1998).
36. Lin, T.-Y., RoyChowdhury, A. & Maji, S. Bilinear CNN Models for Fine-grained Visual Recognition. in 2015 IEEE International
Conference on Computer Vision (ICCV) 1449–1457 (2015).
37. Dai, X., Gong, S., Zhong, S. & Bao, Z. Bilinear CNN model for fine-grained classification based on subcategory-similarity measure-
ment. Appl. Sci. 9, 301 (2019).
38. Ge, W., Lin, X. & Yu, Y. Weakly Supervised Complementary Parts Models for Fine-Grained Image Classification from the Bottom
Up. in Proceedings of the IEEE Conference on Computer Vision and Pattern Recognition 3034–3043 (2019).
39. Cui, Y., Song, Y., Sun, C., Howard, A. & Belongie, S. Large Scale Fine-grained Categorization and Domain-Specific Transfer Learn-
ing. in Proceedings of the 2018 IEEE/CVF Conference on Computer Vision and Pattern Recognition 4109–4118 (2018).
40. Ngiam, J. et al. Domain Adaptive Transfer Learning with Specialist Models. Preprint at https://arxiv.org/abs/1811.07056 (2018).
41. Kang, B. & Lee, Y. High-resolution neural network for driver visual attention prediction. Sensors 20, 2030 (2020).
42. Peng, X. B., Andrychowicz, M., Zaremba, W. & Abbeel, P. Sim-to-Real Transfer of Robotic Control with Dynamics Randomization.
2018 IEEE Int. Conf. Robot. Autom. ICRA3803–3810 (2018).
43. Tobin, J. et al. Domain randomization for transferring deep neural networks from simulation to the real world. Preprint at https
://arxiv.org/abs/1703.06907 (2017).
44. Sadeghi, F. & Levine, S. Cad2rl: Real single-image flight without a single real image. Preprint at https://arxiv.org/abs/1611.04201
(2016).
45. He, K., Zhang, X., Ren, S. & Sun, J. Deep residual learning for image recognition. in Proceedings of the 2016 IEEE Conference on
Computer Vision and Pattern Recognition 770–778 (2016).
46. Lin, T.-Y. et al. Feature pyramid networks for object detection. in Proceedings of the IEEE conference on computer vision and pattern
recognition 2117–2125 (2017).
47. Carey, G. The Avifauna of Hong Kong (Hong Kong Bird Watching Society, Hong Kong, 2001).
48. HKBWS. The First GPS-Tracking Research of Egrets in Hong Kong Fishpond Plays A Key Role for Both Resident and Migratory
Little Egret. The Hong Kong Bird Watching Society https://cms.hkbws.org.hk/cms/en/hkbws/egret-tracking-2 (2018).
49. Young, L. The importance to ardeids of the deep bay fish ponds, Hong Kong. Biol. Conserv. 84, 293–300 (1998).
50. Choi, Y.-S., Kwon, I.-K. & Yoo, J.-C. Foraging habitat preferences of herons and egrets. J. Ecol. Environ. 30, 237–244 (2007).
51. Pang, R. H., Yu, T. L. & Busam, M. Low breeding success of the little egret (Egretta garzetta) near residential areas and in colonies
exposed to gales: A comparison of colony in Sichuan, Southwest China, with literature. Anim. Cells Syst. 23, 235–240 (2019).
52. Post, W. Nest survival in a large ibis-heron colony during a three-year decline to extinction. Colon. Waterbirds 13, 50 (1990).
53. Hilaluddin, J., Shah, N. & Shawl, T. Nest site selection and breeding success by cattle egret and little egret in Amroha, Uttar Pradesh,
India. Waterbirds 26, 444–448 (2003).
54. HKO. Hong Kong Observatory Open Data. Hong Kong Observatory https://www.hko.gov.hk/en/cis/climat.htm (2019).
55. Wiese, J. H. Courtship and pair formation in the great egret. Auk 93, 709–724 (1976).
56. Moore, F. R. Sunset and the orientation behaviour of migrating birds. Biol. Rev. 62, 65–86 (1987).
57. Recher, H. F., Holmes, R. T., Davis, W. E. & Morton, S. Foraging behavior of Australian herons. Colon. Waterbirds 6, 1–10 (1983).
58. Pinto, D., Chivittz, C., Bergmann, F. & Tozetti, A. Microhabitat use by three species of egret (Pelecaniformes, Ardeidae) in southern
Brazil. Braz. J. Biol. 73, 791–796 (2013).
59. Corrêa, T. C., Del Lama, S. N., De Souza, J. R. & Miño, C. I. Genetic structuring among populations of the Great Egret, Ardea
alba Egretta, in major Brazilian wetlands: Genetic structuring in great egret populations. Aquat. Conserv. Mar. Freshw. Ecosyst. 26,
333–349 (2016).
Scientific Reports | (2021) 11:639 | https://doi.org/10.1038/s41598-020-80101-x 12
Vol:.(1234567890)www.nature.com/scientificreports/
60. Smith, J. P. An energy-circuit population model for Great Egrets (Ardea alba) at Lake Okeechobee, Florida, USA. Ecol. Model. 97,
1–21 (1997).
61. Mao, X., Su, Z., Tan, P. S., Chow, J. K. & Wang, Y.-H. Is Discriminator a Good Feature Extractor? Preprint at https://arxiv.org/
abs/1912.00789(2019).
Acknowledgements
This research was supported by the Hong Kong Drainage Services Department, the Hong Kong Research Grants
Council (project no. T22-603/15N) and the HKUST Sustainable Smart Campus as a Living Lab (SSC) project.
The authors are grateful to the reviewers for their valuable comments.
Author contributions
X.M., P.S.T., G.L.O. and Y.H.W. conceived and planned the experiments. K.F.L., P.S.T. and J.W. contributed to
the setup of data collection and annotation. X.M., P.S.T. and Z.S. built the deep learning models and performed
the experiments. X.M., J.K.C., P.S.T., Z.S. and Y.H.C. contributed to the interpretation of the results. X.M., J.K.C.
and Z.S. drafted the manuscript, and designed the figures and table. C.C.P. and Y.H.W. aided in the interpreta-
tion of the analysis of the egret behaviour. Y.H.W. supervised the project and was in charge of overall direction
and planning. All authors provided critical feedback and helped shape the research, analysis and manuscript.
Competing interests
The authors declare no competing interests.
Additional information
Supplementary Information The online version contains supplementary material available at https://doi.
org/10.1038/s41598-020-80101-x.
Correspondence and requests for materials should be addressed to Y.-H.W.
Reprints and permissions information is available at www.nature.com/reprints.
Publisher’s note Springer Nature remains neutral with regard to jurisdictional claims in published maps and
institutional affiliations.
Open Access This article is licensed under a Creative Commons Attribution 4.0 International
License, which permits use, sharing, adaptation, distribution and reproduction in any medium or
format, as long as you give appropriate credit to the original author(s) and the source, provide a link to the
Creative Commons licence, and indicate if changes were made. The images or other third party material in this
article are included in the article’s Creative Commons licence, unless indicated otherwise in a credit line to the
material. If material is not included in the article’s Creative Commons licence and your intended use is not
permitted by statutory regulation or exceeds the permitted use, you will need to obtain permission directly from
the copyright holder. To view a copy of this licence, visit http://creativecommons.org/licenses/by/4.0/.
© The Author(s) 2021
Scientific Reports | (2021) 11:639 | https://doi.org/10.1038/s41598-020-80101-x 13
Vol.:(0123456789)You can also read