ESTIMATING AND EVALUATING REGRESSION PREDIC- TIVE UNCERTAINTY IN DEEP OBJECT DETECTORS
←
→
Page content transcription
If your browser does not render page correctly, please read the page content below
Published as a conference paper at ICLR 2021

E STIMATING AND E VALUATING R EGRESSION P REDIC -
TIVE U NCERTAINTY IN D EEP O BJECT D ETECTORS

 Ali Harakeh                                       Steven L. Waslander
 Institute for Aerospace Studies                   Institute for Aerospace Studies
 University of Toronto                             University of Toronto
 ali.harakeh@utoronto.ca                           stevenw@utias.utoronto.ca

                                            A BSTRACT

         Predictive uncertainty estimation is an essential next step for the reliable deploy-
         ment of deep object detectors in safety-critical tasks. In this work, we focus on
         estimating predictive distributions for bounding box regression output with vari-
         ance networks. We show that in the context of object detection, training vari-
         ance networks with negative log likelihood (NLL) can lead to high entropy pre-
         dictive distributions regardless of the correctness of the output mean. We pro-
         pose to use the energy score as a non-local proper scoring rule and find that
         when used for training, the energy score leads to better calibrated and lower en-
         tropy predictive distributions than NLL. We also address the widespread use of
         non-proper scoring metrics for evaluating predictive distributions from deep ob-
         ject detectors by proposing an alternate evaluation approach founded on proper
         scoring rules. Using the proposed evaluation tools, we show that although vari-
         ance networks can be used to produce high quality predictive distributions, ad-
         hoc approaches used by seminal object detectors for choosing regression targets
         during training do not provide wide enough data support for reliable variance
         learning. We hope that our work helps shift evaluation in probabilistic object
         detection to better align with predictive uncertainty evaluation in other machine
         learning domains. Code for all models, evaluation, and datasets is available at:
         https://github.com/asharakeh/probdet.git.

1   I NTRODUCTION

Deep object detectors are being increasingly deployed as perception components in safety critical
robotics and automation applications. For reliable and safe operation, subsequent tasks using detec-
tors as sensors require meaningful predictive uncertainty estimates correlated with their outputs. As
an example, overconfident incorrect predictions can lead to non-optimal decision making in plan-
ning tasks, while underconfident correct predictions can lead to under-utilizing information in sensor
fusion. This paper investigates probabilistic object detectors, extensions of standard object detectors
that estimate predictive distributions for output categories and bounding boxes simultaneously.
This paper aims to identify the shortcomings of recent trends followed by state-of-the-art probabilis-
tic object detectors, and provides theoretically founded solutions for identified issues. Specifically,
we observe that the majority of state-of-the-art probabilistic object detectors methods (Feng et al.,
2018a; Le et al., 2018; Feng et al., 2018b; He et al., 2019; Kraus & Dietmayer, 2019; Meyer et al.,
2019; Choi et al., 2019; Feng et al., 2020; He & Wang, 2020; Harakeh et al., 2020; Lee et al., 2020)
build on deterministic object detection backends to estimate bounding box predictive distributions by
modifying such backends with variance networks (Detlefsen et al., 2019). The mean and variance
of bounding box predictive distributions estimated using variance networks are then learnt using
negative log likelihood (NLL). It is also common for these methods to use non-proper scoring rules
such as the mean Average Precision (mAP) when evaluating the quality of their output predictive
distributions.
Pitfalls of NLL We show that under standard training procedures used by common object detectors,
using NLL as a minimization objective results in variance networks that output high entropy dis-
tributions regardless of the correctness of an output bounding box. We address this issue by using

                                                  1
Published as a conference paper at ICLR 2021

the Energy Score (Gneiting & Raftery, 2007), a distance-sensitive proper scoring rule based on en-
ergy statistics (Székely & Rizzo, 2013), as an alternative for training variance networks. We show
that predictive distributions learnt with the energy score are lower entropy, better calibrated, and of
higher quality when evaluated using proper scoring rules.
Pitfalls of Evaluation We address the widespread use of non-proper scoring rules for evaluating
probabilistic object detectors by providing evaluation tools based on well established proper scoring
rules (Gneiting & Raftery, 2007) that are only minimized if the estimated predictive distribution
is equal to the true target distribution, for both classification and regression. Using the proposed
tools, we benchmark probabilistic extensions of three common object detection architectures on
in-distribution, shifted, and out-of-distribution data. Our results show that variance networks can
differentiate between in-distribution, shifted, and out-of-distribution data using their predictive en-
tropy. We find that ad-hoc approaches used by seminal object detectors for choosing their regression
targets during training do not provide a wide enough data support for reliable learning in variance
networks. Finally, we provide clear recommendations in Sec. 5 to avoid the pitfalls described above.

2     R ELATED W ORK

Estimating predictive distributions with deep neural networks has long been a topic of interest
for the research community. Bayesian Neural Networks (BNNs) (MacKay, 1992) quantify predic-
tive uncertainty by approximating a posterior distribution over a set of network parameters given a
predefined prior distribution. Variance networks (Nix & Weigend, 1994) capture predictive uncer-
tainty (Kendall & Gal, 2017) by estimating the mean and variance of every output through separate
neural network branches, and are usually trained using maximum likelihood estimation (Detlefsen
et al., 2019). Deep ensembles (Lakshminarayanan et al., 2017) train multiple copies of the vari-
ance networks from different network initializations to estimate predictive distributions from output
sample sets. Monte Carlo (MC) Dropout (Gal & Ghahramani, 2016) provides predictive uncertainty
estimates based on output samples generated by activating dropout layers at test time. We refer the
reader to the work of Detlefsen et al. (2019) for an in depth comparison of the performance of vari-
ance networks, BNNs, Ensembles, and MC dropout on regression tasks. We find variance networks
to be the most scalable of these methods for the object detection task. Finally, we do not distinguish
between aleatoric and epistemic uncertainty as is done in Kendall & Gal (2017), instead focusing
on predictive uncertainty (Detlefsen et al., 2019) which reflects both types.
State-of-the-art probabilistic object detectors model predictive uncertainty by adapting the work
of Kendall & Gal (2017) to state-of-the-art object detectors. Standard detectors are extended with a
variance network, usually referred to as the variance regression head, alongside the mean bounding
box regression head and the resulting network is trained using NLL (Feng et al., 2018a; Le et al.,
2018; He et al., 2019; Lee et al., 2020; Feng et al., 2020; He & Wang, 2020). Some approaches
combine the variance networks with dropout (Feng et al., 2018b; Kraus & Dietmayer, 2019) and use
Monte Carlo sampling at test time. Others (Meyer et al., 2019; Choi et al., 2019; Harakeh et al.,
2020) make use of the output predicted variance by modifying the non-maximum suppression post-
processing stage. Such modifications are orthogonal to the scope of the paper. It is important to
note that a substantial portion of existing probabilistic object detectors focus on non-proper scoring
metrics such as the mAP and calibration errors to evaluate the quality of their predictive distributions.
More recent methods (Harakeh et al., 2020; He & Wang, 2020) use the probability-based detection
quality (PDQ) proposed by Hall et al. (2020) for evaluating probabilistic object detectors, which can
also be shown to be non-proper (See appendix D.3). Instead, we combine the error decomposition
proposed by Hoiem et al. (2012) with well established proper scoring rules (Gneiting & Raftery,
2007) to evaluate probabilistic object detectors.

3     L EARNING B OUNDING B OX D ISTRIBUTIONS W ITH P ROPER S CORING
      RULES

3.1   N OTATION AND P ROBLEM F ORMULATION

Let x ∈ Rm be a set of m-dimensional features, y ∈ {1, . . . , K} be classification labels for K-way
classification, and z ∈ Rd be bounding box regression targets associated with object instances in the

                                                   2
Published as a conference paper at ICLR 2021

scene. Given a training dataset D = {(xn , yn , zn )}N   n=1 of N i.i.d samples from a true joint condi-
tional probability distribution p∗ (y, z|x) = p∗ (z|y, x)p∗ (y|x), we use neural networks with parame-
ter vector θ to model pθ (z|y, x) and pθ (y|x). pθ (z|y, x) is fixed to be a multivariate Gaussian distri-
bution N (µ(x, θ), Σ(x, θ)), and pθ (y|x) as a categorical distribution Cat(p1 (x, θ), . . . , pK (x, θ)).
Unless mentioned otherwise, z ∈ R4 and is represented as (umin , vmin , umax , vmax ) where the
(umin , vmin ), (umax , vmax ) are the pixel coordinates of the top-left and bottom-right bounding box
corners respectively. Throughout this work, we denote random variables with bold characters, and
the associated ground truth instances of random variables that are realized in the dataset D are itali-
cized.

3.2   P ROPER S CORING RULES

Let a be either y or z. A scoring rule is a function S(pθ , (a, x)) that assigns a numerical value to the
quality of the predictive distribution pθ (a|x) given the actual event that materialized a|x ∼ p∗ (a|x),
where a lower value indicates better quality. With slight abuse of notation, let S(pθ , p∗ ) also refer
to the expected value of S(pθ , .), then a scoring rule is said to be proper if S(p∗ , p∗ ) ≤ S(pθ , p∗ ),
with equality if and only if pθ = p∗ , meaning that the actual data generating distribution is assigned
the lowest possible score value (Gneiting & Raftery, 2007). We provide a more formal definition
of proper scoring rules in Appendix D.2. Beyond the notion of proper, scoring rules can be further
divided into local and non-local rules. Local scoring rules evaluate a predictive distribution based
on its value only at the true target, whereas non-local rules take into account other characteristics of
the predictive distribution. As an example, distance-sensitive non-local proper scoring rules reward
predictive distributions that assign probability mass to the vicinity of the true target, even if not
exactly at that target. Lakshminarayanan et al. (2017) noted the utility of using proper scoring rules
as neural network loss functions for learning predictive distributions.
Predictive uncertainty for classification tasks has been extensively studied in recent literature (Ova-
dia et al., 2019; Ashukha et al., 2020). We find commonly used proper scoring rules such as NLL
and the Brier score (Brier, 1950) to be satisfactory to learn and evaluate categorical predictive distri-
butions for probabilistic object detectors. On the other hand, regression tasks have overwhelmingly
relied on a single proper scoring rule, the negative log likelihood (Kendall & Gal, 2017; Lakshmi-
narayanan et al., 2017; Detlefsen et al., 2019). NLL is a local scoring rule and should be satisfactory
if used to evaluate pure inference problems (Bernardo, 1979). In addition, the choice of a proper
scoring rule should not matter as asymptotically, the true parameters of pθ should be recovered
by minimizing any proper scoring rule (Gneiting & Raftery, 2007) during training. Unfortunately,
object detection does not conform to these idealized assumptions, we show in the next section the
pitfalls of using NLL for learning and evaluating bounding box predictive distributions. We also
explore the Energy Score (Gneiting & Raftery, 2007), a proper and non-local scoring rule as an
alternative for learning and evaluating multivariate Gaussian predictive distributions.

3.3   N EGATIVE L OG L IKELIHOOD AS A S CORING RULE

For a multivariate Gaussian, the NLL can be written as:
                    N
                 1 X
       NLL =           (zn − µ(xn , θ))| Σ(xn , θ)−1 (zn − µ(xn , θ)) + log det Σ(xn , θ),            (1)
                2N n=1
where N is the size of the dataset D. NLL is the only proper scoring rule that is also local (Bernardo,
1979), with higher values implying a worse predictive density quality at the true target value. When
used as a loss to minimize, the first term of NLL encourages increasing the entropy of the predictive
distribution as the mean estimate diverges from the true target value. The log determinant regular-
ization term has a contrasting effect, penalizing high entropy distributions and preventing a zero loss
from infinitely high uncertainty predictions at all data points (Kendall & Gal, 2017).
It has been shown by Machete (2013) that NLL prefers predictive densities that are less informative,
penalizing overconfidence even when the probability mass is concentrated on a likely outcome. We
demonstrate the relevance of this property to object detection with a simple toy example. Bounding
box results from the state-of-the-art object detector DETR (Carion et al., 2020), trained to achieve
a competitive mAP of 42% on the COCO validation split, are assigned a single mock multivariate
Gaussian probability distribution N (µ(xn , θ), σI), where σI is a 4 × 4 isotropic covariance matrix

                                                    3
Published as a conference paper at ICLR 2021
106 106
IOU > 0.5 IOU > 0.5 IOU > 0.5
Direct Moment Matching
Negative Log Likelihood
105 IOU < 0.5 IOU < 0.5 105 IOU < 0.5
Energy Score
104 102 104
103 103
102 101 102
101 101
10 3 100 103 106 10 3 100 103 106 10 3 100 103 106
Figure 1: A toy example showing values of NLL (Blue), ES (Green) and DMM (Orange) plotted
against the parameter σ of an isotropic covariance matrix σI, when assigned to low error (Solid
Lines) and high error (Dashed Lines) detection outputs from DETR.
with σ as a variable parameter. We split the detection results into a high error set with an IOU 0.5, where the IOU is determined as the maximum IOU
with any ground truth bounding box in the scene. We plot the value of the NLL loss of both high
error and low error detection instances in Figure 1, where NLL is estimated at values of σ between
[10−2 , 105 ]. As expected, the variance value that minimizes NLL for low error detections is two
orders of magnitude lower than for high error detections. What is more interesting is the behavior of
NLL away from its minimum for both low error and high error detections. NLL is seen to penalize
lower entropy distributions (smaller values of σ) more severely than higher entropy distributions, a
property that is shown to be detrimental for training variance networks in Section 4.
3.4 T HE E NERGY S CORE (ES)
The energy score is a strictly proper and non-local (Gneiting et al., 2008) scoring rule used to assess
probabilistic forecasts of multivariate quantities. The energy score and can be written as:
N M M M
1 X 1 X 1 XX
ES = ||zn,i − zn || − ||zn,i − zn,j || , (2)
N n=1 M i=1 2M 2 i=1 j=1
where zn is the ground truth bounding box, and zn,i is the ith i.i.d sample from
N (µ(xn , θ), Σ(xn , θ)).
The energy score is derived from the energy distance (Rizzo & Székely, 2016)1 , a maximum mean
discrepancy metric (Sejdinovic et al., 2013) that measures distance between distributions of random
vectors. Beyond its theoretical appeal, the energy score has an efficient Monte-Carlo approxima-
tion (Gneiting et al., 2008) for multivariate Gaussian distributions, written as:
−1
N M M
!
1 X 1 X 1 X
ES = ||zn,i − zn || − ||zn,i − zn,i+1 || , (3)
N n=1 M i=1 2(M − 1) i=1
which requires only a single set of M samples to be drawn from N (µ(xn , θ), Σ(xn , θ)) for every
object instance in the minibatch. For training our object detectors, we find that setting M to be
equal to 1000 allows us to compute the approximation in equation 3 with very little computational
overhead. We also use the value of 1000 for M when using the energy score as an evaluation metric.
The energy score has been previously used successfully as an optimization objective in DISCO
Nets (Bouchacourt et al., 2016) to train neural networks that output samples from a posterior prob-
ability distribution, and to train generative adversarial networks (Bellemare et al., 2017). Unlike
DISCO nets, we use the energy score to learn parametric distributions with differentiable sampling.
Since the energy distance is non-local, it favors distributions that place probability mass near the
ground truth target value, even if not exactly at that target. Going back to the toy example in Figure 1,
ES is shown to be minimized at similar values to the NLL, not a surprising observation given that
both are proper scoring rules. Unlike NLL, ES penalizes high entropy distributions more severely
than low entropy ones. In the next section, we observe the effects of this property when using
1
See Appendix E.
4
Published as a conference paper at ICLR 2021

the energy score as a loss, leading to better calibrated, lower entropy predictive distributions when
compared to NLL.

3.5       D IRECT M OMENT M ATCHING (DMM)

A final scoring rule we consider in our experiments for learning predictive distributions is the Direct
Moment Matching (DMM) (Feng et al., 2020):
             N
          1 X
    DMM =       ||zn − µ(xn , θ)||p + ||Σ(xn , θ) − (zn − µ(xn , θ))(zn − µ(xn , θ))| ||p , (4)
          N n=1

where ||.||p is a p norm. DMM was previously proposed by Feng et al. (2020) as an auxiliary
loss to calibrate 3D object detectors using a multi-stage training procedure. DMM matches the
mean and covariance matrix of the predictive distribution to sample statistics obtained using the
predicted and true target values. DMM is not a proper scoring rule, we show this property with an
example. If (zn − µ(xn , θ)) is a vector of zeros, DMM is minimized only if all entries of Σ(xn , θ)
are 0 regardless of the actual covariance of the data generating distribution. We use results from
variance networks trained with DMM to discuss the pitfalls of only relying on distance-sensitive
proper scoring rules for evaluation.

4       E XPERIMENTS A ND R ESULTS
For our experiments, we extend three common object detection methods, DETR (Carion et al.,
2020), RetinaNet (Lin et al., 2017) and FasterRCNN (Ren et al., 2015) with variance networks to
estimate the parameters of a multivariate Gaussian bounding box predictive distribution. We use
cross-entropy to learn categorical predictive distributions and NLL, DMM, or ES to learn bounding
box predictive distributions, resulting in 9 architecture/regression loss combinations. All networks
have open source code and well established hyperparameters, which are used as is whenever possi-
ble. Our probabilistic extensions closely match the mAP reported in the original implementation of
their deterministic counterparts (See Fig. F.5). The value of p used for computing DMM in equa-
tion equation 4 is determined according to original norm loss used for bounding box regression in
each deterministic backend. For FasterRCNN and RetinaNet, we use the smooth L1 loss, while for
DETR, we use the L1 norm. Additional details on model training and inference implementations
can be found in Appendix A.
All probabilistic object detectors are trained on the COCO (Lin et al., 2014) training data split. For
testing, the COCO validation dataset is used as in-distribution data. Following recent recommen-
dations for evaluating the quality of predictive uncertainty estimates (Ovadia et al., 2019), we also
test our probabilistic object detectors on shifted data distributions. We construct 3 distorted versions
of the COCO validation dataset (C1, C3, and C5) by applying 18 different image corruptions intro-
duced by Hendrycks & Dietterich (2019) at increasing intensity levels [1, 3, 5]. To test on natural
dataset shift, we use OpenImages data (Kuznetsova et al., 2020) to create a shifted dataset with the
same categories as COCO and an out-of-distribution dataset that contain none of the 80 categories
found in COCO. More details on these datasets and their construction can be found in Appendix B.
The three deterministic backends are chosen to represent one-stage (RetinaNet), two-stage (Faster-
RCNN), and the recently proposed set-based (DETR) object detectors. In addition, the implementa-
tion of DETR 2 , RetinaNet, and FasterRCNN models is publicly available under the Detectron2 (Wu
et al., 2019) object detection framework, with hyperparameters optimized to produce the best detec-
tion results for the COCO dataset.

4.1       E VALUATING P REDICTIVE D ISTRIBUTIONS W ITH P ROPER S CORING RULES

Following the work of Hoiem et al. (2012), we partition output object instances into four categories:
true positives, duplicates, localization errors, and false positives based on their IOU with ground
truth instances in a scene. False positives are defined as detection instances with an IOU ≤ 0.1
with any ground truth object instance in the image frame, whereas localization errors are detection
    2
        https://github.com/facebookresearch/detr/tree/master/d2

                                                         5
Published as a conference paper at ICLR 2021
80 8000 300
Negative Log Likelihood
Negative Log Likelihood
DETR NLL
400
Mean Squared Error
DETR DMM 40 6000 250
60
Energy Score
Energy Score
DETR ES
300 30 200
4000
200 40
20 150
2000
100 20 10 100
0
COCO C1 C3 C5 OpenIm COCO C1 C3 C5 OpenIm COCO C1 C3 C5 OpenIm COCO C1 C3 C5 OpenIm COCO C1 C3 C5 OpenIm
Test Dataset Test Dataset Test Dataset Test Dataset Test Dataset
600 20 300
Negative Log Likelihood
RetinaNet NLL
Negative Log Likelihood
40 600
Mean Squared Error
500 RetinaNet DMM 18 250
Energy Score
RetinaNet ES
Energy Score
400 30 400
16 200
300
20 150
200 14 200
100 12 10 100
COCO C1 C3 C5 OpenIm COCO C1 C3 C5 OpenIm COCO C1 C3 C5 OpenIm 0 COCO C1 C3 C5 OpenIm COCO C1 C3 C5 OpenIm
Test Dataset Test Dataset Test Dataset Test Dataset Test Dataset
RCNN NLL 20 300
Negative Log Likelihood
25
Negative Log Likelihood
600 800
Mean Squared Error
RCNN DMM 18
RCNN ES 250
Energy Score
Energy Score
20 600
400 16 200
15 400
14 150
200
12 10
200 100
COCO C1 C3 C5 OpenIm COCO C1 C3 C5 OpenIm COCO C1 C3 C5 OpenIm COCO C1 C3 C5 OpenIm COCO C1 C3 C5 OpenIm
Test Dataset Test Dataset Test Dataset Test Dataset Test Dataset
(a) True Positives (b) Localization Errors
Figure 2: Average over 80 classification categories of NLL, ES, and MSE for bounding box pre-
dictive distributions estimates from probabilistic detectors with DETR, RetinaNet, and FasterRCNN
backends on in-distribution (COCO), artificially shifted (C1-C5), and naturally shifted (OpenIm)
datasets. Error bars represent the 95% confidence intervals around the mean.
True Positives Loc. Errors False Positives True Positives Loc. Errors False Positives
8.00 8.00 8.00
Negative Log Likelihood
Negative Log Likelihood
Negative Log Likelihood
DETR DETR
DETR
DETR NLL
DETR
DETR NLL
DETR
DETR NLL
1.50 DETR NLL 1.50 DETR NLL 1.50
DETR DMM DETR DMM
6.00 DETR DMM 6.00 DETR DMM 6.00 DETR DMM
Brier Score
Brier Score
Brier Score
DETR ES DETR ES
DETR ES DETR ES DETR ES
1.00 1.00 1.00
4.00 4.00 4.00
DETR
2.00 2.00 2.00 0.50 0.50 0.50 DETR NLL
DETR DMM
DETR ES
0.00 COCO C1 C3 C5 OpenIm 0.00 COCO C1 C3 C5 OpenIm 0.00 COCO C1 C3 C5 OpenIm 0.00 COCO C1 C3 C5 OpenIm 0.00 COCO C1 C3 C5 OpenIm 0.00 COCO C1 C3 C5 OpenIm
Test Dataset Test Dataset Test Dataset Test Dataset Test Dataset Test Dataset
(a) NLL (b) Brier Score
Figure 3: Average over 80 classification categories of NLL and Brier score for classification predic-
tive distributions generated using DETR. Error bars represent the 95% confidence intervals around
the mean. Similar trends are seen for RetinaNet and FasterRCNN backends in Figures F.2, F.3.
instances with 0.1 < IOU < 0.5. Detections with 0.5 ≤ IOU are considered true positives. If
multiple detections have 0.5 ≤ IOU with the same ground truth object, the one with the lower
classification score is considered a duplicate. In practice, we report the average of all scores for true
positives and duplicates at multiple IOU thresholds between 0.5 and 0.95, similar to how mAP is
evaluated for the COCO dataset. Table 1 shows that the number of output objects in each of the
four partitions is very similar for probabilistic detectors sharing the same backend, reinforcing the
fairness of our evaluation. Duplicates are seen to comprise a small fraction of the output detections,
and analyzing them is not found to provide any additional insight over evaluation of the other three
partitions (See Figure F.1). Partitioning details and IOU thresholds can be found in Appendix C.
True positives and localization errors have corresponding ground truth targets, their predictive
distributions can be evaluated using proper scoring rules. As non-local rules, we use the Brier
score (Brier, 1950) for evaluating categorical predictive distributions and the energy score for eval-
uating bounding box predictive distributions. As a local rule, we use the negative log likelihood for
evaluating both. False positives are not assigned a ground truth target; we argue that these output
instances should be classified as background and assign them the background category as their clas-
sification ground truth target. The quality of false positive categorical predictive distributions can
then be evaluated using NLL or the Brier score. Bounding box targets cannot be assigned to false
positives and as such we only look at their differential predictive entropy. In addition to using proper
6
Published as a conference paper at ICLR 2021

Table 1: Left: Results of mAP and calibration errors of probabilistic extensions of DETR, Reti-
naNet, and FasterRCNN. Right: The number of output detection instances classified as true posi-
tives (TP), duplicates, localization errors, and false positives (FP).
                          mAP(%) ↑           MCE (Cls) ↓         CE (Reg) ↓        Counts Per Partition (in-dist)
   Detector      Loss   COCO    OpenIm     COCO     OpenIm     COCO     OpenIm    TP     Dup.   Loc. Errors    FP
                 NLL    37.10   35.16      0.0735   0.0973     0.0512   0.0331   24452   1103     11228       12604
       DETR     DMM     39.82   38.88      0.0737   0.0996     0.0091   0.0171   24929   1197     10374       10406
                  ES    39.96   39.31      0.0728   0.0993     0.0068   0.0167   24914   1216     10236       9761
                 NLL    35.11   34.60      0.0260   0.0385     0.0242   0.0176   22733   2835      8992       6654
  RetinaNet     DMM     36.28   34.84      0.0244   0.0372     0.0102   0.0189   23096   2783      8902       6411
                  ES    36.02   34.97      0.0245   0.0370     0.0059   0.0138   23096   2783      8902       6411
                 NLL    37.14   34.30      0.0490   0.0713     0.0049   0.0133   23145   4841      7323       6989
 FasterRCNN     DMM     37.24   34.42      0.0496   0.0854     0.0112   0.0229   23187   4628      7165       6905
                  ES    37.32   34.75      0.0495   0.0849     0.0051   0.0121   23123   4612      7208       6760

scoring rules, we provide mAP, classification marginal calibration error (MCE) (Kumar et al., 2019)
and regression calibration error (Kuleshov et al., 2018) results for all methods in Table 1.

4.2      R ESULTS A NALYSIS

Figures 2 and 3 show the results of evaluating the classification and regression predictive distribu-
tions for true positives, localization errors, and false positives under dataset shift and using proper
scoring rules. Figure 2 also shows that the bounding box mean squared errors (MSE) for probabilis-
tic extensions of the same backend are very similar, meaning that differences between regression
proper scoring rules among these methods arise from different predictive covariance estimates and
not predictive mean estimates. Similar to what has been reported by Ovadia et al. (2019) for pure
classification tasks, we observe that the quality of both category and bounding box predictive dis-
tributions for all output partitions degrades under dataset shift. Probabilistic detectors sharing the
same detection backend are shown in Figure 3 to have similar classification scores, which we expect
given that we do not modify the classification loss function. However, when comparing regression
proper scoring rules in Figure 2, the rank of methods can vary based on which proper scoring rule
one looks at, a phenomenon we explore later in this section.
Advantages of Our Evaluation: Independently evaluating the quality of predictive distributions
for various types of errors leads to a more insightful analysis when compared to standard evaluation
using mAP or PDQ (Hall et al., 2020)3 . As an example, Figure 3 shows probabilistic extensions
of DETR to have a lower classification NLL, but a higher Brier score for their false positives when
compared to their localization errors. We conclude that for its false positives, DETR assigns high
probability mass to the correct target category while simultaneously assigning high probability mass
to a small number of other erroneous categories, leading to lower NLL but a higher Brier score when
compared to localization errors for which the probability mass is distributed across many categories.
Our observation highlights the importance of using non-local proper scoring rules alongside local
scoring rules for evaluation.
Pitfalls of Training and Evaluation Using NLL: Figure 4 shows the differential entropy of bound-
ing box predictive distributions plotted against the error, measured as the IOU of their means with
ground truth boxes. When using DETR or RetinaNet as a backend, variance networks trained with
NLL are shown to predict higher entropy values when compared to those trained with ES regard-
less of the error. This observation does not extend to the FasterRCNN backend, where variance
networks trained with NLL and ES are seen to have similar predictive entropy values. Figure 4
shows the distribution of errors, measured as IOU with ground truth, of targets used to compute
regression loss functions during training of all three detection backends. At all stages of training,
DETR and RetinaNet backends compute regression losses on targets with a much lower IOU than
FasterRCNN, which are seen in Figure 4 as low IOU tails in their estimated histograms. We ob-
serve a direct correlation between the number of low IOU regression targets used during training
and the overall magnitude of the entropy of predictive distributions learnt using NLL. DETR, using
   3
       For more details see Appendix D.3

                                                           7
Published as a conference paper at ICLR 2021
1.2
25 DETR 25 RetinaNet 25 RCNN DETR RetinaNet RCNN
Reg. Targets IOU with GT
NLL NLL 1.0
Diff. Entropy (Nats)
Diff. Entropy (Nats)
Diff. Entropy (Nats)
DMM DMM
20 20 ES 20 ES 0.8
NLL 0.6
DMM
15 ES 15 15 0.4
0.2
10 10 10
0.25 0.50 0.75 0.25 0.50 0.75 0.25 0.50 0.75 0.0
IOU with GT IOU with GT IOU with GT 0% 50% 100%
Training Progress
Figure 4: Left: Differential Entropy vs IOU with ground truth plots for bounding box predictive
distribution estimates on in-distribution data. Right: Histograms of the IOU of ground truth boxes
with boxes assigned as regression targets during network training, plotted at 0%, 50%, and a 100%
of the training process. The red dashed line signifies the 0.5 IOU level on both plots.
0.20 RCNN NLL 0.20 RCNN DMM 0.20 RCNN ES 0.20 RetinaNet NLL 0.20 RetinaNet DMM 0.20 RetinaNet ES
0.18 0.18 0.18 InDist 0.18 0.18 0.18 InDist
0.16 0.16 0.16 Shifted 0.16 0.16 0.16 Shifted
0.14 0.14 0.14 OOD 0.14 0.14 0.14 OOD
0.12 0.12 0.12 0.12 0.12 0.12
Density
Density
Density
Density
Density
Density
0.10 0.10 0.10 0.10 0.10 0.10
0.08 0.08 0.08 0.08 0.08 0.08
0.06 0.06 0.06 0.06 0.06 0.06
0.04 0.04 0.04 0.04 0.04 0.04
0.02 0.02 0.02 0.02 0.02 0.02
0.0 10.0 20.0 0.0 10.0 20.0 0.0 10.0 20.0 30.0 10.0 20.0 30.0 0.0 10.0 20.0 10.0 20.0 30.0
Diff. Entropy (Nats) Diff. Entropy (Nats) Diff. Entropy (Nats) Diff. Entropy (Nats) Diff. Entropy (Nats) Diff. Entropy (Nats)
(a) FasterRCNN (b) RetinaNet
Figure 5: Histogram of differential entropy for false positives bounding box predictive distributions
produced by probabilistic detectors with FasterRCNN and RetinaNet as a backend. Results for
DETR exhibit similar trends (Figure F.4).
the largest number of low IOU regression targets is seen in Figure 4 to learn the highest entropy
predictive distributions, while FasterRCNN using the fewest number of low IOU regression targets
learns the lowest entropy predictive distributions. Variance networks trained with ES do not exhibit
similar behavior producing a consistent magnitude for entropy regardless of their backend. Table 1
shows NLL to have a ∼ 2.7%, ∼ 0.9%, and ∼ 0.14% reduction in mAP compared to ES and DMM
when used to train DETR, RetinaNet, and FasterRCNN, respectively. Figure 4 shows that the drop
in mAP when using NLL for training is directly correlated to the number of low IOU regression
targets chosen during training by the three deterministic backends. Table 1 also shows low entropy
distributions of DETR-ES and RetinaNet-ES to achieve a much lower regression calibration error
than high entropy distributions of DETR-NLL and RetinaNet-NLL.
Columns 2 and 3 of Figure 2 show DETR-ES and RetinaNet-ES to have lower negative log likeli-
hood and energy score for bounding box predictive distributions of true positives when compared to
DETR-NLL and RetinaNet-NLL. For localization errors (Columns 4 and 5), the deviation from the
mean is large, and as such the high predictive entropy provided by DETR-NLL and RetinaNet-NLL
leads to lower values on proper scoring rules when compared to DETR-ES and RetinaNet-ES. We
notice that if one uses only NLL for evaluation, networks can achieve a constant value of NLL by
estimating high entropy predictive distributions regardless of the deviation from the mean, as seen
for DETR-NLL on true positives in Figure 2. We can mitigate this issue by evaluating with the en-
ergy score, which is seen to distinguish between correct and incorrect high entropy distributions. As
an example, DETR-NLL is shown to have lower negative log likelihood but a much higher Energy
score when compared to DETR-ES for true positives on shifted data. On the other hand, DETR-NLL
shows a slightly lower energy score when compared to DETR-ES on localization errors, meaning
the energy score can indicate that the high entropy values provided by DETR-NLL are a better esti-
mate for localization errors than the low entropy ones provided by DETR-ES. Considering that true
positives outnumber localization errors by at least two in Table 1, we argue that it is more beneficial
to train with the energy score for higher quality true positives predictive distributions over training
with the negative log likelihood and predicting high entropy distributions regardless of the true error.
Evaluating only with the energy score also has disadvantages, we show that it does not sufficiently
discriminate between the quality of low entropy distributions. Figure 2 shows that DMM-trained
networks predicting the lowest entropy (Figure 4), achieve similar values of the energy score, but
8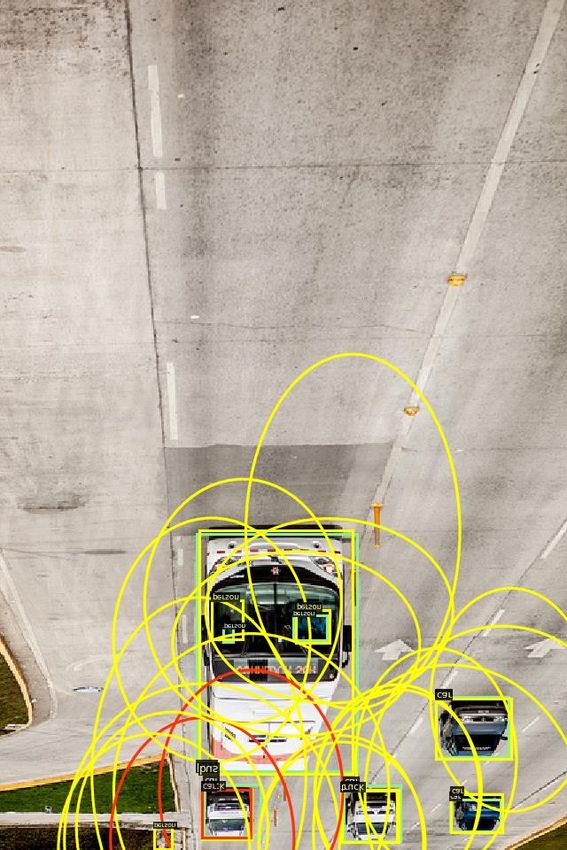
Published as a conference paper at ICLR 2021

much higher values of negative log likelihood when compared to networks trained with ES. The
higher NLL score seen in Figure 2 for all networks trained with DMM a lower quality distributions
when compared to networks trained with ES, specifically at the correct ground truth target value.
Pitfalls of Common Approaches For Regression Target Assignment: Figure 4 shows the entropy
for all methods with the DETR backend to steadily decrease as a function of decreasing error. On
the other hand, the entropy of methods using RetinaNet and FasterRCNN backend is seen to have
two inflection points, one at an IOU of 0.5 and another at a higher IOU of around 0.9. As a func-
tion of decreasing error, the entropy increases before the first inflection point, decreases between
the two, and then increases again after the second inflection point. We hypothesize that this phe-
nomenon is caused by the way backends choose their regression targets during training. DETR uses
optimal assignment to choose regression targets that span the whole range of possible IOU with
GT, even during final stages of training, as is visible in Figure 4. On the other hand, RetinaNet
and FasterRCNN use ad-hoc assignment with IOU thresholds Ren et al. (2015), a method that is
seen to provide regression targets concentrated in the 0.5 to 0.9 IOU range throughout the training
process, resulting in a much narrower data support when compared to DETR. We conclude that out-
side the data support, variance networks with RetinaNet and FasterRCNN backends fail to provide
uncertainty estimates that capture the quality of mean predictions. Our conclusion is not unprece-
dented, Detlefsen et al. (2019) has previously shown variance networks to perform poorly out of
the training data support for multiple regression tasks. However, our analysis pinpoints the reason
of such behavior in probabilistic object detectors, showing that well established training approaches
based on choosing high IOU regression targets work well for predictive mean estimation, but are not
necessarily optimal for estimating predictive uncertainty.
Performance on OOD Data: Finally, Figure 5 shows histograms of regression predictive entropy of
false positives from probabilitic detectors with DETR and FasterRCNN backend on in-distribution,
naturally shifted, and out-of-distribution data. Variance networks trained with any of the three loss
functions considered achieve the highest predictive differential entropy on out-of-distribution data,
followed by the skewed data and achieve the lowest entropy on the in-distribution data, showing that
variance networks are capable of reliably capturing dataset shift when used to predict uncertainty.

5   TAKEAWAYS
We propose to use the energy score, a proper and non-local scoring rule to train probabilistic de-
tectors. Answering the call to aim for more reliable benchmarks in numerous setups of uncertainty
estimation (Ashukha et al., 2020) we also present tools to evaluate probabilistic object detectors
using well-established proper scoring rules. We summarize our main findings below:

      • No single proper scoring rule can capture all the desirable properties of category classifica-
        tion and bounding box regression predictive distributions in probabilistic object detection.
        We recommend using both local and non-local proper scoring rules on multiple output
        partitions for a more expressive evaluation of probabilistic object detectors.
      • Using a proper scoring rule as a minimization objective does not guarantee good predictive
        uncertainty estimates for probabilistic object detectors. Non-local rules, like the energy
        score, learn better calibrated, lower entropy, and higher quality predictive distributions
        when compared to local scoring rules like NLL.
      • IOU-based assignment approaches used by established object detectors for choosing re-
        gression targets during training overly restrict data support to high IOU candidates, leading
        to unreliable bounding box predictive uncertainty estimates over the full range of possible
        errors.
      • Variance networks are capable of reliably outputting increased predictive differential en-
        tropy when presented with out-of-distribution data for the bounding box regression task.

In this paper, we provide better tools for estimation and assessment of predictive distributions, by
using variance networks with existing object detection architectures as a backend. Designing novel
architectures that aim for accurate bounding box predictive distributions, rather than just accurate
predictive means, remains an important open question.

                                                 9
Published as a conference paper at ICLR 2021

R EFERENCES
Phil Ammirato and Alexander C Berg. A mask-rcnn baseline for probabilistic object detection. In
  CVPR workshop on the Robotic Vision Probabilistic Object Detection Challenge, 2019.
Arsenii Ashukha, Alexander Lyzhov, Dmitry Molchanov, and Dmitry Vetrov. Pitfalls of in-domain
  uncertainty estimation and ensembling in deep learning. International Conference on Learning
  Representations (ICLR), 2020.
Marc G Bellemare, Ivo Danihelka, Will Dabney, Shakir Mohamed, Balaji Lakshminarayanan,
 Stephan Hoyer, and Rémi Munos. The cramer distance as a solution to biased wasserstein gradi-
 ents. arXiv preprint arXiv:1705.10743, 2017.
José M Bernardo. Expected information as expected utility. the Annals of Statistics, pp. 686–690,
  1979.
Diane Bouchacourt, Pawan K Mudigonda, and Sebastian Nowozin. Disco nets : Dissim-
  ilarity coefficients networks. In D. D. Lee, M. Sugiyama, U. V. Luxburg, I. Guyon,
  and R. Garnett (eds.), Advances in Neural Information Processing Systems 29, pp.
  352–360. Curran Associates, Inc., 2016.   URL http://papers.nips.cc/paper/
  6143-disco-nets-dissimilarity-coefficients-networks.pdf.
Glenn W Brier. Verification of forecasts expressed in terms of probability. Monthly weather review,
  78(1):1–3, 1950.
Nicolas Carion, Francisco Massa, Gabriel Synnaeve, Nicolas Usunier, Alexander Kirillov, and
  Sergey Zagoruyko. End-to-end object detection with transformers. 2020.
Jiwoong Choi, Dayoung Chun, Hyun Kim, and Hyuk-Jae Lee. Gaussian yolov3: An accurate and
  fast object detector using localization uncertainty for autonomous driving. In Proceedings of the
  IEEE International Conference on Computer Vision, pp. 502–511, 2019.
Nicki S. Detlefsen, Martin Jorgensen, and Soren Hauberg. Reliable training and estimation of vari-
  ance networks. In Advances in Neural Information Processing Systems 32, pp. 6326–6336. 2019.
Di Feng, Lars Rosenbaum, and Klaus Dietmayer. Leveraging heteroscedastic aleatoric uncertainties
  for robust real-time lidar 3d object detection. In 2018 21st International Conference on Intelligent
  Transportation Systems (ITSC), 2018a.
Di Feng, Lars Rosenbaum, and Klaus Dietmayer. Towards safe autonomous driving: Capture un-
  certainty in the deep neural network for lidar 3d vehicle detection. In 2018 21st International
  Conference on Intelligent Transportation Systems (ITSC), 2018b.
Di Feng, Lars Rosenbaum, Claudius Glaeser, Fabian Timm, and Klaus Dietmayer. Can we trust
  you? on calibration of a probabilistic object detector for autonomous driving. The IEEE/RSJ
  International Conference on Intelligent Robots and Systems (IROS), 2020.
Yarin Gal and Zoubin Ghahramani. Dropout as a bayesian approximation: Representing model
  uncertainty in deep learning. In international conference on machine learning, pp. 1050–1059,
  2016.
Tilmann Gneiting and Adrian E Raftery. Strictly proper scoring rules, prediction, and estimation.
   Journal of the American statistical Association, 102(477):359–378, 2007.
Tilmann Gneiting, Larissa I Stanberry, Eric P Grimit, Leonhard Held, and Nicholas A Johnson.
   Assessing probabilistic forecasts of multivariate quantities, with an application to ensemble pre-
   dictions of surface winds. Test, 17(2):211, 2008.
Alexey A Gritsenko, Tim Salimans, Rianne van den Berg, Jasper Snoek, and Nal Kalchbrenner. A
  spectral energy distance for parallel speech synthesis. arXiv preprint arXiv:2008.01160, 2020.
David Hall, Feras Dayoub, John Skinner, Haoyang Zhang, Dimity Miller, Peter Corke, Gustavo
  Carneiro, Anelia Angelova, and Niko Sünderhauf. Probabilistic object detection: Definition and
  evaluation. In The IEEE Winter Conference on Applications of Computer Vision, pp. 1031–1040,
  2020.

                                                 10
Published as a conference paper at ICLR 2021
Ali Harakeh, Michael Smart, and Steven L Waslander. Bayesod: A bayesian approach for un-
certainty estimation in deep object detectors. 2020 International Conference on Robotics and
Automation (ICRA), 2020.
Yihui He and Jianren Wang. Deep mixture density network for probabilistic object detection. The
IEEE/RSJ International Conference on Intelligent Robots and Systems (IROS), 2020.
Yihui He, Chenchen Zhu, Jianren Wang, Marios Savvides, and Xiangyu Zhang. Bounding box
regression with uncertainty for accurate object detection. In Proceedings of the IEEE Conference
on Computer Vision and Pattern Recognition, pp. 2888–2897, 2019.
Dan Hendrycks and Thomas Dietterich. Benchmarking neural network robustness to common cor-
ruptions and perturbations. International Conference on Learning Representations (ICLR), 2019.
Derek Hoiem, Yodsawalai Chodpathumwan, and Qieyun Dai. Diagnosing error in object detectors.
In European conference on computer vision, pp. 340–353. Springer, 2012.
Alex Kendall and Yarin Gal. What uncertainties do we need in bayesian deep learning for computer
vision? In I. Guyon, U. V. Luxburg, S. Bengio, H. Wallach, R. Fergus, S. Vishwanathan, and
R. Garnett (eds.), Advances in Neural Information Processing Systems 30, pp. 5574–5584. Curran
Associates, Inc., 2017.
Florian Kraus and Klaus Dietmayer. Uncertainty estimation in one-stage object detection. 2019 21st
International Conference on Intelligent Transportation Systems (ITSC), 2019.
Volodymyr Kuleshov, Nathan Fenner, and Stefano Ermon. Accurate uncertainties for deep learning
using calibrated regression. In Jennifer Dy and Andreas Krause (eds.), Proceedings of the 35th
International Conference on Machine Learning, volume 80 of Proceedings of Machine Learning
Research, pp. 2796–2804, Stockholmsmässan, Stockholm Sweden, 10–15 Jul 2018. PMLR. URL
http://proceedings.mlr.press/v80/kuleshov18a.html.
Ananya Kumar, Percy S Liang, and Tengyu Ma. Verified uncertainty calibration. In Advances in
Neural Information Processing Systems 32, pp. 3792–3803. 2019.
Alina Kuznetsova, Hassan Rom, Neil Alldrin, Jasper Uijlings, Ivan Krasin, Jordi Pont-Tuset, Shahab
Kamali, Stefan Popov, Matteo Malloci, Alexander Kolesnikov, et al. The open images dataset v4.
International Journal of Computer Vision, pp. 1–26, 2020.
Balaji Lakshminarayanan, Alexander Pritzel, and Charles Blundell. Simple and scalable predictive
uncertainty estimation using deep ensembles. In I. Guyon, U. V. Luxburg, S. Bengio, H. Wallach,
R. Fergus, S. Vishwanathan, and R. Garnett (eds.), Advances in Neural Information Processing
Systems 30, pp. 6402–6413. Curran Associates, Inc., 2017.
Michael Truong Le, Frederik Diehl, Thomas Brunner, and Alois Knol. Uncertainty estimation for
deep neural object detectors in safety-critical applications. In 2018 21st International Conference
on Intelligent Transportation Systems (ITSC). IEEE, 2018.
Youngwan Lee, Joong-won Hwang, Hyung-Il Kim, Kimin Yun, and Joungyoul Park. Localization
uncertainty estimation for anchor-free object detection. arXiv preprint arXiv:2006.15607, 2020.
Chun-Liang Li, Wei-Cheng Chang, Yu Cheng, Yiming Yang, and Barnabás Póczos. Mmd gan:
Towards deeper understanding of moment matching network. In Advances in Neural Information
Processing Systems, pp. 2203–2213, 2017.
Yujia Li, Kevin Swersky, and Rich Zemel. Generative moment matching networks. In International
Conference on Machine Learning, pp. 1718–1727, 2015.
Tsung-Yi Lin, Michael Maire, Serge Belongie, James Hays, Pietro Perona, Deva Ramanan, Piotr
Dollár, and C Lawrence Zitnick. Microsoft coco: Common objects in context. In European
conference on computer vision, pp. 740–755. Springer, 2014.
Tsung-Yi Lin, Priya Goyal, Ross Girshick, Kaiming He, and Piotr Dollár. Focal loss for dense
object detection. In Proceedings of the IEEE international conference on computer vision, pp.
2980–2988, 2017.
11Published as a conference paper at ICLR 2021
Reason L Machete. Contrasting probabilistic scoring rules. Journal of Statistical Planning and
Inference, 143(10):1781–1790, 2013.
David JC MacKay. A practical bayesian framework for backpropagation networks. Neural compu-
tation, 4(3):448–472, 1992.
Gregory P Meyer, Ankit Laddha, Eric Kee, Carlos Vallespi-Gonzalez, and Carl K Wellington. Laser-
net: An efficient probabilistic 3d object detector for autonomous driving. In Proceedings of the
IEEE Conference on Computer Vision and Pattern Recognition, pp. 12677–12686, 2019.
David A Nix and Andreas S Weigend. Estimating the mean and variance of the target probability
distribution. In Proceedings of 1994 ieee international conference on neural networks (ICNN’94),
volume 1, pp. 55–60. IEEE, 1994.
Yaniv Ovadia, Jasper Snoek, Emily Fertig, Balaji Lakshminarayanan, Sebastian Nowozin, D. Scul-
ley, Joshua Dillon, Jie Ren, and Zachary Nado. Can you trust your model’s uncertainty? eval-
uating predictive uncertainty under dataset shift. In Advances in Neural Information Processing
Systems 32, pp. 13991–14002. 2019.
Shaoqing Ren, Kaiming He, Ross Girshick, and Jian Sun. Faster r-cnn: Towards real-time object
detection with region proposal networks. In C. Cortes, N. D. Lawrence, D. D. Lee, M. Sugiyama,
and R. Garnett (eds.), Advances in Neural Information Processing Systems 28, pp. 91–99. Curran
Associates, Inc., 2015.
Maria L Rizzo and Gábor J Székely. Energy distance. wiley interdisciplinary reviews: Computa-
tional statistics, 8(1):27–38, 2016.
Dino Sejdinovic, Bharath Sriperumbudur, Arthur Gretton, and Kenji Fukumizu. Equivalence of
distance-based and rkhs-based statistics in hypothesis testing. The Annals of Statistics, pp. 2263–
2291, 2013.
Gábor J Székely and Maria L Rizzo. Energy statistics: A class of statistics based on distances.
Journal of statistical planning and inference, 143(8):1249–1272, 2013.
Chuan-Wei Wang, Chin-An Cheng, Ching-Ju Cheng, Hou-Ning Hu, Hung-Kuo Chu, and Min
Sun. Augpod: Augmentation-oriented probabilistic object detection. In CVPR workshop on
the Robotic Vision Probabilistic Object Detection Challenge, 2019.
Yuxin Wu, Alexander Kirillov, Francisco Massa, Wan-Yen Lo, and Ross Girshick. Detectron2.
https://github.com/facebookresearch/detectron2, 2019.
12Published as a conference paper at ICLR 2021
A E XPERIMENTAL D ETAILS
A.1 M ODEL I MPLEMENTATION
The implementation of DETR 4 , RetinaNet, and FasterRCNN models is based on original PyTorch
implementations available under the Detectron2 (Wu et al., 2019) object detection framework. Reti-
naNet, FasterRCNN, and DETR do not directly estimate bounding box corners, but work on a trans-
formed bounding box representation b = T (z) where T : R4 → R4 is an invertible transformation
with inverse T −1 (.). As an example, FasterRCNN estimates the difference between proposals gen-
erated from an region proposal network and ground truth bounding boxes. We train all probabilistic
object detectors to estimate the covariance matrix Σb of the transformed bounding box representa-
tion b. To predict positive semi-definite covariance matrices, each of these three object detection
architectures are extended with a covariance regression head that outputs the 10 parameters of the
lower triangular matrix L of the Cholesky decomposition Σb = LL| . The diagonal parameters of
the matrix L are passed through the exponential function to guarantee that the output covariance Σb
is positive semi-definite. We train two models for each of the 9 architecture/regression loss combina-
tion, one using a full covariance assumption and the other using a diagonal covariance assumption.
We report the results of the top performing variant chosen according to its performance on mAP
as well as regression proper scoring rules. Considering the covariance structure as a hyperparam-
eter was necessary for fair evaluation as we could not get RetinaNet to converge with NLL and a
full covariance assumption (See Figure F.5). In case of a diagonal covariance matrix assumption,
off-diagonal elements of Σb are set to 0. The covariance prediction head for each object detection
architecture is an exact copy of the bounding box regression head used by that architecture, taking
the same feature maps as input. Variance networks are initialized to produce identity covariance
matrices, which we find to be key for stable training, especially for NLL loss.
A.2 M ODEL I NFERENCE
When evaluating our probabilistic detectors one needs to be agnostic to the source of probabilistic
bounding box predictions. As such, all considered methods are required to provide a consistent
output bounding box representation and a corresponding covariance matrix Σ as presented in Sec-
tion 3. We approximate z ∼ N (µ, Σ) by drawing 1000 samples from b ∼ N (µb , Σb ), passing
those through T −1 (.), and then estimate µ and Σ as the sample mean and covariance matrix. Note
that because of T (.) a diagonal Σb does not in general lead to a diagonal Σ. Other than the spe-
cial consideration required to estimate the final bounding box probability distribution, the inference
process is fixed to be the one provided in the original implementation for all detectors.
A.3 M ODEL T RAINING
For training all probabilistic extensions of the three object detectors, We stick to the hyperparameters
provided by the original implementation whenever possible. Complex architectures such as DETR
need a couple of weeks of training on our hardware setup and as such searching for the optimal
values of hyperparameters for each tested configuration is outside the scope of this paper. All models
are trained using a fixed random seed, which is shared across all APIs (numpy, torch, detectron2,
etc...). This insures that empirical results are not determined based on lucky convergence, we train
using 5 random seeds per configuration and find the results to be consistent with very small variance
in terms of mAP and probabilistic metrics.
RetinaNet and FasterRCNN both use ResNet-50 followed by a feature pyramid network (FPN)
for feature extraction. Since both models are trained with SGD and momentum in the original
implementation, we use the linear scaling rule to scale down from batch size of 16 to a batch size of
4 due to hardware limitations. We train our probabilistic extensions of those models using 2 GPUS
with a learning rate of 0.0025 for RetinaNet and 0.005 for FasterRCNN. Both models are trained
for 270000 iterations, and the learning rate is dropped by a factor of 10 at 210000 and then again at
250000 iterations. All additional hyperparameters are left intact. Both RetinaNet and Faster-RCNN
was trained using a soft mean warmup stage (Detlefsen et al., 2019). This is achieved through loss
4
https://github.com/facebookresearch/detr/tree/master/d2
13Published as a conference paper at ICLR 2021
annealing, where the bounding box regression loss is defined as:
Lreg = (1 − λ)Loriginal + λLprobabilistic ,
i
ω = min(1, ) (5)
250000
100ω − 1
λ= ,
100 − 1
where Loriginal is the regression loss in the original non-probabilistic implementation of the respec-
tive object detector, and i is the current training step. The value of 100 as a base for the exponent
was chosen using hyperparameter tuning. This loss formulation ensures that the network starts by
emphasizing learning of the bounding box, slowly shifting to learning the probabilistic regression
loss as training proceeds. For the last 20000 steps, only the probabilistic regression loss is used for
training. We found this loss formulation to be essential for convergence of models trained using the
NLL. Each FasterRCNN model takes ∼ 3 days to train using 2 P-100 GPUs. On the same setup,
RetinaNet models take ∼ 4 days to finish training.
DETR also uses ResNet-50 as a base feature extractor. DETR’s original implementation requires a
very long training schedule for convergence, leading us to use hard mean warmup for all probabilis-
tic DETR models. We use the model parameters provided by DETR’s authors after training for 500
epochs to reach 42% mAP on the COCO validation dataset. Weights from this deterministic model
are used as initial weights of all probabilistic extension of DETR, which are trained for an additional
50 epochs using losses presented in Section 3 and the same hyperparameters of the original deter-
ministic implementation. We reduce the batch size from 64 to 16, but use the same initial learning
rate as DETR is trained with ADAM. The learning rate is then dropped by a factor of 10 after at 30
epochs. Training for 50 epochs takes ∼ 4 days using 4 T-4 GPUs.
B S HIFTED AND OOD DATASETS
B.1 S HIFTING COCO DATASET W ITH I MAGE N ET-C C ORRUPTIONS
We corrupt the COCO validation dataset using 18 corruption types proposed in ImageNet-
C (Hendrycks & Dietterich, 2019) at 5 increasing levels of intensity. The frames of COCO vali-
dation dataset are skewed using every corruption type in repeating sequential order, such that the
first corruption type is applied to frame 1, 19, 37, . . . , the second to frames 2, 20, 38, . . . , and so on.
By increasing the corruption intensity from level 1 to level 5, we create 5 shifted versions of the 5000
frames of the COCO validation dataset such that every frame is skewed with the same corruption
type, but at an increasing intensity.
104 COCO
OpenIm
103
# of Instances
102
101
keyboard
carrot
skateboard
tennis racket
cake
motorcycle
fire hydrant
umbrella
broccoli
microwave
snowboard
bird
surfboard
remote
refrigerator
baseball glove
person
bicycle
traffic light
stop sign
parking meter
car
airplane
bus
train
truck
boat
bench
cat
dog
horse
sheep
cow
elephant
wine glass
bear
zebra
giraffe
backpack
handbag
suitcase
sports ball
baseball bat
hot dog
dining table
tie
frisbee
skis
kite
bottle
cup
fork
knife
spoon
bowl
banana
apple
sandwich
orange
pizza
donut
chair
couch
potted plant
bed
toilet
tv
laptop
mouse
cell phone
oven
toaster
sink
book
clock
vase
scissors
teddy bear
hair drier
toothbrush
Categories
Figure B.1: Histogram comparing the number of instances of every category present in the COCO
validation dataset with those present in our shifted dataset constructed from OpenImages-V4 frames.
14You can also read