Submitted To: DP&DD, Central Electricity Authority - ʹͲͳʹ
←
→
Page content transcription
If your browser does not render page correctly, please read the page content below
SubmittedTo:DP&DD,CentralElectricityAuthority
ʹͲͳʹ
BSESBHAWAN,NEHRUPLACE,NEWDELHI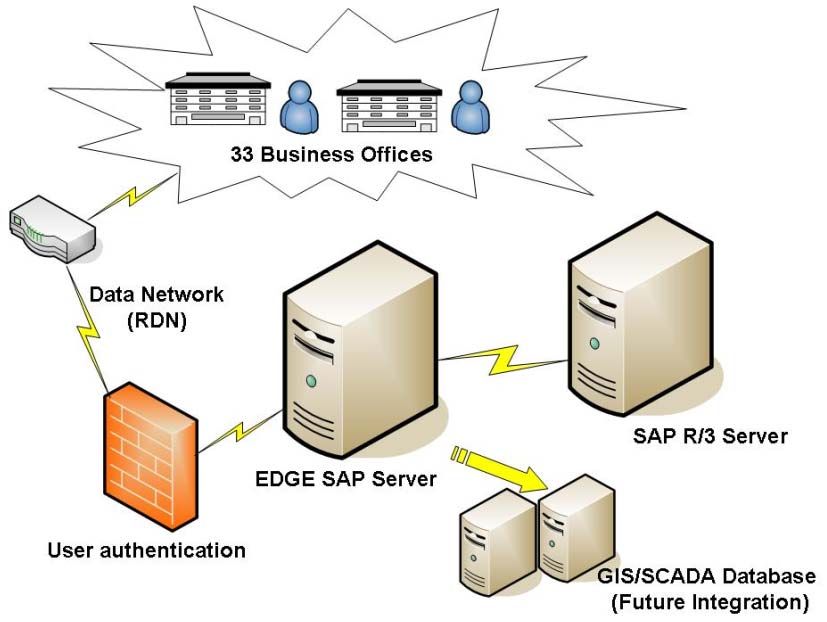
Table of Contents

1.      BRPL INTRODUCTION ......................................................................................................................... 2
2.      INITIATIVES IN REVENUE MANAGEMENT ............................................................................................ 2
3.      TECHNICAL INITIATIVES FOR LOSS REDUCTION ................................................................................... 5
4.      CUSTOMER CARE INITIATIVES ............................................................................................................. 6
4.1     Improved customer satisfaction ......................................................................................................... 6
4.2. Securing Interest of Customer ............................................................................................................ 6
4.3. Customer Education .......................................................................................................................... 6
5.      ENERGY ACCOUNTINAG PRACTICES & RESULT ACHIEVED ................................................................... 7
5.1. Energy Efficiencey in Demand Side Management ................................................................................ 7
6.      INITIATIVES IN INFORMATION TECHNOLOGY ...................................................................................... 9
6.1     Automation Foreword ........................................................................................................................ 9
6.2. BSES Automation Initiatives ............................................................................................................... 9
6.3     Benefits of IT initiatives .................................................................................................................... 10
6.3.1 Customer Care................................................................................................................................. 10
6.3.2 Billing ............................................................................................................................................. 10
6.3.3 Operation........................................................................................................................................ 10
6.3.4 Material Management..................................................................................................................... 11
6.3.5 Finance ........................................................................................................................................... 11
6.4     Project‐I: "IT Connect" ‐ Thinking Beyond Boundaries ....................................................................... 13
6.5     Project–II: Automated Meter Reading (AMR) – An Emerging Technology .......................................... 14
6.6      Project–III: On‐Line Mobile Cash Collection and Customer Service – An Innovative Project ............... 17
6.7     Project–IV: OMS (Outage Management System) – Reaching Consumers............................................ 18
6.8     Project–V: SCADA– Technical Breakthrough...................................................................................... 19
6.9     Project–VI: Project EDGE (SAP ISU/CCS)– A World class solution ....................................................... 20
6.10 Project–VII: Project “ PALMS”: Power Management and Load Fore (SAS)– The Need Of The Hour ..... 22
6.11 Project‐VIII: Project “CORE” .............................................................................................................. 24
7       HUMAN RESOURCE‐ SKILL DEVELOPMENT MEASURES OF EMPLOYEES .............................................. 27

                                                                                                                                                Page 2 of 29
1. Introduction

BSES Rajdhani Power Limited came into existence in the year 2002, with the task of
providing reliable & quality electricity supply to the consumers of South & West Delhi.
Panning a geographical area of 750 sq km, it is the largest electrical licensee in the national
capital, catering to over 1.6 million consumers.

For greater reach and easy serviceability, the company serves its customer base through
four circles, further subdivided into 19 divisions. Each of the Divisions is led by an
empowered group of officials. Since most of the venues for the 19th Commonwealth Games
were in the licensed area of BSES Rajdhani Power Limited (BRPL), the company along with
BSES Yamuna Power Limited (BYPL) played its role with aplomb as the host DISCOMs.

S.No    Items                                   UoM                           As on 31‐03‐2011

1       Geographical Area                       Sq. Km                              750

2       Total Consumers                         Lacs                               16.51

3       Consumer Density                        Consumers / sq. Km                 2200

4       Peak Demand                             MW                                 1920

5       Annual Energy Consumption               MU                                 10461

The AT&C losses in BRPL’s area are way below the national average and the loss reduction
trajectory since 2002 has been unmatched till date. The losses in the system in 2002 were in
the range of 62% which has been brought down to sub 17 levels, considering a high
customer density of about 2200 per sq.km and about 80% of energy sold at LT level, this
achievement is unparalleled till date. This has been made possible by optimal planning of
the network along with the state‐of‐the‐art technologies and use of best operational
practices by the trained, skillful and motivated manpower.

                                      AT & C Loss (%)
           60.0
           50.0
           40.0
           30.0
           20.0
           10.0
            0.0
                    2002‐03 2003‐04 2004‐05 2005‐06 2006‐07 2007‐08 2008‐09 2009‐10 2010‐11
         Achieved    51.5    45.1    40.6      35.5      29.9   27.1   20.6      19.0      16.8
         Target      47.6    46.0    42.7      36.7      31.1   27.3   24.1      20.9      17.0

                                                                                          Page 3 of 29
2. Revenue Mechanism
BRPL is licensed to distribute electricity in South and West Delhi. The company is distributing
electricity to consumers and collecting revenue. The revenue is collected under three
heads:‐
Energy
Non‐ Energy
Enforcement
For collection purposes, BRPL is having their own collection offices namely – West Circle and
South Circle. In total appx 100 counters are divided among the two circles where cash.,
Cheque, and card payments are accepted.
Other than their own counters, the following collection agencies are appointed by BRPL to
collect the bill payment from the consumers:‐
1. Skypak drop boxes ‐ cheque payments
2. Techprocess Solutions ‐ ECS and net banking
3. Bill desk ‐ ECS, Net banking and card acceptance through gateway
4. Minc Bill Box ‐ Drop box at Major metro stations ‐ cheques only
5. TSI – Electronic drop box ‐ For cheques only
6. Jeevan Centers ‐ Counters controlled by Delhi Govt.‐ cash & Cheque payments
7. ITZ Cash Card ‐ Collection through internet / BSES Web site.
8. Kiosk machines ‐ operated by TSI ‐ Cash/cheque/card (run from 08.00 am to
08.00pm at all divisional offices and select complaint centres)
9. Kiosk Machines‐ operated by Forbes ‐ Cash and cheque only (installed at selected
complaint centres)
10. Suvidhaa Infoserve Ltd – accepting cash and cheque payment through retailers
11. Easy Bill ltd – Accepting cash and cheque payment through retailers
12. Oxigen ‐ Accepting payment of bills through retailers/internet via virtual cash card.
The collection made at counters are downloaded at CPC office (Collection Processing Cell),
matched with the actual collections, and validation are done through internal IT software
and payments uploaded in consumer account. CPC works round the clock and is responsible
for payment updation and dishonour updation in consumers account. All the divisional
queries relating to payments is being handled from the CPC successfully.
The online collection system maintained by BRPL is so effective and best in the industry that
Senior Executives from Master Card – USA especially from the US and met our senior
officers and commended the activities done in the field of online collections.
Page 4 of 293. Technical Initiatives for Loss Reduction
1. Replacement of electromechanical meters,
2. Replacement of bare overhead conductors with insulated aerial bunched
(AB) conductors,
3. Balancing of unbalanced Distribution Transformer.
4. Augmentation of Overloaded Distribution Transformer.
5. Revamping of low tension (LT) distribution systems by changing/repairing worn‐out
equipment and cables.
5. Installation of automatic power factor controllers for providing reactive compensation.
6. Distribution transformers metering for computing AT&C Loss at DT level.
7. Installation of Street Light Controller to avoid Energy Wastage.
Page 5 of 294. Customer Care
Improved Customer Satisfaction ‐ Prompt Service from all customer touchpoints like
• Modern Customer Care Centres ‐ Queue Management System
• Website ‐ Availability of Duplicate Bill / Complaint Registration etc through
www.bsesdelhi.com
• State of the Art Call Centre ‐ 24* 7 with easy to remember # 39999707
• Easy Payment Options like Credit Cards / Online / Payment Kiosks etc.
• Providing escalation matrix on web for due escalation of unresolved issues.
Securing Interest of Consumers ‐ Pre Emptive measures to ensure Customers' safety
• Installation of ELCB
• Sharing of Safety Tips through website
• Caution snippets in the media during rains
• Load Enhancement / Service Line Cable change
• Imparting training to RWA nominated electricians to avoid Earth Leakages (EL) related
issues.
Consumer Education ‐ Generating Awareness on relevant points
• Energy Conservation Surveys
• Media Releases
• Energy calculator
• Earth Hour
• SYNERGY News letter for regularly sharing important information with all consumers.
Page 6 of 295. Energy Accounting Practices & Result Achieve
Following are the basic principle, which should be followed while doing Energy Audit:
a) Energy Audit should not be done just at total energy purchased v/s total consumer
energy, but, it should be done at every level.
b) Energy measurement for audit should be done right at receiving feeder, in all HT
Grids, at outgoing Grids feeders, at all DT RMU and at consumer point.
c) The first Audit should be energy billed by Transmission Company versus energy
received at Grid by the DISCOM. Such audit should be done feeder wise.
d) Similarly, the audit should be done for each grid to ensure grid energy balancing.
e) Regarding HT feeder, the audit should be done between Grid outgoing feeder energy
and transformer(s) energy.
f) DT audit is one of the toughest thing, but it is desirable specially, if the company loss
is less than 15%.
g) Whenever, audit activity is initiated, one may found abnormal gap value. Do not get
disappointed with the abnormal gap data. Treat them as observation and analyze the
cause.
h) While doing Energy Audit, lot of information is collected. The audit output should
have brief about network health, load curves and load Growth/ Change trends.
i) The purpose of Energy Audit is not to just found gap but also to recommend
measures required to fill the gap.
Result Achieve:
Today in BRPL, we know the Energy Gap/ Energy Loss at each voltage level and each part of
network. We have saved lot of money by verifying the purchase energy bills. Further,
network health report, prepared during the Energy Audit has reduced the burning and
overloading of the equipments. Further, continuous monitoring of energy has helped to
control UI power purchase charges.
Energy Efficiency in Demand Side Management:
1. The purpose of Energy Efficiency and Demand Side Management should not be
only to reduce the peak but also to look for load during the non‐peak. In
addition, to commercial reason, this activity should be carried out to protect the
environment and to win the trust of consumer(s). The DSM can be carried out at
three levels:
A) DISCOM level
B) B) Consumer Level
C) C) Using technology like energy storage.
2. Although, most of the DSM activities are initiated by DISCOM & should be
carried out by consumer but few activities can be managed at DISCOM level. PF
regulation and voltage regulation are such activities.
Page 7 of 293. Before initiate any schemes, generate enough data by doing consumer load
research and have enough expertise including expertise in the field of M&V
before launching DSM programme.
4. DSM programme needs skill about energy conservation and art of
communication (with a consumer). It is better to hire Energy Manager/ Energy
Auditors.
5. For most of the DSM initiative, DISCOM needs approval of regulator. However,
awareness etc are few initiatives which could be done without a formal
approval.
6. Few scheme may affect ARR & thus tariff. However, if consumption goes down,
the over, all bill will also go down.
7. At consumer level, the involvement of consumers is must. Awareness,
incentives, penalties and legislation are four main tools to involve consumer.
Formulate schemes based on the four tools.
8. Awareness is the key for success of DSM programme. In case, the DISCOM
officials, acting as consumers, are not convinced about any scheme, do not
launch such scheme as it will bound to fail.
9. Energy conservation is a powerful DSM tool and specially helps in avoiding
setting up new generation plants.
10. Tariff policy is always used as one of the key tool to implement DSM.
11. Energy storage is not a very popular method of DSM but it will become a
powerful tool in future. Explore it.
Page 8 of 296. Information Technology
Automation Foreword
Business today demands agility to respond to the business requirements, growth,
competitive threats, regulatory requirements, customer care, and more. A primary goal of
the information technology allignment with the business has usually been to assure that the
investments in IT generate business values and the mitigation of risks. Implementing a set of
sound and best business practices is a key to deliver IT services that meet organizational
needs.
Deregulation and privatization of power industry has thrown a big challenge towards
improving efficiency of operations, enhance customer care and improve overall service
delivery. Perhaps the most important determinant of success in such an endeavor is the
proper use of IT. A well designed, as well as, an integrated IT system is the way in which
utilities can move from their current operational levels to the desired level. A proper IT
system implementation would aid in improving efficiency by eliminating unnecessary
manual involvements in transaction processing or complaints redressal. The IT would
augment efforts at quick resolution of issues by providing the appropriate information to
the correct person in the shortest possible time frame. The Information Technology is
definitely playing a key role in the energy industry particularly in utilities. Efficiency being
the main criteria, automation is being given the highest priority.
BSES Automation Initiatives
At BSES Rajdhani Power Ltd., Delhi, our mission is customer’s satisfaction through
technology driven services by empowering people to be creative as well as productive and
this has been possible through leveraging IT in the entire spectrum of business operations.
We have started recognizing technology criticality for managing the distribution operations
as well as maintenance of the grid and accordingly have started system‐wide deployments.
Technologies like SCADA, Automated Meter Reading (AMR), GIS, ERP (SAP), Outage
Management System (OMS), DMS applications, Load Forecasting, Mobile computing and the
integration of all these are some of the initiatives already implemented or being
implemented at BSES Delhi.
The IT applications developed, are spread across all functions, including Administrative
activities, Billing, Legal, Recovery, Reception, Meter Reading, Remote Meter Reading (RMR),
Automated Meter Reading (AMR), OMS(Outage Management System), Network Planning
and dispatches in an integration fashion. This makes our working integrated and brings
closure all distributed as well as diverging functions. This is rarely visible in utilities across
the globe and BSES at Delhi is one amongst few unique sites to illustrate this very resolve.
Today, consumers’ issues are addressed effectively through the IT tools and this has made
Page 9 of 29possible to not only finish work on daily basis but also take kind of futuristic planning. Any
consumer’s complaint can be tracked effectively and efficiently, thus, making within reach
to approach consumers as a marketing drive. This was, otherwise or impossible, to address a
large consumers base at Delhi with all sort of problems inherited with years of legacies,
creating a chaotic situation.
A strong IT infrastructure is established connecting all offices approx 400 plus locations,
installing LAN/WAN and relevant hardware. The great enabler had been the sustained
training of the large workforce and taking us close to the destination.
Snapshot
• One of the biggest IT establishment in this part of the country
• Connectivity of about 400 plus offices across a wide geographical stretch
• Deployment of more than 5000 PC’s and 1500 printers
• More than 7000 application users community
• Implementation and integration of SAP, AMR, SCADA, GIS, OMS and Load
Forecasting applications
• State of the art Datacenter with 40 servers in a 24*7 operations
• Telecom connectivity with intercom facility of 850 Avaya phones and 470 phones on
Centrex in an integration
Benefits of IT Benefits of IT Initiatives @BSES
Customer Care
• Faster resolution of problems
• Easy traceability and monitoring of information on a complaints
• More and more satisfied consumers / customers
• Automated and customer friendly processes
• Customer empowerment through web interface
Billing
• Error free bills and mechanism to correct bills on a single window system
• Faster resolution of problems
• Reduction in customer complaints
• Better revenue realization
Operations
• Reduced time to address problems
• Efficiency in operations
• Stable power supply
• Proper monitoring and control. Manpower & resource management through OMS
• Better productivity and cost control
• Proper accounting
Page 10 of 29• Real time mo onitoring andd maintaininng informatio on in the database systeem for all grid
sttations
• Through implementation n of GIS commplex poweer system an nalysis like fault
f analysiis,
optimization of network and load forrecasting
• SCCADA has helped in visibility
v of network operations, rreal time accurate
a witth
coonsistent information ofo the systeem, flexibility in operations control, faster fau ult
id
dentification
n / isolation / system resstoration, exxtensive repo
orting and sttatistical datta
archiving
ent
Material Manageme
• Core applicattion SAP
• Ease of manaageability of critical mateerial in emerrgency hours
• Reduced inveentory cost
• Easy traceability of material and interlinking of sttores
• Sttreamlined material
m management
• Effficient mateerial manage
ement
• Saatisfied and motivated venders
v
Finance
• Effficient systeem and bettter visibility
• Im
mproved info ormation sharing and pllanning
• Timely paymeents and sattisfied vendeers
SMART INFRASTRUC
CTURE (BUN)Integrate
ed Operations
Inttegrated IT Systems
Project Planning
ERP
E Netw
work
Sy
ystem SCA
ADA Planning
SA
AP R/3 ME)
(CYM
Notification /
Outage Triggers
Measurands
Information
Loss Data
Topology
Event and
Orders
Event Customer / Da
C ata Ene
ergy
O
OMS on
Informatio
G
GIS Network Aud
dit
Customer History
Energy Logs
Response
Customer
Billingg Data
C
CIS BILL
LING
AM
MR
SYSTEMS Meter Data
Billing Settlem
ment
2
24IT Projects For Operational Efficiency & Customer Care
Project –I: “IT Connect” - Thinking Beyond Boundaries
Problem Defined
BSES took over operations in 2002 of Delhi power distribution and then there was hardly any
Automation as well as Computerization. There was lack of integration and connectivity between
different locations. There was no telecom related initiatives. The challenge was connecting
more than 500 offices for anytime on‐line operations. The constraint was geographical stretch
as well as bringing in multiple technology and vendors on a unified platform. The risks defined
were maintaining a 100% secure uptime 24x7. The connectivity should help in a seamless
information flow.
The Solution
The intension was to connect more than 400 offices and 20 mobile offices online across Delhi.
Hence, these offices were put on on‐line operations which included Commercial as well as
O&M, Customer care, Enforcement, Recovery, Vigilance, SAP, Complaint centers and Cash
Counters. We deployed around 5000 PC’s, 575 Laptops and 1500 Printers. State of the art
Datacenter was set‐up with 40 servers having installation of Sun, Lotus Notes, AMR, Anti‐Virus
and DHCP Servers. The connectivity link is through 208 Fibre optic lines, 161 ISDN, 110 VSAT,
142 RF and 20 mobile connections. Further the Unified Telecom Connectivity was setup at 24
locations with AVAYA, 25 locations on CENTREX and rest on FWP with about 4000 users in a
close user group. Hence, we achieved integrated IT operations in a distributed environment.
Implementation Learning
Post implementation, all operations are Automated and made on‐line with the Integrated
Billing, Customer Care, Operations Management System, Vigilance, Recovery, Administration,
Material Management (SAP), HR(SAP), Finance(SAP), Projects Automation and Lotus Notes. This
has helped in streamlining business operations and enabling the fast information flow. These in
turn have helped us in serving our customers fast and diligently.
Business Benefits
Through this connectivity the Outage Management system got linked to call centre transferring
proper outage information which in‐turn helped in reducing outage time and hence reduce
commercial losses. Commercial call centre linked with IVRS and business applications helped in
fast resolution of consumer’s problems. The website www.bsesdelhi.com designed aesthetically
with customer centric approach provides all information to consumers and further enables
them to register and track complaints. The look and feel of the website was designed to be
customer centric.
Page 13 of 29Conclusion
The project “IT Connect” is one of the biggest and unique projects in North India. The vastness
in its planning, implementation, security, disaster recovery plans, integrating multiple vendors
and bringing them in our network, expense monitoring, ROI, 24*7 support and its impact on
customer service is a case study in itself.
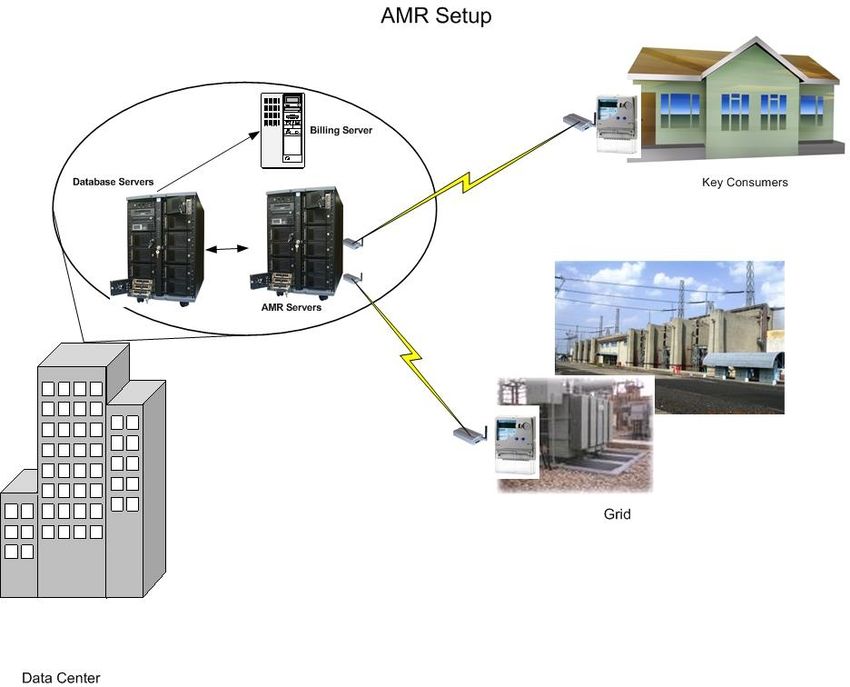
Project–II: Automated Meter Reading (AMR) – An Emerging Technology
This project was implemented for Key Consumers and Grid monitoring.
Problem Defined
The project was conceptualized to minimize human interference while
downloading/uploading the meter data and to reduce billing as well as accounting errors.
Further through this technology, the entire meter data along with history can be
downloaded and analyzed. It will save operational cost in long run and help us in identifying
as well as minimizing the power theft. The meter reading was earlier done through a MRI
(Meter Reading Instrument) or manually by physically going to the consumer end and
connecting MRI to the serial port of meter. Since most of the key consumers have their
meters installed well within premises, the readers had to wait for the gate pass/permission
for going inside for meter reading. This used to take a lot of time for them to read each
meter. It was a tedious job and lot of manpower was required for reading the meters as
these consumers are spread across Delhi.
Page 14 of 29As far as Grid AMR is concerned the project was targeted towards capturing exact data of
energy flow into our network which in‐turn will help us in Energy Audit as well as Demand
Forecast, the biggest challenge for an energy utility.
Problems defined were:
• In Grids human interaction in 3 shifts to monitor load and energy release at an
interval of 15 min. This can be automated.
• Herculean task of compiling log at month end to generate MIS. This was possible
through the project.
• No Correlation between energy imported and distributed. One of the key results
generated through the project.
• Central monitoring of each grid was not possible, which will become possible
through implementation of AMR
Last but not the least it was a unique automation initiative towards customer services as
well as customer care to their satisfaction.
The Solution
A modem is installed at the consumers / Grid end. The reading of the meter is taken
remotely from the central location by making a call to the remote modem. The downloaded
data of the meter is then used for Billing, analyzing load survey and checking the tamper
data of the consumer meter. Further data from grid is used for the business critical MIS
reports.
It is a point to point dial‐up system and works on GSM/CDMA as well as PSTN network. Total
14 Server grade PC are dedicated at the central location with 7 modems per PC at central
location connected. These makes schedule calls to 15000 modems in the field. GSM/CDMA
technology is used to remotely interface and read the meters of consumers & Grids.
Learnings are:
• The Vendor Management: Modem supply from the vendor i.e., execution team of
BSES was working at such a pace that the manufacturer was not able to cope up with
the supply
• The Connectivity: Connectivity at remote locations and signal strength of service
provider, further there always remains a challenge of reducing instances of signal
drop while data transfer from meters to server
• Change Management: Educating own personnel on using the software and recording
data
Page 15 of 29Business Benefits
The entire process from meter reading to billing is fully automated without human
intervention resulting in the operational efficiency, better billing/improved quality and early
revenue realization.
Key Consumers
Now these meters can be read from a central location, using software to schedule the meter
reading one after the other. Now, the same job can be handled by few people only and the
reading process is much faster. Further the reading is without errors because of minimal
human intervention. This has resulted in reducing the time for billing, in improving billing
quality and better revenue realization leading to consumers’ satisfaction.
Grids
• Monitoring and logging of Voltage, current, power factor, KWh, KVARh & KVAh on 5
minutes basis
• Alarm feature to draw attention of the operator to any breach of various parameters
beyond preset limits
• Facility to generate spread sheet and MIS reports on System outage / Down time of
the Feeders, Daily Peak loads, Voltage Profiles
• Availability of all grids’ data at common server
Page 16 of 29Conclusion
The implementation of AMR at such a vast scale is in itself one of the largest deployments in
India, which makes it unique. Connectivity across a vast geographical stretch for its
streamlined operations also makes it very unique. The immediate cost benefit derived by
implementation of the same has been one of the remarkable features. It encompasses both
GSM and CDMA technologies.
AMR Architecture
H U B /M A U N IC
T A L K / D AT A
TA LK RS CS TR RD TD C D
% U T I L IZ A T IO N
TAB
M e te r
G D R E I F
J A K B L C EN T ER
R UN
M7 N 8 O 9 PR IN T
G D G D G D H E LP
M odem
B NC
4 M b /s G D T 2 U 3 A LPHA
V 0 W. X Y Z S H IF T
H U B /M A U N IC
T A L K / D AT A
TA LK RS CS TR RD TD C D
% U T I L IZ A T IO N
TAB
M e te r
GD R E I F
J A K B L C ENTER
RUN
M7 N 8 O 9 PR IN T
GD G D G D HE LP
M odem
B NC
4 M b /s GD T 2 U 3 A LP H A
V 0 W. X Y Z S H IF T
T A L K / D AT A
M odem
TA LK RS C S TR RD TD CD
T A L K / D AT A
TA LK RS C S TR RD TD CD
M odem H U B /M A U N IC
PC iM ac
T A L K / D AT A
TA LK RS C S TR RD TD CD
M odem T A L K / D AT A
TA LK RS CS TR RD TD C D
% U T I L IZ A T IO N
TAB
M e te r
GD R E I F
J A K B L C ENTER
RUN
M7 N 8 O 9 PR IN T
T A L K / D AT A GD G D G D HE LP
M odem M odem
TA LK RS C S TR RD TD CD B NC
4 M b /s GD T 2 U 3 A LP H A
V 0 W. X Y Z S H IF T
M odem
T A L K / D AT A
TA LK RS C S TR RD TD CD
H U B /M A U N IC
T A L K / D AT A
TA LK RS C S TR RD TD CD
% U T I L IZ A T IO N
TAB
M e te r
GD R E I F
J A K B L C ENTER
RUN
M7 N 8 O 9 PR IN T
GD G D G D HE LP
M odem
B NC
4 M b /s GD T 2 U 3 A LP H A
V 0 W. X Y Z S H IF T
H U B /M A U N IC
T A L K / D AT A
TA LK RS C S TR RD TD CD
% U T I L IZ A T IO N
TAB
M e te r
GD R E I F
J A K B L C ENTER
RUN
M7 N 8 O 9 PR IN T
GD G D G D HE LP
M odem
B NC
4 M b /s GD T 2 U 3 A LP H A
V 0 W. X Y Z S H IF T
Project–III: On-Line Mobile Cash Collection and Customer Service – An
Innovative Project
Problem Defined
Consumers irrespective of their age, health and other external constraints had to travel to the
BSES offices to make payments and request for the support. Further the mobile vans used to
collect cash and update payments to the central system in a batch mode which may take ½ days
in the process. Hence, the prime objective was to reach at consumer doorstep with all up‐to‐
date information and values add to the consumers’ services and customers’ care; first time in
power utility, India.
The Solution
The cash collection is done by mobile cash collection vans to extend service to consumers who
cannot visit BSES offices for payment as well as support. The transactions are updated online
using CDMA technology for connectivity of mobile vans with the central office. The vans are
connected through VPN with the central office ensuring security of data. Customer services are
being extended through the mobile vans including complaints tracking, new connection, logging
complaints and various other consumer related services.
Business Benefits
Page 17 of 29Using the CDMA connectivity, the vans are now online and can connect to the central database.
The payments are updated instantaneously and the system is online. This has resulted in saving
a lot of time and effort, further improving the consumer services and care.
Conclusion
The uniqueness of the project is that the concept can be extended to all the customer interface
points and the vans can now be upgraded to a fully functional moving office. An innovative way
of extending consumer services resulting in improvement of consumer satisfaction index
Project–IV: OMS (Outage Management System) – Reaching Consumers
Problem Defined
Information collation on faults and managing fault restoration within defined timeline. Further
managing and allocating resources and integration with system control and call center
The Solution
The Outage Management System implemented monitors and analyzes the whole process of
fault restoration, from the receipt of consumer’s complaint to the normalization of supply
including tracking of resources, in the power distribution and power supply system.
This system has been divided in two parts
‐ 11 KV and Below
‐ EHV (Extra High Voltage)
Business Benefits
• Real Time monitoring of HT, LT & no current faults
• Full integration with system control, circle control, call center, breakdown
offices and local complaint center
• Job allocation & tracking
• Optimum allocation of O&M resources (vehicles, manpower, etc.)
• Automated SMS escalation of fault and breakdowns
• This system also provides input to financial system
• Exhaustive MIS report
Conclusion
The uniqueness of the project is the business impact like
• Speed redressal of faults
• OMS linked to Call center provides seamless information towards
Page 18 of 29customer care & satisfaction
Project–V: SCADA– Technical Breakthrough
Problem Defined
Poor visibility of Electrical Network Operations, absence of real time and historical data, lack of
network analysis resulting in delays in fault restoration with inadequate information to
consumers.
The Solution
The SCADA system is a real time operating system. It closely monitors the distribution system
and its behavior. Data is utilized in planning as well as in the management decision support
system. Further it helps in energy monitoring and audit along with increasing the efficiency of
operations as well as resulting in a better regulatory compliance. The SCADA is an industrial
measurement and control system consisting of a central host or master usually called a Master
Control Center; one or more field data gathering and control units or remotes traditionally
called remote stations, remote terminal units, or RTU's; and a collection of standard and/or
custom software used to monitor as well as control remotely located field data elements.
Communications may be via a local area network (LAN) and will normally be reliable with a
better speed. SCADA systems generally cover larger geographic areas and rely on a variety of in
the field electrical distribution network as well as communication systems. This is used for
monitoring/ controlling of multiple substations from a Master Control Center. The
communication link between the two ends could be a dedicated cable, a satellite channel or
fiber‐ optic link. All the data of the receiving station are logged at a half an hour intervals. The
logged data provides trends of the load flow.
Business Benefits
• Visibility of the network operation
• Real‐time, accurate and consistent information
• Flexibility in operational controls
• Faster fault identification, Isolation and system restoration
• Extensive reporting & statistical data archiving
• Central database and history of all system parameters
• Optimized and efficient operation of the network based on real time calculation.
Conclusion
The project implemented at BSES is the biggest and first of its kind in India. The criticality lies
not only in implementing the project but also to integrate it with GIS and SAP. With the help of
Page 19 of 29this we have successfully been able to record the profile of consumers with their consumption
pattern, Audit energy and further reduce theft of electricity. The turn around time for closing
complaints has reduced thus giving the consumers respite from long outages.
Project–VI: Project EDGE (SAP ISU/CCS)– A World class solution
Problem Defined
At BSES Delhi 60% assured revenue gets generated from 20% of our Key high value
consumers. Hence these consumers become a key reason towards improved customer care.
To provide them services, better than the best, there was a need to improve our processes,
bring in an integrated scalable, secured system which would further improve our Revenue
Management Cycle. Further the earlier billing system which included customer care, too,
was on a legacy system and needed to be integrated to other functions like finance and
contracts, which existed on SAP.
The Solution
The solution designed and which got implemented was to migrate the entire billing system
from legacy to SAP‐ISU/CCS. The project is titled EDGE (Enhanced Data Generation for
Enterprise). It is an initiative towards automation of business processes leading to customer
care covering automation through implementation of ERP, SAP IS‐U/CCS. The IS‐U/CCS is an
Industry Solution from SAP which addresses the needs of a customer oriented utility
company. The solution encompasses CRM (Customer Relationship Management) and
BW (Business Warehouse). It is a customer centric futuristic billing system built on
Enterprise SOA Architecture.
Business Benefits
As project “EDGE” is an initiative towards automation of business processes leading to
customer care covering automation through implementation of world’s best practices and
ERP, hence the solution deployed has helped our business grow multifold with many other
benefits.
• Integrated platform
• Improved security
• Greater flexibility and scalability
• Reduced billing errors
• Faster and robust tariff setting process
• Improved credit management
• Facilitates energy accounting resulting in reduction in AT&C Losses
• Single face to customer, 360 degree view
• Improved capabilities at call center
Page 20 of 29• Faster resolution of querries
• Supports Complex billing options
• Support for customer segmentation for marketing campaigns
• End to end meter management
• Single billing system catering to multiple customer segments
• Very less bandwidth usage resulting in system availability to all users on emergency
• Ease of extracting information
• Entire organisation views/ transacts on the same system
• Better user discipline
Data storage and monitoring is done from a centralized datacenter. Security of usage also got
streamlined through implementation of User Access Control policies and applications. Currently
there are more than 2600 users. Well structured and defined MIS reports get generated
providing mission critical information to the Management. Further we are also able to send
bills, required information and reminders to consumers through SMS and emails.
Improved Customer Service
• Improved customer satisfaction and loyalty through quick, accurate responses to
inquiries
• Give Customer a smooth, consistent experience across all avenues of customer
connect including voice, email, sms etc.
• Improved capabilities at the call centres
• Improved service order tracking
• Automated correspondence
• Enhanced ability to monitor, track and analyse trends based on the complaint/
request history
• Enhanced customer self‐service capabilities thorough the web
• Reduce total cost of ownership by carrying out all customer service activities on a
single integrated platform
Conclusion
The implementation of “EDGE” for such critical database is in itself one of the largest
deployments in India, which makes it unique. Connectivity across a vast geographical stretch
for its streamlined online, 24*7 operation also makes it very unique. As ISU has hardly been
implemented in India by any enterprise, because of its complexity, cost and availability of
skillset, it became a real challenge for us to migrate our existing billing data and make it live
for 32Lac customers without any glitch and zero percentage error.
Page 21 of 29PROJECT EDGE OPERATIONAL ARCHITECTURE
Project–VII: Project “ PALMS”: Power Management and Load Forecasting
(SAS)– The Need Of The Hour
Problem Defined
The primary role of an electricity distribution utility is to arrange quality power for its
licensed registered consumer and distribute uninterrupted power to them. Power
Management function encompasses arrangement of power for the DISCOM predicting the
future demand.
Power demand has three types of inbuilt seasonality i.e. Daily, Weekly (short Term) and
Annual (Long Term). Short term demand for power is also dependent on a host of other
factors on a daily basis. The external factors are:‐
• Holidays within the week
• Temperature
• Humidity
• Rainfall and cloud cover
Page 22 of 29• Wind speed and direction
• Special occasions
Hence the immediate need (Phase‐I) for our BSES DISCOMs, was to forecast short term
demand taking into consideration all the above factors and any other factors that may be
identified and effectively captured.
The Solution
There are various statistical tools available and are being used for forecasting of power
across the globe however BSES selected SAS institute and its Load Forecasting Engine to
improve its current load forecasting process. The objective is to provide a day ahead
forecast for demand at 15 minutes intervals. The solution shall also help us in predicting
Delhi’s appetite for power more accurately and hopefully save on both overbuying and last‐
minute scouting for power. The solution known as SAS Smart Load Forecaster is a level up
from the prevalent practice of the intelligent guesswork that is the result of tracking
historical load patterns coupled with the current weather forecast and past weather trends.
Business Benefits
The savings accrued from the more precise planning will ultimately benefit the consumers;
as reduced power costs will have a direct bearing on the customer tariffs. With the new
technology in place, BSES will also be able to plan their surplus power sales better, leading
to higher returns from such sales to other utilities.
Conclusion
The project i.e. Short term Load Forecasting was made go‐live on 01 April 2011 and is being
tuned for forecasts within world class limits. The Project is currently under progressive
improvements involving data population, regression and smoothening. This works in perfect
integration with PMG i.e. Power Management suit of applications, Grid AMR (Grid
Automated Meter Reading) and SCADA. This is not only helping a money saver but helping
to manage power effectively as well as efficiently to a customer centric power utility.
Page 23 of 29PALMS architecture
a
Proje
ect –VIII: Project “CO
ORE”
Problem Defined
Functional vertical in
n an electriciity distribution organisation like, Op
perations & Maintenanc
M e,
requires data exchange and co ommunicatio on with related supportt functions like Stores &
Meter Management
M t. Further th he Operatio ons and maaintenance d department should havve
proper visibility
v of electricity
e neetwork. Unleess all thesee updated d data are avaailable online,
there is always a tendency of glitches in the operattions which h leads to delay
d in fau
ult
restoration, long outages resultting in poor customer service and o other negattive cascadinng
effects. This
T also hitts the businness i.e., AT& &C (Aggregaate Technicaal & Commeercial) lossees.
Further the O&M department
d should alsoo have a sttructured data source available fo or
manpow wer & other resource plaanning. Hence automating O&M, im mplementingg SAP R/3 fo or
stores annd meter management,, implementting GIS for network vissibility and integrating all a
these waas the need identified
i an
nd implemen nted throughh the project CORE.
Hence project
p CORE (Convergeed Operatio onal & Reporting Engin ne) is an in ntegration oof
highend, critical, livee application and database like SA
AP, GIS, OMMS (Outage Managemen nt
System) to
t generate smooth opeerational advvantage and d mission crittical reports for customeer
benefit.The Solution
The solution desiggned was towards tuning, streeamlining aand integraating Outagge
Managem ment System m(OMS), SA AP & Meteer Managem ment, and GIS. Furth her the CMMS
(Complaiint Management System) was also o plugged into
i CORE. Complaint Managemen nt
System iss for monito oring the com
mplaints of consumers related to N No Current, Meters
M etc so
s
that therre is a fast & efficient resolution
r w
with in the tiime frame. The
T OMS was w integrateed
with GIS (Geographiccal Informattion System) also so thatt the Equipmments used in O&M could
be taggeed in GIS to find out thee fault locattions with its occurrence & hence time
t saved in
resolutio
on of the fau ult by sendin
ng the restorration team to the exact location.
Businesss Benefits
• Sttructured Daata source available
a to Operations and Mainteenance team m for plannin
ng
m
manpower an
nd resource deploymentt
• Complaint resolution witthin regulato ory timeline due to facto
ors like transparency annd
viisibility of electricity network an nd automatted SMS eescalation of o faults an nd
breakdowns
• A assets mapped and reecorded in SA
All AP
• Im
mprovementt in custome er satisfactio
on index
• U
Unified reporrting engine
• G
Green initiative
Due to very
v less fau
ults and outaages businesss targets are met. Furtther a satisffied customeer
brings in
n more business. As fauult rectificattion time is less and co
onsumer’s time is saved,
hence performance figures are e better. Po ower outages decreaseed by 98%. Transformeerfailure rate was more than 15% which has reduced to less than 1%. All these have helped us
in considerable amount of cost saving. The main impact of this project is fast & efficient
resolution of the Consumers’ complaints/ queries/ problems. 90% complaints attended in
less than 2 hrs. The customer reliability index has reached more than 99%.
Conclusion
The implementation of CORE at such a vast scale is in itself one of the largest deployments
in India, which makes it unique. Connectivity across a vast geographical stretch and varied
platform for its streamlined operation also makes it very unique. The immediate cost benefit
derived by implementation of the same has been one of the remarkable features. It was a
unique automation initiative towards customer services and care to their satisfaction. The
project was deployed for internal business operations of BSES Power at Delhi. It impacted
business, customer care, technical operations & monitoring and regulatory compliance
RECOGNITIONS
IT of BSES Delhi in the recent past received awards
• Network Innovation Award (2005) from HECL
• CIO 100 Award (2007) from IDG, USA
• CIO Leadership Award (2007, 2008) from IDG, USA
• NASSCOM recognition (2007) from NASSCOM
• BOLD CIO 100 Award (2008) from IDG, USA
• Smart Infrastructure Award (2008) from AMD Athlon, USA
• Diamond EDGE Award (2009) from Unified Business Media (Network Computing)
• “PC Quest Best IT Implementations of the Year” (2009) from PCQuest
• “Enterprise Connect Award”(2009) from CIOL (Cybermedia Online)
• CIO100 Award(2009) from IDG (International Data Group)
• Finalist for NASSCOM CNBC IT user Award (2009) under Energy & Utilities Category
• CIO100 Award(2010) and HALL OF FAME from IDG (International Data Group)
• Finalist for NASSCOM CNBC IT user Award (2010) under Energy & Utilities Category
• Top 3 for Champion Uptime Award and Strategic Security Award (2010) from Indian
Express
• EDGE AWARD(2010) in General IT Category from Unified Business Media
• Finalist for ICT for INDIA ‐ SKOTCH Award (2010)
• Uptime Champion Award(2011) from Indian Express
• SKOTCH Award (2011) for ICT for India
• EDGE Award(2011) in General IT Category from Unified Business Media
• CIO100 Award(2011) from IDG (International Data Group)
Page 26 of 297. Human Resource ‐ Skill Development Measures of Employees
BSES Rajdhani Power Limited (BRPL) has always strived for excellence, whether in
Operations or in terms of work force development. To achieve throughout excellence; work
force skill development is one of the key attributes. For the same we have a dedicated
department namely Learning Organization, which looks after the training requirements and
organizes necessary trainings.
As a process, training need identification is done in consultation with the stake holders i.e.
for a particular department a discussion at the Divisional and Corporate Office level is done
to know the training requirements. These discussions would involve grass root level
employees up to the Head of Departments. Post discussion a buying is created amongst the
top management about the requirement which has come up and accordingly training is
designed. We also try as far as possible that these trainings are imparted by our employees
who are involved in the training design and also are trained as internal trainers. These
trainings are not conducted just to provide training but also to provide a solution to the
issues for which the same is being conducted.
Under the technical training initiative; one of the most successful examples of this is the
RMU training wherein a need for training in Execution, Operation and maintenance of HT
switchgears was identified. A team of O&M engineers were sent to various RMU
manufacturers e.g. C&S, CGL, ABB & Schneider where they were trained on operations and
maintenance of the RMUs which have been installed in our organization. These engineers
further provided training to our work force and till date we have covered 1134 O&M
participants across levels. This training has helped to bring down the failure rates from 122
in 2010 to only 69 in 2011. Subsequently, a RMU Workshop was established in 2011. This
workshop has successfully repaired 185 RMUs till April 2012.
We conducted a Half‐Day Training Workshop of Assistant Line Mate (ALM), which was
training on Basics ‐ Tools Tackle & Safety. This training was held at the Divisional level and
covered Assistant Linemates. The main contents of the Trainings were the following:
9 Know about tools and tackles and their usage
9 Know about consumable and their applications
9 Safety precautions and norms
2 day Training Program for the Supervisors and Engineers deployed through contractors was
conducted during the FY 2011‐12. A total of 40 Supervisors & Engineers were Trained under
this Training. Main topics covered under this program were as follows:
a) Importance of various tools & tackles and safety equipment
b) Shut down procedures and safety precautions
c) Assessing LM on their practices relating to LT and HT preventive and break down
maintenance
Page 27 of 29d) Record keeping and reporting to officer‐in‐charge
e) DERC Supply Codes as applicable to O&M
A 2 day Training on LT & HT Maintenance Practices has been conducted for the O&M work
force. A total of 400 participants were trained under this program. As per the senior
personnel in O&M this was one of the Training which was greatly required by the work force
in the field.
In continuation to its efforts for improvement of skills and safety concern among AMC
workers, Learning Organization has managed to create another milestone of its own; a six
days practical training program for AMC linemen "AMC Certification Program" was launched
on 22nd March 2012. This six days Program has been developed after getting inputs from
O&M officers and the recommendations of apex Committee. The training covered other
topics beside issues related to day‐today working, included, understanding Job
responsibilities, Safety, Accident Prevention and First Aid & Treatment of Shock. Display &
explain the use of tools & equipment etc. In the coming year we would covering all our
outsourced Linemen in and ensure all of them undergo this program.
Another of the successful initiatives undertaken is Sampoorn Bijli Abhiyan (Developing
Consumer Centric Behavior). The objective of the training is to stress the importance of
customer delight, employee ownership, service quality, effective communication with
consumers, dispute resolution and handling customer complaints. This program is targeted
for the work force in O&M and Business Function at the Division level. This program is
conducted in phases wherein the participants undergo the training between October to
January due to the fact during summers due to peak demand our workforce is busy serving
our customers. In the first stage of the program participants from O&M and Business are
identified, who are later addresses as ‘Champions’. These Champions carry the baton of
sharing their learning’s with other personnel in the Division. Along with the training of these
Champions an interaction between Consumer groups (RWAs, Vishisht Sahyogi’s) and the
Champions is organized in each division, wherein issues pertaining to both sides are
discussed and solutions to address them are identified. The uniqueness of this program is
that it does not end at training but is linked to a recognition program. The recognition is
done through scorecards which have been designed and implemented in consultation with
the Champions and key stakeholders like Divisional Heads for O&M and Business, Business
Head, O&M Head, Business Analysis Group. Since this program encourages team work,
hence we have tried to recognize teams rather than individuals. Also, through this ceremony
we recognize important consumers in appreciation of their support. Employees and their
family members enthusiastically participate in the cultural programs organized as a part of
the ceremony. Importantly, each of these ceremonies is organized by the Champions with
an active support of their Divisional and Circle Heads. The recognition ceremony is not a
onetime event but has been designed in such a manner that it will be institutionalized and is
Page 28 of 29held every year. Under this program we have so far covered 11 out of our 19 Divisions and
by the end of this Financial Year we would have covered all the 19 Divisions.
Our organization focuses to cover all segments of workforce which includes permanent
employees and staff deployed by contractors. For instance, during the last financial year,
656 Linemen and 492 Additional Linemates deployed by the contractors were trained on
operations and maintenance practices, safety procedures, etc.. In the year 2011‐12 we have
conducted 254 training programs covering 4960 employees and totaling 7863 mandays.
Page 29 of 29You can also read