UK Customer Satisfaction Index - JULY 2021 The state of customer satisfaction in the UK - Institute of Customer Service
←
→
Page content transcription
If your browser does not render page correctly, please read the page content below
instituteofcustomerservice.com

JULY 2021

UK Customer
Satisfaction Index
The state of customer satisfaction in the UK
Foreword
               Joanna Causon Chief Executive

This has been the most unusual and challenging        For the first time since 2017, more organisations
year for customer service since the UKCSI began       have improved rather than declined year on year
in 2008. Hopefully and mercifully, the threat to      by at least 2 points on the customer satisfaction
life and physical well-being created by Covid-19      index. The Covid-19 crisis has exposed
appears to have been significantly reduced - in       differences in organisations’ ability to adapt and
the UK at least – by the vaccination programme        innovate. Many trusted and established brands
and lockdown. But the Covid-19 crisis is not over:    and organisations appear to have maintained or
the longer-term societal and economic impacts         improved their service performance.
are not yet fully apparent and will shape the
customer experience landscape in the months           Customer attitudes, behaviours and preferences
and years ahead. For organisations, this is a         have evolved in the past year and will develop
critical time to take stock of lessons learned        and fragment further as the social and economic
during the pandemic and to redefine future            consequences of the pandemic unfold. For the
priorities, linking everything we do back to          first time, at least half of the customer experiences
purpose, relevance and the long-term impact or        recorded in this UKCSI took place though
legacy we seek to create.                             digital channels, underlining the importance of
                                                      an omnichannel strategy that blends the best
This UKCSI shows a welcome, if modest,                elements of technology and human interaction.
improvement in overall customer satisfaction.
However, a note of caution: much of the               Customers have appreciated improvements or
improvement can be attributed to better               innovation in service such as better scheduling
complaint handling and service recovery. Indeed,      to avoid queuing, proactive communications
satisfaction with complaint handling is at its        and dialogue, support with mental, physical
highest ever level, even though record numbers        or financial well-being, advice and knowledge
of customers have experienced a problem with          to help navigate challenging situations and life
an organisation. What this demonstrates all too       events. However, almost a quarter of customers
clearly is that we have got better at dealing with    believe that some organisations have used
issues but not necessarily better at preventing       Covid-19 as an excuse for poor service. More
them impacting customers in the first place. For      customers have made online purchases or
the UK economy to move forward as a leader in         chosen to buy from local or ethical suppliers, and
customer service, we need a broader focus on all      the number of customers who are willing to pay
dimensions of customer satisfaction.                  more for excellent service has grown to 32%.

2        UK Customer Satisfaction Index | July 2021
These trends serve to underline concerns over Finally, organisations need to engage proactively
polarisation in our society between those that with their customers. Many of the organisations
demand and can afford to pay for better service, that have maintained high levels of customer
and those that cannot. satisfaction have deliberately increased the level
of their customer engagement, providing timely
In the coming months, the signs for economic and relevant communications that demonstrate a
recovery are positive but growth is likely to be genuine care for customers’ well-being.
uneven across sectors and regions. We will, I
believe, see skills shortages alongside growing The experiences of the past year have
unemployment, changes in employment strengthened our understanding of the
opportunities, and a rise in business failures contribution of customer service to well-being,
alongside expansion of productive organisations, quality of life, trust in organisations, and business
as government economic support is pared back. performance. I believe that a sustained focus on
customer experience will be vital for the health
In this UKCSI, we have sought to examine and prosperity of organisations, their customers
changes in customer experience over the and employees, and our economy. I hope that
past year and bring out the key learnings for you find this report valuable and I look forward
organisations. From my perspective, three to working with organisations and stakeholders
areas of focus stand out. Firstly, organisations across sectors to champion the service agenda.
need to be realistic and clear about their core
proposition, who they serve and the sustainable
impact they seek to achieve. Secondly, Covid-19
has heightened the importance of flexibility,
adaptability and innovation. Organisations need
to learn from the enforced changes of Covid-19,
retain the benefits and develop the mindset
and capabilities to enable ongoing innovation.
UK Customer Satisfaction Index | July 2021 34 UK Customer Satisfaction Index | July 2021
Contents

Executive summary                                                             6

Part 1 The state of customer satisfaction in the UK                         18

Part 2	Customer satisfaction and business peformance,                      40
        loyalty and reputation

Part 3	Customer experience during the COVID-19 crisis                      50

Part 4 Changing behaviours and preferences                                  64

Part 5 Key learnings and recommendations for organisations                  74

       UKCSI Key facts                                                      86

       Organisations in the UKCSI                                           87

       About the UKCSI                                                      88

       UKCSI sector reports                                                 89

       Breakthrough research from The Institute                             90

       About The Institute                                                  94

                                                      UK Customer Satisfaction Index | July 2021   5
Executive Summary
The state of customer
satisfaction in the UK
T he UK Customer Satisfaction Index (UKCSI) is 14.9% of customers experienced a problem with
77.4 (out of 100), 0.4 points higher than in July an organisation, the highest rate since 2009
2020 and 0.6 points above the January 2021 but satisfaction with complaint handling it at its
UKCSI. highest ever level.
78.2 78.2 78.1 77.9
78.0 77.9 77.8 77.7
77.3
77.4
77.1
77.4
77.1
77.4
77.0
76.7 76.9 77.0 76.8
76.3 76.2
76.0
75.6
75.2
74.1
72.0
Jan-09 Jul-09 Jan-10 Jul-10 Jan-11 Jul-11 Jan-12 Jul-12 Jan-13 Jul-13 Jan-14 Jul-14 Jan-15 Jul-15 Jan-16 Jul-16 Jan-17 Jul-17 Jan-18 Jul-18 Jan-19 Jul-19 Jan-20 Jul-20 Jan-21 Jul-21
F or the first time, 50% of the customer experiences recorded in the UKCSI were digital (on an
organisation’s website or via email, web chat, text or social media).
Differences in customer satisfaction in each channel are partly influenced by types of customer experience. A
relatively high proportion of in person, website or app experiences involve making a purchase, an experience
which typically results in higher than average satisfaction. By contrast, a relatively high proportion of email,
web chat, social media, text, in writing (letter) and over the phone experiences are about problems or
complaints, which tend to attract lower than average levels of customer satisfaction.
26.9%
Email
16.9%
4.3%
App
35.7%
5.4%
On an organisation’s website
44.6%
Over the phone 17.5%
(e.g. called a contact centre)
12.3%
% experiences in this channel about a problem or complaint
% experiences in this channel about making a purchase
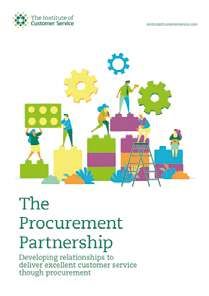
UK Customer Satisfaction Index | July 2021 73 sectors up by at 1 sector down by at least one
least one point since July 2020 point since July 2020
The Public Services (National) and Retail (Non- Public Services Public Services
food) sectors have improved by 1.2 points and (National) (Local)
Telecommunications and Media by 1 point,
compared to July 2020. Average customer Retail
satisfaction in the Public Services (Local) sector (Non-food)
fell by 1.6 points. The other nine UKCSI sectors Telecommunications
have moved by less than 1 point compared to & Media
July 2020.
70 39
272 organisations and organisation types are
included in this UKCSI. For the first time since July
2017, more organisations (70) have improved than
Organisations have Organisations have
improved experienced a yoy drop declined (39) year on year by at least 2 points.
rganisations with a UKCSI score at least 2 points higher than a year ago have generated fewer problems
O
for customers and have better satisfaction with complaint handling satisfaction.
% customers Satisfaction with
experiencing a problem complaint handling
All organisations 14.9% 6.0
Organisations whose UKCSI has
improved by at least 2 points 15.8% 6.4
Organisations whose UKCSI has
declined by at least 2 points 21.0% 5.1
8 UK Customer Satisfaction Index | July 2021first direct, John Lewis and amazon.co.uk are the highest rated organisations. They are the only
organisations who were also rated amongst the top 10 in July 2020.
Change
Jul-21 Jul-21 Jul-20 Jul-20 in score
Organisation Sector
Rank Score Score Rank Jul-20 to
Jul-21
1 first direct Banks & Building Societies 86.6 84.2 3 2.4
2 John Lewis Retail (Non-food) 84.4 85.3 1 -0.9
3= Amazon.co.uk Retail (Non-food) 84.0 83.3 6 0.7
3= Suzuki Automotive 84.0 78.9 79 5.1
5= Swinton Insurance 83.9 74.9 186 9.0
5= Tesco Mobile Telecommunications & Media 83.9 82.8 12 1.1
7= Home Bargains Retail (Non-food) 83.8 81.0 27 2.8
7= SAGA Insurance Insurance 83.8 81.2 24 2.6
9= Greggs Leisure 83.5 82.1 17 1.4
9= Jet2holidays.com Tourism 83.5 80.2 45 3.3
9= Scottish Water Utilities 83.5 77.3 128 6.2
9= Specsavers Retail (Non-food) 83.5 81.2 24 2.3
p Increase in UKCSI score of less than one point q Fall in UKCSI score p Increase in UKCSI score of one point or more
Looking across the UKCSI as a whole, Deliveroo, Just Eat and Screwfix Direct have received a UKCSI score
for the first time.
UK Customer Satisfaction Index | July 2021 9Customer satisfaction
and business
performance, loyalty and
reputation
All of the food retailers that appear in both the
UKCSI and Kantar’s market research*, except for
Co-op Food, grew their sales in the 12 weeks to
18 April 2021, compared to the same period in
the previous year.
etail (Food) organisations recording a relatively high proportion of website customer experiences in the
R
UKCSI, generated an average sales growth of 10%, compared to 4.2% for those with a lower than average
proportion of customers using their website.
Average sales growth of Retail (Food) organisations Average sales growth of Retail (Food) organisations
with higher than sector average proportion with lower than sector average proportion
of website customer experiences of website customer experiences
10% 4.2%
* Kantar
World Panel market share data for 12 weeks ending 18 April 2021
10 UK Customer Satisfaction Index | July 2021 cross the average of all organisations in the UKCSI, achieving a 9 or 10 (out of 10) for customer
A
satisfaction has a much stronger effect even than an 8 out of 10 in generating the highest levels of trust,
recommendation, loyalty and reputation.
Customers who score Customers who score
an organisation 9 or 10 out of 10 an organisation 8 - 8.9 out of 10
for customer satisfaction for customer satisfaction
Open and transparent
% of customers who give a 9 or 10 rating 94% 38%
Trust
% of customers who give an
organisation a 9 or 10 95% 47%
trust rating
Recommendation
% of customers scoring an organisation 95% 55%
9 or 10 on likelihood to recommend
Loyalty
% of customers scoring an organisation 97% 65%
9 or 10 on intention to remain a customer
Reputation
% of customers who give an organisation a
9 or 10 when asked “how would you rate 85% 35%
the reputation of this organisation”
UK Customer Satisfaction Index | July 2021 11Customer experience
during the Covid-19 crisis
Overall customer satisfaction was higher for experiences recorded in spring 2021 than for those in
autumn 2020. The biggest improvement between autumn 2020 and spring 2021 was in the Transport
and Tourism sectors.
Customer responses
that make up the July 2021 UKCSI
Index scores out of 100
77.0 76.8 78.2 77.4
July 2020
76.6 Responses given July 2021
Jan 2021
UKCSI Responses 8th March - UKCSI
UKCSI
given 14 Sept - 6 April 2021
12 Oct 2020
3-31 August 12 October 6 January 29 March
Eat Out Three-tier England in England,
to Help Out restrictions enters third 2 households
scheme introduced national or 6 people
in England lockdown allowed to
meet indoors.
21 September 4 January 8 March Travel
UK Coronavirus vaccination Schools permitted
alert upgraded programme in England outside local
from level commences reopened area
3 to 4
12 UK Customer Satisfaction Index | July 202127% of customers have experienced a change in customer service during the Covid-19 pandemic.
Customers were most likely to say there has been a change in the customer service they experienced in
the Public Services (Local and National) and Transport sectors.
Do you think there has been a change in the customer service you get from xx because of Covid-19?
UK all-sector average 27.4% 54.1% 18.5%
Public Services (Local) 48.1% 38.3% 13.5%
Public Services (National) 36.8% 47.4% 15.7%
Transport 34.5% 44.5% 20.9%
Yes No Don't know
Customers who have experienced a positive change in service during Covid-19 are slightly more satisfied
than those who have seen no change. But customers who have experienced a negative change in
service are much less satisfied than other customers.
Overall UKCSI 77.4
81.9
Average customer satisfaction 61.5
index scores (out of 100)
80.6
Customers who have Customers who have No change
experienced a positive experienced a negative
change in customer service change in customer service
during Covid-19 during Covid-19
UK Customer Satisfaction Index | July 2021 13The main positive changes in customer experience during the pandemic are better scheduling of
appointments, support to improve well-being, and proactive communication by organisations.
Booking appointment/visiting times
23.4%
to avoid queuing or waiting
Support with improving my mental,
18.7%
physical or financial wellbeing
Communications and ideas
(articles and tips) - 17.9%
advice and guidance - 'how to's
Innovations in tech - new apps 14.5%
% customers who said the improvement in service they % customers who said the improvement in service they
experienced made them feel more positive about the organisation experienced made them more likely to use an organisation in future
61% 49%
Making it easier to contact the right person to help, website navigation, more helpful, knowledgeable
staff are the top issues customers want organisations to improve.
Make it easier to contact the 14.4%
right person to help me
Better website navigation 14.1%
More friendly / helpful staff 13.2%
More knowledgeable staff 11.9%
14 UK Customer Satisfaction Index | July 2021Changing behaviours
and preferences
Over 30% of customers have made more online purchases in the last 6 months. More than 20% have
reduced and thought more carefully about what they spend.
34.3%
I’ve bought more online
32.6%
29.9%
I’ve thought more carefully about
what I spend money on 30.4%
23.5%
I’ve tried to reduce what I’m spending
– so that I can save more 22.6%
23.1%
I’ve tried to reduce what I’m spending
– because I have less to spend
20.0%
Jul-21 Jan-21
T he number of customers who prefer to pay more for excellent service, even if it costs more, has
increased in the last year.
31.6%
29.5%
27.5%
26.7% 26.6% 26.4% 25.9%
14.1% 14.2%
13.8% 13.9% 13.8%
13.3%
12.2%
Jul-18 Jan-19 Jul-19 Jan-20 Jul-20 Jan-21 Jul-21
Preference for excellent service, even if it costs more Preference for low cost, no frills service
UK Customer Satisfaction Index | July 2021 15Customers who prefer to pay more for excellent service are the most likely to spend more with
companies they trust and with local, independent or ethical companies.
Reasons for preferring excellent service, Reasons for preferring no frills,
even if it costs more lowest cost service
I trust I don’t want
the company 35% to pay for extras 50%
I use I won’t use
I am confident I
I feel happier knowing
understand the products
I have the support 29% and services I want 32%
and advice
to buy / use
I worry about It’s easy
getting the right for me to compare the
product and service 19% products and services 8%
for me from all brands
16 UK Customer Satisfaction Index | July 2021Key learnings and
recommendations for
organisations
We conclude our review of the state of customer satisfaction in the UK by reflecting on key lessons for
organisations from the Covid-19 pandemic and implications for customer experience.
1 In the context of Covid-19, organisational purpose is even more critical to success
2 Combining the best of digital and human interactions to design experiences around
customer needs
3 Developing a blend of digital, interpersonal, applications development
and customer experience skills
4 Complaint handling is essential to reduce customer dissatisfaction but is not enough to drive
further improvements in satisfaction and engagement
5 Environmental
Maintain
delivery
and social impact are increasingly relevant to an organisation’s
a focus on
customer proposition
and logistics
6 Proactive communication and engagement to maintain and develop trust
7 Developing flexibility and innovation to respond to change and create new opportunities
8 Customer satisfaction and employee engagement have become important
measures of corporate governance
9 A long-term focus on customer service to enable sustained business performance
10 Learning the lessons from Covid-19 to prepare better for future shocks
UK Customer Satisfaction Index | July 2021 171 The state of customer satisfaction in the UK 18 UK Customer Satisfaction Index | July 2021
July 2021 is
                                                                                                                  the highest UKCSI score
                                                                                                                    since January 2019,
                                                                                                                     when it was 77.7

The UK Customer Satisfaction Index (UKCSI) is 77.4
(out of 100), 0.4 points higher than in July 2020 and 0.6
points above the January 2021 UKCSI

                                                        78.2                                                            78.2    78.1 77.9
                                                 78.0           77.9                                             77.8                     77.7
                                   77.3
                                          77.4
                                                                       77.1
                                                                                                          77.4
                                                                                                                                                     77.1
                                                                                                                                                                              77.4
                                                                                                   77.0
                            76.7                                                                                                                            76.9 77.0 76.8
                                                                              76.3          76.2
                                                                                     76.0
                     75.6
              75.2

       74.1

72.0

Jan-09 Jul-09 Jan-10 Jul-10 Jan-11 Jul-11 Jan-12 Jul-12 Jan-13 Jul-13 Jan-14 Jul-14 Jan-15 Jul-15 Jan-16 Jul-16 Jan-17 Jul-17 Jan-18 Jul-18 Jan-19 Jul-19 Jan-20 Jul-20 Jan-21 Jul-21

                                                                                              UK Customer Satisfaction Index | July 2021                                        19
The UKCSI is based on 26 measures which are categorised in 5 dimensions of customer satisfaction.
Satisfaction in each dimension is slightly higher than a year ago, with the largest increase for the
Complaint Handling dimension, up 1.4 points to 60.2 (out of 100).
Jul Jul Year-on-
Dimension (score out of 100) 21 20 year
change
Experience
Measures the quality of customers’ experiences and 78.3 78.0 0.3
interactions with organisations
Complaint Handling
How organisations respond and deal with problems and 60.2 58.8 1.4
complaints
Customer Ethos
Extent to which customers perceive that organisations
76.8 76.5 0.3
genuinely care about customers and build the experience
around their customers’ needs
Emotional Connection
The extent to which an organisation engenders feelings 76.7 76.2 0.5
of trust and reassurance
Ethics
Reputation, openness and transparency and the extent 75.8 75.2 0.6
to which an organisation is deemed to “do the right thing”
20 UK Customer Satisfaction Index | July 202114.9% of customers experienced a problem with
an organisation, the highest rate since 2009, but
satisfaction with complaint handling is at its
highest ever level
Despite the increase in the number of customers experiencing a problem with an organisation, all 4
complaint handling measures have registered their highest ever scores. Nevertheless, average satisfaction
for customers who say they experienced a problem with an organisation is much lower than for those
did not experience a problem.
Right first time and complaints measures Jan 2020 – July 2021
Sector Jan-20 Jul-20 Jan-21 Jul-21
% experiences right first time 80.6% 81.0% 80.5% 79.8%
% of customers experiencing
13.6% 14.1% 14.6% 14.9%
a problem
Satisfaction with outcome of
6.0 5.9 5.8 6.1
the complaint
Satisfaction with complaint handling 5.8 5.8 5.7 6.0
Staff attitude
6.1 6.2 6.0 6.3
(in context of a complaint)
Speed of resolving your complaint 5.8 5.8 5.6 5.9
Average UKCSI score
Customers who experienced a problem Customers who did not
with an organisation experience a problem
61.9 80.1
UK Customer Satisfaction Index | July 2021 21The average Net Promoter Score, 23.5, is 2.8 points above its July 2020 level and the highest ever
recorded in the UKCSI, due to both a modest increase in the number of promoters and a decline in the
number of detractors1.
Yoy change
20.7
Net Promoter Score (NPS) +2.8
23.5
43.3%
% Promoters +1.1
44.4%
34.1%
% Passives +0.5
34.6%
22.6%
% Detractors -1.6
21.0%
Jul-20 Jul-21
1Net Promoter Score (NPS) is calculated by subtracting the % of respondents scoring 0 - 6 (out of 10) on likelihood to recommend from the % of respondents
scoring 9 – 10. Promoters are those scoring 9 - 10. Passives score 7 - 8 and Detractors score 0 - 6.
22 UK Customer Satisfaction Index | July 2021The Public Services National, Retail (Non-food) and
Telecommunications and Media sectors have each
improved by at least 1 point, compared to July 2020.
Average customer satisfaction in the Public Services
(Local) sector fell by 1.6 points
3 sectors up by at 7 sectors up by less 2 sectors down by less 1 sector down by at
least one point since than one point than one point since least one point since
July 2020 compared to July 2020 July 2020 July 2020
Public Services Banks & Building Public Services
Automotive
(National) Societies (Local)
Retail
Insurance Services
(Non-food)
Telecommunications
Leisure
& Media
Retail (Food)
Tourism
Transport
Utilities
UK Customer Satisfaction Index | July 2021 23Customer satisfaction by sector July 2020 – July 2021
80.0
Retail (Non-food) 80.5
81.2
80.2
Leisure 80.1
80.7
79.6
Retail (Food) 80.0
80.4
78.3
Automotive 78.4
79.1
78.6
Insurance 78.4
79.0
79.1
Banks & Building Societies 78.3
78.8
78.6
Tourism 77.7
78.8
76.1
Public Services (National) 76.7
77.3
77.1
Services 76.6
76.6
74.2
Telecommunications & Media 74.3
75.2
75.3
Public Services (Local) 74.4
73.7
72.6
Utilities 72.7
73.5
Jul-20
71.4
Transport 69.9 Jan-21
71.5 Jul-21
24 UK Customer Satisfaction Index | July 2021The Retail (Non-food) sector has improved by 1.2 points to 81.2 and is the highest rated sector.
Public Services (National) has also risen by 1.2 points, to 77.3, its highest ever score.
The Telecommunications and Media sector is 1 point higher than a year ago and like Public Services
(National) has registered its highest ever score.
The Public Services (Local) sector dropped by 1.6 points compared to July 2020, its lowest score since
July 2015, when it was 72.9.
7 sectors – Automotive, Insurance, Leisure, Retail (Food), Tourism, Transport and Utilities – improved
by less than 1 point compared to July 2020. Average customer satisfaction with Banks and Building
Societies and Services organisations fell slightly, by 0.3 and 0.5 points respectively.
Within the Transport sector, average satisfaction for experiences with Rail and Coach / Bus companies
improved by 2.4 and 1.3 points respectively. But average satisfaction with Airlines is 70.5, 3.8 points
lower than in July 2020.
Customer satisfaction in the Transport sector
Jul-21
Jul-20
74.3
72.1 71.6
69.7 70.5 70.3
Rail / Train Air Coach / Bus
Customer satisfaction index scores out of 100
UK Customer Satisfaction Index | July 2021 25For the first time, 50% of the customer experiences
recorded in the UKCSI were digital
The July 2021 UKCSI shows further evidence of evolving channel use during the Covid-19 pandemic. The
proportion of in person customer experiences (30.4%) is more than 10 percentage points lower than
in July 2020. For the first time, 50% of customer experiences recorded in the UKCSI were conducted
through digital channels (either on an organisation’s website or by email, app, web chat, text or social
media).
Types of customer experience by channel
Jan-20 1.5% 1.3%
42.8% 16.6% 26.4% 6.5% 3.2%
1.0% 0.6%
Jul-20 1.8% 1.1%
41.7% 16.2% 26.3% 7.6% 3.5%
1.3% 0.6%
Jan-21 2.2% 0.9%
36.2% 17.4% 27.1% 10.1% 4.0%
1.5% 0.7%
Jul-21 2.6% 0.9%
30.4% 18.6% 29.0% 11.8% 4.5%
1.4% 0.8%
In person Phone Website Email Text Web chat App Social media In writing
26 UK Customer Satisfaction Index | July 2021In general, customer satisfaction is higher than it was a year ago for experiences across all channels,
except for in writing (letter) experiences, which is slightly (0.9 points) lower. However, both average
levels of satisfaction and year on year changes in satisfaction for experiences in each channel vary
considerably between sectors2.
Average customer satisfaction for experiences in each channel
Jul-21
Jul-20
81.3
80.2 80.1
78.8 78.9
78.4
74.4
73.8 73.6
73.5
72.1 71.9
71.1 71.3
70.9
70.2
69.3
67.9
In person Phone Website Email Text Web chat App Social media In writing
2 See
UKCSI sector reports for customer satisfaction scores for experiences by channel, available at www.instituteofcustomerservice.com/ukcsi
UK Customer Satisfaction Index | July 2021 27A relatively high proportion of email, web chat, social
media, text, in writing (letter) and over the phone
experiences are about problems or complaints
In person, website and app experiences tend to attract higher than average levels of customer
satisfaction. However, this can in part be explained by the mix of types of contact that take place in
each channel. A relatively high proportion of in person, website or app experiences involve making
a purchase, an experience which typically results in higher than average satisfaction. By contrast, a
relatively high proportion of email, web chat, social media, text, in writing (letter) and over the phone
experiences are about problems or complaints, which tend to attract lower than average levels of
customer satisfaction.
Frequency of types of experience, by channel
26.9%
Email
16.9%
26.2%
Web chat
8.8%
19.4%
Social media
16.8%
18.4%
Text
12.2%
17.9%
In writing (letter)
10.9%
Over the phone 17.5%
(e.g. called a contact centre)
12.3%
5.4%
On an organisation’s website
44.6%
4.3%
App
35.7%
In person 3.8%
e.g. visited a store/branch/office) 56.6%
% experiences in this channel about a problem or complaint
% experiences in this channel about making a purchase
28 UK Customer Satisfaction Index | July 2021For the first time since July 2017, more organisations
have improved than declined year on year by at
least 2 points
272 70
Organisations and Organisations
39
Organisations
organisation have improved have experienced
types in the UKCSI yoy by at least a yoy drop of
two points at least 2 points
% of organisations that have improved or declined by at least 2 points
% organisations whose UKCSI score has improved yoy by at least two points
% organisations whose UKCSI score has declined yoy by at least two points
30%
28% 27%
26%
20%
18%
16%
14%
11% 10%
Jul-19 Jan-20 Jul-20 Jan-21 Jul-21
UK Customer Satisfaction Index | July 2021 29In the Public Services (National), Telecommunications
and Media, Transport and Banks and Building
Societies sectors, at least 50% of the organisations in
the UKCSI have moved by at least 2 points, compared
to a year ago
Number of organisations in each sector whose customer satisfaction
has improved or declined, compared, to July 2020
Sector Total number of % organisations Number of Number of Gap between
organisations that have moved organisations organisations highest
by 2 points or that have that have and lowest
more increased by 2 dropped by 2 organisation July
points or more points or more 2021
Retail (Non-food) 24 29% 6 1 9.4
Leisure 21 14% 1 2 13.7
Retail (Food) 11 9% 1 0 5.5
Automotive 26 31% 5 3 10.8
Insurance 28 43% 6 6 12.0
Banks & Building Societies 20 50% 5 5 11.7
Tourism 23 48% 10 1 12.6
Public Services (National) 10 60% 5 1 10.4
Services 19 37% 3 4 17.9
Telecommunications & Media 13 62% 6 2 19.5
Public Services (Local) 7 43% 1 2 16.0
Utilities 34 38% 9 4 16.9
Transport 36 56% 12 8 26.9
30 UK Customer Satisfaction Index | July 2021In the Public Services (National) sector, half of the
organisations that appear in the UKCSI received
a customer satisfaction score at least 2 points
higher than a year ago.
In the Tourism and Telecommunications and
Media sectors, over 40% of the organisations
featuring in the UKCSI have a score at least 2
points higher than in July 2020.
In the Banks and Building Societies sector 5
organisations rose by 2 points and 5 fell by
2 points. Similarly, in the Insurance sector, 6
organisations improved by at least 2 points but 6
dropped by the same amount.
In the Transport sector, 10 of the 12
organisations that have improved by 2 points or
more are train operators. The 8 organisations
whose UKCSI score fell by at least 2 points
include both airlines and train operators.
UK Customer Satisfaction Index | July 2021 31Organisations with a UKCSI score at Organisations with a UKCSI score at
least 2 points higher than a year ago least 2 points lower than a year ago
• Higher satisfaction scores than a year • Lower satisfaction scores than a year ago
ago on all measures, especially complaint across the range of measures including
handling complaint handling, speed of service, ease of
dealing with an organisation
• More customers rated their experience as
being right first time • Fewer customers rated their experience as
being right first time
• Fewer customers experienced a problem
• More customers experienced a problem with
an organisation
This evidence reaffirms the need to focus on all dimensions of customer satisfaction, the critical
importance of accessibility and ease of contact, complaint handling and the benefits of reducing the
extent of problems experienced by customers.
32 UK Customer Satisfaction Index | July 2021Organisations that have improved or declined by at least 2 points: selected measures
The 70 organisations that have The 39 organisations that
improved by 2 points or more have declined by 2 points or more
Jul-20 Jul-21 yoy change Jul-20 Jul-21 yoy change
UKCSI 73.8 77.2 3.4 77.1 73.2 -3.9
Ease of dealing with XX 7.6 7.9 0.3 7.9 7.4 -0.5
XX makes it easy to contact the
7.3 7.6 0.3 7.5 7.1 -0.4
right person to help
Ability to interact with XX in the
7.7 7.9 0.2 7.9 7.5 -0.4
way you prefer
Speed of service / response 7.4 7.7 0.3 7.8 7.3 - 0.5
XX makes you feel reassured 7.2 7.7 0.5 7.6 7.2 -0.4
Handling of the complaint 5.6 6.4 0.8 5.9 5.1 -0.8
% experiences that were right first time 76.8% 79.0% 2.2% 80.0% 74.2% -5.8%
% of customers experiencing a
17.8% 15.8% -2% 16.1% 21.0% 4.9%
problem with an organisation
Positive changes compared to July 2020 Negative changes compared to July 2020
UK Customer Satisfaction Index | July 2021 33The top
50 organisations
Change
Jul-21 Jul-21 Jul-20 Jul-20 in score
Organisation Sector
Rank Score Score Rank Jul-20 to
Jul-21
1 first direct Banks & Building Societies 86.6 84.2 3 2.4
2 John Lewis Retail (Non-food) 84.4 85.3 1 -0.9
3= Amazon.co.uk Retail (Non-food) 84.0 83.3 6 0.7
3= Suzuki Automotive 84.0 78.9 79 5.1
5= Swinton Insurance 83.9 74.9 186 9.0
5= Tesco Mobile Telecommunications & Media 83.9 82.8 12 1.1
7= Home Bargains Retail (Non-food) 83.8 81.0 27 2.8
7= SAGA Insurance Insurance 83.8 81.2 24 2.6
9= Greggs Leisure 83.5 82.1 17 1.4
9= Jet2holidays.com Tourism 83.5 80.2 45 3.3
9= Scottish Water Utilities 83.5 77.3 128 6.2
9= Specsavers Retail (Non-food) 83.5 81.2 24 2.3
13= Netflix Leisure 83.4 82.5 13 0.9
13= The Co-operative Bank Banks & Building Societies 83.4 82.1 17 1.3
15 Aldi Retail (Food) 83.3 82.9 10 0.4
16 Pets at Home Retail (Non-food) 83.2 82.2 16 1.0
17 Octopus Energy Utilities 83.1 80.9 29 2.2
18 M & S (food) Retail (Food) 82.6 83.5 5 -0.9
19= Nationwide Banks & Building Societies 82.4 84.4 2 -2.0
19= TK Maxx Retail (Non-food) 82.4 77.6 124 4.8
21= Deliveroo Leisure 82.3 NO DATA NO DATA NO DATA
21= RAC Insurance 82.3 77.2 132 5.1
23 LV= Insurance 82.2 83.0 8 -0.8
24 M&S Retail (Non-food) 82.1 84.0 4 -1.9
25 Premier Inn Tourism 82.0 82.9 10 -0.9
26= SAGA Holidays Tourism 81.9 78.5 93 3.4
26= Trivago Tourism 81.9 78.0 111 3.9
26= Waitrose Retail (Food) 81.9 78.2 100 3.7
29= Dacia Automotive 81.8 NO DATA NO DATA NO DATA
29= Halfords Retail (Non-food) 81.8 75.9 168 5.9
p Increase in UKCSI score of less than one point q Fall in UKCSI score p Increase in UKCSI score of one point or more
34 UK Customer Satisfaction Index | July 2021Change
Jul-21 Jul-21 Jul-20 Jul-20 in score
Organisation Sector
Rank Score Score Rank Jul-20 to
Jul-21
29= Nissan Automotive 81.8 80.8 31 1.0
32= booking.com Tourism 81.7 80.4 37 1.3
32= Ikea Retail (Non-food) 81.7 81.1 26 0.6
34 Holland & Barrett Retail (Non-food) 81.6 80.8 31 0.8
35= Screwfix Direct Retail (Non-food) 81.5 NO DATA NO DATA NO DATA
35= Škoda UK Automotive 81.5 79.0 76 2.5
37= Amazon Prime Video Leisure 81.4 80.5 34 0.9
37= Hyundai Automotive 81.4 79.8 54 1.6
37= Next Retail (Non-food) 81.4 77.8 114 3.6
37= Toyota Automotive 81.4 81.9 19 -0.5
41= Argos Retail (Non-food) 81.2 79.7 58 1.5
41= Green Flag Services 81.2 79.8 54 1.4
41= Starling Bank Banks & Building Societies 81.2 80.6 33 0.6
44= Aviva Insurance 81.1 79.8 54 1.3
44= Costa Coffee Leisure 81.1 82.4 14 -1.3
44= Ebay Retail (Non-food) 81.1 79.6 61 1.5
44= Jet2 Transport 81.1 80.3 41 0.8
44= McDonald's Leisure 81.1 81.5 21 -0.4
44= Metro Bank Banks & Building Societies 81.1 78.3 96 2.8
44= Nationwide Insurance Insurance 81.1 83.0 8 -1.9
44= Tesco Retail (Food) 81.1 79.2 73 1.9
p Increase in UKCSI score of less than one point q Fall in UKCSI score p Increase in UKCSI score of one point or more
first direct is the highest rated organisation in the July 2021 UKCSI. Its score of 86.6 is 2.4 points higher
than a year ago.
18 of the top 50 rated organisations have improved by more than 2 points compared to a year ago.
5 organisations – Suzuki, Swinton, RAC (Insurance), Scottish Water and Halfords recorded average
customer satisfaction at least 5 points higher than in July 2020.
Looking across the UKCSI as a whole, Deliveroo, Just Eat and Screwfix Direct have received a UKCSI score
for the first time.
UK Customer Satisfaction Index | July 2021 35Top rated organisations
by customer satisfaction
dimension
UKCSI dimensions
Complaint Customer Emotional
Experience Handling Ethos Connection Ethics
first direct AXA first direct first direct John Lewis
Amazon.co.uk UK Power Scottish Water John Lewis first direct
Networks
Home Bargains Specsavers Tesco Mobile Swinton
Toyota
Tesco Mobile John Lewis Suzuki Suzuki
Pizza Hut
Swinton Pets at Home Specsavers M & S (food)
Green Flag
Greggs SAGA Scottish Water Specsavers
West Midlands Insurance
The Railway SAGA SAGA Holidays
Co-operative Suzuki Insurance
Bank Trivago The
Octopus The Co-operative
John Lewis Gatwick Energy Co-operative Bank
Express Bank
Aldi Jet2 Scottish Water
Uber holidays.com M & S (food)
SAGA Waitrose
Insurance Companies Netflix TK Maxx
House
Swinton
Kia
Tesco Mobile
Only first direct and John Lewis are amongst the most highly rated organisations across the Experience,
Customer Ethos, Emotional Connection and Ethics measures of customer satisfaction.
The Complaint Handling dimension features a wider spread of organisations amongst the top
performers than the other dimensions. For Complaint Handling, only organisations for whom at least
10 complaints were recorded receive a published score. This means that, whereas for the Experience,
Customer Ethos, Emotional Connection and Ethics dimensions every organisation receives a score,
organisations generating particularly low levels of complaints may not receive published ratings for
satisfaction with complaint handling.
36 UK Customer Satisfaction Index | July 202120 most improved
organisations
Sector
UKCSI UKCSI Compared
20 most improved organisations average
score July score July Change to sector Sector
over one year UKCSI
2020 2021 average
score
Swinton 74.9 83.9 9.0 4.9 Insurance 79.0
Abellio Scot Rail 60.7 69.6 8.9 -1.9 Transport 71.5
Northern / Northern Trains 60.8 68.6 7.8 -2.9 Transport 71.5
Southeastern
63.6 70.9 7.3 -0.6 Transport 71.5
(train operating company)
Hotels.com 71.0 78.1 7.1 -0.7 Tourism 78.8
Public Services
Jobcentre Plus 63.8 70.0 6.2 -7.3 77.3
(National)
Scottish Water 77.3 83.5 6.2 10.0 Utilities 73.5
Halfords 75.9 81.8 5.9 0.6 Retail (Non-food) 81.2
Southern 61.3 66.7 5.4 -4.8 Transport 71.5
Trailfinders 75.6 80.8 5.2 2.0 Tourism 78.8
Suzuki 78.9 84.0 5.1 4.9 Automotive 79.1
RAC 77.2 82.3 5.1 3.3 Insurance 79.0
UK Power Networks 73.7 78.6 4.9 5.1 Utilities 73.5
TK Maxx 77.6 82.4 4.8 1.2 Retail (Non-food) 81.2
CrossCountry 69.2 74.0 4.8 2.5 Transport 71.5
Great Western Railway 69.4 74.2 4.8 2.7 Transport 71.5
First Group -
63.0 67.7 4.7 -3.8 Transport 71.5
bus companies
Telecommunications
Virgin Mobile 68.1 72.7 4.6 -2.5 75.2
& Media
Utilita 72.0 76.6 4.6 3.1 Utilities 73.5
Scottish Gas 70.3 74.7 4.4 1.2 Utilities 73.5
Organisation is at least 1 point higher than the sector average Organisation is at least 1 point lower than the sector average
UK Customer Satisfaction Index | July 2021 37Amongst the 20 most improved organisations, Swinton, Southeastern, Hotels.com, Jobcentre Plus, Scottish Water, Halfords, UK Power Networks, TK Maxx, First Group and Utilita have received their highest ever UKCSI scores. Despite the year on year rise in customer satisfaction, only 11 of the 20 most improved organisations received at UKCSI score that is at least point higher than their sector average. Our research suggests that organisations that consistently achieve higher levels of satisfaction than their sector average are more likely to be rewarded by stronger financial performance and customer trust than their peers. 38 UK Customer Satisfaction Index | July 2021
An independent,
objective benchmark of
customer satisfaction

A key purpose of the UKCSI is to provide a consistent benchmark that allows organisations, regulators,
customers and other stakeholders to measure and compare performance within and across sectors. In
this UKCSI, we provide an additional benchmark showing the average customer satisfaction scores for
quartiles of the UKCSI.

July 2021 UKCSI: average scores by quartile of organisations

                                                                                        UKCSI average
                                                                                           (77.4)

      Average of 1st quartile                                                                          81.9

     Average of 2nd quartile                                                                     78.7

      Average of 3rd quartile                                                                   76.2

      Average of 4th quartile                                                            71.2

Customer satisfaction scores for the full range of UKCSI measures by sector and organisation are
available in the 13 sector reports published alongside this report3. Organisations that are Institute
members can also undertake a business benchmarking survey based on the UKCSI questions with a
sample of their customers in order to benchmark performance with an appropriate sector or other
benchmark.

3 See
     www.instituteofcustomerservice.com/ukcsi

                                                       UK Customer Satisfaction Index | July 2021             39
2 Customer satisfaction and business performance, loyalty and reputation 40 UK Customer Satisfaction Index | July 2021
Sales have grown strongly in the Retail (Food) market,
especially for organisations that have a relatively high
proportion of website customer experiences

Kantar reported that UK grocery sales rose by
5.7% in the 12 weeks to 18 April 20214. During
this period, consumer confidence may have been
boosted by the success of the Covid-19 vaccine
rollout, especially amongst older customers.
However, many restrictions remained in place or
were only gradually being eased. From 8 March
schools re-opened. From 29 March gatherings of
6 people or 2 households were permitted and the
formal “stay at home” instruction was removed,
although people were still asked to work from
home and minimise their number of journeys.

Perhaps because of the general upturn in sales
across the sector, there is no clear-cut relationship
between customer satisfaction and sales growth
or market share.

4 See
     www.kantar.com/uki/inspiration/fmcg/2021-wp-shoppers-paint-more-confident-picture-as-wider-retail-reopens

                                                                                  UK Customer Satisfaction Index | July 2021   41
Customer satisfaction and sales growth: the Retail (Food) sector
Retail (Food) July 2021 UKCSI = 80.4
30%
Ocado
25%
Annual sales growth for the 12 weeks to 18 April 2021
20%
Source: Kantar Worldpanel*
15%
10%
ASDA
Morrisons Iceland
Tesco Aldi
Lidl
5% Sainsbury's
Waitrose
0%
Co-op Food
-5%
77 78 79 80 81 82 83 84
UKCSI score
Food retailers with Food retailers with Food retailers with
UKCSI at least 1 point UKCSI within + / - 1 point UKCSI at least
below sector average of sector average 1 point above sector average
7.1% 8.7% 5.8%
*Please note: M & S is the second highest rated food retailer, with a UKCSI score of 82.6, but is not included in Kantar's research on sales growth.
42 UK Customer Satisfaction Index | July 2021All of the food retailers that appear in both the Tesco’s UKCSI score is 81.1, 1.9 points higher
UKCSI and Kantar’s market research, except for than a year ago. This is Tesco’s highest ever score
Co-op Food, grew their sales in the 12 weeks to and the first time it has exceeded the sector
April 2021, compared to the same period in the average since 2008. Its sales grew by 6.4% in
previous year. Kantar suggests that Co-op Food’s the 12 weeks to 18 April 2021.
decline in sales may reflect its conspicuously strong
sales growth for the same period in 2020, as its Sainsbury’s average customer satisfaction
2021 sales are 16.2% higher than the 2019 level. improved year on year by 1.7 points to 80.5, just
above the sector average, 80.4. Kantar reports
Aldi is the highest rated food retailer for that Sainsbury’s sales grew by 6%.
customer satisfaction. Its UKCSI score of 83.3 is
2.9 points above the sector average and its sales Morrisons’ UKCSI score of 77.8 is the same as
increased by 6.6%. in July 2020. It is the lowest rated Retail (Food)
organisation in the July 2021 UKCSI, 2.6 points
Waitrose is the sector’s most improved below the sector average. However, the gap
organisation for customer satisfaction compared between the highest rated organisation (Aldi)
to July 2020. Its UKCSI score increased by 3.7 and the lowest (Morrisons) – 5.5 points – is
points to 81.9 and its sales grew by 5%. relatively small. By comparison, across the 13
UKCSI sectors, the average gap between the
Ocado posted by far the strongest sales growth highest and lowest rated organisations is 14.1
(27.5%) of any Retail (Food) organisation. Its points.
UKCSI score of 79.7 is 1 point higher than in July
2020 but 0.7 points below the sector average.
Asda is the fastest growing of the big four
supermarkets. Its market share for the period
increased to 14.8% thanks to an 8% growth in
sales. Asda’s UKCSI score of 79.0 is 0.8 points
higher than a year ago but 1.4 points below the
sector average.
UK Customer Satisfaction Index | July 2021 43In the Retail (Food) sector, the proportion of in person
or in store experiences fell and the number of online
experiences grew, compared to July 2020
Over 65% of customer experiences were in person, more than any other sector, but 12.2 percentage
points lower than in July 2020. The proportion of experiences conducted on an organisation's website
increased by 7 points to 18.3%.
% customer experiences in the UKCSI on an organisation's website
18.3%
Retail (Food) 11.3%
38.3%
Ocado 42.3%
36.6%
Iceland
21.5%
25.4%
Waitrose
12.6%
25.1%
ASDA
14.4%
23.0%
Sainsbury's
13.7%
19.8%
Tesco 15.9%
17.0%
Morrisons 5.2%
8.3%
M & S (food)
4.4%
5.5%
Aldi
2.7%
4.7%
Lidl
4.5%
4.3%
Co-op Food
1.1%
July 21 July 20
44 UK Customer Satisfaction Index | July 2021Retail (Food) organisations recording a relatively high proportion of website customer experiences in
the UKCSI generated an average sales growth of 10%, compared to 4.2% for those with a lower than
average proportion of customers using their website.
Sales growth by proportion of website customer experiences with organisations in the July
2021 UKCSI
Average sales growth of Retail (Food) organisations Average sales growth of Retail (Food) organisations
with higher than sector average proportion with lower than sector average proportion
of website customer experiences of website customer experiences
10% 4.2%
This evidence suggests that a combination of in store and digital experiences may have helped some
organisations grow sales and market share during the Covid-19 pandemic. Online purchases are
likely to remain a significant feature of the Retail (Food) customer experience. However, as Covid-19
restrictions are eased it is probable that the number of in store customer experiences will grow and that
more people consume food and drink at restaurants, pubs and other outlets. As the Covid-19 trading
environment evolves, food retailers will need to focus on the quality of customer experience the offer in
all relevant channels in order to sustain sales growth.
UK Customer Satisfaction Index | July 2021 45Banks and Building Societies: customer satisfaction in
the context of a reduction current account switches
In this UKCSI we have reviewed data from the latest Current Account Switch Service (CASS) dashboard,
covering switches completing between 1 October and 31 December 2020, alongside the corresponding
UKCSI period (January 2021).
The number of current account switches fell significantly after March 2020 and was much lower during
2020 than in the previous year. Restrictions during the Covid-19 pandemic are likely to be a major cause
of the lower rate of switching. Switching data does not include account switches where the customer’s
old bank account was left open.
Volume of current account switches
April 2019 - March 2020 April 2020 - March 2021
1,017,354 562,016
Source: Current Account Switch Service Dashboard Issue 30
46 UK Customer Satisfaction Index | July 2021Lloyds Bank achieved the greatest number of In the January 2021 UKCSI, Nationwide was
net current account gains, followed by Starling the second highest rated bank for customer
Bank and NatWest. Lloyds Bank’s UKCSI score in satisfaction, after first direct, but its score was
January 2021 (78.2) was just below the sector 2.5 points lower than the previous year.
average, 78.3, but it was 1.6 points higher than
in January 2019. A combination of organisations’ differing
switching strategies and the relatively low
According to Lovemoney’s analysis, incentives number of switches means that the relationship
offered by banks seem to have significantly between customer satisfaction and current
influenced switching behaviour5. Lloyds and account switching is not straightforward.
NatWest are likely to have gained customers
through the switching cash offers they ran Banks or building societies that are listed in
during the reporting period. Starling has the CASS dashboard and whose customer
continued to grow and may have gained satisfaction was at least 1 point better than the
accounts from organisations whose continuity of sector average (Nationwide and Co-operative
service or customer experience has been affected Bank) recorded an average of 4,092 net current
by the pandemic. account losses, compared to an average of 6,414
net losses for those with a UKCSI score at least 1
Nationwide has usually been a leading point below the sector average (HSBC7, TSB, RBS
beneficiary of current account switches but it and Tesco). Organisations whose UKCSI score is
has lost more accounts than it has gained since within 1 point of the sector average recorded an
the third quarter of 2020. Some commentators average of 2,750 net gains, mainly due to the
have pointed to an increase in overdraft rates relatively high number of net gains for Starling
announced in November 2019 as a cause of the Bank, Lloyds and NatWest.
reduction in Nationwide’s net current account
gains. Nationwide reported that having reached
its goal of achieving a 10% share of current
accounts, the organisation decided to pause
switching incentives to focus more on supporting
existing members during the pandemic, rather
than actively seeking new customers6.
5 Lovemoney
www.lovemoney.com/news/43887/the-banks-and-building-societies-were-all-switching-to
6 Nationwide Building Society interim results for the period ended September 2020
7 HSBC includes first direct and Marks & Spencer Bank brand switches
UK Customer Satisfaction Index | July 2021 47Customer satisfaction and current account net gains and losses
Banks & Building Societies average UKCSI January 2021 = 78.3
35,000
30,000 Lloyds
25,000
20,000
Current Account Net Gains / Losses
15,000 Starling Bank
10,000 NatWest
5,000 Bank
RBS of Scotland
0
Tesco The Co-operative Bank
-5,000 HSBC
Barclays Nationwide
-10,000
Halifax
-15,000
Santander
-20,000
TSB
-25,000
72 74 76 78 80 82 84 86
Source: Current Account Switch Service Dashboard Issue 30
Average current account quarterly net gains
Banks & Building Societies with Banks & Building Societies Banks & Building Societies
a UKCSI at least 1 point above with UKCSI within 1 point with a UKCSI at least 1 point
sector average ( +/- ) of sector average below sector average
-4,092 2,750 -6,414
Net current account losses Net current account gains Net current account losses
48 UK Customer Satisfaction Index | July 2021A 9 or 10 out of 10 for customer satisfaction drives
greater loyalty, recommendation and trust
Across the average of all organisations in the UKCSI, achieving a 9 or 10 (out of 10) for customer
satisfaction has a much stronger effect even than an 8 out of 10 in generating the highest levels of trust,
recommendation, loyalty and reputation.
Customers who score Customers who score
an organisation 9 or 10 out of 10 an organisation 8 - 8.9 out of 10
for customer satisfaction for customer satisfaction
Open and transparent
% of customers who give a 9 or 10 rating 94% 38%
Trust
% of customers who give an
organisation a 9 or 10 95% 47%
trust rating
Recommendation
% of customers scoring an organisation 95% 55%
9 or 10 on likelihood to recommend
Loyalty
% of customers scoring an organisation 97% 65%
9 or 10 on intention to remain a customer
Reputation
% of customers who give an organisation a
9 or 10 when asked “how would you rate 85% 35%
the reputation of this organisation”
UK Customer Satisfaction Index | July 2021 493 Customer experience during the COVID-19 crisis In this section, we investigate how customer experience has evolved during the Covid-19 crisis, the extent to which the extent to which customers believe that the customer service they have received has changed during the pandemic, and the key issues customers believe organisations should improve 50 UK Customer Satisfaction Index | July 2021
Overall customer satisfaction was higher for
experiences recorded in spring 2021 than for those in
autumn 2020

The customer data used in the July 2021 UKCSI is                      Evidence from the latest UKCSI data shows that
based on survey fieldwork collected between 14                        average customer satisfaction for experiences
September and 12 October 2020 and between 8                           recorded in March and April 2021 was 78.2 (out
March and 6 April 2021.                                               of 100), 1.6 points higher than those recorded in
                                                                      the previous period (September – October 2020).
Therefore, the latest UKCSI data was collected
after the return of strict lockdown measures in
large parts of the UK from 31 December 2020
and before the re-opening of non-essential retail
on 12 April 2021.

The UKCSI usually focuses on year on year
comparisons and trends in customer satisfaction.
Since the July 2020 UKCSI, we have also reviewed
how customer satisfaction has evolved through
the COVID-19 pandemic by examining data about
customer experiences from the specific time
periods in which the research was conducted.

                                                     Customer responses
                                               that make up the July 2021 UKCSI

                                                      Index scores out of 100

       77.0                                                   76.8                    78.2                77.4
      July 2020
                                  76.6                                            Responses given        July 2021
                                                             Jan 2021
        UKCSI                  Responses                                            8th March -            UKCSI
                                                              UKCSI
                             given 14 Sept -                                        6 April 2021
                               12 Oct 2020

            3-31 August                 12 October           6 January               29 March
                 Eat Out                 Three-tier          England                 in England,
            to Help Out                restrictions          enters third            2 households
                scheme                  introduced           national                or 6 people
                                        in England           lockdown                allowed to
                                                                                     meet indoors.
                      21 September              4 January            8 March         Travel
                    UK Coronavirus            vaccination            Schools         permitted
                     alert upgraded           programme              in England      outside local
                          from level          commences              reopened        area
                              3 to 4

                                                                     UK Customer Satisfaction Index | July 2021      51
The biggest improvement between autumn 2020 and spring 2021 is in the Transport and Tourism sectors The Transport and Tourism sectors show the Although customer satisfaction in the Public biggest improvement in overall customer Services (Local) sector in the July 2021 is 1.6 satisfaction, when comparing data for customer points lower than in July 2020, there is an upturn experiences recorded in March – April 2021 and of 1.9 points for experiences recorded in spring September – October 2020. In the Transport 2021, compared to those in autumn 2020. sector, the improvement was evident across the average scores for airlines, train operating companies and coach / bus operators. Average customer satisfaction with organisations in the Banks and Building Societies, Insurance, Leisure, Public Services, Services and Telecommunications and Media sectors improved by more than 1 point for experiences recorded in March – April 2021, compared to those recorded in September – October 2020. 52 UK Customer Satisfaction Index | July 2021
Customer satisfaction by sector during the Covid-19 crisis: July 2020 – July 2021

                                                             Customer responses
                                                              that make up the
                                                               July 2021 UKCSI

Overall CSI                          July 2020      Responses     Jan 2021       Responses        July 2021         yoy      Change
                                     UKCSI          given         UKCSI          given            UKCSI             change   between
                                                    14 Sept -                    8 March -                                   March / April
                                                    12 Oct                       6 April                                     2020 and
                                                    2020                         2021                                        Sept / Oct
                                                                                                                             2020
                                                                                                                             responses

UK all-sector average                 77.0           76.6          76.8            78.2             77.4             0.4      1.6

Automotive                            78.3           78.8          78.4            79.3             79.1             0.8      0.5

Banks & Building Societies            79.1           77.9          78.3            79.6             78.8             -0.3     1.7

Insurance                             78.6           78.4          78.4            79.6             79.0             0.4      1.2

Leisure                               80.2           80.0          80.1            81.4             80.7             0.5      1.4

Public Services (Local)               75.3           72.7          74.4            74.6             73.7             -1.6     1.9

Public Services (National)            76.1           76.5          76.7            78.2             77.3             1.2      1.7

Retail (Food)                         79.6           80.7          80.0            80.1             80.4             0.8      -0.6

Retail (Non-food)                     80.0           80.9          80.5            81.5             81.2             1.2      0.6

Services                              77.1           76.0          76.6            77.3             76.6             -0.5     1.3

Telecommunications & Media            74.2           74.5          74.3            75.9             75.2             1.0      1.4

Tourism                               78.6           77.3          77.7            80.3             78.8             0.2      3.0

Transport                             71.4           68.8          69.9            74.3             71.5             0.1      5.5

Utilities                             72.6           73.1          72.7            73.9             73.5             0.9      0.8

                  Increase in UKCSI score of at least 1 point		           Drop in UKCSI score of at least 1 point

                                                                    UK Customer Satisfaction Index | July 2021                        53
27% of customers have experienced a change in
customer service during the Covid-19 pandemic. More
than 50% of these customers said the change was
positive; 24% said it was negative
In this UKCSI, we asked customers if they had experienced a change in the service provided by the
organisation for whom they give a customer satisfaction rating. On average, 27.4% of customers say
that they experienced a change in customer service they received from that organisation as a result of
the Covid-19 pandemic. Customers were most likely to say there has been a change in the customer
service they experienced in the Public Services (Local and National) and Transport sectors.
Do you think there has been a change in the customer service you get from xx because of Covid-19?
UK all-sector average 27.4% 54.1% 18.5%
Public Services (Local) 48.1% 38.3% 13.5%
Public Services (National) 36.8% 47.4% 15.7%
Transport 34.5% 44.5% 20.9%
Retail (Food) 30.1% 58.7% 11.3%
Tourism 27.3% 46.7% 26.0%
Automotive 26.4% 52.1% 21.5%
Services 25.5% 56.7% 17.8%
Leisure 24.4% 61.7% 13.9%
Banks & Building Societies 23.3% 56.7% 20.0%
Retail (Non-food) 20.7% 63.5% 15.8%
Telecommunications & Media 20.1% 60.1% 19.7%
Insurance 20.1% 58.1% 21.8%
Utilities 17.9% 59.4% 22.7%
Yes No Don't know
Please note: n/a responses (e.g. didn’t deal with them prior to Covid-19) have been excluded from the percentages shown
Over 50% of customers who said their experience of dealing with an organisation had changed because
of the Covid-19 pandemic said that the change was positive. Just under a quarter (24.4%) said their
experience had changed for the worse. 20.8% felt that the change in customer service they experienced
included a mix of positive and negative aspects.
54 UK Customer Satisfaction Index | July 2021You can also read