Western Bay of Plenty PT Blueprint - Detailed Business Case - Bay of Plenty Regional ...
←
→
Page content transcription
If your browser does not render page correctly, please read the page content below
Report

Western Bay of Plenty PT Blueprint - Detailed
Business Case

Prepared for Bay of Plenty Regional Council

Prepared by Beca Ltd (Beca)

5 September 2017
Western Bay of Plenty PT Blueprint - Detailed Business Case

Revision History
Revision Nº       Prepared By                        Description                                               Date

0                 Andy Lightowler and Craig          Draft for client and peer review                          28 May 2017
                  Richards
1                 Craig Richards                     Revised report. Incorporates client and peer              19 July 2017
                                                     review changes.
2                 Craig Richards                     Final report. Costs and economics updated to              5 September 2017
                                                     reflect timetable development. Changes made
                                                     to address NZ Transport Agency feedback.

Document Acceptance
Action            Name                               Signed                                                    Date

Prepared by       Craig Richards                                                                               04 August 2017

Reviewed by       Andy Lightowler                                                                              19 July 2017

Approved by       Andy Lightowler                                                                              04 August 2017

on behalf of

© Beca 2017 (unless Beca has expressly agreed otherwise with the Client in writing).
This report has been prepared by Beca on the specific instructions of our Client. It is solely for our Client’s use for the
purpose for which it is intended in accordance with the agreed scope of work. Any use or reliance by any person
contrary to the above, to which Beca has not given its prior written consent, is at that person's own risk.

                                                                                                                   Beca // 5 September 2017
                                                                                                        3810659 // NZ1-14408237-12 1.11 // i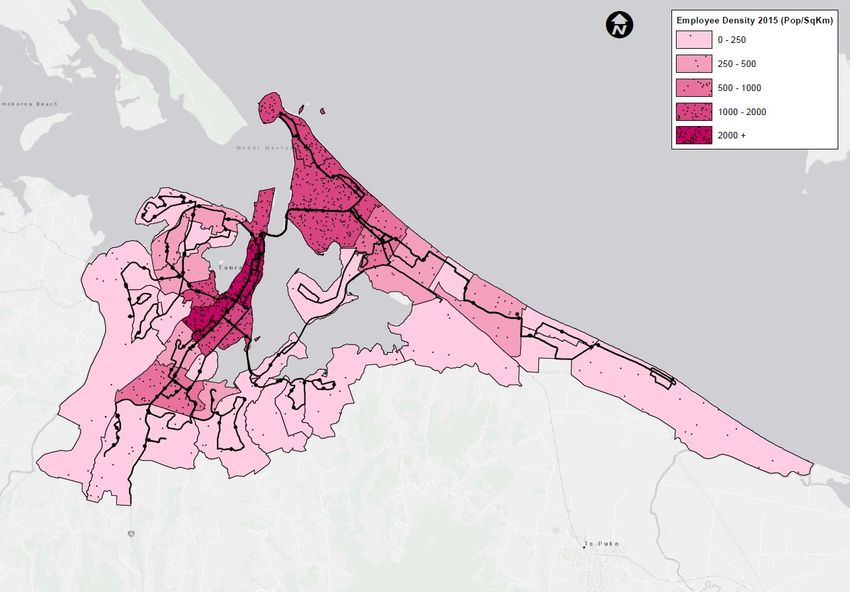
Western Bay of Plenty PT Blueprint - Detailed Business Case

Contents

1   Introduction                                                                                                       6
    1.1   Background                                                                                                   6
    1.2   The Detailed Business Case                                                                                   6
    1.3   Stakeholder and Community Input                                                                              6
    1.4   Report Structure                                                                                             7

2   The Strategic and Programme Case                                                                                   8
    2.1   Strategic Case                                                                                               8
    2.2   Programme Case                                                                                               8
    2.3   Related Projects                                                                                           10

3   Exiting Bus Networks                                                                                            11
    3.1   Network Characteristics                                                                                    11
    3.2   Bus Stops                                                                                                  17
    3.3   Bus Priority                                                                                               17
    3.4   Fares and Fare Box Recovery                                                                                17
    3.5   Demand for Bus Services                                                                                    18
    3.6   Current Bus Network Strengths and Weaknesses                                                               26

4   Future Network Design Principles                                                                                28
    4.1   Bayhopper Network                                                                                          28
    4.2   Schoolhopper Network                                                                                       29

5   Future Land Use, Transport Demand and Road Network Changes                                                      30
    5.1   PBC Programme Measures and Other Complimentary Initiatives                                                 30
    5.2   SmartGrowth Spatial Plan Overview                                                                          31
    5.3   Major Development Areas                                                                                    32
    5.4   Major Residential Growth Plans                                                                             32
    5.5   Commercial Growth Plans                                                                                    35
    5.6   Summary of the Main Land Use Changes Expected to Impact on the Future Bus Network                          36
    5.7   Changes in Future Travel Demand                                                                            36
    5.8   Road Network Changes                                                                                       37

6   Alternatives and Option Development                                                                             40
    6.1   Bayhopper Network Design Initial Options                                                                   40
    6.2   Shortlist of Network Design Variations                                                                     43
    6.3   Schoolhopper Service Changes                                                                               47
    6.4   Regional Commuter/Shopper Service Changes                                                                  49

7   Assessment of the Network Design Options                                                                        49
    7.1   Operating Costs                                                                                            49

                                                                                                 Beca // 5 September 2017
                                                                                      3810659 // NZ1-14408237-12 1.11 // i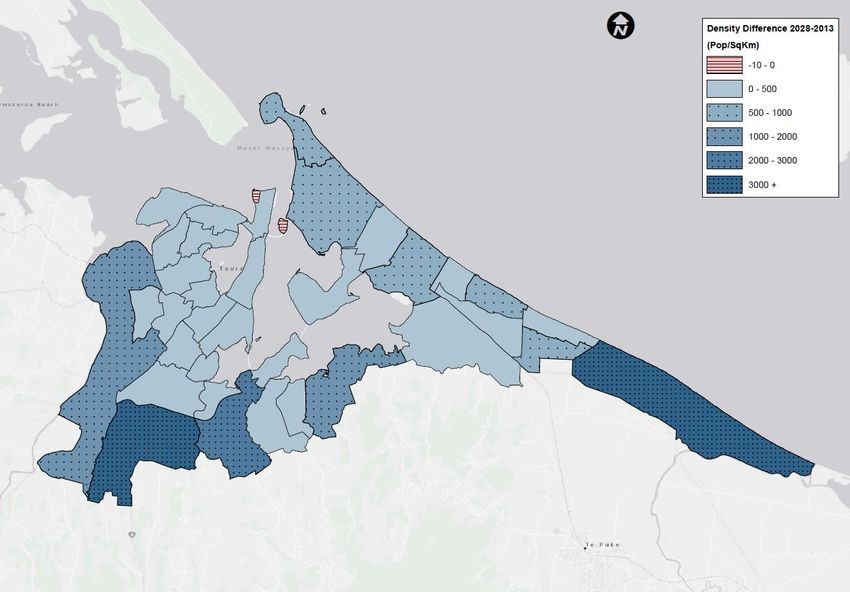
Western Bay of Plenty PT Blueprint - Detailed Business Case

    7.2   Demand and Revenue Impacts                                                                                  50
    7.3   Fare Box Recovery                                                                                           51
    7.4   Summary                                                                                                     51
    7.5   Multi Criteria Analysis                                                                                     52

8   Engagement on Proposed Network                                                                                   54
    8.1   Initial Engagement                                                                                          54

9   Network Changes Due to Public Feedback                                                                           55
    9.1   Public Bus Network                                                                                          55
    9.2   Gold Line Service                                                                                           55
    9.3   Crosstown Connector Diversion                                                                               55
    9.4   SchoolHopper Network Changes                                                                                56
    9.5   Final Network and Service Frequencies                                                                       56

10 Economic Case                                                                                                     57
    10.1 Evaluation Methodology                                                                                       57
    10.2 Costs                                                                                                        59
    10.3 Benefits                                                                                                     60

11 Assessment Profile                                                                                                67
12 Investment Objectives                                                                                             68
13 Financial Case                                                                                                    68
14 Commercial Analysis                                                                                               70
    14.1 Public Transport Operating Model Unit Structure                                                              70
    14.2 Implementation and Review Strategy                                                                           71
    14.3 Risk Assessment                                                                                              72

15 Delivery Framework                                                                                                73
    15.1 Funding                                                                                                      73
    15.2 Consultation                                                                                                 73
    15.3 Procurement Strategy                                                                                         73
    15.4 Management                                                                                                   74

16 Next Steps                                                                                                        74

Appendices
Appendix A
    Existing Schoolhopper Routes

Appendix B
    Public Consultation Report

                                                                                                 Beca // 5 September 2017
                                                                                      3810659 // NZ1-14408237-12 1.11 // ii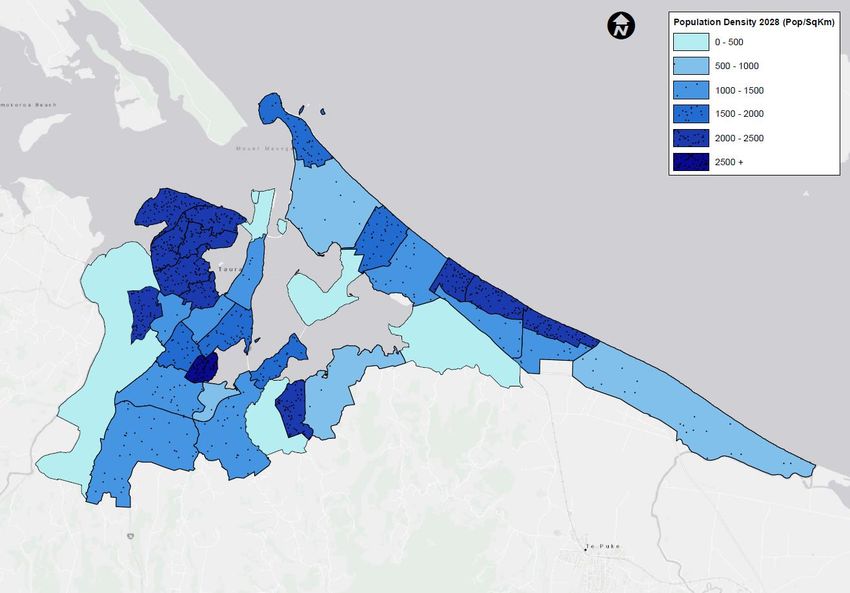
Western Bay of Plenty PT Blueprint - Detailed Business Case

Appendix C
  Final Public Bus Route Maps

                                                                       Beca // 5 September 2017
                                                           3810659 // NZ1-14408237-12 1.11 // iii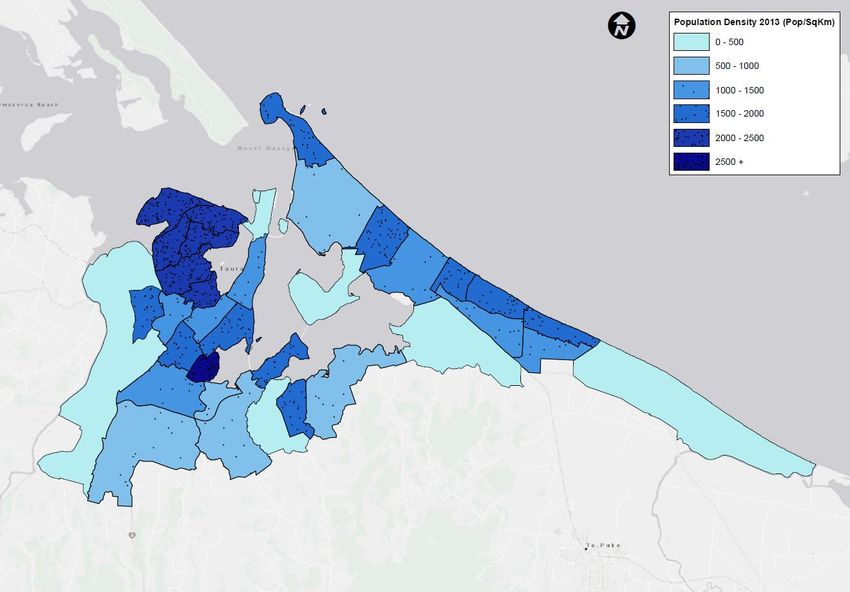
Western Bay of Plenty PT Blueprint - Detailed Business Case

Executive Summary
This Detailed Business Case (DBC) has been prepared by Beca Ltd on behalf of the Bay of Plenty
Regional Council (BoPRC) to support additional investment in public and school bus services in the
Tauranga City and Western Bay of Plenty region. The DBC follows a Programme Business Case
(PBC) and Strategic Business Case (SBC) process.

The SBC identified a number of problems in regard to public transport (PT) provision in this region
and the benefits that increased investment in PT could bring. The PBC investigated the problem
and benefit statements further and developed SMART investment objectives that if met will realise
the benefits identified in the SBC. From a long list of potential programmes a short list of three
possible programme interventions was defined in the PBC. Following a robust evaluation the
preferred programme was identified. The programme includes bus network improvement,
infrastructure and promotional measures. This DBC develops the bus network component of the
preferred programme from the PBC.

The DBC further evaluates the existing public and school bus services to inform the development of
potential improvements. Many existing public routes are circuitous with less than desirable
frequencies for commuter services, high variability of travel times and operating hours that do not
deliver a realistic transportation alternative to private cars. The school bus network follows public
bus routes in many places. Growth areas are currently not well served by public transport and new
routes or route extensions are necessary to serve these areas.

A short list of possible bus network options was developed through a series of workshops involving
stakeholders at Tauranga City Council and the New Zealand Transport Agency. The shortlisted
options are higher frequency and lower frequency variations on a bus network similar to existing but
with some new and more direct services. The preferred option was defined through a Multi Criteria
Assessment that evaluated the short list options against investment objectives, design principles,
implamentability and possible effects measures.

The recommended option is a higher frequency option with a new ‘City Loop’ service routing
between the CBD, Mount Maunganui and Bayfair. Papamoa routes will terminate at Bayfair and
passengers will connect with the City Loop to either the CBD or Mount Maunganui. A new Cross
Town Connector service will operate between Bayfair and Tauriko. Express bus services will
operate in peak periods between Papamoa East and the CBD and Tauriko and the CBD. Regional
services to Te Puke, Katikati and Omokoroa have increased frequencies and minor route changes.
Changes to School bus services will be made where public bus services can provide an acceptable
alternative transport service.

The recommended option was presented to the public and stakeholders through a public
consultation exercise which received a high number of responses, with the majority in support of the
new network but some areas of concern and suggestions for improvements. A number of changes
were made to the recommended option and the approach to school bus provision following the
public consultation. Final route maps are provided in Appendix C and the final timetable is provided
on page 54.

The recommended bus service arrived at following public consultation has an estimated annual
operating cost of $18.5M (public bus and school bus combined). This is an increase of $6M above
the existing annual cost and it is this funding gap that the DBC seeks approval for. The additional
cost will be split between the Regional Council and NZ Transport Agency at an additional annual
cost of approximately $3M each.

                                                                                                Beca // 5 September 2017
                                                                                    3810659 // NZ1-14408237-12 1.11 // 4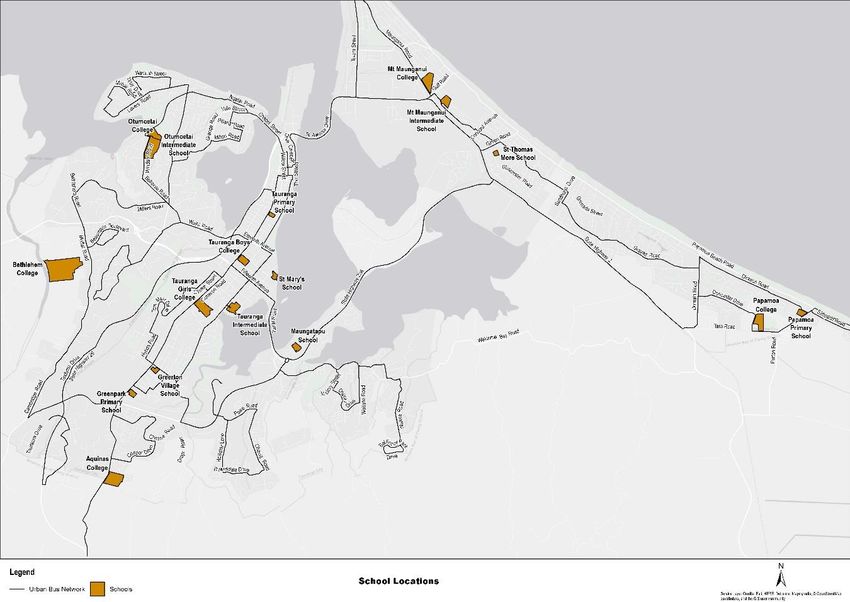
Western Bay of Plenty PT Blueprint - Detailed Business Case

An economic and commercial evaluation of the recommended option has been carried out and
identifies the Benefit Cost Ratio of the option to be 3.3. The Strategic Fit and Effectiveness of the
programme are both rated as High. Therefore the assessment profile is H/H/M.

Risks of the option are categorised as either financial (Operator cost higher than expected, fuel
price impacts, ect) or perception (negative feedback from users). The BoPRC can monitor the
likelihood and impact of these risks eventuating over time through ticket sales, revenue, user
feedback and surveys etc. If the impact of the risks eventuating warrants changes to bus services at
the time this can be considered and implemented by the BoPRC in consultation with the NZ
Transport Agency.

Once approved the changes recommended in this DBC will be implemented by the BoPRC during
2018 following a service tender process with bus operators.

                                                                                                  Beca // 5 September 2017
                                                                                      3810659 // NZ1-14408237-12 1.11 // 5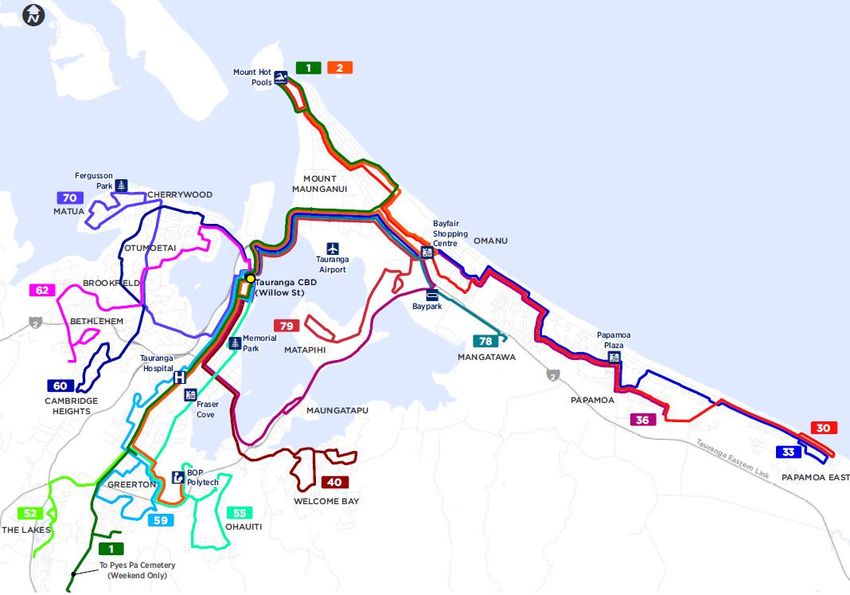
Western Bay of Plenty PT Blueprint - Detailed Business Case

1     Introduction

1.1 Background
The Bay of Plenty Regional Council (BoPRC) contracts three separate bus networks in the
Tauranga City and Western Bay of Plenty (Western Bay) region: Tauranga urban (Bayhopper),
school (Schoolhopper) and intra-regional services. These contracts are due for renewal by early
2018. This provides an opportunity to re-examine public transport in the Western Bay from first
principles and look at the bus network as a whole, identifying opportunities to improve the efficiency
of the transport network and to re-examine the role that bus services perform in the Western Bay.

Prior to tendering new bus service contracts, a Business Case process has been followed to identify
a range of possible alternatives and the most beneficial option for public transport investment in
Tauranga and the Western Bay over the next ten years. As a first step towards this, a Strategic
Case for change (termed the Western Bay Public Transport Blueprint) was completed in February
2016. This is a joint New Zealand Transport Agency (NZ Transport Agency), Tauranga City Council
(TCC), Western Bay of Plenty District Council (WBoPDC) and BoPRC (the project partners) ten-
year programme for investment.

Following endorsement of the Strategic Case by the participating organisations, a Programme
Business Case (PBC) was completed by Beca Limited (Beca) for the BoPRC in February 2017.
This developed the strategic context, confirmed the need for investment, developed the programme
of investment and outlined the financial case and delivery mechanism for investment in public
transport services and associated capital improvement in the Tauranga City and Western Bay
region in the next ten years. The PBC was informed by regular engagement with the project
partners.

1.2 The Detailed Business Case
This Detailed Business Case (DBC) has been prepared to identify and evaluate network design
options for the Bayhopper and Schoolhopper services and inter-regional services based on the
recommended Programme in the PBC, and to define the preferred indicative network design in
detail (recommended routes, interchange points and service frequencies). It was proposed in the
original business case proposal that this stage would be called an Activity Business Case, however
recently it was agreed that this should be appropriately renamed as the joint single stage Indicative /
Detailed Business Case.

The main purpose of the DBC is to provide evidence that the preferred option provides the best
feasible solution, that it will deliver the outcomes identified in the Strategic Case and is affordable.

The DBC supports a funding application to the NZ Transport Agency to fund a share of the costs of
implementing the recommended programme. Following fare recovery, the remaining operating cost
will be shared between the BoPRC and the NZ Transport Agency in accordance with the agreed
Funding Assistance Rate (FAR).

1.3 Stakeholder and Community Input
As a means of assessing the suitability of the bus network to adequately service future changes in
population, employment, land use and travel patterns, an initial network design workshop was held
on Tuesday 14 February 2017 and a second workshop was help on Monday 27 March 2017. The
two workshops were attended by transport planners from each project partner organisation.

                                                                                                   Beca // 5 September 2017
                                                                                       3810659 // NZ1-14408237-12 1.11 // 6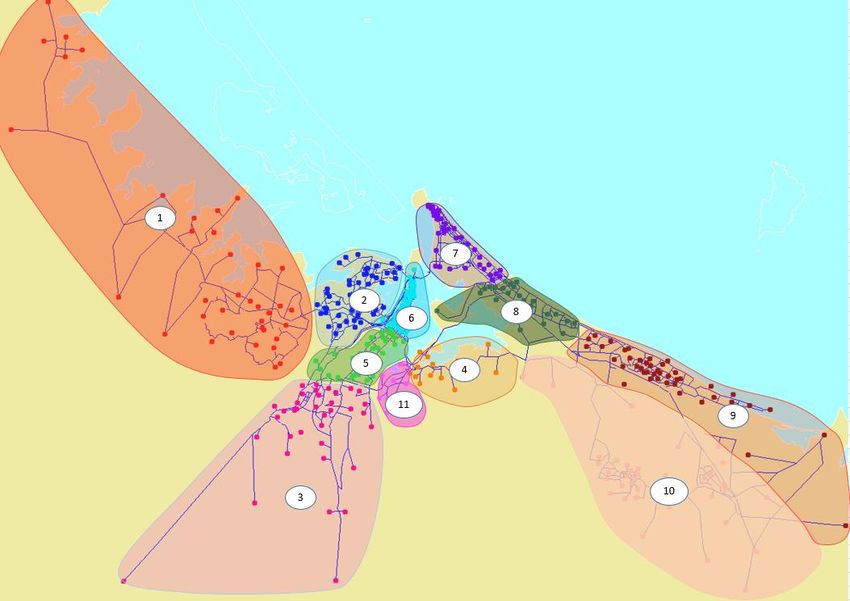
Western Bay of Plenty PT Blueprint - Detailed Business Case
The purpose of the first workshop was to identify gaps and network deficiencies within the current
service structure and to identify areas and opportunities for improvement. The purpose of the
second workshop was to confirm the recommendations for changes to the network design.
Two workshop were also held by the BoPRC with bus operators in 2016 to receive feedback from
operators on any issues and opportunities they may perceive with the existing network structure.
This feedback has also informed the DBC.
Public consultation was carried out on possible public and school bus changes in May 2017.
Feedback received through this consultation process has informed the final network designs
recommended in the DBC.
1.4 Report Structure
This DBC generally follows the recommended structure in NZ Transport Agency guidance with
modification to suit the nature of this project. This DBC is structured as follows:
1.4.1 Part A: The Case for the Project
Section 2 briefly summarises the key aspects of the Strategic Case and PBC relevant to the
indicative network design
Section 3 briefly describes the main characteristics of the current bus networks
Section 4 summarises the draft bus network design rules that have been developed by the
BoPRC to inform the network design process
Section 5 outlines future land use and transport network changes that will impact on the network
design, and considers the ability of the existing bus network to adequately serve this future
growth
Section 6 describes the alternative network design options considered during the DBC
development and a shortlist of network variations consistent with the preferred programme
identified in the PBC
Section 7 assesses the shortlist network variations against investment objectives, service design
principles and other relevant criteria through a Multi Criteria Analysis (MCA), and recommends a
preferred network design
Section 8 outlines the recommended option assessment including economic analysis,
implementability, wider project impacts and the financial case.
1.4.2 Part B: Readiness and Assurance
Section 9 provides the commercial analysis including a range of potential Public Transport
Operating Model (PTOM) unit breakdown structures that could be adopted to procure future bus
service contracts along with the implementation strategy and risk assessment
Section 10 outlines the delivery framework for implementation of the recommended option
including consultation, funding, procurement strategy, management and review processes
Section 11 summarises the findings of the DBC, and outlines how the recommended network
design can be implemented.
Beca // 5 September 2017
3810659 // NZ1-14408237-12 1.11 // 7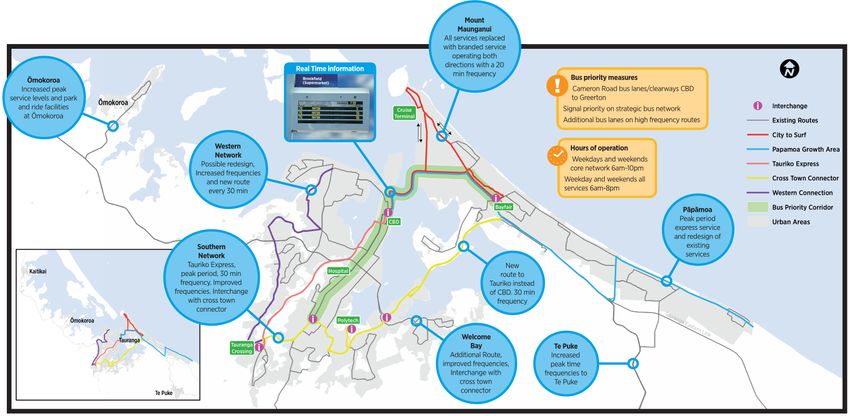
Western Bay of Plenty PT Blueprint - Detailed Business Case
PART A – PROBLEM AND OPPORUNITIES
2 The Strategic and Programme Case
2.1 Strategic Case
The Western Bay Public Transport Blueprint (Strategic Case) identified the problems facing the
Western Bay’s public transport service, and the benefits that can be gained from investing to solve
these problems. It contained an assessment of how the Blueprint fits within the organisational
values for each of the partner organisations and the fit with the NZ Transport Agency’s Investment
Framework. It also set out the project plan and funding requirements for this project to progress to
the PBC development stage.
The following key problems and weightings were identified and agreed with stakeholders:
The current urban land form and topography makes it difficult to support a more effective and
efficient public transport system across the whole network (35%)
The focus on access to public transport services across the sub-region may mean that public
transport is not being best utilised as a competitive alternative mode to private cars (50%)
The traditional way the benefits of public transport are demonstrated has led to policies, plans
and decisions amongst stakeholders that do not fully support the role of public transport in the
integrated transport network (15%).
The benefits of investing to address these problems were also identified. Three investment benefits
were identified:
Potential to utilise the existing bus network to achieve better transport outcomes within the same
or similar funding envelopes and physical footprint (i.e. improved optimisation of the transport
network) (55%)
Improving the options that are available to people for making trips by public transport giving them
more choice as to how and when they wish to travel (i.e. improved travel choice) (25%)
Potential to better plan and align transport investment to achieving better transport outcomes
(i.e. greater alignment of planning and investment) (20%).
There has been no significant change in the transport environment of Tauranga since the Strategic
Case was prepared, if anything congestion has worsened and the potential value of the benefits has
increased as discussed in the Programme Case section below. The problems and benefits of the
Strategic Case therefore remain valid.
2.2 Programme Case
The PBC established that the Strategic Context set out in the Strategic Case is still relevant and
provided additional evidence that the problem statements formulated in the Strategic Case are
valid.
The PBC found that population growth in Tauranga and the Western Bay has accelerated in recent
years with corresponding growth in traffic volumes and a resulting decrease in average travel
speeds, indicating that congestion is worsening. There are high travel demands to and from the
Tauranga CBD and whilst many bus routes stop in the CBD the uptake in bus travel is low. Bus
Beca // 5 September 2017
3810659 // NZ1-14408237-12 1.11 // 8Western Bay of Plenty PT Blueprint - Detailed Business Case
journey times are long and variable on many routes. From this evidence the PBC concludes that
there is a clear case for additional investment in PT services and infrastructure to attract more
people to travel by bus, which will improve the efficiency of the road network.
A long list of possible programme options was formulated and evaluated by the lead stakeholder
group in the PBC using a MCA. From this, a short-list of three preferred programmes was identified,
namely:
High Performance Plus: focus on improving services and infrastructure in Tauranga City with
high frequencies on key Bayhopper bus routes and express buses to growth areas, e.g.
Papamoa East and Tauriko, possibly supported by bus priority on the main corridors. Minor
improvements to services and facilities in regional areas such as Ōmokoroa and Te Puke.
Growth Enabler: focus on improving services to new growth areas in Tauranga and the Western
Bay. This option would deliver frequent bus services to regional areas such as Katikati,
Ōmokoroa and Te Puke, possibly supported by new or improved park and ride facilities. Less
emphasis on high frequency services and improved infrastructure in the CBD.
Balanced Plus: provide some high frequency services in the City balanced with increased levels
of service to regional areas such as Katikati, Ōmokoroa and Te Puke. Infrastructure investment
is balanced between Bayhopper and regional network improvements.
The three shortlisted programmes were evaluated in the PBC using the NZ Transport Agency’s
multi-criteria evaluation tables. This evaluation concluded that the High Performance Plus (HPP)
programme performs better than the two alternative options against most of the investment
objectives, it has a high strategic fit and a higher economic benefit cost ratio (BCR) than the
alternative options. As such the HPP programme was recommended.
Figure 2.1 shows the key network changes under the recommended programme.
Figure 2-1: Key Initiatives within Recommended Programme
The recommended programme focusses investment in the Tauranga urban area where there is a
higher customer base and avoids higher costs associated with increasing service to regional
centres. The programme includes new bus routes and changes to existing routes that will reduce
journey times and make bus travel a more attractive option. New routes will include a high
frequency ‘city loop’ (i.e. Hospital - CBC - Mount Maunganui - Bayfair two-way circuit), western and
Beca // 5 September 2017
3810659 // NZ1-14408237-12 1.11 // 9Western Bay of Plenty PT Blueprint - Detailed Business Case
eastern orbital/connector services and express buses between the City and Papamoa East and
Tauriko.
The programme includes the following infrastructure measures:
Bus priority on Cameron Road
New or upgraded interchange facilities at key nodes
Improvements to high use bus stops, e.g. better facilities at the stop and on pedestrian access
routes
Improved park and ride facilities at Ōmokoroa.
In addition the programme includes changes to Schoolhopper bus routes where Bayhopper
services can provide an adequate service, investigating zone ticket pricing, and upgrades that have
already been committed such as real time information, Wi-fi on buses, and ticketing upgrades.
The key risks to the programme identified were financial uncertainty and negative stakeholder
reaction to the changes. Changes to the network may mean that some existing passengers are
disadvantaged, and the increased use of urban services by school children may not be popular to
some peak period bus users. It was also noted that the actual passenger uptake may not be as high
as anticipated, resulting in less revenue than expected, and that the costs assumed may be higher
than anticipated.
The PBC was adopted by the BoPRC’s Public Transport Committee on 17 February 2017. It was
noted by the Transport Committee that this does not at this stage represent a financial commitment
by the BoPRC above that in the approved Long Term Plan, but does provide strategic guidance on
future financial decisions.
This DBC develops the network design component of the recommended programme in the PBC
including routes, frequencies and costs for bus service provision. Other initiatives in the
recommended programme of the PBC such as bus priority measures and infrastructure
improvements will be subject to specific DBC’s for each activity as necessary but are referred to as
complementary measures in this DBC.
2.3 Related Projects
The PT Blueprint work is one of a number of transportation strategies and work streams currently
being progressed in the region, other complementary projects include Network Operating Plans 1
(NOP) for Tauranga City and the Tauranga Programme Business Case. The following diagram
shows the key interrelated programmes and their respective planning horizons.
1
A Network Operating Plan is a multimodal transport strategy that seeks to improve level of service
where deficiencies exist depending on an agreed mode hierarchy by location and time of day.
Beca // 5 September 2017
3810659 // NZ1-14408237-12 1.11 // 10Western Bay of Plenty PT Blueprint - Detailed Business Case
Figure 2-2: Complementary Programmes
3 Exiting Bus Networks
This section briefly summarises the broad structure of the current bus network and the current use,
strengths and weaknesses. It also considers the ability of the existing bus network to serve the
needs of the City’s future growth.
3.1 Network Characteristics
3.1.1 Urban Services
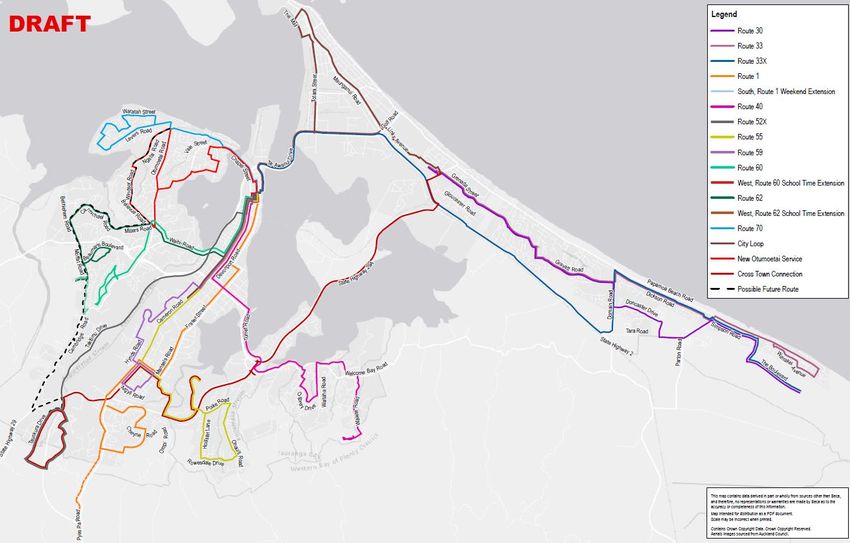
The current Bayhopper network is shown on Figure 3-1 and summarised in Table 3-1. Key
characteristics of the network are:
12 main routes
All 12 routes apart from one (route 30) serve the CBC
Route 30 operates between Papamoa and Mt Maunganui via Bayfair
Beca // 5 September 2017
3810659 // NZ1-14408237-12 1.11 // 11Western Bay of Plenty PT Blueprint - Detailed Business Case
Route 52 operates between Greerton and The Lakes in the off-peak period, but provides a CBD
express service in peak periods
Two routes are cross-city (routes 1 and 2)
Buses run seven days a week and on all public holidays except Christmas Day and Good Friday
The majority of routes operate with a 30 minute frequency on Mondays to Fridays and an hourly
weekend frequency, some routes operate additional peak period services
Routes 30, 52 and 59 operate hourly all week
Two other routes only operate on two days of the week (routes 78 and 79 between the CBD and
Mangatawa and Matapihi respectively) - both of these routes are served by two journeys per day
Go Bus Transport Limited (“Go Bus”) operates all Bayhopper services.
Figure 3-1: Existing Bayhopper Network
Table 3-1: Existing Bayhopper Services
Route Description Weekday Frequency Weekend
Frequency
1 Pyes Pa – Greerton – City – Mount Maunganui 30 minutes 1 hour
2 Windermere – Greerton – City– Bayfair – Mount 30 minutes (plus 1 hour
Maunganui additional peak service)
30 Papamoa – Bayfair – Mount Maunganui 1 hour 1 hour
33 City – Bayfair – Papamoa 30 minutes (plus 1 hour
Beca // 5 September 2017
3810659 // NZ1-14408237-12 1.11 // 12Western Bay of Plenty PT Blueprint - Detailed Business Case
Route Description Weekday Frequency Weekend
Frequency
additional peak services)
36 City – Maungatapu – Bayfair – Papamoa 30 minutes 1 hour
40 City – 15th Ave – Welcome Bay 30 minutes 1 hour
52 Greerton – The Lakes 30 minutes 1 hour
55 City – Fraser Street – Greerton – Windermere – Ohauiti 30 minutes 1 hour
59 City – Sunvale – Greerton – Oropi 1 hour 1 hour
60 City – Bellevue – Brookfield – Cambridge Heights 30 minutes 1 hour
62 City – Pillans Point – Brookfield – Bethlehem 30 minutes 1 hour
70 City – Brookfield – Cherrywood – Matua 30 minutes 1 hour
78 City – Mangatawa n/a n/a
79 City - Matapihi n/a n/a
Bayhopper services are operated with a mixture of vehicles with seating capacities ranging between
29 and 40. The contracted minimum fleet sizes required to be operated are summarised in Table 3-
2.
Table 3-2: Contracted Minimum Seating Capacities by Route (Bayhopper)
Route Minimum Seating Capacity Contracted
1 35
2 35
30 40
33 40
36 40
40 29
52 29
55 29
59 29
60 29
62 29
70 35
Assessment of the existing public bus service in the PBC concluded that many existing routes are
circuitous with less than desirable frequencies for commuter services, high variability of travel times
and operating hours that do not deliver a realistic transportation alternative to private cars for many
travellers.
3.1.2 Schoolhopper Network
There are currently 46 Schoolhopper routes operating in the Western Bay area serving the following
17 schools and colleges, as shown in Figure 3-2:
Beca // 5 September 2017
3810659 // NZ1-14408237-12 1.11 // 13Western Bay of Plenty PT Blueprint - Detailed Business Case
Aquinas College
Bethlehem College
Greenpark School
Greerton School
Maungatapu Primary
Mount Maunganui Intermediate
Mount Maunganui College
Otumoetai College
Otumoetai Intermediate
Papamoa Primary School
Papamoa College
St Mary School
St Thomas Moore School
Tauranga Boys College
Tauranga Girls College
Tauranga Intermediate
Tauranga Primary.
Beca // 5 September 2017
3810659 // NZ1-14408237-12 1.11 // 14Western Bay of Plenty PT Blueprint - Detailed Business Case
Figure 3-2: Location of Schools Served by Schoolhopper Buses
Beca // 5 September 2017
3810659 // NZ1-14408237-12 1.11 // 15Western Bay of Plenty PT Blueprint - Detailed Business Case
Some Schoolhopper routes only operate in the AM or PM peak, not both.
The following Schoolhopper routes do double runs (i.e. the vehicle operating the service also
operates another route) in both the morning (AM) and evening (PM) periods, unless otherwise
stated below:
406
407
408 (PM peak only)
410 (PM peak only)
412
413
517 (PM peak only)
518
657.
Maps of the existing school bus routes for each school are provided in Appendix A. The maps
show that most of the school bus routes overlap public bus routes, whilst this indicates that the
public bus service may provide an acceptable alternative in places there are a number of other
issues such as capacity on the bus, timetables and possible interchange to consider in regard to
schoolhopper bus planning. This will be explored further in Chapter 6.
The number of school bus routes operated has reduced significantly since 2015, when the Ministry
of Education (MoE) withdrew funding for the majority of the school bus network as a result of a
change to its School Transport Assistance policy.
3.1.3 Regional Commuter/Shopper Services
The Western Bay is also served by regional commuter (i.e. Monday to Friday AM and PM peak
periods only) and regional shopper (Monday to Friday or Monday to Saturday inter-peak only)
services that connect through to key locations in Tauranga. The routes operated are summarised in
Table 3.3.
Table 3-3: Regional Commuter/Shopper Services
Route Description Service Type Weekday Frequency Weekend Frequency
80 Katikati – Tauranga Commuter 3 services per day No service
81 Ōmokoroa – Tauranga Commuter 2 services per day No service
82 Waihi Beach – Katikati Shopper 2 services per day 2 services (Saturdays
– Tauranga (Tuesdays and Thursdays Only)
only)
82a Waihi Beach – Katikati Shopper Fridays only No service
– Tauranga (trial
service)
221 Te Puke – Tauranga Commuter 3 services per day No service
222 Te Puke – Tauranga Shopper 2 services per day No service
(Wednesdays and Fridays
only)
222a Maketu – Bayfair (trial Shopper 1 service per day No service
Beca // 5 September 2017
3810659 // NZ1-14408237-12 1.11 // 16Western Bay of Plenty PT Blueprint - Detailed Business Case
Route Description Service Type Weekday Frequency Weekend Frequency
service) (Wednesdays and Fridays
only)
3.2 Bus Stops
There are over 500 bus stops in Tauranga, some of which have shelters. In the TCC area there are
two types of bus shelter provided, one is the TCC bus shelter and the other is an Adshel bus shelter
which is managed privately as advertising space.
3.3 Bus Priority
The only bus priority measures which currently exist in Tauranga are bus lanes on Hewletts Road
between Maunganui Road and Totara Street (in both directions of travel). The PBC identified bus
priority on Cameron Road as a component of the recommended programme to be investigated
further and delivered by TCC following an activity specific business case / design and
implementation process.
3.4 Fares and Fare Box Recovery
The following fares currently apply to urban and school services. Fares were increased in March
2017 and generally increase annually at or close to the rate of inflation.
$3.40 cash ($2.72 with a Smartride card)
$7.80 daysaver
Free off-peak travel for NZ Supergold card holders
School students travel for $2.00 ($1.60 with a Smartcard).
Free transfer is permitted to another route within 60 minutes of the passenger boarding the bus.
The cost of fares for regional services, e.g. Katikati, Omokoroa, Te Puke vary depending on the
length of journey between $3.60 and $8.80 (Katikati) or $10.50 (Waihi Beach).
The PBC found that the cost of a two way bus fare in Tauranga is typically more than the cost of
parking in Tauranga City but TCC have recently increased parking costs in the CBD and parking
charges are now more in line with the costs of bus travel.
The fare box recovery for bus services in the Tauranga area in 2015/16 was:
Bayhopper services - 29.3%
Schoolhopper services - 24.6%
Matapihi-Tauranga service - 4.6%
Mangatawa-Tauranga service - 2.7%
Te Puke – 25%
Katikati / Omokoroa – 34%.
The fare box recovery for the whole of the Bay of Plenty region is around 32% (compared to a
target of 35% stated in the Bay of Plenty Regional Public Transport Plan). The PBC set a target fare
recovery of 45% to be achieved by 2026. Increasing revenue whilst reducing costs will be
necessary to achieve this.
Beca // 5 September 2017
3810659 // NZ1-14408237-12 1.11 // 17Western Bay of Plenty PT Blueprint - Detailed Business Case
3.5 Demand for Bus Services
3.5.1 Bus Patronage, Mode Share and Demographics
Approximately 1.86 million trips are currently made on the Bayhopper network every year.
Patronage grew strongly (more than 15% per annum) between 2006 and 2010. Average patronage
growth for the past ten years is approximately 3% per annum.
The bus mode share for journey to work in Tauranga is around 2% which is less than a quarter of
the national mode share, although bus mode share is higher, around 5 or 6%, for journeys to the
CBD during the AM peak period. Increasing the bus mode share towards the national average
would take a significant number of (potentially longer) trips off the Arterial road network.
The following figures show PT mode share from the 2013 Census for travel between the zones
identified in the figure.
Figure 3-3: Census Travel Zones and Percent PT Mode Share (table)
Beca // 5 September 2017
3810659 // NZ1-14408237-12 1.11 // 18Western Bay of Plenty PT Blueprint - Detailed Business Case
Unsurprisingly the highest PT mode shares occur to and from zones 5 and 6 which are the central
Greerton to Harbour Bridge areas. Also unsurprisingly the to/from matrices are higher where bus
reasonably practical services exist, for example there is no bus travel from Papamoa to zone 11
(Bay Polytech) which is likely to be influenced by the lack of bus service connecting these locations.
Filling such voids will be important for the route design going forward to increase mode shift.
Typically users of public transport are not biased towards low incomes any more than the
demographics of the community as a whole. 68% of public transport users in Tauranga have access
to a private car all of the time and a further 15% have access some of the time (Tauranga Bus User
Survey).
3.5.2 Demand by Bayhopper Route
Boarding data by route for Bayhopper and Schoolhopper services was obtained from the BoPRC for
the months of April 2016 and May 2016 along with annual 2015 to 2016 data.
At this time only the location of passenger boarding and the type of ticket sold is obtainable through
existing ticketing systems. Without passenger ‘tag off’ data it is not possible to accurately determine
passenger destinations or length / travel time of journeys.
Figure 3-3 shows the level of demand (two-way) by bus route for the one year period between 1
May 2015 and 30 April 2016. Of the urban services, route 2 (Bay Polytech – CBD – Mount
Maunganui) has the highest passenger use with over 290,000 annual passenger boardings. Route
1 (Pyes Pa – Greerton – CBD – Mount Maunganui) and Route 33 (CBD – Bayfair – Papamoa) have
the next highest levels of use, both attracting over 200,000 annual boardings. Routes 36, 55, 70, 40
and 60 all have between 100,000 and 150,000 annual passenger boardings.
Figure 3-4: Passenger Demands by Bus Route (Bayhopper Services)
3.5.3 Distribution of Demand for Bayhopper Services
Figures 3-4 to 3-8 inclusive show the current distribution of boarding demand (ticket sale by
location) for Bayhopper services for adult, child, tertiary student, Supergold and all ticket purchases
respectively in the Monday to Friday AM peak period (07.00-09.00 hours).
Beca // 5 September 2017
3810659 // NZ1-14408237-12 1.11 // 19Western Bay of Plenty PT Blueprint - Detailed Business Case
Figure 3-5: Adult Ticket Boarding Demand
Figure 3-6: Child Ticket Boarding Demand
Beca // 5 September 2017
3810659 // NZ1-14408237-12 1.11 // 20Western Bay of Plenty PT Blueprint - Detailed Business Case
Figure 3-7: Student Ticket Boarding Demand
Figure 3-8: Supergold Ticket Boarding Demand
Beca // 5 September 2017
3810659 // NZ1-14408237-12 1.11 // 21Western Bay of Plenty PT Blueprint - Detailed Business Case
Figure 3-9: All Ticket Boarding Demand
The route demand and ticket sale data confirms the key corridors and origins of passenger demand
being Cameron Road, Maunganui Road, CBD, Bayfair, Greerton and Bay Polytech.
3.5.4 Demand by Time of Day and Day of Week (Bayhopper Services)
Approximately 20% of all weekday boarding’s occur during the AM peak period of 7am to 9am. This
proportion is lower in the PM peak of 4pm to 6pm (approximately 15%), which is likely to be
influenced by higher school pupil boarding’s during the AM than the PM (many after school trips
would occur between 3pm and 4pm).
Approximately 86% of all Bayhopper journeys occur on weekdays (14% occur on weekends / Public
Holidays). Weekend use of buses is significantly lower than would be expected, e.g. total travel
demands are not \ significantly lower in weekends than weekdays and travellers tend to be less time
constrained in weekends so PT should be a reasonable alternative. Low weekend usage may be
influenced by lower frequencies of service in weekends offering a less useful service. Increasing
weekend use presents an opportunity to increase revenue without significant increases in cost, as
peak bus demand is driven by the number of buses required to serve weekday demands.
3.5.5 Distribution of Demand for Bayhopper Services
Figure 3.9 to Figure 3.11 inclusive show the current distribution of boarding demand for Bayhopper
services for all ticket purchases respectively in the AM peak period (07.00-09.00 hours) on
Mondays to Fridays (Figure 3-9), Saturdays (Figure 3-10) and Sundays (Figure 3-11).
Beca // 5 September 2017
3810659 // NZ1-14408237-12 1.11 // 22Western Bay of Plenty PT Blueprint - Detailed Business Case
Figure 3-10: AM Peak Weekday Ticket Boarding Demand
Figure 3-11: Saturday Boarding Demand
Beca // 5 September 2017
3810659 // NZ1-14408237-12 1.11 // 23Western Bay of Plenty PT Blueprint - Detailed Business Case
Figure 3-12: Sunday Boarding Demand
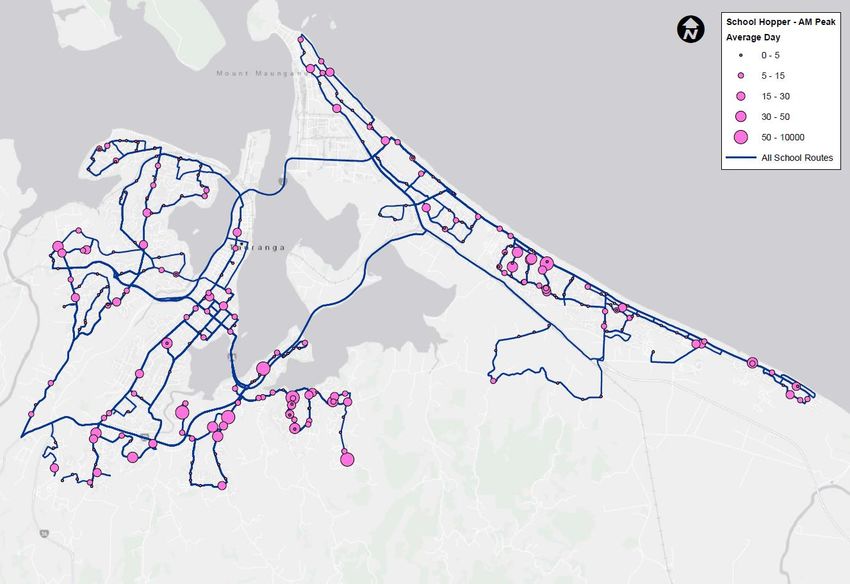
3.5.6 Distribution of Demand for Schoolhopper Services
Figure 3.12 shows the current distribution of boarding demand for Schoolhopper services in the AM
peak period.
Beca // 5 September 2017
3810659 // NZ1-14408237-12 1.11 // 24Western Bay of Plenty PT Blueprint - Detailed Business Case
Figure 3-13: School Hopper Boarding Demand
3.5.7 Schoolhopper Services
The Schoolhopper service currently carries approximately 580,000 passenger trips per year. Table
3-4 summarises the level of demand by school served, the figures are approximate and some
routes serve more than one school so the number of routes shown is not exact.
Table 3-4: Schoolhopper Demand by School (average passengers)
School Served Number of Routes AM Peak Demand PM Peak Demand
Aquinas College 9 250 260
Bethlehem College 8 230 270
Greenpark School 2 75 70
Greerton School 1 30 55
Maungatapu Primary 1 40 10
Mount Maunganui Intermediate 6 (plus college routes) 90 100
Mount Maunganui College 12 120 210
Otumoetai College 4 115 130
Otumoetai Intermediate 2 (plus college routes) 100 100
Papamoa Primary School 2 35 35
Papamoa College 2 shared with primary 35 35
Beca // 5 September 2017
3810659 // NZ1-14408237-12 1.11 // 25Western Bay of Plenty PT Blueprint - Detailed Business Case
School Served Number of Routes AM Peak Demand PM Peak Demand
St Mary’s School 2 (shared with TGC) 20 20
St Thomas Moore School 1 20 20
Tauranga Boys College 7 170 190
Tauranga Girls College 8 100 150
Tauranga Intermediate 10 120 140
Tauranga Primary 2 20 10
3.5.8 Demand for Regional Commuter/ Shopper Services
Demand on regional buses is much lower than the urban network. The Te Puke services currently
carry approximately 12,000 passengers per year and Katikati / Omokoroa services carry
approximately 18,000 passengers per year.
3.6 Current Bus Network Strengths and Weaknesses
3.6.1 Bayhopper Services
The main deficiencies of the existing services have been identified through feedback received from
bus operators and the BoPRC. These are:
Services are not well co-ordinated to give consistent frequencies on the main Arterial roads
served by more than one route (e.g. Cameron Road)
Services are not well co-ordinated to enable efficient transfers at the main hub in the CBD
Many routes are circuitous and indirect, adding to the journey time and length
There is little inter-connectivity between services outside of the CBD hub
Frequencies are too low to be attractive on some routes, especially at weekends and early/late
in the daytime
Services do not start early enough, or finish too early in the day.
Table 3-5 summarises the main strengths and weaknesses of each Bayhopper route.
Beca // 5 September 2017
3810659 // NZ1-14408237-12 1.11 // 26Western Bay of Plenty PT Blueprint - Detailed Business Case
Table 3-5: Current Bayhopper Routes – Strengths and Weaknesses
Route To/from Strengths Weaknesses
1 Pyes Pa – Greerton – City – Provides frequent cross- Not well co-ordinated with other services on
Mount Maunganui city linkages Cameron Road to give consistent headways
Length of route can make services
unreliable.
2 Windermere – Greerton – Provides frequent cross- Not well co-ordinated with other services on
City – Bayfair – Mount city linkages, higher Cameron Road to give consistent headways
Maunganui frequency Length of route can make services
unreliable.
Indirect route between Mount Maunganui
and Bayfair, and between the City and
Wyndermere
30 Papamoa – Bayfair – Mount Provides a direct service Indirect, long journey time, low frequency
Maunganui between Mt Maunganui
and Papamoa
33 City – Bayfair – Papamoa Serves Karewa Parade Indirect. Does not serve Wairakei Avenue,
Emerald Shores Drive
36 City – Maunatapu – Bayfair – Provides a direct link from Indirect route from Bayfair to the City via
Papamoa Maungatupu to Bayfair Maungatapu and Tauranga South.
Serves little demand between Maungatapu
and Bayfair
th
40 City – 15 Avenue – - Indirect route from some areas of Welcome
Welcome Bay Bay due to long loop route
52 City - Greerton – The Lakes - Low patronage and limited coverage
55 City – Fraser Street – Provides coverage through Indirect route between some areas of
Greerton – Windermere – Fraser Cove and past Ohauiti and the City
Ohauti Polytech and Schools
59 City – Sunvale – Greerton – - Indirect route between Oropi and the CBD
Oropi Currently loops through Oropi Road but
attracts little patronage
60 City – Bellevue – Brookfield - Indirect route between Cambridge Heights
– Cambridge Heights and the City
62 City – Pillans Point – - Indirect route between Bethlehem and the
Brookville - Bethlehem City
70 City – Brookfield – - Indirect route between Matua and the City
Cherrywood - Matua
3.6.2 Schoolhopper Services
The main strengths and weaknesses of the Schoolhopper services are:
Fixed timings and only one service per route per peak means journey options (and therefore
attractiveness of service to customers) is limited
Routes are often indirect.
3.6.3 Regional Commuter/ Shopper Services
The main strengths and weaknesses of the regional commuter/shopper services are:
The timing of the services do not always meet customer needs due to operational constraints
Services from some areas do not provide efficient journeys to key destinations such as
Tauranga Hospital/Bayfair/Mount Maunganui
The coverage of services in Te Puke is limited.
Beca // 5 September 2017
3810659 // NZ1-14408237-12 1.11 // 27Western Bay of Plenty PT Blueprint - Detailed Business Case
4 Future Network Design Principles
To support the preparation of the future bus network design, a set of design principles was
developed by the BoPRC in 2016 for Bayhopper and Schoolhopper services. These principles seek
to provide direction on how the two bus networks are to be developed and assist in the delivery of
the benefits identified in the Strategic Case.
4.1 Bayhopper Network
4.1.1 Service Priorities
The following service priorities were identified:
Reliability – Our network can be trusted to do what it ‘says on the box’
Meets user needs – Goes where people need it to go
Journey times – Our network has journey times that make it competitive with other modes
Connected network – Allows users to transfer between services and freely travel around the
city and on to other destinations.
4.1.2 Service Design Principles
The following service design principles were identified:
Sufficient slack time should be built into timetables to maintain reliability allowing for congestion
growth
Should meet existing demands from users and aim to attract additional users
Services should be delivered to growth areas to signal and provide users with long term public
transport stability
Should take into consideration existing and potential regional services in particular those
servicing satellite communities in the Western Bay of Plenty
Should incorporate a service hierarchy that is easy to understand and allows user to easily
identify areas that are supported by frequent public transport services
The service design should reflect the existing, decentralised urban form of Tauranga whilst
supporting growth in the CBD
Service design should encourage urban forms that will reinforce patronage growth
Where possible infrastructure solutions should be identified that will allow for more direct, reliable
bus services.
4.1.3 Types of Services
The types of urban services identified are summarised in Table 4-1.
Beca // 5 September 2017
3810659 // NZ1-14408237-12 1.11 // 28Western Bay of Plenty PT Blueprint - Detailed Business Case
Table 4-1: Types of Urban Services
Special Frequent Connector Access Regional
Description Orbiter or serving Fast and frequent The work horse of Services that are Typically
special services the network provided to designed to
destinations such ensure minimum accommodate
as airports or level of service to commuters and
cruise terminal as many people provide access to
as possible services in larger
centres
Frequency 15-60 min 15 min or less 30 min 60 min As required
Stop 600m or greater 800m or greater 600m or greater approx. 400m Typically key
Spacing destinations only
Livery Bespoke Emphasised Standard Standard Standard
Service As required Uses main Direct routes with May be circuitous Will be direct with
Planning arterials with few deviations for to provide detours for major
detours. Connects attractors. May maximum attractors
major attractors. have some bus coverage
Significant bus priority measures
priority utilised
Transfer Depends on Frequency should May hub or Where possible Should link to a
Design locations served allow for interchange with should connect to main hubs to
and frequency. timetabled connector Frequent services enable onward
connections with /frequent journeys
minimal delay services.
Suggested As required 6am-9pm* 6am-7pm 7am-6pm As required
Hours of
Operation
*later on Friday/Saturday
4.2 Schoolhopper Network
4.2.1 Priority on the Public Network
Secondary and intermediate school students should, in the first instance, be served by the public
bus network (Bayhopper services). Schoolhopper services will be provided where the capacity or
coverage of the public network is insufficient to cater for demand.
Primary schools should, wherever practicable, be served by Schoolhopper services ahead of
Bayhopper services. This is because Bayhopper services will not always be seen as a safe or
comfortable choice for primary school students and their parents.
4.2.2 Flexibility
Schoolhopper service contracts should be flexible enough to allow for changing demands as the
demographics of an area or school roles change.
4.2.3 Hours of Operation
Schoolhopper services should be planned to operate with no pick-ups prior to 7:30am, and no drop-
offs after 4:30pm. This is to ensure students are able to arrive home at a reasonable hour.
Beca // 5 September 2017
3810659 // NZ1-14408237-12 1.11 // 29Western Bay of Plenty PT Blueprint - Detailed Business Case
4.2.4 Minimum Distance to School
All school services are to include stops (to allow pick-ups) to within two kilometres of each school
unless there are capacity constraints on the service. The current MoE criteria requires that Years
one (first year at primary) to eight (first year at secondary) must live at least 3.2 kilometres from
their nearest appropriate school; Years nine and upwards must live at least 4.8 kilometres from their
nearest appropriate school. The proposed change will result in services operating much closer to
the school gate and will therefore have a greatly increased student catchment. It is expected that
this will reduce the number of parents needing to drop off students at school.
4.2.5 Maximum Distance to School
It is proposed that all school routes will serve students within a radius no greater than 8-10
kilometres of their school. Currently no maximum distances apply, so long as the student is
attending their nearest appropriate school. This change will significantly cut the cost of servicing
some schools where routes are currently up to 20 kilometres in length. Students who live further
from their schools are still able to catch Bayhopper services to attend their schools.
4.2.6 Schools Served
The current MoE rules are based on providing transport for students living more than 3.2 kilometres
(years 1-8) and 4.8 kilometres (years 9+) from their nearest appropriate school. It is proposed to
maintain service to current schools, but with routes adjusted, removed and added as per the design
principles. Additional schools may be served by Schoolhopper services if a request from the school
is made and routes can be delivered with similar per student costs as existing services and where
an appropriate Bayhopper service is not available.
5 Future Land Use, Transport Demand and Road
Network Changes
This section outlines future land use and road network changes in and around Tauranga over the
next ten years that could impact on the provision of bus services in the Western Bay of Plenty.
5.1 PBC Programme Measures and Other Complimentary Initiatives
The PBC identified a range of supporting actions, in addition to the network review covered in this
DBC, necessary to achieve the benefit statements. The following table shows the initiatives
considered and recommended timeframes.
Beca // 5 September 2017
3810659 // NZ1-14408237-12 1.11 // 30Western Bay of Plenty PT Blueprint - Detailed Business Case
Figure 5-1: Complimentary PBC Initiatives
In addition to the initiatives identified in the PBC, there are a range of additional complimentary
initiatives linked to PT delivery in planning or development at present, as shown in the following
figure.
Figure 5-2: Additional Complimentary Initiatives Outside PBC
The BoPRC as programme lead is working with relevant stakeholders, e.g. TCC and the NZ
Transport Agency to achieve coordination and delivery of the initiatives and programmes.
5.2 SmartGrowth Spatial Plan Overview
SmartGrowth is the spatial plan for the Western Bay of Plenty sub-region. It is a comprehensive,
long term strategy which sets the strategic vision and direction for the growth and development of
the Western Bay, on key issues across the spectrum of social, environmental, economic and
cultural objectives.
The Settlement Pattern is an important component of the SmartGrowth strategy. It provides a
blueprint for growth and development which identifies the existing and future location of residential
and business land and considers the mix of land-use, transportation and other infrastructure in an
integrated manner.
The SmartGrowth strategy is a component of a wider Bay of Plenty regional framework which has
an emphasis on natural resource use, economic development, energy management and transport
planning.
Beca // 5 September 2017
3810659 // NZ1-14408237-12 1.11 // 31Western Bay of Plenty PT Blueprint - Detailed Business Case
5.3 Major Development Areas
The SmartGrowth strategy has identified the main land development areas as follows:
Consolidation of development within existing urban areas of Waihi Beach, Katikati, Omokoroa,
Tauranga, and Te Puke
Redevelopment through mixed-use intensification nodes focussed on business and community
centres, and at other preferred locations
Greenfield development at increased development densities in Residential Growth Areas at
Waihi Beach, Katikati, Omokoroa, Bethlehem, Pyes Pa, Papamoa, Papamoa East, and Te Puke.
Intensification nodes are expected to accommodate approximately 25% of new developments:
Tauranga Isthmus (Tauranga Central, 11th Avenue, Gate Pa, Greerton, Pyes Pa)
Mount Maunganui (Central Parade, Downtown Mount, Bayfair)
Papamoa (Domain Road, Parton Road, Papamoa East).
Development focus in Tauranga City will be on the key growth locations shown in Figure 5-3.
Figure 5-3: Current and Planned Urban Growth Areas
5.4 Major Residential Growth Plans
In sub-regional terms the development allocation for residential growth is likely to be as follows:
Greenfield Residential Development (average of 15 dwellings per hectare): 60% of growth
Intensification Nodes (30 to 40 dwellings per hectare): 30%
General Intensification: 7%
Rural: 3%.
Beca // 5 September 2017
3810659 // NZ1-14408237-12 1.11 // 32Western Bay of Plenty PT Blueprint - Detailed Business Case
Therefore around 60-65% of future growth in the sub-region will be in greenfields developments and
35-40% will be intensification. The main areas that this greenfield development will occur in the next
ten years are likely to be Pyes Pa and Papamoa.
Approximately 75% of urban intensification is expected to be accommodated within the Tauranga
City area. The Tauranga City growth will be achieved through higher density redevelopment of a
number of intensification nodes as well as raising the development densities within undeveloped
land on the edge of the City from ten households per hectare to 15 households per hectare.
Figure 5-4 to Figure 5-6 show the existing (2013) and anticipated future (2028) population
densities, and the expected change in population density between 2013 and 2028. This indicates
that significant Greenfield development and corresponding density change can be seen in areas
such as Pyes Pa East and West, Bethlehem and Papamoa.
Figure 5-4: 2013 Population Density
Beca // 5 September 2017
3810659 // NZ1-14408237-12 1.11 // 33Western Bay of Plenty PT Blueprint - Detailed Business Case
Figure 5-5: 2028 Population Density
Figure 5-6: Population Density Change
Beca // 5 September 2017
3810659 // NZ1-14408237-12 1.11 // 34Western Bay of Plenty PT Blueprint - Detailed Business Case
Key issues from the SmartGrowth strategy likely to impact on the future development of the bus
network in Tauranga are summarised below.
5.4.1 Greenfield Development
The new Greenfield growth nodes such as Wairakei and Pyes Pa West will need to be serviced by
bus services from the commencement of development to facilitate the maximum take up.
5.4.2 Urban Node Developments and Intensification
Intensification of existing developed areas will require the likely improvement of existing bus
services rather than the development of new routes, along with the development of secondary
suburban interchanges at locations such as Greerton, Brookfield, Bayfair and Mount Maunganui, as
well as the CBD.
5.5 Commercial Growth Plans
In terms of commercial land SmartGrowth supports a ‘centres-based’ approach to commercial
areas, preferring to concentrate business activity closer to the CBD.
SmartGrowth considers the growth of industrial and commercial activities that provide employment
to support a growing residential population. The current industrial and commercial areas at Mount
Maunganui and Greerton with future zoned land at Tauriko are and will become significant
contributors to the local and regional economy. The Port of Tauranga provides an international
gateway for the regional and national economy. Efficient movement of people and freight to these
areas is essential to Tauranga’s economic and social wellbeing into the future.
Figure 5-7 shows the existing (2015) employment densities.
Figure 5-7: Existing Employment Density
Beca // 5 September 2017
3810659 // NZ1-14408237-12 1.11 // 35Western Bay of Plenty PT Blueprint - Detailed Business Case
Within the city boundaries, developments such as at Bayfair, Fraser Cove, Gate Pa and Bethlehem
are anticipated to continue to generate demand along the main routes already serviced by the bus
network. There are no other large developments within the City expected in the next 10 years
currently beyond the ongoing development of the City amenities that are likely to lead to significant
impacts on the network.
5.6 Summary of the Main Land Use Changes Expected to Impact on
the Future Bus Network
The main land use changes expected to impact on the future bus network in the Western Bay of
Plenty area are as follows:
Creation of substantial new residential areas at Wairakei, Te Tumu, Oropi, Welcome Bay,
Ohauiti, South Bethlehem and Pyes Pa West and Papamoa East
Continuation of residential growth in areas such as Bethlehem, and Pyes Pa East
Intensification of residential development in Greerton, Arataki and the CBD
Growth in areas outside of Tauranga requiring transport links such as Te Puke, Ōmokoroa and
Katikati.
In order to maintain the accessibility of the bus network as the City grows it will be necessary to
extend services into the new urban growth areas. This will require careful transitioning and
optimisation of services to maintain both mobility and access. For example as the City expands
outwards a “spoke and hub” system may no longer meet the needs of patrons and the speed and
convenience of routes would be compromised. Triggers for transitioning to spoke and wheel
systems and the increased provision of ‘orbiter’ services will need to be carefully considered.
Additional direct/express services, and the creation of public transport hubs perhaps at suburban
shopping centres, may also be required to maximise patronage.
5.7 Changes in Future Travel Demand
The Tauranga Traffic Model (TTM) is a regional traffic model that has been used by the NZ
Transport Agency, the WBoPDC and TCC for many years to assist in planning and design of road
networks and other transport projects. Information on current (2016) and predicted future (2026)
travel patterns was extracted from the model. The future travel pattern forecasts take into account
expected changes to land use and population.
The model outputs have been examined to identify the key changes in transport movements within
Tauranga City during AM and PM peak periods (Mondays to Fridays) between 2016 and
2021/2026.
The ten largest trip demands between key sectors of the Tauranga City area in 2016 during the AM
peak hour are shown in Figure 5-8 and summarised in Table 5-1. The arrows represent the travel
demand direction, e.g. between Mount Maunganui and the CBD and the values represent the
number (volume) of trips e.g. 800.
In summary:
Pyes Pa West, Otumoetai / Matua and the Papamoa to Mount Maunganui corridor appear to be
the most important areas in terms of a priority for future public transport provision
Travel within Tauranga City is higher than demands to and from regional areas such as Te Puke
and Omokoroa / Katikati.
Beca // 5 September 2017
3810659 // NZ1-14408237-12 1.11 // 36You can also read