Communicability in the World Trade Network A new perspective for community detection
←
→
Page content transcription
If your browser does not render page correctly, please read the page content below
Noname manuscript No.
                                                  (will be inserted by the editor)

                                                  Communicability in the World Trade Network
                                                  A new perspective for community detection

                                                  P. Bartesaghi · G.P. Clemente ·
                                                  R. Grassi
arXiv:2001.06356v1 [physics.soc-ph] 17 Jan 2020

                                                  Received: date / Accepted: date

                                                  Abstract Community detection in a network plays a crucial role in the eco-
                                                  nomic and financial contexts, specifically when applied to the World Trade
                                                  Network. We provide a new perspective in which clusters of strongly inter-
                                                  acting countries are identified by means of a specific distance criterion. We
                                                  refer to the Estrada communicability distance and the vibrational communi-
                                                  cability distance, which turn out to be particularly suitable for catching the
                                                  inner structure of the economic network. The methodology is based on a vary-
                                                  ing distance threshold and it is effective from a computational point of view.
                                                  It also allows an inspection of the intercluster and intracluster properties of
                                                  the resulting communities. The numerical analyses highlight peculiar relation-
                                                  ships between countries and provide a rich set of information that can hardly
                                                  be achieved within alternative clustering approaches.

                                                  Keywords Network Analysis · Communicability Distance · Community
                                                  Detection · World Trade Network
                                                  JEL classification code: G65, D57, F40

                                                  Paolo Bartesaghi Corresponding author.
                                                  Department of Statistics and Quantitative Methods, University of Milano - Bicocca, Via
                                                  Bicocca degli Arcimboldi 8, 20126, Milano, Italy
                                                  E-mail: paolo.bartesaghi@unimib.it
                                                  Gian Paolo Clemente
                                                  Department of Mathematics for Economics, Financial and Actuarial Sciences, Uni-
                                                  versità Cattolica del Sacro Cuore, Largo Gemelli 1, 20123, Milano E-mail: gian-
                                                  paolo.clemente@unicatt.it
                                                  Rosanna Grassi
                                                  Department of Statistics and Quantitative Methods, University of Milano - Bicocca, Via
                                                  Bicocca degli Arcimboldi 8, 20126, Milano, Italy
                                                  E-mail: rosanna.grassi@unimib.it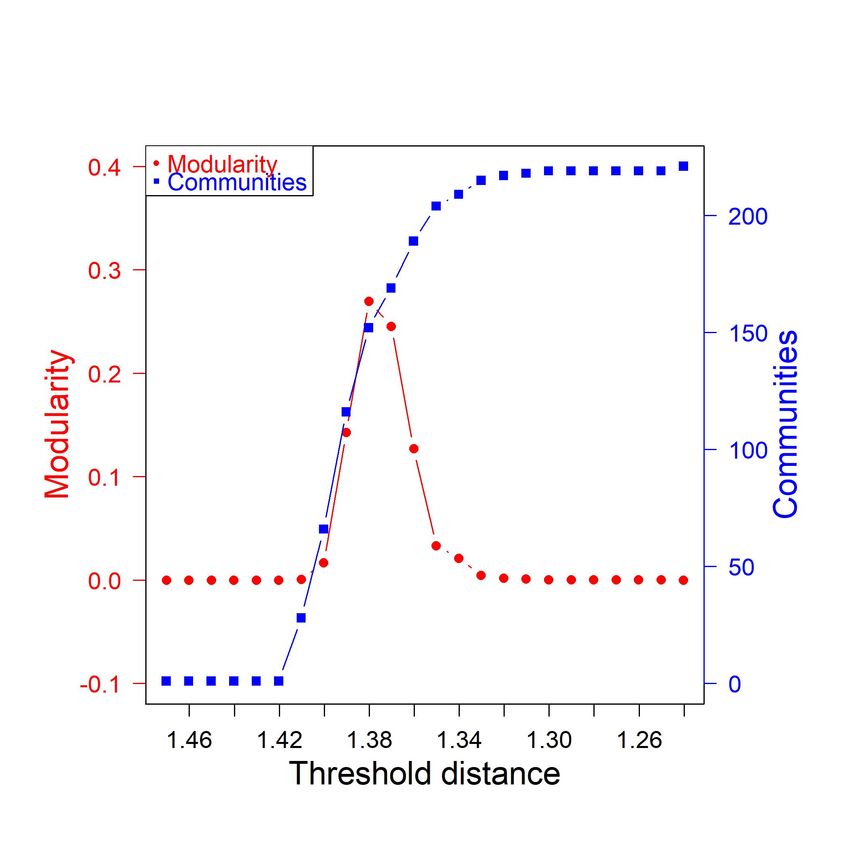
2                                                              P. Bartesaghi et al.

1 Introduction

International trade is based on a set of complex relationships between different
countries. Both connections between countries and bilateral trade flows can be
modelled as a dense network of interrelated and interconnected agents. A long-
standing problem in this field is the detection of communities, namely subset
of nodes among which the interactions are stronger than average. Indeed, the
community structure of a network reveals how it is internally organized, high-
lighting the presence of special relationships between nodes, that may not be
caught from direct empirical analyses. In other words, the community structure
refers to the occurrence of clusters of nodes that are more densely connected
internally than with the rest of the network.
In this framework, a specific role is assumed by the distance between nodes.
For instance, the neighbours of a given node are immediately connected to
such a node and they can affect its status in the most direct way. Nonetheless,
more distant nodes can influence this node while passing through intermedi-
ary ones. In the economic field, a network perspective is indeed based on the
idea that indirect trade relationships may be important (see, e.g., [31]). The
authors in [1] explain the impact of shocks on a given country by indirect
trade links. Based on a global VaR approach, [16] shows that countries that
do not trade (very much) with the U.S. are largely influenced by its dominance
over other trade partners linked with the U.S. via indirect spillovers. In [62],
the bilateral trade is assumed not independent of the production, consump-
tion, and trading decisions made by firms and consumers in third countries.
A measure of the distance between nodes that also considers indirect connec-
tions is therefore crucial to catch deep interconnections between nodes. In this
work, we will focus on two measures of distance or metrics on the network: the
Estrada communicability distance [22] and the vibrational communicability
distance [23]. They both go beyond the limits of the immediate interaction
between neighbours and they look simultaneously, albeit differently, at all the
possible channels of interactions between nodes. The nearest two nodes are in
each metric, the stronger is their interaction or, in other words, the higher is
the level of communicability between them.
With this paper we contribute to the literature proposing a new method that
exploits such metrics to inspect the mesoscale structure of the network, in
search for strongly interacting groups of nodes. Indeed, our purpose is to pro-
vide a new methodology for detecting the community structure of a network
exploiting these suitable distances. In other words, we aim at finding cluster
of nodes by means of a metric able to catch both direct and indirect relation-
ship between countries. In particular, as in the classical procedure provided
by Girvan and Newman [46] we search for the maximum modularity, that, as
well-known, is a way to measure if a specific mesoscopic description of the net-
work in terms of communities is more or less accurate. Differently from [46],
we group together nodes whose interaction is lower than a specific threshold.
The best partition will be identified by the threshold that maximizes the mod-
ularity.
Communicability in the World Trade Network                                        3

Our proposal provides several advantages representing a viable alternative to
classical methodologies for community detection. Firstly, the method is very
efficient from a computational viewpoint. Indeed, given the specific distance
matrix, the optimal solution can be easily evaluated varying the threshold.
Classical Girvan and Newman methodology is instead a NP-hard problem due
to the fact that the space of possible partitions grows faster than any power of
the system size. For this reason, several heuristic search strategies have been
provided in the literature to restrict the search space while preserving the op-
timization goal (see, e.g., [2], [17], [10], [45]). Secondly, we cluster nodes going
beyond the interactions between neighbours and considering all possible chan-
nels of interaction between nodes. Thirdly, we allow for a degree of flexibility
by introducing a threshold. Varying the threshold, it is possible to depart from
the optimal solution so that only the strongest (or the weakest) channels of
communications emerge. Finally, the procedure offers a set of indicators that
allow to exploit main characteristics of the communities detected as well as
the relevance of countries inside the community and in the whole network.
The theoretical model is validated through empirical experiments based on
the World Trade Network (WTN). Results confirm a number of intuitions
in mainstream economic literature. It is confirmed the relevance of physical
variables such as geographical distance (see, e.g., [4]). Geographical proximity
matters and trades are to some extent regionalized. These results are also in
line with [47] that shows that existing preferential trade agreements are not
strongly distorting the geography of trade patterns, at least at the aggregate
level. Two main communities are detected. Top community is characterized by
North-America, Asian countries and Australia. In line with [65], emphasizing
tight links, we obtain that although the strong trade relationships with USA
and Germany, China became regionally attractive and restored the leadership
of Asia-Oceania community. European community is highly centralized around
founding members of the European Economic Community with the central role
of Germany. High income countries in Northern Europe are instead in a sep-
arate community with a less relevant role in the network.
The paper is organised as follows. After a short review of the literature in Sec-
tion 2, main preliminaries and the definitions of the communicability functions
are revised in Section 3. These functions lead to two important metrics on net-
works, which are described in Section 4. Section 5 contains the description of
the proposed methodology, which is also tested on a suitable toy-model. In
Section 6, we test our methodology to the World Trade Network. In partic-
ular, main characteristics of the network are described in Section 6.1. Main
steps of the methodology are summarized in Section 6.2. We report in Sec-
tions 6.3 and Subsection 6.3.1 main results based on communicability and
resistance distance, respectively. We show how the proposed methodology is
able in capturing key economic clusters as well as in providing additional in-
sights in terms of intercluster characteristics and of countries’ relevance in the
community and in the whole network. Conclusions follow. Technical details
are left in Appendices A and B.
4                                                                P. Bartesaghi et al.

2 Literature Review

Community detection is an important topic in the analysis of the topological
structure of complex systems. This is confirmed by the fact that its importance
has grown over time in light of the remarkable progress in the description of
large networks, together with the development of new powerful data analysis
tools. These advances have made it possible to extend the field of applicability
of the theory not only to networks of enormous dimensions but also to weighted
networks and direct networks [9,12,27,49]. The definition of what a community
is within a network is not univocal but there is a broad general consensus in
believing that it maximizes a modularity function according to Newman’s
definition [46].
    More recently the role of non-local interactions between nodes has been
highlighted, that is interactions that do not exclusively involve the immediate
neighbours of a given node. In particular, results connected to the idea of
communicability introduced by Estrada in 2004 have proved to be extremely
effective [19, 21, 22, 25]. All the more so by allowing a metric different from
the shortest path metric to be introduced on the network. The purpose of
this new metric is precisely to take into consideration long-range interactions
between institutions. Some important similarities can be found between this
new metric and the resistance distance, a well-known metric in network theory
derived from the study of electric circuits [23, 40, 43], and its interpretation in
terms of vibrational communicability [3, 6, 24, 59].
    An area in which these concepts allow us to gain a deep insight into the
hidden structures of the network is properly the WTN. The topology of the
world trade web has been extensively analysed over time [28, 33–35, 44, 53].
The behaviour of international trade flows, the impact of globalization on
the international exchanges, the presence of a core-periphery structure or the
evolution of the community centres of trade, are just some of the issues ad-
dressed by the recent developments [5, 14, 29, 54, 57]. Many works have dealt
with the network from a multi layers perspective [4, 56] or aim to empha-
size financial implications of the world trade or contagion processes on the
network [7, 8, 15, 30, 32, 36, 50, 52, 60, 63].
    For instance, centrality of a given institution as best spreader node in a
contagion process has been discussed by [43, 59], who define the avalanche
size of a node as the number of subsequently collapsed institutions starting
from a given institution’s collapse. In that way they are able to identify the
most dangerous crisis epicentre of the network, be it a country or a financial
institution.
    The impact of topology and metric properties on the stability and resilience
of an economic or financial system has been widely studied in order to describe
the large-scale pattern of dynamical processes inside the network [39, 48, 55].
These processes determine the subsequent diversification of the export of a
country, which can be compared with descriptive empirical indices of its po-
tential growth, such as the one introduced in a very fruitful way in [38].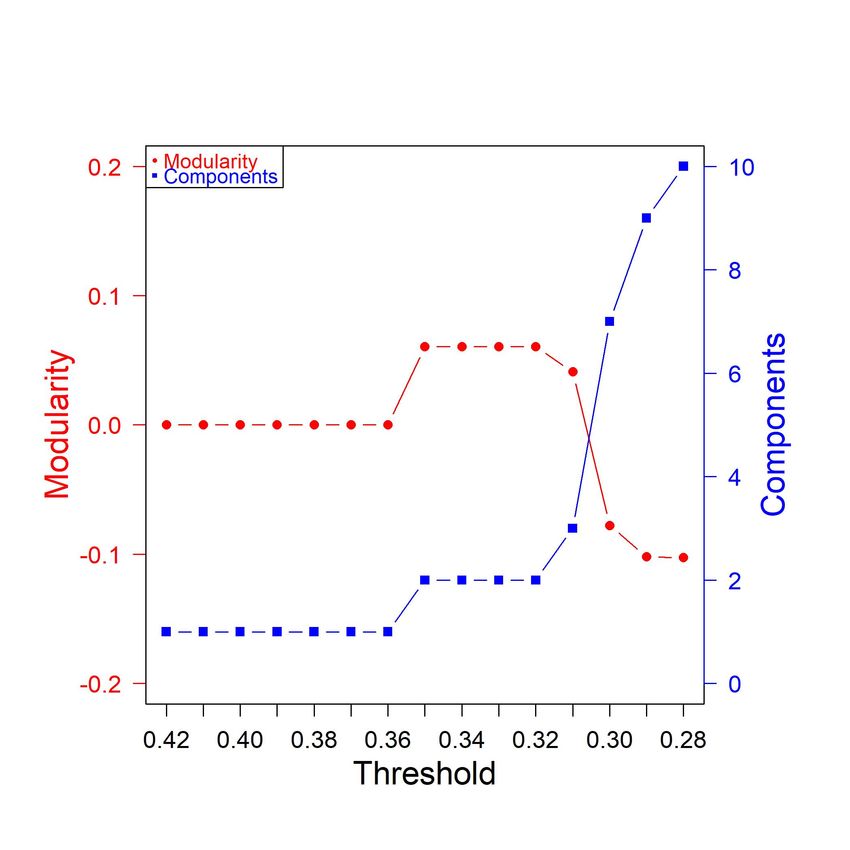
Communicability in the World Trade Network                                        5

3 Communicability in complex networks

The idea of communicability on a network is based on the ways in which a
pair of nodes can communicate, namely through walks connecting them. In the
literature, two different definitions of communicability have been introduced:
the Estrada Communicability and the Vibrational Communicability ( [21,24]).
We recall them in this section.
     First of all, we briefly remind some preliminary definitions. A network is
formally represented by a graph G = (V, E) where V and E are the sets of
n nodes and m edges, respectively. Two nodes i and j are adjacent if there is
an edge (i, j) ∈ E connecting them. The network is undirected if both (i, j)
and (j, i) are elements of E. A i − j-path is a sequence of distinct vertices
and edges between i and j. The shortest path, or geodesic, between i and
j is a path with the minimum number of edges. The length of a geodesic is
called geodesic distance or shortest path distance d(i, j) = dij . A graph G is
connected if, ∀i, j ∈ V , a i − j-path connecting them exists.
A subgraph H = (V 0 , E 0 ) of G is a graph such that V 0 ⊆ V and E 0 ⊆ E. An
induced subgraph H ⊆ G is a subgraph formed by a subset of vertices of G
and all of the edges connecting them in G .
     Adjacency relationships are represented by a binary symmetric matrix A
(adjacency matrix). Graphs considered here will be always connected and with-
out loops; in this case aii = 0 ∀i = 1, ..., n. We denote with λ1 ≥ λ2 ≥ · · · ≥ λn
the eigenvalues of A, and ϕi , i = 1, ..., n the corresponding eigenvectors.
The degree ki of a node i is the number of edges incident on it. The di-
agonal matrix whose diagonal entries are ki is K. The Laplacian matrix is
L = K − A. L is positive semidefinite symmetric. We denote the eigenval-
ues of L by µ1 ≥ µ2 ≥ · · · > µn = 0 and ψi , i = 1, ..., n the corresponding
eigenvectors.
     A graph G is weighted when a positive real number wij > 0 is associated
with the edge (i, j). We define the strength si as the sum of the weights of
the edges adjacent to i. The definition of geodesic path still holds, and it is
a weighted path with the minimum sum of edge weights. In this case, the
adjacency matrix is a non-negative symmetric matrix W. When wij = 1 if
(i, j) ∈ E, then the graph is unweighted. Thus, the unweighted case can be
viewed as a particular weighted one. We will use in the paper the general
concept of weighted graphs and we denote a weighted graph with its weights
simply as weighted network.
     A weighted network is directed if every edge is directed, i.e. if (i, j) is an
element of E, not necessarily (j, i) is in E. The weighted adjacency matrix W
is not symmetric. The in-strength sin i and the out-strength si
                                                                out
                                                                    of a node i are,
respectively, the sum of the strengths of all the arcs pointing to or starting
from such a node:
                                   T        T
                            sin
                             i = (A W)ii = Wi u                                 (1)

                            sout
                             i   = (AWT )ii = Wi u                              (2)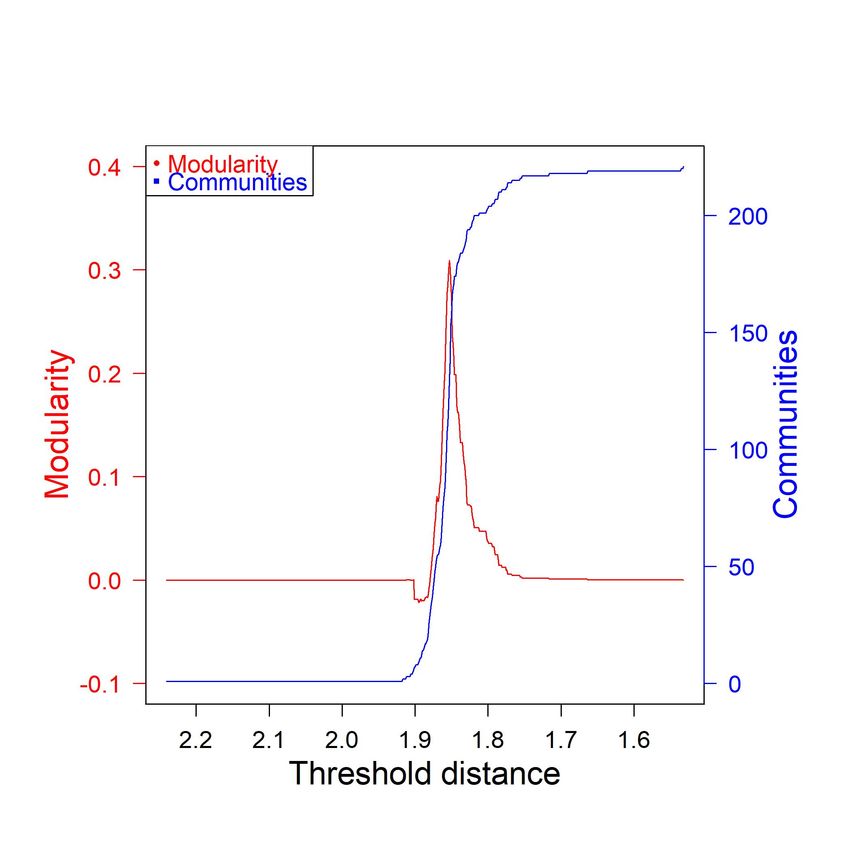
6                                                               P. Bartesaghi et al.

  where Wi represents the i-th row of the matrix W and u ∈ Rn the vector
whose components are all 1.

3.1 Estrada Communicability

The Estrada communicability [21] between two nodes i and j is defined as:

                                    +∞
                                    X  1 k
                                          [A ]ij = eA ij .

                            Gij =                                               (3)
                                       k!
                                    k=0

    As the ij-entry of the k-power of the adjacency matrix A counts the number
of walks of length k starting at i and ending at j, Gij accounts for all channels
of communication between two nodes, giving more weight to the shortest routes
connecting them. It can also be interpreted as the probability that a particle
starting at i ends up at j after wandering randomly on the complex network.
The communicability matrix is denoted by G.
    By definition, it follows that Gij > 0. Moreover, Gij can be conveniently
expressed using the spectral decomposition of A as follows [21]:
                                      n
                                      X
                             Gij =          ϕk (i)ϕk (j)eλk ,
                                      k=1

    where ϕk (i) is the i-component of the k-th eigenvector associated with λk .
    It is worth noting that since Gii characterizes the importance of a node
according to its participation in all closed walks starting and ending at it, we
recover the so-called subgraph centrality (see [25]).
    In the case of an undirected weighted network the communicability function
is defined as

                      +∞
                      X  1       1     1             −1   −1
              Gij =         [(S− 2 WS− 2 )k ]ij = e(S 2 WS 2 )                  (4)
                         k!                                     ij
                      k=0

    where S is the diagonal matrix whose diagonal entries are the strengths of
the nodes. We will call this weighted communicability. The weighted commu-
nicability is particularly suitable to be applied to the study of input-output
networks.
    The definition of communicability can be generalized in order to describe
situations in which an external factor may affect the structure of connections.
Indeed, complex networks are continuously exposed to external stresses, which
are independent of the network architecture, but that can affect its structure
and its evolution. To take into account the effect of the external environment
on the network communicability, a real parameter β can be introduced as a
weight-gauging factor which multiplies the original weights assigned to each
link, i.e. by multiplying the adjacency matrices A or W by the constant β.
See [22] for a more detailed explanation about this generalization.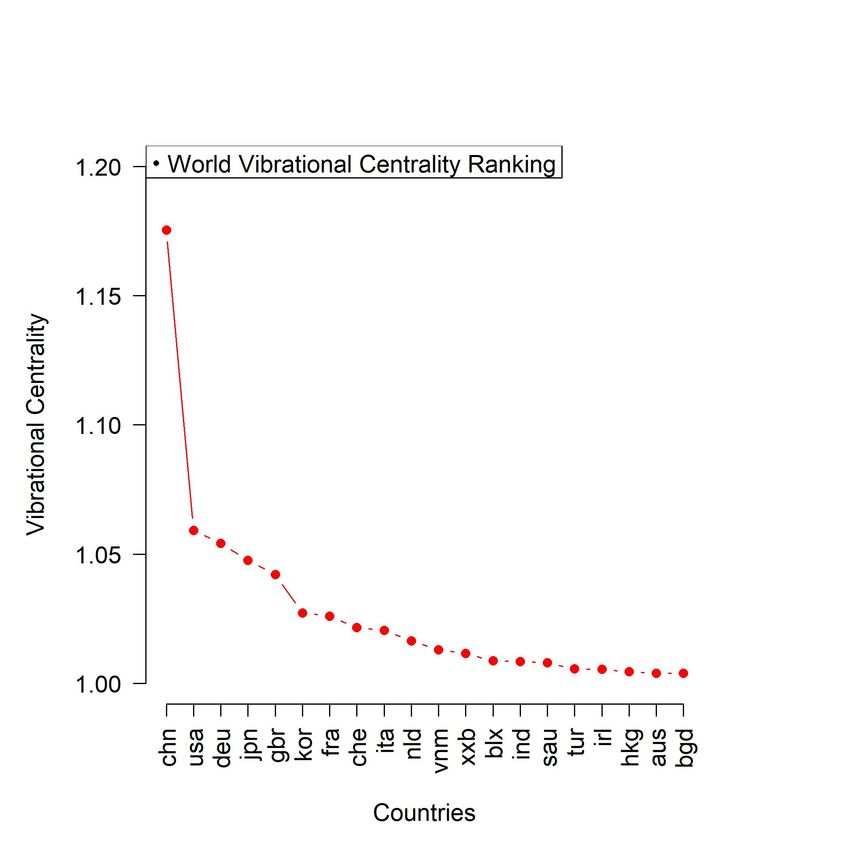
Communicability in the World Trade Network                                          7

3.2 Vibrational Communicability

Communicability can be alternatively defined through the following model
from Physics. Let us suppose that nodes of the network are objects of negligible
identical mass connected by springs in a plane grid. Nodes can oscillate in
the direction perpendicular to the plane and the displacement of the node i
from its Prest position is zi . The elastic force applied to node i is given by
Fi = K j Aij (zi − zj ), where K is the common elastic constant of each
spring. An elastic potential energy can be assigned to each perturbed spring
and the potential  energy of all the springs connected with node i is given by
Ui = 21 K j Aij (zi − zj )2 .
          P

The overall potential energy of the network is therefore1
                          1 X                      1 X
                    U=      K     Aij (zi − zj )2 = K    zi Lij zj                (5)
                          4   i,j
                                                   2  ij
    where Lij is the ij-entry of L.
    The reciprocal influence of two nodes i and j in their positions zi and
zj is computed by means of the Green’s function, according to the classical
Boltzmann’s distribution [23, 24]. This mutual influence can be interpreted
as the correlation function between the displacements z of two nodes in the
network:
                                              Z
                                            1
                      Gvij (β) = hzi zj i =     zi zj e−βU dz
                                            Z
    where β is a constant and Z = e−βU dz is the partition function. Using
                                        R

the non-zero eigenvalues of L, Z can be expressed as (see Appendix 2)

                        Z                                          n−1 r
                                −βK
                                      P
                                           zi Lij zj
                                                       Y           Y        2π
                   Z=       e         ij                   dzk =                  (6)
                                                                           βKµk
                                                       k           k=1

  so that the correlation function can be rewritten in the final form (see
Appendix 2):
                                                n−1
                                                X      ψk (i)ψk (j)
                                 Gvij (β) =                                       (7)
                                                         βKµk
                                                k=1
   where ψk is the eigenvector associated with µk . Introducing the Moore-
Penrose pseudo-inverse of the Laplacian L+ [6, 37], the vibrational communi-
cability between nodes i and j is defined as
                                        1 +
                                      Gvij (β) =
                                          L                             (8)
                                       βK ij
   The vibrational communicability matrix is denoted by Gv . In the remain-
der of the paper we will assume β = 1 and K = 1, so that Gvij = L+
                                                                 ij .

 1   Detailed computations for formulae 5, 6 and 7 are reported in Appendix A.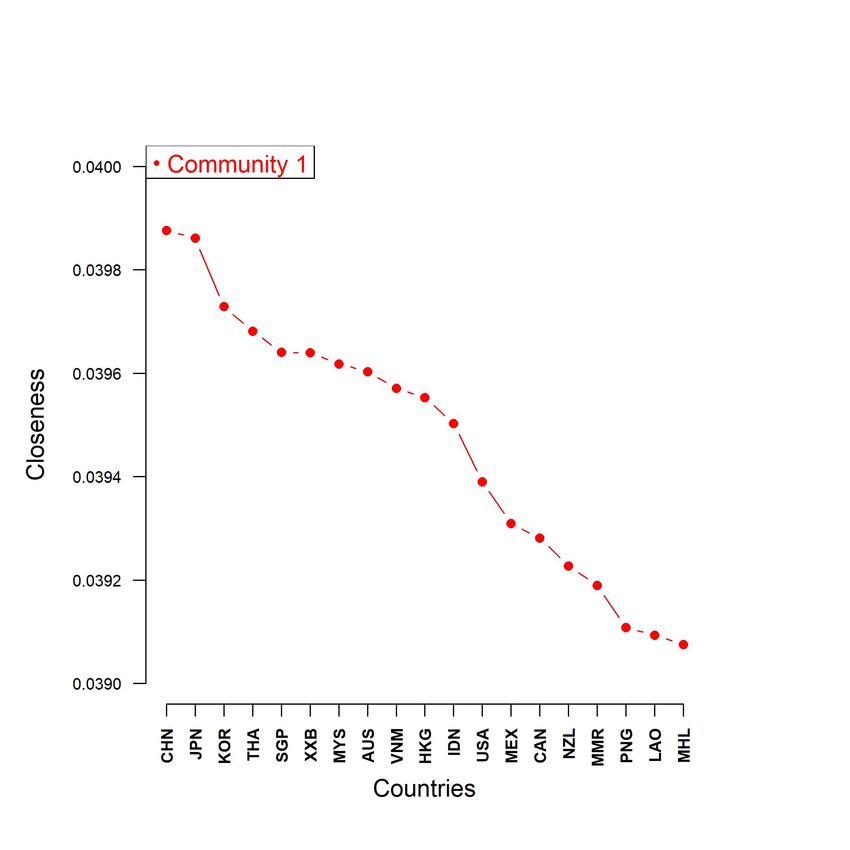
8                                                                  P. Bartesaghi et al.

4 Metrics on networks

Metric properties play an important role in the study of the structure and
dynamics of networks. The best known metric is the so-called shortest path
distance. In the literature other metrics have been defined, each one stressing
different features of the network. We remind the definitions of communicability
distance and resistance distance, in view of their following application to the
WTN.

4.1 Communicability Distance

The communicability distance ξij is defined as (see [19]):

                             ξij = Gii − 2Gij + Gjj .                              (9)

As already observed, Gii is the subgraph centrality of i and it measures the
amount of information that starts from and returns to node i after having
wandered through the network. On the other hand, Gij measures the amount
of information transmitted from i to j. Notice that the word information is
meant in its broadest sense. Therefore, information flow can be any kind of
flow along edges: money, current, traffic and so on. Thus, the quantity ξij
accounts for the difference in the amount of information that returns to the
nodes i and j and the amount of information exchanged between them.
    The greater is Gij , the larger the information exchanged and the nearer are
the nodes; the greater are Gii or Gjj , the larger the information that comes
back to the nodes and the farther are the nodes. In a matrix form, ξij can be
expressed as follows:

                              Ξ = guT − 2G + ugT
    where g = [G11 , . . . , Gnn ]T is the vector of subgraph centralities. Since ξij
is a metric, then Gii + Gjj ≥ 2Gij , i.e., no matter what the structure of the
network is, the amount of information absorbed by a pair of nodes is always
larger than the amount of information transmitted between them.

4.2 Resistance Distance

The vibrational communicability distance between i and j is defined as (see
[23, 59]):

                             ωij = Gvii − 2Gvij + Gvjj .                          (10)
    Formula 10 can be written in a more suitable way. Indeed, recalling that
Gvij = L+
        ij , we have: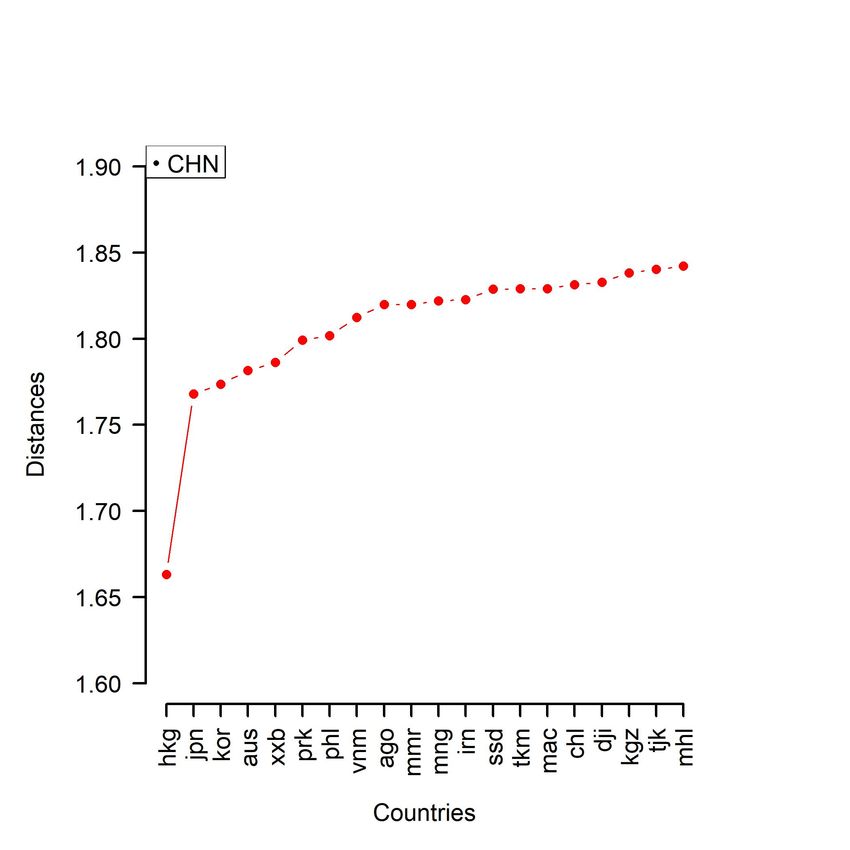
Communicability in the World Trade Network                                               9

                 ωij = L+      +     +
                        ii − 2Lij + Ljj

                     = (ei − ej )T L+ (ei − ej )
                                    "         −1       #
                                  T         1         1
                     = (ei − ej )     L+ J         − J (ei − ej )                     (11)
                                            n         n
                                             −1
                                          1
                     = (ei − ej )T L + J          (ei − ej )
                                          n
    where ek , k = 1, . . . , n, is the standard basis in Rn and J = uuT is the
matrix whose entries are all 1. Note that in the previous chain of equalities we
                                                                                −1
made use of the following expression of the pseudo-inverse L+ = L + n1 J            −
1
n J, proved  in [37].
    Equation 11 offers an interesting interpretation in the networked system.
We synthesize here the idea of this interpretation, referring to the Appendix
B for a more detailed discussion. Let v = [v1 , v2 , . . . , vn ]T be a vector repre-
senting the attributes of the nodes – for instance, the Gross Domestic Product
(GDP) of a Country or the assets of a financial institution – and suppose the
                                                                          −1
existence of a flow of currents in the network. The operator L + n1 J          allows
to obtain the state vector on the nodes starting from this flow vector. In our
case, we want a flow equal to +1 from node i, a flow equal to −1 into node
j and a flow equal to 0 for the other ones. The inner product with (ei − ej )
of formula 11 gives vi − vj , namely, the difference between attributes of nodes
i and j. This gradient produces exactly the flow +1 from node i and −1 to
node j. If vi − vj is big, we need a big difference in order to produce such a
unit flow and so we have a big resistance between nodes i and j. If vi − vj is
small, it is enough a low difference in order to produce such a unit flow and
so we have a low resistance between nodes i and j. If ωij is big we have a
high resistance distance between i and j. Therefore, these two nodes do not
communicate easily. Vice versa a low value of ωij means a high level of com-
munication between the nodes. ωij is called effective resistance between nodes
i and j. and Ω = [ωij ] is the resistance matrix.
    In the literature, it is known an important close form for L+ in terms of
Ω:

                              1 1                 1
                      L+ =          (ΩJ + JΩ) − 2 JΩJ − Ω
                              2 n                n
   which allows us to rewrite the diagonal elements of the matrix L+ in a
useful form2
                                        1X        R
                                L+
                                 ii =       ωij − 2
                                        n j      n

 2  L+     1           1            1            1         1 P
     ii = 2n (ΩJ)ii + 2n (JΩ)ii − 2n2 (JΩJ)ii − 2 (Ω)ii = 2n
                                                                            1 P
                                                               j ωij Jji + 2n   j Jij ωji −
 1  P                      1 P          1 P         1   P          1  P         R
2n2
         J   ω J
       jk ij jk ki − 0 =  2n
                                ω
                               j ij  + 2n
                                             ω
                                            j ij − 2n2
                                                            ω
                                                         jk jk  =  n
                                                                          ω
                                                                         j ij − n2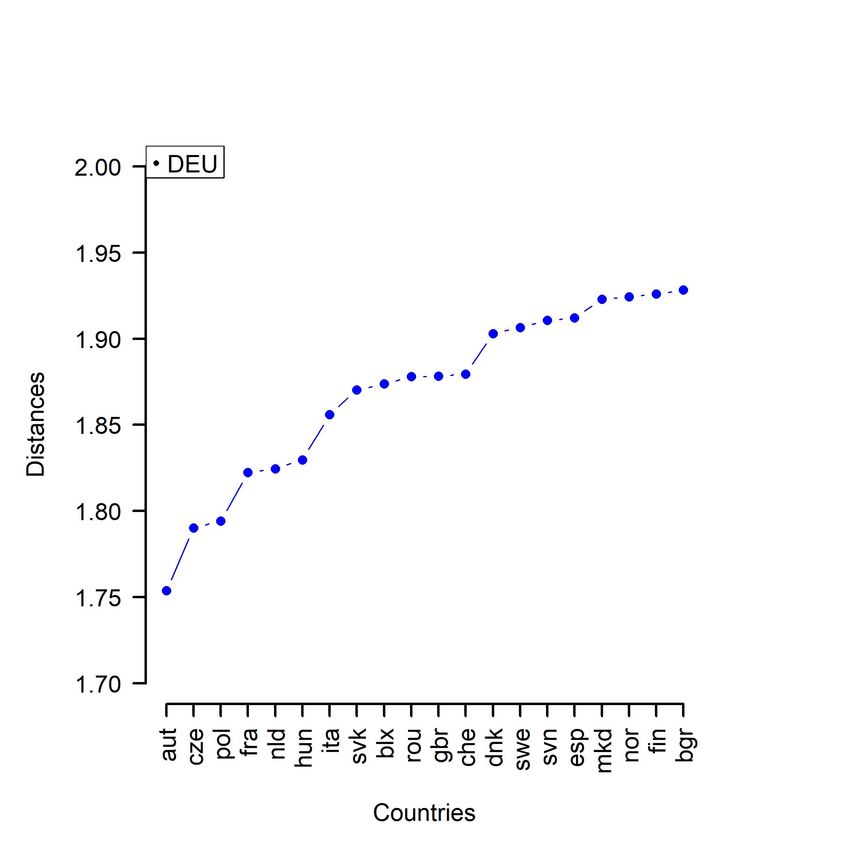
10                                                                P. Bartesaghi et al.

     where

                       n    n                           n−1
           1X         X    X         1 T           +
                                                        X 1
        R=      ωij =           ωij = u Ωu = n tr L = n
           2 ij       i=1 j=i+1
                                     2                      µk
                                                                    k=1

    is the effective graph resistance (or Kirchhoff index ) of the network, i.e. the
sum of the resistances between all possible pairs of nodes in the graph (see,
e.g., [40]). R reflects the overall transport capability of the network: the lower
R, the better the network conducts flows. In particular, it has been shown that
this index is able to catch the vulnerability of a connection between a pair of
nodes and, therefore, it is a suitable tool for assessing the ability of a network
to well react when it is subject to failure and/or attack (see [11, 18, 61]).

     Additionally, the relevance of a node can be quantified by exploiting the
effective resistances. Indeed, the best spreader (or best connected)
                                                               Pn       node in the
network is the node i? that minimizes the the quantity j=1 ωi? j = (Ωu)i? ,
i.e. the sum of all resistances between itself and any other node in the net-
work. Since L+  ii equals the difference between the average resistance between
node i and all the other nodes in the network and the overall network’s mean
resistance, then the best spreader node i? is the one such that L+                +
                                                                         i? i? ≤ Ljj
               ?           ?
for any j 6= i . Node i can be regarded as the best diffuser of a flow to the
rest of the network, and, to some extent, it is the most influential with respect
to a diffusion process inside the network, since it guarantees the highest flow
toward other nodes (see [59]). The reciprocal of L+    ii can then be regarded as a
centrality measure of a node and it is called vibrational centrality. Best diffuser
means that most of the information coming out from this node is absorbed by
other nodes. If L+  ii is big, then most of this information comes back to node i
and doesn’t reach other nodes.

5 Community detection based on communicability metrics

5.1 The model

As discussed in the previous section, ξij = Gii − 2Gij + Gjj and ωij = Gvii −
2Gvij + Gvjj represent the two metrics induced on the network by the Estrada
communicability and the vibrational communicability, respectively.
    In an economical context, referring to the international trade network,
they measure how well two countries, or companies, communicate in terms of
commercial and trade exchanges. For instance, the attributes on nodes may
be identified with the GDP and the currents along nodes with the total trade
or money flow between two countries. Information on the network may be
replaced by money flow. Therefore the quantity ξij of equation 9 accounts for
the difference in the amount of money flow that returns to the nodes i and j
and the amount of money flow exchanged between them. The bigger is Gij ,
Communicability in the World Trade Network 11
i.e. the money flow exchanged, the nearer are the nodes; the bigger are Gii
or Gjj , i.e. the amount of money flow that comes back to the each node, the
farther they are.
A similar interpretation holds for ωij . In a trade network ωij accounts for
the difference between the mean resistance to export a given money flow from
each country and the correlation between them. The bigger is Gvij , the more
interconnected they are and the nearer they are in the resistance metric; the
bigger are Gvii and Gvjj , the more isolated they are in the network and between
them and the farther they are.
We formulate our proposal in light of these observations. In what follows,
we will refer to the communicability distance ξ, but similar arguments may be
repeated identically for the resistance distance ω.
We consider members of the same cluster nodes whose mutual distance is
below a given threshold ξ0 . Specifically, we construct a new community graph
where the elements of the adjacency matrix M = [mij ] are given by:
1 if ξij ≤ ξ0
mij =
0 otherwise
with ξ0 threshold distance such that ξ0 ∈ [ξmin , ξmax ], being ξmin and
ξmax the minimum and the maximum distances between couples of nodes,
respectively. In this way, clustered groups of nodes that strongly communicate
emerge, in dependence of the threshold. If ξ0 is high enough, all nodes in the
network are at a mutual distance lower than the threshold and the whole net-
work behaves like a unique community. As ξ0 decreases, there will be nodes too
far, such that to be considered disconnected or members of different clusters,
and we witness the emergence of islands of still connected nodes.
Hence, the number of communities depends on the threshold, precisely it
increases as ξ0 decreases. It is important to observe that the proposed method
cannot choose any a priori optimal number of communities. Rather, as the clas-
sic Girvan-Newman approach [46], the optimal partition, and the correspond-
ing threshold, are chosen according to the following optimization problem for
the modularity Q as a function of ξ0 :
1 XX si sj
max (wij − ) xij
ξ0 ∈I S i j S
subject to
−xij + xik + xjk ≤ 1, ∀i < j < k, i, j, k ∈ V
−xik + xjk + xij ≤ 1, ∀i < j < k, i, j, k ∈ V
−xjk + xij + xik ≤ 1, ∀i < j < k, i, j, k ∈ V
xij ∈ {0, 1}, i < j, i, j ∈ V
where xij are binary variables equal to 1 if two nodes are in the same cluster
and 0 otherwise, and S is total strength of the network. It is worth noting that
the modularity function is computed on a nodes partition emerging through
the community graph, in dependence on the threshold ξ0 . The best partition12 P. Bartesaghi et al.
of the network in communities will be identified with the one which maximises
the modularity function Q.
The pseudocode defining the proposed methodology will be better described
in the next section.
5.2 An illustrative example
We start by testing our methodology on a simple example. Let us consider the
weighted undirected network in Figure 1. The network has 10 nodes and 32
edges. The thickness of links is proportional to weights. The network allows
to easily identify two natural communities, which are highlighted by the two
closed lines containing nodes 1 to 5 (on the left) and nodes 6 to 10 (on the
right).
Fig. 1 A weighted undirected network with 10 nodes and 32 edges. Edges’ weights have
been randomly sampled with replacement from integers between 1 and 6. The thickness of
edges is proportional to the weights. Nodes of two relevant communities are highlighted in
blue and red.
We compute the Estrada communicability matrix G, then we get the com-
municability distance matrix Ξ. The nearest nodes are 1 and 3 with a com-
municability distance equal to ξmin = ξ13 = 1.18 and farthest nodes are 3 and
6 with a communicability distance equal to ξmax = ξ36 = 1.49. Figure 2 sum-
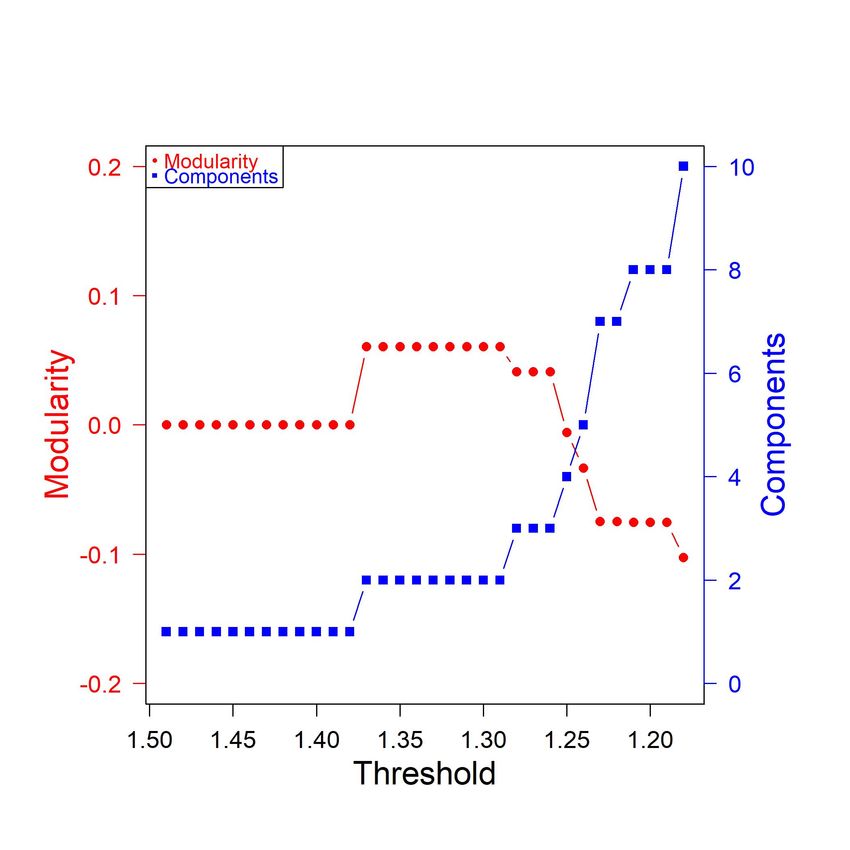
marizes the number of communities identified for alternative thresholds. The
blue line represents the number of communities while the red line represents
the value of modularity of the corresponding partition. When the threshold is
equal to 1.38 all nodes are connected and the network is partitioned in a sin-
gle community with modularity Q = 0. As the threshold decreases below 1.38,
the network begins to split into disconnected components. When the threshold
becomes lower than the minimum distance, the network is partitioned into ten
communities, namely, each node belongs to a different community. The best
partition according to the maximum modularity criterion splits the network
into two clusters, which are easily identified with the two expected naturalCommunicability in the World Trade Network 13
communities. The composition of the communities for alternative thresholds
is reported in Figure 3. It is noticeable that, lowering the threshold, the proce-
dure allows to disentangle tightest relationships. For instance, when ξ0 = 1.23
only nodes connected by edges with highest weights are kept in the same
community.
Fig. 2 Modularity of the partition and number of components (on the secondary scale) for
different thresholds. The communicability distance has been used for the identification of
the communities.
Similar results are derived applying the procedure based on the vibrational
communicability. The nearest nodes are 2 and 5 with a resistance distance
equal to ωmin = ω25 = 0.29 and farthest nodes are 1 and 6 with a resistance
distance equal to ωmax = ω16 = 0.42. Again if we move the threshold from
the maximum distance to the minimum distance, we get an increasing number
of communities from 1, the whole network, to 10, isolated nodes. The best
partition according to the maximum modularity criterion splits the network
into the two expected communities, as shown in Figure 4.14 P. Bartesaghi et al. Fig. 3 Community structure at different thresholds. 6 Application to the World Trade Network In this Section, we apply the proposed model in order to detect relevant com- munities of countries in the WTN. As described before, the method aims at grouping countries on the basis of their distance in the network. Two alter- native distance functions will be tested. On the one hand, we find clusters exploiting communicability distance. Therefore we detect how much two coun- tries are close in the network considering all possible weighted walks between them. On the other hand, we select clusters by means of resistance distance. In this case countries are grouped together if they have a similar relevance in the network in terms of vibrational centralities as well as if they are correlated in terms of their expositions towards common countries. We start with a general description of the dataset and we provide main char- acteristics of the WTN. Then, we briefly summarize the main steps of the methodology also providing a pseudo-code. Finally, we report main results in terms of community structure with the related discussion. 6.1 Dataset and main characteristics of the WTN We refer to the World Trade Data, available on the Observatory of Economic Complexity database3 . The database has been developed by the Research and Expertise Center on the World Economy at a high level of product disaggrega- tion and it is based on original data provided by the United Nations Statistical Division (UN Comtrade). In particular, a harmonization procedure, that rec- onciles the declarations of exporters and importers, enables to extend consid- erably the number of countries for which trade data are available, as compared 3 The Observatory of Economic Complexity (OEC) is the world’s leading data visualiza- tion tool for international trade data. Data can be found at: https://atlas.media.mit.edu/en/
Communicability in the World Trade Network                                                15

Fig. 4 Modularity of the partition and number of components (on the secondary scale)
for different thresholds. The resistance distance has been used for the identification of the
communities.

to the original dataset. In this analysis, we refer to the last version published
in 2017, based on the Harmonized Commodity Description and Coding Sys-
tem, and that provides aggregated bilateral values of exports for each couple
of origin and destination countries, expressed in billion dollars. We focus on
the aggregated data of last available year, namely, 2016. Hence, we construct
a directed and weighted network (see figure 5), where each node is a country
and weighted links represent the amount of product trades between couple of
countries.
    The network is characterized by 221 nodes and 26197 links. Its density is
approximatively 0.539: on average, each country has trades with more than
a half of the entire network. The system is strongly connected. However, the
network is not regular and is far from being complete or, in other words, most
countries do not trade with all the others, but they rather select their partners.
Furthermore, main trade flows tend to be concentrated in a specific sub-group
of countries and a small percentage of the total number of flows accounts for a
disproportionally large share of world trade. For instance, the top 10 countries
export more than 50% of the total flow. The maximum weight corresponds to
the channel from China to USA and its value amounts to 436 billion dollars.
Minimum, non null, weights are involved in the trade between a number of very
16 P. Bartesaghi et al.
Fig. 5 WTN based on 2016 data. Nodes are countries and directed links are product trades
between pair of countries. The size of the node is proportional to its strength.
small countries, far from each others, and they are approximatively around 1
thousand dollars. A first insight in the structure of the WTN is given by the
total strengths, in and out, of the nodes, which are the natural extension of
the degree centrality to the case of a weighted and directed network. In this
context, the in-strength sin
i measures the total trade flows incoming to the
country i, that is the import. The out-strength sout
i measures the total trade
flows outgoing from the country i, that is the export. They can be calculated
by formulas 1 and 2. We observe a strict relation between in and out strength
distribution with a Spearman correlation coefficient equal to 0.956. Hence,
countries are ranked in a very similar way in terms of in and out strength.
However, it is worth pointing out the presence of specific countries with a
balance of trade significantly different from zero (see, for instance, GBR and
KOR in Table 1 characterized by a negative and positive balance of trade,
respectively.)
Strength
Ranking In Out Total
1 USA CHN CHN
2 CHN USA USA
3 DEU DEU DEU
4 GBR JPN JPN
5 JPN KOR FRA
6 FRA FRA GBR
7 HKG ITA KOR
8 NLD NLD NLD
9 ITA MEX ITA
10 CAN GBR MEX
Table 1 Rankings of top ten countries in terms of strength (in, out and total, respectively.)Communicability in the World Trade Network 17
6.2 Summary of the methodology
We summarize the main steps of the methodology we are proposing. Main steps
are listed in the following pseudo-code. The code has been written taking into
account the communicability distance matrix Ξ, but the same procedure can
be easily applied by considering the resistance matrix Ω.
1. let G be the original directed weighted network with n nodes and with a
weighted adjacency matrix W;
2. symmetrise and build the undirected weighted network G1 with weighted
adjacency matrix: W1 = 12 (W + WT );
3. normalise and build the undirected weighted network G2 with weighted
adjacency matrix: W2 = S−1/2 W1 S−1/2 ;
4. construct the distance matrix Ξ based on the communicability distance;
5. define the threshold interval [ξmin , ξmax ], where ξmin and ξmax represent the
minimum and the maximum communicability distances between couples of
nodes, respectively. Set ξh = ξmin , with h = 0.
6. define a n × n matrix Mh = [mij ] such that
1 if ξij ≤ ξh and i 6= j
mij = ;
0 otherwise
7. build the undirected unweighted network G3,h from the binary adjacency
matrix Mh ;
8. select the partition Ph given by the components of the network G3,h ;
9. define Vh the set of isolated nodes in G3,h and set G2,h = G2 ;
10. if the set Vh is not empty, execute the following steps (a-f), otherwise skip
at step 11;
a) let H2,h be the subgraph of G2 induced by nodes that belong to Vh ;
b) delete from both G2,h and G3,h the nodes belonging to Vh and all their
connections;
c) add the subgraph H2,h to G2,h ;
d) set all the non-null weights of the graph H2,h equal to 1;
e) add the subgraph H2,h to G3,h ;
f) select the partition Ph given by the components of the new network
G3,h ;
11. compute the modularity of the network G2,h with respect to the partition
Ph ;
12. set the number of iterations r, compute k = ξmax −ξ r
min
, set ξh = ξh−1 + k
and h = h + 1 and repeat steps 6-11 until ξh ≤ ξmax ;
13. select the optimal partition Ph? as the partition Ph that provides the max-
imum modularity.
We highlight some key points of the methodology we are proposing. We
aim at clustering countries on the basis of a specific distance. Varying the
threshold we can disentangle the role of very tight relationships between cou-
ples of countries.18 P. Bartesaghi et al.
However, reducing the threshold distance a great number of isolated nodes
may appear. They are typically very small countries whose trade volume is
very low and whose commercial partners are few. They play a marginal role
in the WTN and they do not affect in a significant way the structure of the
network in terms of relevant communities. Nonetheless they contribute a lot
to determine the modularity, since any isolated node in a partition tends to
reduce its value. A great number of isolated nodes together with an almost
completely connected giant component produce immediately negative values
of modularity, preventing us from applying the maximum modularity crite-
rion. In order to fix this problem, we propose to consider all the isolated nodes
as members of a single distinct community. On one hand, this choice does not
affect significantly the analysis of the core of the WTN and, on the other hand,
it allows to apply the maximum modularity criterion.
The treatment of isolated nodes regards step a-f of the procedure summarized
before. In particular, we first identify isolated nodes in the binary network
G3,h . We extract from the original network G2 the subgraph H2,h induced
by nodes that are isolated in G3,h , In this way, we preserve the connections
between these nodes observed in the original network. We build then two fic-
titious networks G2,h and G3,h where isolated nodes and their connections are
replaced by the subgraph H2,h . Since G3,h is an unweighted network, we set
all positive weights equal to 1. In this way we can compare the network G2,h
with a partition, extract from G3,h , in which the isolated nodes are already
well identified and collected into a single cluster (or a few clusters if the case).
6.3 Results
We initially applied the methodology described in Section 6.2 considering the
communicability distance. The rationale for using the communicability metric
on the WTN is the following. Two countries share a total volume of trade
because they exchange a given set of products, of any kind. But they can be
linked even if they don’t exchange each other a given product, that is there
is no direct flow of such product between them. A higher order exchange may
occur between them. For instance, a country A exports some raw materials
- let’s say, iron - to a country B; country B produces mechanical parts from
iron and exports them to country C. A and C communicate via a higher
order walk and they depend on each other even if the two countries are not
neighbours in the network. Communicability takes into account precisely all
possible weighted walks between two nodes.
Therefore, we calculate the communicability matrix G on the normalised
network G2 and the corresponding communicability distance matrix Ξ. Using
this metric, we find that the nearest countries are USA and Canada with a dis-
tance ξmin = 1.242 and the farthest countries are USA and Seychelles Islands
with a distance ξmax = 1.470. For each value of the threshold distance between
minimum and maximum, we look at the corresponding partition in commu-
nities. In Figure 6, we plot the value of modularity (in red) and the numberCommunicability in the World Trade Network 19
of communities (in blue), counting each isolated node as an independent one.
Both values are expressed as functions of the threshold ξh . The maximum of
modularity (equal to 0.27) is reached at a threshold distance ξh = 1.38. It
corresponds to 21 communities, where the last one collects all the isolated
nodes.
Fig. 6 Modularity (circular red dots) and number of communities (square blue dots) as
functions of the threshold communicability distance ξh
.
We display in Figure 7 countries constituent the optimal partition and we
list in Table 2 the five top biggest communities in terms of number of countries
(excluding the one that groups isolated nodes).
Going deeper into the composition of the communities, community 2 (in
blue) includes almost all continental European countries, with Great Britain
and Ireland. This community acts on the screen of the global network as
single player. It is worth pointing out also the presence of Morocco, confirming
positive effects of bilateral trade agreements (see, e.g., [58]). As opposed to this
community, we see the biggest community 1 (in red) which sees United States
and China as main actors. This means that in Europe there are preferential
channels of internal exchanges, whereas, outside Europe, most communication
channels seem to be polarized around the exchange channel between China and20 P. Bartesaghi et al.
Fig. 7 Optimal community structure based on communicability distance. Results have been
derived by means of a maximum modularity criterion, with threshold ξh = 1.38 (Max Mod
Partition). Isolated nodes appear in white.
the US and all their satellites countries. Moreover, in Europe we can recognize
two other well-identified and coherent communities: Scandinavian and Baltic
countries (community 3 in cyan) and the countries of the former Yugoslavia
(community 4 in green). Finally, an independent role is acknowledged to the
community of the countries of the Russian federation (community 5, in olive).
Although a positive trade balance and a priority of Russian government of
an increasing participation in the economic relations of Asia-pacific region
(see [42]), at moment, results show preferential channels with border countries.
Size Members
Community 1 19 AUS CAN CHN HKG IDN JPN KOR LAO
MEX MHL MMR MYS NZL PNG SGP
THA USA VNM XXB
Community 2 16 AUT BLX CHE CZE DEU ESP FRA GBR
HUN IRL ITA MAR NLD POL PRT SVK
Community 3 7 DNK EST FIN LTU LVA NOR SWE
Community 4 5 BIH HRV MNE SRB SVN
Community 5 4 BLR KAZ RUS UKR
Table 2 Members of the top five communities in terms of number of countries.
If we reduce the threshold, we let very strong channels of communication
between countries emerge. For instance, Figures 8 and 9 show the community
structure lowering the threshold distance (equal to ξ0 = 1.36 and ξ0 = 1.34,
respectively). Moving from 1.38 to 1.36 some loose connections are lost. Great
Britain and Ireland split up from community 2 creating a separate clusterCommunicability in the World Trade Network 21
together. The South East Asian (in violet) and former Yugoslavia (in green)
disintegrate, Australia goes out from community 1, and the strong community
in the South of Africa loses some country. Reducing further the threshold to
1.34, only the most closely interrelated communities survive. China discon-
nects from USA, but North America (in red) still behaves as a single cluster.
In Europe only few inseparable relations are saved, like Spain and Portugal
or Belgium, Luxembourg and Holland (in blue). Other strong links are re-
vealed, for instance, between Brazil and Argentina, between China and Japan
or between Israel and Palestine.
Fig. 8 Intermediate Connected Community Structure - ξh = 1.36
A significant feature of our approach is the fact that it allows to get deeper
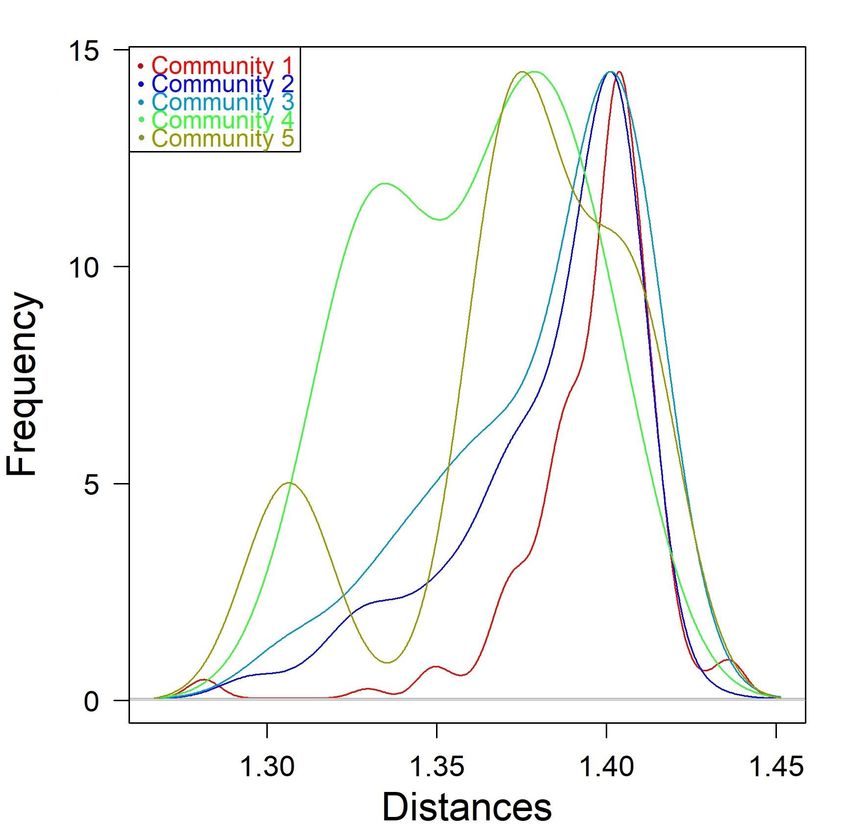
insight into the internal structure of each community and to give a measure of
the mutual relationships between communities. Let us refer now to the clusters
depicted in Figure 7 and detected with the maximum modularity criterion. In
this regard, we display in Figure 10 the distributions of the communicabil-
ity distances between pair of countries that belong to the same community.
In particular, we compare the distributions for the five relevant communities
listed in Table 2
If we focus, for instance, on community 1 and 2, we can inspect and com-
pare their internal structure by providing some synthetic indicators in Table
3. From the analysis of the values shown in Table 3, we can say that the
community 2 (Europe) is more compact than the community 1 (USA-China)
since in the former the average intracluster distance is slightly lower than in
the latter. Although community 2 shows a bigger minimum intracluster dis-
tance, countries appear to be somehow more homogeneous than countries in
community 1. This is partially related to the geographical distribution of the
countries inside the communities. Inside the community 2, countries are all lo-22 P. Bartesaghi et al.
Fig. 9 Top Connected Community Structure - ξh = 1.34
cated in Europe except Morocco, which remains incorporated in the European
community due to its strong commercial connection with the Mediterranean
countries also thanks to the preferential agreements in force (see, e.g., [26]).
Last column of Table 3 provides the same indicators computed on intercluster
basis. This analysis allows to provide additional information in terms of het-
erogeneity in the group and between groups. Main results show high similarity
between the two top communities (the average intracluster distances are 1.41
and 1.40, respectively). It is worth pointing out the lower intercluster stan-
dard deviation. It means that couple of countries that belong to a different
community has a similar distance between them.
Intracluster Intercluster
Community 1 Community 2 Community 1 vs 2
Number of Components 19 16
Mean Distance 1.41 1.40 1.42
Min Distance 1.24 1.33 1.39
Closest Countries USA-CAN NLD-BLX HKG-CHE
Max Distance 1.47 1.43 1.46
Furthest Countries USA-LAO DEU-MAR USA-SVK
Standard Deviation 0.030 0.022 0.009
Table 3 Intercluster and Intracluster characteristics of the distributions of communicability
distances. Columns Community 1 and Community 2 refer to the intracluster properties of
the two main detected communities, in terms of number of components. Last column reports
the corresponding intercluster properties computed between the same two communities.
It is noteworthy that additional insights can be provided by assessing the
relevance of each country in the community. Indeed, communicability distance
matrix provides a metric on the network and on each subnetwork, like a com-Communicability in the World Trade Network 23
Fig. 10 Distributions of Communicability Distances between countries of the some com-
munity. We display only the distributions related to the five main communities summarized
in Table 2
munity. Therefore, we adapt the idea of closeness to our context, by providing
the following communicability closeness to assess how effectively a node is sup-
posed to spread trade flows through the network. Similarly to the definition
of closeness, we define the communicability closeness as:
1
Ci = P (12)
j∈C ξij
where the sum is over all the internal nodes of the cluster C to which the
node i belongs.
To this end, we rank in Figure 11 countries of community 1 and commu-
nity 2, respectively, on the basis of values of Ci . Concerning community 1, it
is worth to stress that the centre of this community is located in China, Japan
and South Korea and not in the North American sub-community. The three
Asian nations are nowadays major traders and their high-level economic coop-
eration has been strengthened also because of the speed-up of the negotiations
on the trilateral Free Trade Agreement. The three parties unanimously agreed
to further increase the level of trade and investment liberalization based on
the consensus reached in the Regional Comprehensive Economic Partnership24 P. Bartesaghi et al.
Agreement4 .
According to cluster 2, it is noticeable the central role that Germany plays in
Europe. France has the second position and other countries like Great Britain,
Italy, Spain, Benelux and Netherlands show similar relevance. Most central
countries are the main economies of the European Union. As shown in [13],
these countries are the core group of the network.
Fig. 11 Values of communicability closeness Cµ of each country inside community 1 and
2, respectively.
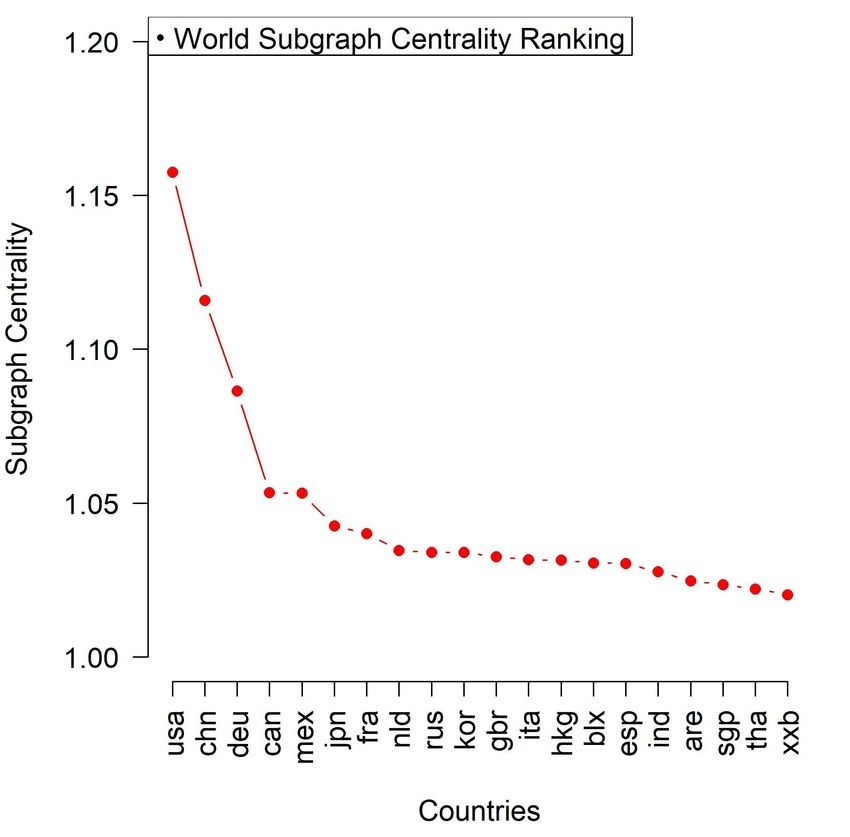
Moreover, it is interesting to see that most central country in a commu-
nity has not necessarily the same relevance on the whole network. We have
indeed that, in terms of subgraph centrality, when we deal with the whole
network (see Figure 12), USA appears as the key player followed by China
and Germany. This ranking is inline with the top three provided by the World
Trade Organizations [64] in terms of World’s leading traders of goods and
services [64].
Additionally, it is interesting to highlight that the relevance of countries re-
ported in Figure 12 is consistent with the Economic Complexity Index (ECI),
introduced by [38]. The ECI allows to rank countries in the WTN according
to the diversification of their export flows, which reflects the amount of knowl-
edge that drives their growth. The higher is the ECI, the more advanced and
diversified is an economy. In particular, countries whose economic complexity
is greater than expected (on the basis of their global income), tend to grow
faster than rich countries with a low ECI. In this perspective, ECI represents a
suitable tool for comparing countries in the WTN independently of their total
4 See "Fifteenth Round of Negotiations on a Free Trade Agreement among Japan, China
and the Republic of Korea", April 12, 2019, , Ministry of Foreign Affairs of Japan and Free
Trade Agreement (FTA) and Economic Partnership Agreement (EPA), 4 November 2019,
Ministry of Foreign Affairs of JapanCommunicability in the World Trade Network 25
Fig. 12 World top 20 countries according to subgraph centrality rankings
output and it has been extensively validated as a relevant economic measure
by showing its capability to predict future economic changes and to explain
international differences in countries incomes.
Although the network we analysed in the present work is based on the total
output and this fact prevents us from comparing directly their values with the
ECI for a given country, there is a positive correlation between them. All the
top 20 countries in Figure 12 show a positive and high value of ECI. More
specifically, they kept a high value of ECI during the years preceding the year
to which the network refers (2016) and this can justify the high value in the
aforementioned centrality measures.
Finally, from the point of view a single country, it is worth to look for the
closest trade partners, that is the nearest nodes in terms of communicability
distance. Figures 13 show the distance profiles for the most central country of
community 1 and community 2, respectively. For instance, looking at Figure 13
(right-hand side), we can notice countries, as Austria, Poland, Czech Republic
that are characterized by a condition of strong dependence on Germany, that
is a major player in the network. Similarly Figure 13, left-hand side, shows
how strong is the commercial relationship between China and Hong Kong,
also as a result of the trade agreements between the two countries, like CEPA
(Closer Economic Partnership Arrangement) aimed at eliminating duties on
large categories of products. For the Chinese trade market Hong Kong plays a
crucial role since foreign companies use Hong Kong as a springboard to invest
in China thanks to its infrastructure network that has no equal in the world,
investor protection, transparent and efficient judicial system, legal certainty.26 P. Bartesaghi et al.
Fig. 13 Top 20 nearest countries for China (left) and Germany (right)
6.3.1 Results in terms of resistance metric
The methodology described in Section 6.2 has also been applied using the
resistance distance ω. In this case, we consider the total trade of a given
country as flows of the global wealth that has been produced during a year.
Therefore, the Gross Domestic Product (GDP) is the attribute of interest on
each node. In this regard, the effective resistance of an edge expresses how
easily (or not) a unit flow moves from a country to another one, i.e. how
easily two countries trade a unit of wealth, independently of its nature. It is
noteworthy that, according to formula 10, the resistance distance between a
pair of countries depends on the values of the vibrational centralities of both
countries and on the value of their mutual connections.
Therefore, we construct the vibrational communicability matrix Gv on the
normalised network G2 , and the corresponding resistance distance matrix Ω.
Using this metric, we find that the nearest countries are, again, USA and
Canada with a distance ωmin = 1.53 and the farthest countries are USA and
Germany with a distance ωmax = 2.24. For each value of the threshold dis-
tance between minimum and maximum, we obtain the corresponding partition
in communities. The maximum modularity partition corresponds to 16 final
communities, where, as before, isolated nodes have been grouped all together
in the same community. The value of modularity for this partition is Q = 0.31.
In Figure 14, we plot the value of modularity in red and the number of commu-
nities, counting each isolated node as an independent one, in blue as functions
of the threshold ω0 . The maximum of modularity is reached at a threshold
distance ω = 1.85. Main results in terms of geographical distribution are dis-
played in Figure 15 and, as in the previous Section, we summarize in Table 4
main composition of top communities in terms of number of constituents.
With respect to results based on communicability, we have that the first
community has a larger number of countries (equal to 66). Additionally, theCommunicability in the World Trade Network 27
Fig. 14 Modularity (red line) and number of communities (blue line) as functions of the
threshold resistance distance. Maximum modularity is observed for ω = 1.85
larger community includes again main asian and oceanian countries but North
America behaves as a separate cluster. This result is in line with the liter-
ature that emphasizes the interesting economic relation between Asia and
Oceania. Several works showed that the Asia-Oceania community collapsed
after China entered the WTO in 2001 and built strong trade relationships
with other communities, especially with the external cores, (i.e. the United
States and Germany). China then became regionally attractive and restored
the Asia-Oceania community as the community leader after it gained a signif-
icant portion of trade globally (see, e.g., [65]).
Similar results to the communicability case are observed for the main Euro-
pean community. However in this case, Great Britain and Ireland provide a
separate group and Italy and Morocco are isolated countries.
It is worth pointing out that communities detected above represent groups
of countries showing a positive correlation in their trade strength, whereas
members of different clusters show a negative correlation. Being strongly an-
ticorrelated means that when the total trade deficit of a country grows, the
total trade surplus of a second country grows too. For instance, Japan and USA
have been classified in different communities by the methodology. Indeed, inYou can also read