Municipality of Wawa Housing Need and Demand Study February 2017 - Economic Development Corporation of ...
←
→
Page content transcription
If your browser does not render page correctly, please read the page content below
Municipality of Wawa

                                              Housing Need and Demand Study
                                                              February 2017

Funding Provided By The Province of Ontario

                                                                     1|Page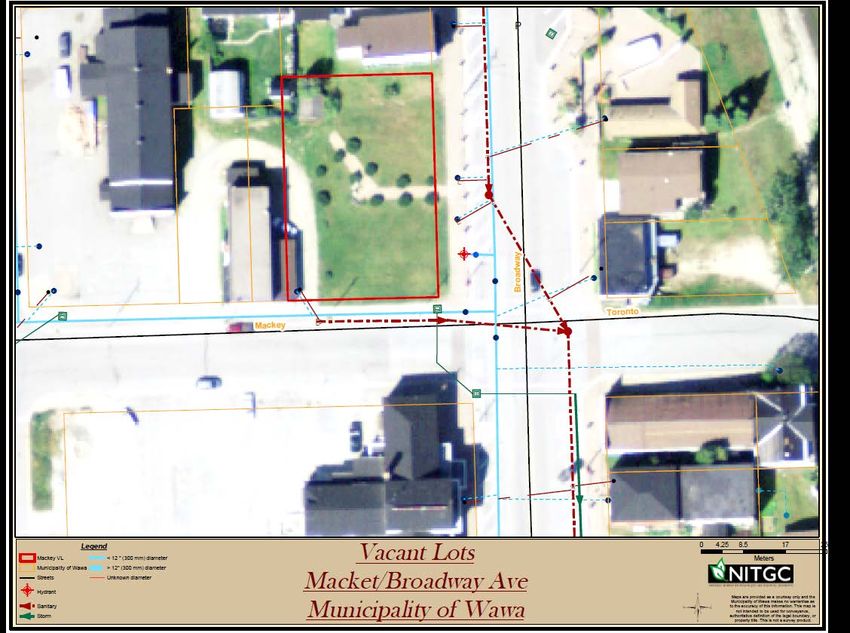
ACKNOWLEDGEMENTS
Thank you for your assistance and support in the development of this study. Thank you very
much to Maury and her staff who assisted in gathering information for the development of this
study.

Mayor Ron Rody
Christopher Wray
Maury O’Neill

We would also like to thank the Ministry of Northern Development and Mines for funding the
study.

Key Stakeholders
Thank you to the many community members and staff of the following organizations who
provided input and insight in the development of this plan.
Mayor and council members
Landlords
OPP
Ms. Ogilvie at Lady Dunn Hospital;
Community Health Agencies
Regional Employment Health Centre
Government agencies
Lisa Krug, ADSAB

                                                                                     2|Page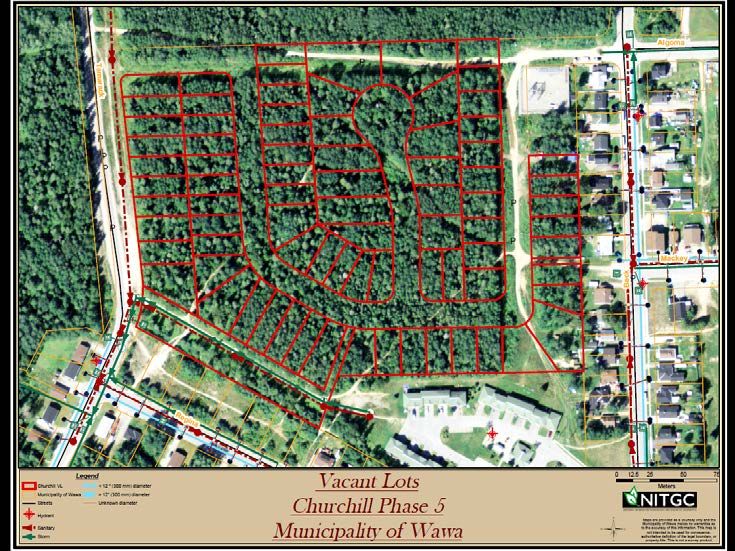
TABLE OF CONTENTS

1.0 Executive Summary                …………………………………………………..5
2.0 Introduction                     …………………………………………………..6
            2.1 What is Need and Demand? …………………………………………….7
            2.2 Approach             .………………………………………………….8
            2.3 What is Housing Continuum? ………………………………………….9
            2.4 What is Affordability? ……………………………………………...10
3.0   Existing Legislation and Policy Framework ……………………………...12
            3.1 Ontario Planning Act      ……………………………………………..12
            3.2 The Strong Communities Through Affordable Housing Act ………………..12
            3.3 Provincial Policy Statement …………………………………………12
            3.4 Provincial Growth Plan for Northern Ontario, 2011 ……………………….13
            3.5 Ontario Municipal Act 2001 …………………………………………14
            3.6 Ontario Development Charges Act, 1997 ……………………………….14
            3.7 Local Official Plans and By-laws ………………………………….......14
            3.8 Building Code Act …….……………..…………………………....17
            3.9 Other Legislation      ...………………………………………………17
            3.10 Additional Documents affecting housing ……………………………….18
            3.11 Legislation Summary ………………………………………………..18
4.0    Community                        ………………………………………………..19
            4.1 Location                ………………………………………………...19
            4.2 Economic Scan           ….………………………………………….....20
            4.3 Community Profile       ………………………………………………..21
5.0     Housing Market                 ………………………………………………..23
            5.1 Household trends       ………………………………………………..23
            5.2 Housing types           ………………………………………………..24
            5.3 Rental Market           ………………………………………………..25
            5.4 Home ownership          ………………………………………………..27
            5.5 Affordability           ………………………………………………..27
            5.6 Land Assessment         ………………………………………………..30
6.0    Community Services              ………………………………………………...34
7.0    Community Housing Survey, Consultations, and
         Key Stakeholder Interviews             ………………………………………..34
            7.1 Community Housing Survey Summary ………………………………34

                                                                         3|Page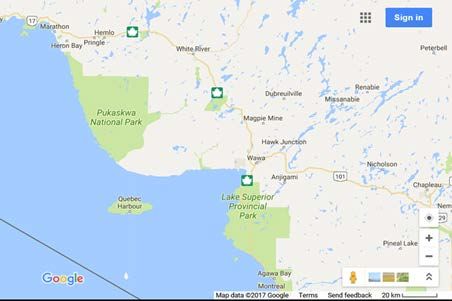
7.2                                 ……………………………..37
               Summary of Consultations, and Interviews
8.0 Population Forecasts               …………………………………………….38
         8.1 Existing households       …………………………………………….38
         8.2 Emerging Housing Need     ……………………………………………..39
         8.3 Population Forecast       ……………………………………………..40
         8.4 Future Housing Supply     ……………………………………………..41

9.0 Housing Issues and Gaps       ……………………………………………..42
10.0 Recommendations              ……………………………………………..44
          10.1 Short-Term         ……………………………………………..44
          10.2 Long-Term          ……………………………………………..45
11.0   Implementation of the Plan ……………………………………………..49
12.0   Conclusion                 ……………………………………………..50
13.0   References                 ……………………………………………..53
14.0   Appendix A - Housing Survey ………………………………………….54

                                                          4|Page
1.0 EXECUTIVE SUMMARY
Housing is one of the most fundamental human needs and access to safe, affordable and adequate
housing affects almost every aspect of a community and its residents. It contributes to the
creation of complete and more economically viable communities. The provision of a range
housing options allows families and individuals of all income levels to find a place to call home.
This is especially true for retaining and attracting residents in the face of economic cycles which
trend up or down over time. Expanding the availability of housing and improving affordability
will help to strengthen community investment and improve quality of life, both for existing and
new residents.
Over the years, the Town of Wawa has experienced economic cycles of growth and decline,
which have had an impact on the community and in particular housing needs.
This study completed an overview of the provincial planning context and the specific
components as they relate to the local housing plans. A review of the housing continuum
assessed the available options in Wawa and considered the many factors that impact housing
conditions including the geography, economic conditions and affordability.
The plan examines populations including, an aging population, the number of individuals in each
cohort, and income.
The objective of the study was to identify the current housing situation in the community,
forecast the demand for affordable and supportive housing by type (single dwelling, apartments,
and transient) and by user group (e.g. seniors, industry) and recommend an approach to build
housing in the community.
The study has identified that there currently is no demand for family single detached, or semi-
detached units; however, there is a high demand for bachelor, 1 and 2 bedroom units for seniors
and young professionals.
In order to deliver appropriate housing options, the Town of Wawa will require partnerships and
investment.
The recommendations have been made based on a comprehensive review of the local issues and
are a mix of short-term and long-term solutions along with on-going monitoring to make
necessary adjustments or revisions to the plan that are needed.
5|Page2.0 INTRODUCTION
Algoma District Services Administration Board is the designated District Municipal Service
Manager servicing 20 area member municipalities and Northern Territories Without Municipal
Organization in the District of Algoma. Under the Social Housing Act (2011), Service Managers
were required to carry out a 10-year Housing and Homeless Plan. Algoma District Services
Administration Board finalized the Opening Doors to Better Lives document in 2013.
The Town of Wawa is one of the member municipalities in the northwest quadrant of the
Algoma District Services Administration Board’s jurisdiction.
Although Wawa is part of the Opening Doors to Better Lives document, Wawa has identified an
urgent need to review their housing status. This study will endeavour to provide a clearer picture
of the housing needs within the community.
As a result of various economic and demographic changes within the communities, the Mayor
and Councillors of the Town of Wawa (formerly Township of Michipicoten) through the Wawa
Economic Development Corporation engaged in the development of the Housing Needs and
Demand Study and retained the services of ARC Management Services and Harriman Planning.
This study is not intended to replace the Algoma District Services Administration Board Housing
and Homelessness Plan of 2013. In fact, this study will undertake to add value to the Housing
and Homelessness Plan through the added information specific to the Town of Wawa.
Housing is viewed as a critical part of the local economy and is a key determinant of health. It
creates a sense of home providing stability, prosperity and positive cultural and community
development.
This study allows the community to proactively review their current housing situation in order to
strengthen the housing continuum and ensure that residents have safe, suitable, adequate and
affordable housing that meet their needs.
6|PageSource: Google Maps
2.1 What is a Need and Demand Study?
The purpose of a housing need and demand study is to establish the current and emerging
housing needs of a community. It examines housing gaps and issues in order to evaluate the
housing supply and needs against the Housing Continuum.
This study will address the housing need and demand within the community through:
a) Identifying the current housing status
b) Identifying the current and emerging need
c) Identifying the supply
7|Page2.2 Approach
The development of the Housing Need and Demand Study was structured to take into
consideration both quantitative and qualitive analysis and follow the strategic direction below.
Research and Community Key Key Findings
Input from
Data Analysis Consultations Stakeholder and Common Draft Study Final Draft
Municipalities
and Surveys Interviews Themes
The overall work, issues, direction and actions for this study was formed through research using
census data and existing housing studies, evidenced based research, community consultations,
surveys and key stakeholder interviews.
Quantitative analysis was undertaken through an in-depth review of information that would
guide the study from sources such as Canada Mortgage and Housing Corporation; Statistics
Canada; the Growth Plan for Northern Ontario, 2011; Algoma District Opening Doors to Better
Lives, 2013 document; and Wawa Aging in Place document, 2016.
Community consultations and key stakeholder interviews were held with various members of
Wawa and included members of council, support service providers, health services providers,
non-profit housing providers, seniors’ groups, local landlords, and business owners, Ontario
Provincial Police, Ministry of Community and Social Services (MCSS), and the Northern
Ontario Local Integrated Health Network.
The consultations and interviews were instrumental and valuable in the formation of this
document. They assisted in identifying key themes and gaps in the housing continuum that
would both positively and negatively impact the development of new housing.
8|Page2.3 What is the Housing Continuum?
THE HOUSING CONTINUUM
Emergency Transitional RGI / Social Affordable Housing Programs Private / Market Housing
Shelters Housing Housing (rental and homeownership) (rental and homeownership)
Government Subsidized Non-Market Market Housing
Housing Housing
Low Income High Income
The housing continuum refers to a visual model, illustrated above, which demonstrates both
market and non-market housing and highlights a range of housing options for all income levels.
Moving from left to right, it refers to government subsidized housing such as emergency shelters,
various forms of supportive housing, rent-geared-to-income (RGI) rentals, and housing co-
operatives. Although rentals and housing co-operatives are also seen as government subsidized
housing, they are also considered non-market housing which can be characterised as affordable
rents or prices to market rental housing and home ownership which may require a higher income
for most people can not afford.
Because of the unique make-up, and specific community needs, the mix of market and non-
market housing varies in every city or town across Canada. Community residents should have
the opportunity to find housing that meets standards of adequacy, suitability, and affordability
and that is most appropriate and best suited to their circumstances.
9|Page2.4 What is Affordability?
Canada Mortgage and Housing Corporation notes that the term "affordable housing" is often
used interchangeably with "social housing"; however, as noted above social housing is just one
category of the housing continuum and usually refers to government subsidized rental housing.3
Affordable housing; however, is a broader term used for both temporary and permanent housing.
Housing can be provided by the private, public and not-for-profit sectors and can reflect all
forms of housing tenure (i.e. rental, ownership and cooperative ownership).3 In addition, it can
refer to any part of the housing continuum from temporary emergency shelters through to market
rental housing or market homeownership.
In order to define affordable housing further, we refer to definitions from Canada Mortgage and
Housing Corporation, Canada’s Crown Corporation created to administer the National Housing
Act and the Ontario Provincial Policy Statement (2005).
According to Canada Mortgage and Housing Corporation, in Canada, housing is considered
affordable if shelter costs account for less than 30 per cent of before-tax household income and
must be adequate, affordable, and suitable.3 Over the years, the 30 percent rule has become a
rule of thumb which identifies what a family can spend on housing and still have money left over
for non-discretionary spending. This also became an underwriting standard which reflected the
lender’s perception of loan risk determining home ownership affordability.
The Ontario Provincial Policy Statement (2005) (PPS), is a planning document which outlines
policies regarding development in local and regional jurisdictions. Along with various municipal
guidelines, it contains policies which speak to the need for a range of housing options, affordable
to different income levels.
Planning authorities are required to address an appropriate range of housing types and densities
to meet the requirements of current and future residents. In turn, municipalities are asked to
establish and implement minimum housing targets which is affordable to low and moderate
income households and special needs housing requirements.
The PPS defines affordable rental and ownership housing as:
Rental Housing:
The lower of:
i. Housing for which the rent does not exceed 30 percent of gross annual income for tenants
with incomes at or below the 60th income percentile for tenants in the regional market
area; or
10 | P a g eii. The average market rent of a unit in the regional market area.
Ownership Housing:
The lower of:
a) Housing for which the purchase price results in annual accommodation costs that do not
exceed 30 percent of gross annual household income for the lowest 60 percent of all
households in the regional market area; or
b) Housing for which the purchase price is at least 10 percent below the average purchase
price of a resale unit in the regional market area.
What complicates the definition of affordable housing further is that it varies from government
program to government program. For example, under the Investments in Affordable Housing
(IAH), affordable rents are set at 80% of the regional market rent or below while under the
CMHC Mortgage Loan Insurance for Affordable Housing Projects, rents are considered
affordable at levels 1, 2 and 3 with level 3 being the lowest at 50% of average market rent.
Lastly under the various social housing programs administered by the Algoma District Services
Administration Board affordability is calculated differently based on the program guidelines that
dictates the housing agreement (Social Housing Act). As noted, the calculation for housing
affordability can be ambiguous and are only appropriate depending on the program which
funding or policy it follows.
For the purposes of this study and as an indicator of housing affordability, we will consider
housing to be affordable if shelter costs account for less than 30 per cent of before-tax household
income. Please note that shelter costs for tenant purposes includes rent and utilities while for
home ownership it would mean principal, interest, heat and property taxes.
11 | P a g e3.0 Existing Legislation and Policy Framework
Housing policies and procedures can become a very complex web of policy framework and
planning. The following is an overview of housing legislation and policy background which
guides housing in Ontario communities.
3.1 Ontario Planning Act
The Ontario Planning Act (1990) sets out the formal planning process and the roles and
responsibilities of the communities in Ontario. The tools and provisions within the Act can have
a significant impact on the supply and development of housing.
The following sections of the Act pertain to housing:
Section 2 - Provincial interest
Section 16 - Official Plans
Section 28 - Community Improvement
Section 33 - Demolition Control Area
Section 37 - Increased Height and Density Provision By-law
3.2 The Strong Communities Through Affordable Housing Act
In 2011, the Ontario Legislature approved Bill 140, The Strong Communities Through
Affordable Housing Act.
Bill 140 amended the Planning Act as is related to Second Units and the required zoning by-
laws. It amended sections of the Planning Act to facilitate the creation of second units, in turn,
requiring municipalities to allow second units in detached, semi-detached and row housing as
well as ancillary structures.
In addition, the Act allowed for the extension of Garden Suites from 10 years to 20 years.
3.3 Provincial Policy Statement
Under the Planning Act and the Ontario Provincial Policy Statement (PPS, 2005), municipalities
are required to provide efficient land use and a full range of housing types and densities that
12 | P a g emeet affordable and special needs housing for current and future requirements of residents in the
regional market area.
It also defines “low and moderate income household” as the lowest 60 percent of the income
distribution as well as defining “affordable” as described above under Section 2.4, What is
Affordability?.
3.4 Provincial Growth Plan for Northern Ontario, 2011
The Northern Ontario Growth Plan directs growth and is part of an economic development plan,
an infrastructure investment plan, a labour market plan and a land-use plan which was prepared
under the Place to Grow Act, 2005. It provides direction and a framework to guide
municipalities to build more compact communities, to support and set targets for residential
intensification as a result of planned growth over the next 25 years.
The Northern Ontario Growth Plan identified the strategic core areas as Greater Sudbury, North
Bay, Timmins, Sault Ste. Marie, and Thunder Bay. While the Town of Wawa is not identified as
strategic core area, it is a smaller community located between the core areas of Timmins, Sault
Ste. Marie and Thunder Bay. The strategic location of Wawa can potentially benefit from the
planned investments and growth.
Source: Provincial Growth Plan for Northern Ontario, 2011
13 | P a g e3.5 Ontario Municipal Act 2001
The Municipal Act grants powers to the municipalities to establish housing regulation such as
by-laws, property tax rate, and general power to provide grants for the purposes it considers is in
the best interest of the municipality, subject to certain limits.
3.6 Ontario Development Charges Act, 1997
This Act provides for the payment of fees for new development to the City and the School
Boards. The Act is intended to provide municipalities with the ability to generate revenue for
new growth without placing any undue hardship or burden on existing taxpayers.
By-laws passed under the Act can provide for exemptions or deferrals of payment of
development charges fees to affordable housing projects to assist with cash flow and financing.
3.7 Local Official Plans and By-laws
At a municipal level, municipalities are to ensure that policies and by-laws are in place to
shepherd the development and maintenance of housing.
The Official Plans establish objectives and policies for housing, identify residential
intensification, and density targets.
In addition to recent Provincial Policies that support affordable housing and encourage local
municipalities to adopt procedures and legislation allowing more affordable housing in the
community, Wawa has a current Official Plan that fully supports the development of improved
affordable housing initiatives.
Section D4.3.1 of the OP states …
D4.3.1. Affordability
It is a policy of this Plan to ensure existing and new residents have access to
diverse and affordable housing choices. In order to fulfill this policy, Council
will work with developers, service delivery groups and funding agencies in an
14 | P a g eeffort to create affordable housing opportunities primarily through redevelopment
and intensification in the Wawa and Michipicoten River Village Settlements.
In the case of new development approved during the life of this Official Plan, at
least 25% of such development should be affordable to low and moderate income
households.
Section E1.7 provides development opportunities through community development plans ….
E1.7 COMMUNITY IMPROVEMENT
These policies are intended to provide a basis and mechanism for Council to
utilize the provisions of Section 28 of the Planning Act to encourage the planning
or replanning, design or redesign, resubdivision, clearance, development or
redevelopment, construction, reconstruction and rehabilitation, improvement of
energy efficiency, or of any them, of a community improvement project area, and
the provision of such residential, commercial, industrial, public, recreational,
institutional, religious, charitable or other uses, buildings, structures, works,
improvements or facilities, or spaces therefore, as may be appropriate or
necessary for specific areas of the municipality. It may also include the provision
of affordable housing.
Council may undertake Community Improvement Plans (CIP) in order to
implement the policies of this Plan as municipal finances and other sources of
funding permit. Wherever possible Council will seek funding from senior
government sources and other partnerships to assist in community improvement
programs after clarifying what components of improvement plans will be eligible
for Community Improvement grants and loans as prescribed by Section 28 (7) and
Section 32 of the Planning Act. Council may also include tax assistance programs
as prescribed by Section 365.1 of the Municipal Act. Through a Community
Improvement Plan the municipality may also register agreements relating to
grants and loans issued to fulfill CIP objectives.
E1.7.1 Community Improvement Areas
All lands shown within the settlement areas as shown on Schedule A-1 and A-2 of
this Plan shall be defined as Community Improvement Areas
15 | P a g eE1.7.2 Community Improvement Projects
Community Improvement Project could include, but are not limited to:
a. Development of seniors housing or forms of affordable housing
b. Development of parks, recreational trails, and public uses at or near the water
front
c. Improvements to sidewalks and roads surfaces to enable safe and comfortable
travel by pedestrians, bicycles and vehicles.
d. Projects designed to foster accessibility and active transportation in the
community
e. Tree planting and street beautification programs and improvements to private
buildings and properties; or,
f. The construction and improvement of buildings and structures that promote
energy efficiency.
While the local Official Plans set out the applicable policies, land use designations
and regulations for housing developments within the municipalities, the Zoning By-
laws are more detailed definitions, general provisions, permitted uses and zoning
standards for all lands within the municipality.
The Zoning Bylaw defines affordable housing as:
Affordable
Means:
a) In the case of ownership housing, the least expensive of:
i) Housing for which the purchase price results in annual accommodation
costs that do not exceed 30 percent of gross annual household income
for the lowest 60 percent of all households in the regional market area;
or
ii) Housing for which the purchase price is at least 10 percent below the
average purchase price of a resale unit in the regional market area.
b) In the case of rental housing, the least expensive of:
16 | P a g ei) Housing for which the rent does not exceed 30 percent of gross
annual income for tenants with incomes at or below the 60th
income percentile for tenants in the regional market area; or
ii) The average market rent of a unit in the regional market area.
And supports in the General Provision that secondary suites are encouraged with regulations….
13. The General Provisions of the zoning bylaw supports secondary suites in all residential
zones subject to regulations.
14. Likewise each zone has regulations dealing with all development. It is different for each
zone. Suffice to say development is encouraged to accommodate development subject to
satisfying Zoning Bylaw.
Housing is governed by and impacted by these standards and permitted uses.
3.8 Building Code Act
The Building Code Act usually part of the Property Standards By-law provides for the
maintenance of the physical condition of the existing housing stock as well as maintenance
standards for occupancy.
3.9 Other Legislation
At a Federal level, Canada currently does not have a national housing strategy. However, ground
work has been laid for future construction of a national housing strategy. In fact, in recent
months, Canadians were asked to provide feedback which would guide the development of a
national housing strategy.
The National Housing Act (NHA) was introduced in 1944 and provided the Federal government
through Canada Mortgage and Housing Corporation the leading role in housing programs and
financing. In the mid-1990’s, the federal government transferred responsibility of social
housing to the provinces. Currently, through Canada Mortgage and Housing Corporation, the
Federal government provides funding to the Provinces and Territories for housing under the
Social Housing Agreement and Investments in Affordable Housing agreements.
In this respect, in 1999, the Canada-Ontario Affordable Housing Agreement was signed between
Canada Mortgage and Housing Corporation on behalf of the Federal Government and the
Ministry of Municipal Affairs and Housing on behalf of the Ontario Provincial Government.
17 | P a g eIn 2000, under the Social Housing Reform Act (currently the Social Housing Act, 2011), the
municipal sector assumed responsibility for the social housing within their jurisdiction. To
compensate for the cost of assuming this responsibility, the Province and Federal dollars are
transferred to the Service Managers.
In the case of Wawa, the Algoma District Services Administration Board is responsible for the
administration of existing social housing agreements in Wawa and the promotion and program
funding for existing and new affordable housing development with funding transferred from the
Federal and Provincial governments.
3.10 Additional Documents affecting housing
Other documents which outline and guide housing programs, policies, and procedures include
the Provincial Long-Term Affordable Housing Strategy, Housing Services Act and the Ontario’s
Housing Policy Statement, Residential Tenancy Act and the Patients First: Strengthening Home
and Community Care.
Although these documents affect housing direction, but they do not govern the local Official
Plans and Zoning By-laws.
3.11 Legislation Summary
The delivery and provision of affordable housing is governed by provincial and municipal
policies. These housing policies are administered to ensure housing providers develop projects
that meet the goals and objectives outlined by the Long Term Affordable Housing Strategy and
the Housing Services Act, 2011.
The Long Term Affordable Housing Strategy developed by the Ministry of Municipal Affairs
and Housing in 2010, highlighted the need of appropriate delivery of housing and services. The
Province encouraged an integrated local planning model allowing opportunities for groups that
foster independence and enable participation in the community and economy. From this strategy
came the Housing Services Act, 2011 that required Ontario Service Managers to create
comprehensive, multi-year plans for local housing and homelessness services.
The responsibility and provision of affordable housing has become increasingly more difficult
with the lack of financial support from both the Federal and Provincial governments. In response
to the overwhelming demand for cost effective housing solutions the Province has approved two
pieces of legislation that attempt to identify and address the concerns related to the provision of
affordable housing and the quality and level of care for seniors.
The Promoting Affordable Housing Act introduces legislative amendments to the Planning Act,
The Development Charges Act, The Housing Services Act and to Residential Tenancy Act.
These Acts will allow municipalities to promote the development of affordable housing with
inclusionary policies supporting the need for housing. The second important document is The
18 | P a g ePatients First: Strengthening Home and Community Care. This policy speaks to formulating
plans in the hope of reducing the financial pressure on local hospitals and allowing seniors to
reside in the appropriate housing environment with a level of care conducive to their life style.
In 2011, the Province issued the Ontario Housing Policy Statement to provide additional policy
context and direction to local Service Managers to support and encourage locally relevant plans.
Under the OHPS local plans would;
• Demonstrate a system of coordinated housing and homelessness services to assist
families and individuals to move toward a level of self-sufficiency.
• Include services, supported by housing and homelessness research and forecast, which
are designed to improve outcomes for individuals and families.
• Are coordinated and integrated with all municipalities in the service area.
• Contain strategies to increase awareness of and improve access to affordable and safe
housing that is linked to supports, homelessness prevention, social programs, and
services.
• Contain strategies to identify and reduce gaps in programs, services and supports, and
focus on achieving positive outcomes for individuals and families.
• Contain local housing policies, and short and long term housing targets.
• Provide for public consultation, progress measurements and reporting.
4.0 Community
4.1 Location
The Wawa Region covers a total land mass of 420 square kilometers. It is known for its giant
Canada Goose which was originally unveiled at the official opening of the Trans-Canada
Highway in the 1960s. The Town of Wawa is a small community in north western Ontario
amongst luscious forest, fresh water lakes and rivers. Nestled off the shores of Lake Superior,
the Town of Wawa is surrounded by Lake Wawa, and the rivers of Magpie and Michipicoten
River.
Wawa is accessible by road, located mid-way between the larger communities of Sault Ste.
Marie and Thunder Bay along the Trans-Canada Highway (Hwy 17) and east of Timmins on
Hwy 101.
The drive from Timmins is approximately 3.5 hours or 330 km., from Thunder Bay it is
approximately 485 km or 5.5 hours with the closest urban centre being Sault Ste. Marie at
approximately 225 km and 2.5 hours. (Google Maps)
19 | P a g eSmall communities in the surrounding district include Hornepayne, Hawk Junction, Anjigami,
White River, Chapleau, Manitouwadge and Dubreuilville. These communities are
approximately one hour drive (100 km) or less in each direction.
The Municipality operates a public airport equipped for both commercial and private aircrafts.
CP Rail offers service at White River and Chapleau and Canadian National Railway provides
passager service between Sault Ste. Marie and Hearst. Its natural deepwater habour offers water
accessibility for docking and trucking corridor.
4.2 Economic Scan
The 2011 Statistics Canada Employment Trends highlighted in the chart below reports an overall
decrease in the employment industries. This decrease is reflected in the unemployment rate
which increased to 8% in 2011 from 6.6 in 2006.
Employment Trends; 2001 to 2011
2500
2000
1500
1000
500
0
2001 Employment 2006 Employment 2011 Employment
Source: Statistics Canada, Census Profile
Even though Wawa saw an overall decrease in the employment trends of 4.5% from 2006 to
2011, it was significantly smaller than the 18.43% decrease from 2001 to 2006. With the
exception of the manufacturing, construction, finance and the real estate industries which saw
larger decreases, all other industries saw a small increase.
Since 1725, when the first trading post was established in the area, Wawa has been influenced by
its natural resources; forestry, gold mining and tourism. Due to external pressures, the forestry
and mining industries have been precarious. In recent years, the forestry industry has rebounded
through Rentech Inc., an alternative energy developer, purchased and converted a
decommissioned processing mill to produce wood fibres into wood pellets for fuel. The beauty
20 | P a g eof the area, with its forest, lakes, and hills, has preserved the tourism industry as one of its main
employers since the opening of the Trans-Canada Highway.
Based on the Ministry of Northern Development and Mines presentation to Wawa, Sault Ste.
Marie District including Wawa is in an economically advantageous location as there are 3 gold
producing mines, 1 advanced exploration, 32 active exploration projects, 1327 active claim units
and approximately $1.4 million in assessment work in this area. In the Wawa region, there are a
total of 6 mines; 2 of which are operating (Westdome and Richmont) while 4 are still in the
planning stages, as such, Wawa is in a state of transition. Should these activities expand, there
would be a high need for skilled workers and housing.
Wawa is central to a number of the smaller communities in the area and acts as the regional
service centre. It has a strong service industry providing education and secondary service to
many centres in the northern Algoma District. Lady Dunn Health Centre offers numerous health
services to Wawa and the surrounding communities. It is a teaching site for the Northern
Ontario Medical School; therefore, hosts medical students requiring housing accommodations.
Not withstanding the decline in employment opportunities outlined in the 2011 Statistics Canada
Profile, the current economic surge in forestry through the opening of Rentech and potential
mines would increase employment opportunities within these industries. In turn, these activities
will boost residual employment such as the service industries including business services,
finance, and health care resulting in a need for more housing.
4.3 Community Profile
A recent release of limited 2016 Census data statistics by Statistics Canada reported that the
population in Wawa has decreased 2.35% since 2011 from 2975 to 2905. Since there is limited
information from the 2016 Census, this report will concentrate on the 2011 Census data.
Overall population continues to decreased from 2001 to 2011 with the highest decline in the
under 49 age group. This is indicative of the employment situation causing younger people to go
where the jobs are located.
With fewer people available locally, potential new businesses and current businesses may
experience labour shortages. The consultations identified the need for more skilled labour and
that there has been an in-migration of individuals from various locations outside the Wawa area
to work in the mines.
As noted above, between 2006 and 2011, population decreased in the under 49 age group by
32.76%; however, the overall population increased by 13.49% in the over 50-category. The
21 | P a g egreatest percentage increase was in the 75 plus cohort. This group represents 8% of the
population. It should also be noted that this age group has the highest number of women.
Almost half (41%) of the population is over the age of 50 contributing to an aging population.
The mobility pattern as outlined by the 2011 Statistics Canada confirmed that 75% of the Town’s
residents have not moved in the past five years.
Source: Statistics Canada, 2001, 2006, 2011 Census Profile
Population Change
Age of 2001 2006 % Change 2011 % Change
Population 06/01 11/06
Less than 25 1225 990 -19.2 825 -16.7
25 - 49 1385 1120 -19.1 930 -17
50 - 64 670 675 1 740 9.6
65 - 74 270 225 -16.7 245 8.9
75 + 135 195 44.5 235 20.5
Total 3550 3010 -15.2 2975 -1.16
Suggesting that retirees are not migrating out but rather prefer to reside in Wawa during their
retirement, implying that the need for more private, non-profit, and/or municipal funded seniors
housing projects would be needed.
Population by Age and Gender
160
140
120
100
80
60
40
20
0
0 to 5 to 10 15 20 25 30 35 40 45 50 55 60 65 70 75 80 85
4 9 to to to to to to to to to to to to to to to and
14 19 24 29 34 39 44 49 54 59 64 69 74 79 84 over
Male Female
Source: Statistics Canada, Census Canada Community Profiles, 2011
22 | P a g e5.0 Housing Market
This section will address the housing market as well as the affordability in Wawa for both rental
and home ownership opportunities.
5.1 Household trends
Households continue to decline from 1,480 households in 2001 to 1,290 households in 2006
(-12.8) but rebounded slightly to 1,310 in 2011. It was interesting to note that even though there
was an increase in households, the average household size reduced from 2.5 to 2.2.
Household Trends, Wawa; 2001 to 2011
Reduction in household size
Households 2001 2006 2011
would propose that the need for
different types of housing units
Couples 910 795 715
Singles 400 335 405 across the continuum would not be
Other 170 160 190 required.
Total 1,480 1,290 1310
Ave. Hhld 2.5 2.5 2.2
Source: Statistics Canada, Census Profile, 2001, 2006, 2011
Since almost half of the population is over the age of 50; it was interesting to note that 405 were
in private households and 120 persons over the age of 65 were living alone.
Total Number of Private Households by Size
40 20
170
400
180
500
1 person 2 person 3 person 4 person 5 person 6 or more
Source: Statistics Canada, Census Profile
23 | P a g eThe total number of private households by size provides a good indication of the type and size of
housing needed within the community. The above illustrates that the majority of household
formations are 1 and 2 person households. This would suggest that there would be a high need
for bachelor, 1-bedroom, and 2-bedroom units followed by 3 and 4-bedrooms.
5.2 Housing types
Based on the 2011 National Housing Survey, total number of private households in Wawa is
1310 represented by 1015 (77.5%) owners and 295 (22.5%) renters.
Source: 2011 National Housing Survey, Census Profile
Total number of occupied private dwellings by structure type
2001 2006 2011
Single - detached 1200 1045 1020
Semi-detached, row, apt duplex 100
Apartment 5 or more storeys 0
Apartment fewer than 5 storeys 170
Moveable dwellings 20
Other 285 250
Total Occupied Dwellings 1485 1295 1310
Source: 2011 National Housing Survey, Census Profile and Opening Doors to Better Lives Report 2013
24 | P a g eAs noted above, the community’s housing consists of single-detached homes, duplex or semi-
detached, apartment buildings under 5 storeys and moveable dwellings. Even though the
population has decreased since the 2006, the number of occupied dwellings increased by 15. This
could simply be that the number of younger households have moved out of other dwellings and
into their own.
A review of the total number of occupied private dwellings by bedroom size from the 2011
Census Profile revealed of these dwellings there were a large number of 3 and 4 plus bedroom
units (795 units) while only 510 were 0 - 2 bedroom units. In comparison to the 900 - 1 and 2
person households, there does not appear to be enough bachelor, 1 and 2 bedroom units in the
market.
The consultations revealed that housing was difficult to obtain because of the condition of the
units. This discouraged people from wanting to rent or own property in Wawa in turn leading
them to find alternative accommodations or move to other nearby communities. The housing
survey confirmed that one of the barriers to finding housing in Wawa was the poor condition of
housing as well as a low number of units available. The 2011 Census highlighted that 1075
private dwellings had only regular or minor repairs while 235 required major repairs.
The lack of suitable housing puts pressure on the system to ensure that the current and potential
future residents have the appropriate accommodations to live in safe, affordable, adequate, and
suitable housing.
The challenge for the community is to ensure that their seniors as well as the current and future
residents have the services and suitable accommodations to meet the residents’ needs.
5.3 Rental Market
Annually, Canada Mortgage and Housing Corporation surveys private landlords to identify the
rents and vacancies that are occurring in communities with population base of more than 10,000.
Unfortunately, due to its smaller population base, rental rates and vacancies for Wawa were not
available.
In order to assess the rental market in Wawa, a small sampling of the rental buildings along with
information from the consultations, the community rental market was surveyed. Even though
this is a small community with a small universe of rentals, the information is appropriate for our
study, as it provides information relating to the current rental market in the community that
would otherwise not be available. This information has not been verified or tested; however, it
has provided insight into the rental market.
Due to the small number of buildings and units, the information below has been provided in
aggregate form. According to the 2011 Census, there are 170 private households in apartment
25 | P a g edwellings less than 5 storeys. However, during our consultations, as well as the survey; it was
found that there are a number of rental scenarios including homes, some rooms and single and
semi-detached that are rented. Therefore, the actual number of rentals were difficult to confirm.
For the purposes of this study, the following rents have been gathered from various sources to
provide us with a footprint of the rental market.
Average Market Rents *
*It should be noted that although some rents
Bachelor $ --
included utilities, the majority of rentals
1-bedroom $628
excluded utilities.
2-bedroom $803
3-bedroom $870
Because the above is a small sampling of the rental rates, it may not provide the entire picture of
rental market; however, it does give us a base to compare to other markets.
An indication of supply/demand is the number of vacant apartments. At the time of the rental
survey, there were 8 vacancies in these buildings representing 2, 3 and 4 bedrooms with the
majority of the vacancies in the 2 and 3-bedroom units available for occupancy.
The chart below provides a comparison of the vacancies in communities that are surveyed by
Canada Mortgage and Housing Corporation in the surrounding area. (please note CMHC surveys
communities of 10,000 and more). The chart below points out that the vacancies in Wawa are
higher than those of the surveyed communities with the exception of Elliot Lake (high vacancy,
lower rental rate). It should be noted that Elliot Lake has a population of slightly over 11,000.
Source: CMHC Market vacancy rates and rents, Fall 2016
Vacancy Rate 2 - bedroom Average Rents
Thunder Bay 5.0% $940.00*
Sault Ste. Marie 3.1% $873.00*
Timmins 7.0% $936.00*
Elliot Lake 13.4% $601.00*
Wawa 11.4% $803.00*
*Utilities may or may not be included
Along with vacancies, another sign of supply/demand is the number of people on the waiting list.
As of November 2016, the Algoma Services Administration Board had a total of 43 people on
the waiting list for subsidized units of which 38 were waiting for 1 bedroom units. Reflecting a
need for subsidized 1 bedroom units. Unfortunately, no waiting lists was available for market
units.
The consultations also emphasised that there is a large number of professional short-term
individuals in the community, some of which are currently renting rooms, that are having
26 | P a g edifficulty finding suitable accommodations. These would include teachers, fire fighters, hospital
training staff, as well as students from neighbouring communities.
5.4 Home ownership
As noted above, Statistics Canada Census Profile identified 1310 dwellings, 705 were built prior
to 1960 and none built after 1990. The condition of these dwellings was characterised as, 1075
were in regular or have minor repairs while 235 require major repairs.
Our consultations called attention to a concern from residents that the housing values currently
may not be the value of the home when originally purchased; therefore, unable to recapture their
investment. Based on Statistics Canada 2011 National Housing Survey, 1015 dwellings were
owner occupied and the average dwelling value was $112,119.
Housing Values
2001 2006 2011
Average House Value $84,767 $92,826 $112,119
Source: Statistics Canada, Census Profiles; 2001, 2006 and 2011
Even though there has been a challenge with the housing value in past years, the average value of
homes based on the Census data has been increasing since the 2001.
There was also a consensus that people feel those moving to Wawa cannot find appropriate
rentals and are hesitant to purchase because they do not know how long the jobs will be available
or whether they would be able to invest in a home. The fears of housing values is valid,
however, there does appear to be a change in the economic environment in Wawa.
5.5 Affordability
Housing is the single largest monthly expenditure for most households and research has shown
that housing affordability is a problem faced by lower income households. However, some
moderate-income households who opt or do not have an option but to spend a large proportion of
their income on housing also face this same issue. Housing affordability is a critical element in
the social well-being of all residents.
Measuring housing affordability involves comparing housing costs to a household’s ability to
meet those costs. Income and wages are used as a measure of housing affordability.
As noted above, depending on the government housing programs, the definition of affordability
can be confusing. For the purposes of this study, housing will be considered affordable if shelter
27 | P a g ecosts account for less than 30 per cent of before-tax household income for both rental and home
ownership opportunities. Shelter costs for renters would include rent and utilities while for
home ownership it would include principal, interest, heat and property taxes.
The table below illustrates the gross annual income required to afford private rental apartments
by bedroom size in Wawa. At minimum wage, an employee making $24,000 per year could
afford a one-bedroom apartment; however, if an employee making $24,000 per year required a 2-
bedroom apartment, they could no longer afford the unit and would be paying over the 30%
shelter calculation. Minimum wage earners struggle with the proportion of money required to
meet their shelter needs as demonstrated below.
Average Monthly Rent Average annual rent Annual Income
Required
Bachelor $ unknown $ unknown $ unknown
1-bedroom $628 $ 7,536 $25,120
2-bedroom $803 $ 9,636 $32,120
3-bedroom $870 $10,440 $34,800
* Units may or may not include heat and electricity
The following example illustrates affordability based on the purchase of a home for $112,119
(2011 average dwelling value). Assuming a mortgage of $100,900, at a 5-year fixed closed
interest rate of 4.64% over 25 years would yield a monthly payment of $566.33 plus property
taxes and utilities. Presuming these costs add an additional $323 per month the total shelter costs
would equate to approximately $890 per month. This would mean that someone earning a salary
of $35,600 could potentially afford to purchase this home.
To review affordability further, an examination of new construction was carried out. In Ontario,
the cost of developing a new home would be between $150 and $350 per square foot. Assuming
that we are building a 1,000-square foot home at $300 per square foot, this would cost
approximately $300,000. Assuming a 10% down payment, principal loan amount of $270,000
at a 5-year closed fixed rate of 4.64%, over a 25-year amortization period; the monthly payment
would be $1,515.46. If we add an additional $323 in property taxes and utilities per month. The
monthly shelter cost would be $1,828.46, this would mean that the household would need to earn
at least $73,538.40 per year to afford this home.
28 | P a g eRental vs Home Ownership Comparison
Average Market New Construction/above Resale Home
Rent example Monthly Principal &
Monthly Principal & Interest Payment
Interest Payment (does (does not include
not include MLI, or other MLI, or other
mortgage insurance) mortgage insurance
3-bedroom $700* $1,515.46** $426.50**
*may or may not include utilities
**does not include utilities and property taxes
Depending on the earning potential, we can see from this table, it may be more affordable or
attractive to purchase an existing home or rent versus new construction. This scenario was also
confirmed through key stakeholder interviews whereby we were advised that it was more cost
effective to purchase than to rent.
Since the majority of household formations are 1 and 2 persons, a further analysis taking into
account the 2011 National Housing Statistics of the individual median income of $29,327 could
potentially afford shelter costs of no more than $733 per month. Suggesting that an individual
or household making the average median income of $29,327 could potentially afford a 1-
bedroom apartment or purchase a resale home below the $80,000 value.
Another look at affordability was based on the 2011 National Housing Survey median household
income of $53,354. This annual income could potentially carry shelter costs of $1,333 per
month.
An assessment of the median shelter costs for rental housing was $562 and for ownership was
$808 as reported by the 2011 NHS was also undertaken. These shelter costs would require an
annual income of at least $22,480 and 32,320 respectively. Based on the median household
income both rental and ownership shelter costs as per the 2011 National Housing Survey are
affordable in Wawa for 68% of the population.
Even though the majority to Wawa residents can afford the median shelter costs, the National
Housing Survey reported that 50% of tenants in Wawa spend more than 30% on shelter costs
while 17.7% of home owners are spending more than 30% on shelter costs. This would signal
that approximately 147 tenants and 180 home owners are paying more then they can afford on
shelter costs. These numbers reflect a high need for subsidized housing or some form of
financial assistance.
It should also be noted that both the consultations and the community surveys pinpointed hydro/
utilities as one of the biggest concerns fueling the inability for households to manage shelter
29 | P a g eexpenses. Other barriers noted in the survey which confirmed the above scenarios are housing
costs too high, low number of units available, couldn’t afford first and last month rent, wait time
for subsidized housing too long.
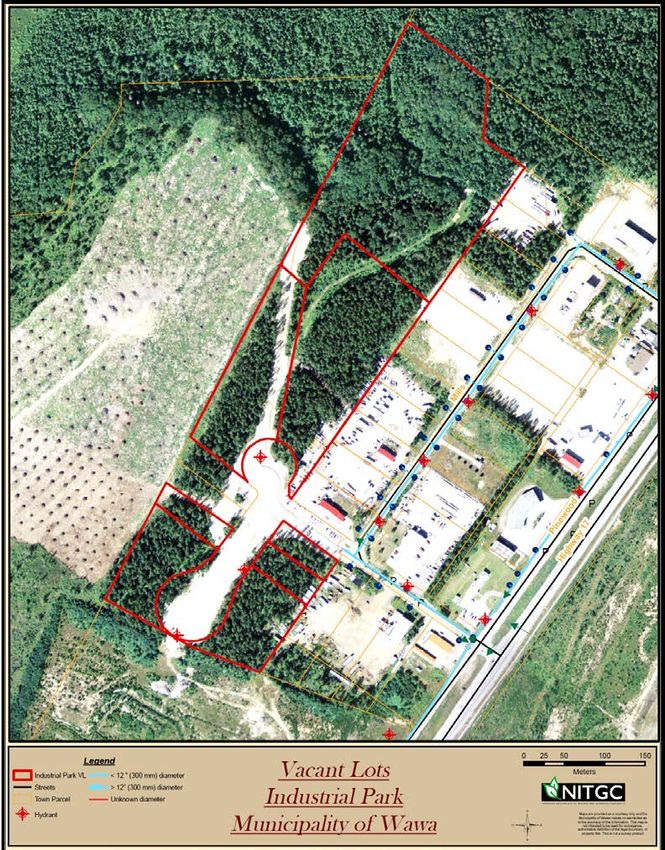
5.6 Land Assessment
According to the Town of Wawa Community Strategic Plan, there is one brownfield site at the
Sinter Plant location. There are a number of commercial, residential properties and vacant lots
that are available for sale, along with a large parcel of land fronting the highway and designated
rural area along with 8 lots within the Wawa Industrial Park. Available land is listed on the
Wawa Economic Development Corporation Website as well as outlined in the Wawa
Community Profile 2013.
Review of existing available lands
A review of existing lands that were potentially viable for a housing initiative was undertaken
based on the data provided by the Town of Wawa. As shown on the charts and plans attached,
there appears to be sufficient serviced lands that are either vacant or ready for development or
are currently unoccupied and are large enough to sustain a housing initiative. A more detailed
site analysis will be required as part of the phase two report providing specific site characteristics
for development to occur.
30 | P a g eYou can also read