Kā Pūtahi Creek Ecology - Five years after the realignment works Prepared for Christchurch City Council 19 July 2021
←
→
Page content transcription
If your browser does not render page correctly, please read the page content below
Kā Pūtahi Creek Ecology
        Five years after the realignment works
       Prepared for Christchurch City Council

                                  19 July 2021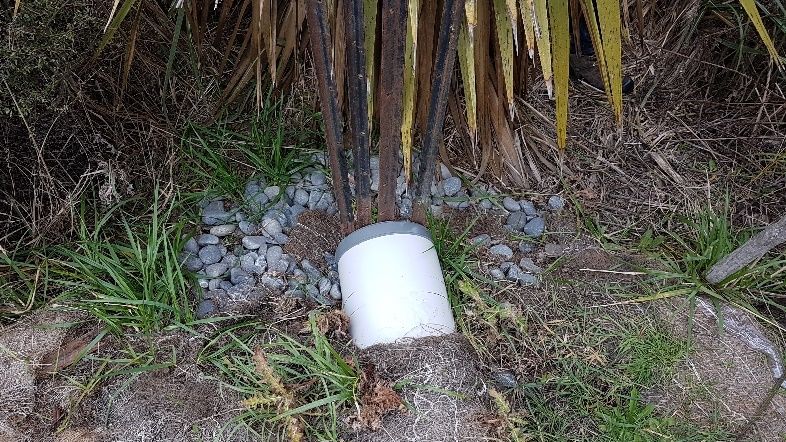
Document Quality Assurance
Bibliographic reference for citation:
Boffa Miskell Limited 2021. Kā Pūtahi Creek Ecology: Five years after the realignment
works. Report prepared by Boffa Miskell Limited for Christchurch City Council.
Prepared by: Alex Gault
Ecologist
Boffa Miskell Limited
Reviewed by: Tanya Blakely
Senior Ecologist | Senior
Project Manager: Principal
Boffa Miskell Limited
Status: Final Revision / version: 1 Issue date: 19 July 2021
Use and Reliance
This report has been prepared by Boffa Miskell Limited on the specific instructions of our Client. It is solely for our Client’s use for
the purpose for which it is intended in accordance with the agreed scope of work. Boffa Miskell does not accept any liability or
responsibility in relation to the use of this report contrary to the above, or to any person other than the Client. Any use or reliance
by a third party is at that party's own risk. Where information has been supplied by the Client or obtained from other external
sources, it has been assumed that it is accurate, without independent verification, unless otherwise indicated. No liability or
responsibility is accepted by Boffa Miskell Limited for any errors or omissions to the extent that they arise from inaccurate
information provided by the Client or any external source.
Template revision: 20180621 0000
File ref: BM200928_001c_Kaputahi_Creek_5-Year_Post-realignment_survey_20210721.docx
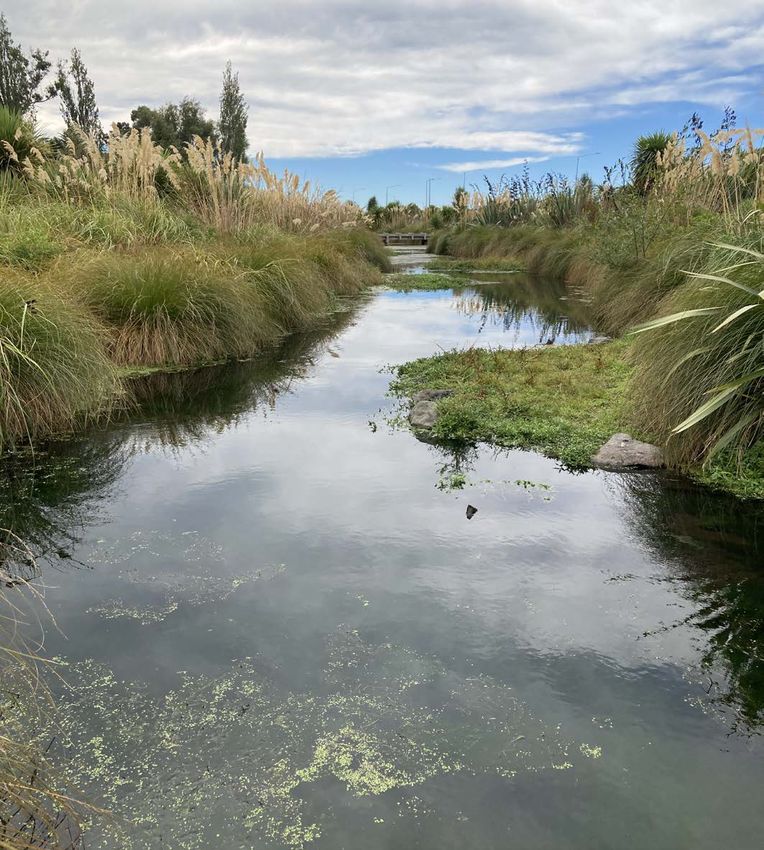
Cover photograph: Kā Pūtahi Creek, © Boffa Miskell, 2021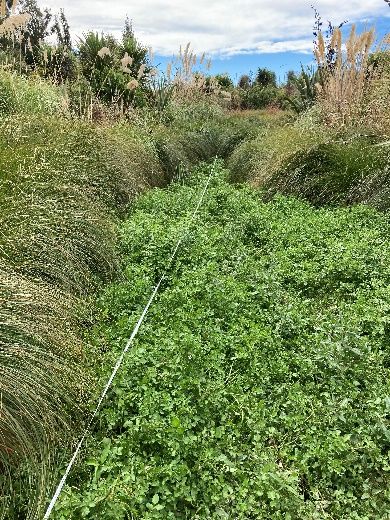
Executive Summary

The Christchurch City Council (CCC) commissioned Boffa Miskell Limited to
conduct a repeat ecological survey of five sites within the Kā Pūtahi Creek
following its realignment to avoid requiring multiple box culverts under the
Northern Arterial Motorway in 2016. The monitoring programme aims to
determine if the realignment and rehabilitation works has resulted in any
measurable ecological changes and identify any limitations to the success of
the rehabilitation works.
A variety of riparian and in-stream habitat variables, basic water quality
measures and assessments of the macroinvertebrate and fish communities
were made at two control sites and three sites within the realigned reach in
March 2021. Methods used were generally the same as those used in the
previous two surveys; baseline (2016, prior to realignment works) and one-
year post-rehabilitation works (2017). This survey (2021) was undertaken
five years following realignment and rehabilitation works.
Habitat conditions throughout the realignment sites were generally similar,
though some key differences between realignment and control sites, and
temporal changes in conditions, were evident. Compared to baseline
conditions, the riparian vegetation is significantly improved, with a diverse
array of indigenous plants becoming well established. Along the stream
banks, sedges, toetoe and flax have become well established and overhang
the stream increasing habitat availability further back. Further, these plants
have helped to maintain stable banks and increase the buffer zone
surrounding the waterway.
In-stream habitat improvements have also been observed since the baseline
assessment, with increased habitat heterogeneity from the addition of cobble
substrate. However, fine sediments have started to cover these coarser
substrates added to the realigned channel since the ‘Year One’ survey.
Similarly, macrophyte cover has increased at realigned sites since the ‘Year
One’ survey and is comparatively higher than that in the control sites. The
realigned and control reaches of Kā Pūtahi Creek are wide in places and
velocity very slow, which leads to deposition of sediments that continue to
enter the waterway upstream of the realigned reach.
While there were some subtle changes (improvement) in the
macroinvertebrate community in response to rehabilitation works as shown
by the 2017 surveying, the 2021 results show the community is now
relatively similar among sites.
Macroinvertebrate abundance has increased since the baseline and ‘Year
One’ surveys, though taxa found remain typically “pollution tolerant”.
Crustaceans were the dominant group found across all sites in this survey. A
shift in the macroinvertebrate community was observed between the
baseline and ‘Year One’ surveys. However, the community found in 2021
has become more similar to the baseline condition at all sites. These
changes are likely due to increasing cover of soft sediment on the cobble
substrates of the realigned reach.

Boffa Miskell Ltd | Kā Pūtahi Creek Ecology | Five years after the realignment works | 19 July 2021   i
No significant changes in the fish community have been detected since the
baseline survey, with a similar community being found in all surveys. The
number of fish caught at realigned sites was similar to that found at control
sites, and no new species or notable changes in abundance of any species
have been evident. While giant bullies, which have been found in the
previous two surveys, were not encountered in this survey, they are
appeared to only have been present in low numbers and thus likelihood of
capture is low. Further, different survey methods used (i.e., trapping rather
than electric fishing) have different biases for capturing certain species (e.g.,
giant bully and inanga are underestimated using electric-fishing methods),
which may have had some influence on the fish communities found. Habitat
for giant bullies is available in Kā Pūtahi Creek, and the species may still be
present.
Overall, realigned works have improved and diversified habitat at the
realigned sites when compared to control sites and baseline conditions.
However, high sediment loads and macrophyte growth in the catchment, and
slow velocity in the wider parts of the waterway contributing to further
deposition has resulted in a high cover of sediment in the realigned reach.
As a result, habitat quality and availability for aquatic fauna (particularly
aquatic insects, EPT fauna) is reduced, and is reflected in the lack of
improvement of QMCI scores at these sites.
Limitations to further ecological improvement exist, including ongoing
sediment inputs and high macrophyte growth in the catchment resulting in
high rates of deposition, limited flow influenced by the wideness of the
waterway, and in places, a lack of large boulders and logs providing greater
habitat diversity.
Ongoing management and continuation of rehabilitation work is likely
necessary to address issues and further habitat improvement gains
throughout the Kā Pūtahi Creek.
Recommendations to improve the condition of the waterway include
addressing upstream catchment-scale sediment inputs, managing
macrophyte growth (e.g., through increasing channel shading) to Kā Pūtahi
Creek and reducing the wetted width of the waterway to increase flow
velocity by adding logs and boulders along the wetted edge of the stream.

ii      Boffa Miskell Ltd | Kā Pūtahi Creek Ecology | Five years after the realignment works | 19 July 2021
CONTENTS

Executive Summary                                                          i

1.0    Introduction                                                        1

       1.1    Scope                                                        1

2.0    Survey Methods                                                      1

       2.1    Site Locations                                               1
       2.2    Water quality                                                2
       2.3    Riparian and in-stream habitat                               2
       2.4    Macroinvertebrate community                                  3
       2.5    Fish community                                               5
       2.6    Data analysis                                                5

3.0    Ecological Conditions                                               9

       3.1    Site descriptions                                            9
       3.2    General habitat conditions                                  13
       3.3    Macroinvertebrate community                                 19
       3.4    Fish community                                              25

4.0    Discussion                                                         28

       4.1    Water quality                                               28
       4.2    Habitat                                                     29
       4.3    Macroinvertebrate communities                               30
       4.4    Fish communities                                            31
       4.5    Current successes and limitations of rehabilitation works   32

5.0    Recommendations                                                    34

6.0    References                                                         36

U:\2020\BM200928_TBl_Kaputahi_Creek_5-Year_Post-
realignment_Survey\Documents\BM200928_001c_Kaputahi_Creek_5-Year_Post-
realignment_survey_20210721.docx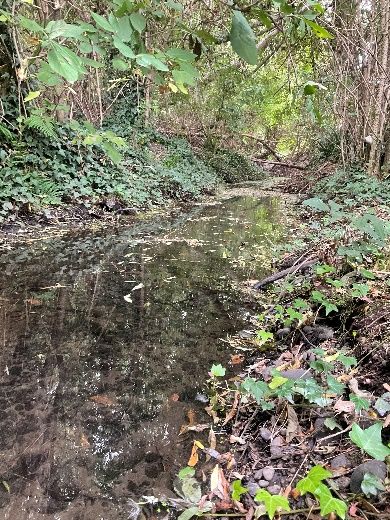
Appendices
Appendix 1: Protocol 3 (P3), Harding et al., 2009

Appendix 2: Sediment Assessment Method 2 (SAM2), Clapcott et al.,
     2011

Appendix 3: Sediment Assessment Method 6 (SAM6), Clapcott et al.,
     2011

Appendix 4: SIMPER & ANOSIM results – macroinvertebrate
     community

Appendix 5: SIMPER & ANOSIM results – fish community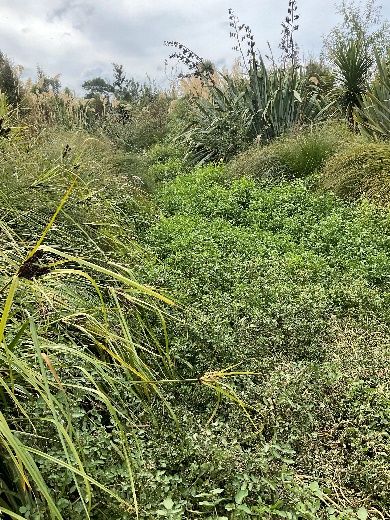
1.0 Introduction

Waka Kotahi NZ Transport Agency constructed a new motorway, the Christchurch Northern
Corridor (CNC), to link Christchurch City with State Highway 1. The CNC’s original proposal
involved installing two long box culverts to cross Kā Pūtahi Creek in Marshlands. The
Christchurch City Council (CCC) realigned Kā Pūtahi Creek in 2016 to avoid these crossings.
The realignment works replaced approximately 250 m of “oxbow” with 350 m of pool-riffle-run
sequences, and reinstated Carex-dominated floodplains, with overhanging vegetation and
varied in-stream and bank profiles (Shadbolt 2015).
To measure the ecological success of the realignment and enhancement works, CCC has been
carrying out ecological monitoring of the creek. A baseline survey of the existing (pre-
realignment) riparian and in-stream habitat conditions, and the macroinvertebrate and fish
communities was carried out at four sites in 2016 (two sites within the oxbow to be realigned,
and two control sites upstream and downstream of the realigned section) (Boffa Miskell, 2016).
The first post-realignment survey occurred in 2017 (EOS Ecology, 2017), including the two
control sites previously surveyed plus three sites within the newly realigned Kā Pūtahi Creek.
This report details the findings of habitat and faunal community surveys undertaken five years
following the realignment of Kā Pūtahi Creek and compares the results to the previous surveys.

1.1       Scope
The CCC commissioned Boffa Miskell to resurvey the five sites within Kā Pūtahi Creek as part
of its ongoing monitoring programme to measure ecological success of the realignment works.
The survey was conducted in March 2021, five years following the realignment works.
The purpose of this report is to:

    •   Describe the current ecological conditions of the sites along Kā Pūtahi Creek;

    •   Compare conditions in control and realigned sites with those from the baseline, one-
        year and five-year post-realignment surveys; and

    •   Discuss any potential reasons for any significant patterns and trends recorded, and the
        current successes or limiting factors of the realignment works.

2.0 Survey Methods

2.1       Site Locations
The five monitoring sites were established during the baseline and ‘Year One’ surveys. These
include the two control sites (one upstream and one downstream of the realigned reach) that
were established and first surveyed in 2016 (prior to realignment, ‘Baseline’) and three sites
within the realigned reach of Kā Pūtahi Creek (first surveyed in 2017, one year after the
realignment works). A 50 m section was surveyed at each of the five sites. The upstream and

                            Boffa Miskell Ltd | Kā Pūtahi Creek Ecology | Five years after the realignment works | 19 July 2021   1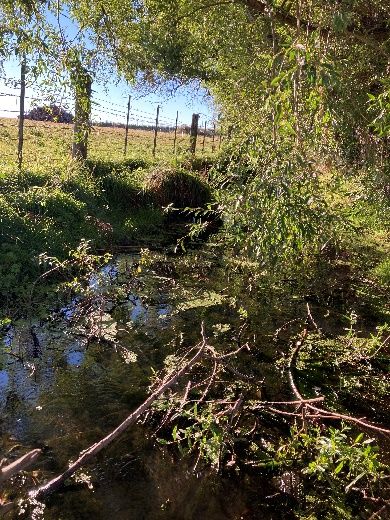
downstream extent of each survey site is provided in Table 1, and locations of each site are
    shown in Figure 1.
    Table 1. Site name, number, and co-ordinates of each of the sites surveyed in this study.

         Site                                                                             Upstream extent              Downstream extent
                                     Location                     Treatment
        number                                                                       Easting              Northing   Easting      Northing
     C1                 Upstream of the realignment                 Control         1570704               5187873    1570735      5187915
                        Downstream of the
     C2                                                             Control         1570954               5188546    1570998      5188513
                        realignment
     R1                 Upstream end of realignment               Realigned         1570823               5188080    1570849      5188091
     R2                 Middle of realignment                     Realigned         1570919               5188249    1570938      5188275
                        Downstream end of
     R3                                                           Realigned         1570981               5188333    1571002      5188377
                        realignment

    2.2          Water quality
    Spot measures of water quality parameters were collected at each site using a Pro-DSS
    handheld water quality meter. Parameters measured were water temperature, pH, specific
    conductivity (μS / cm) and dissolved oxygen (mg / L and % saturation).

    2.3          Riparian and in-stream habitat
    Riparian and in-stream habitat was evaluated using the same methodologies established by the
    baseline survey (Boffa Miskell, 2016) and following standard protocols of Harding et al. (2009)
    and Clapcott et al. (2011):

          •    Protocol 3 (P3) Quantitative protocol of Harding et al. (2009) 1:
                -     P3b: Hydrology and morphology procedure;
                -     P3c: In-stream habitat procedure; and
                -     P3d: Riparian procedure.

          •    Sediment Assessment Methods of Clapcott et al. (2011):
                -     Sediment Assessment Method 2 (SAM2) – in-stream visual estimate of % sediment
                      cover; and
                -     Sediment Assessment Method 6 (SAM6) – sediment depth.
    In summary, these habitat assessment methods involved measuring a range of in-stream and
    riparian physical habitat conditions at various distances across six equally spaced transects
    established across the waterway every 10 m. The first (downstream most) and last (upstream
    most) transects were located at the co-ordinates provided in Table 1.
    Parameters measured included:

          •    P3b: wetted width, water depth, sediment depth, water velocity

    1
      Protocol 3 of Harding et al. (2009) specifies that two cross-sections should be located in each of riffle, run, and pool
    habitat. However, Kā Pūtahi Creek is dominated by slow-flowing run habitat, with riffles and pools being largely absent,
    so all six cross-sections at each site were established within run habitat.

2   Boffa Miskell Ltd | Kā Pūtahi Creek Ecology | Five years after the realignment works | 19 July 2021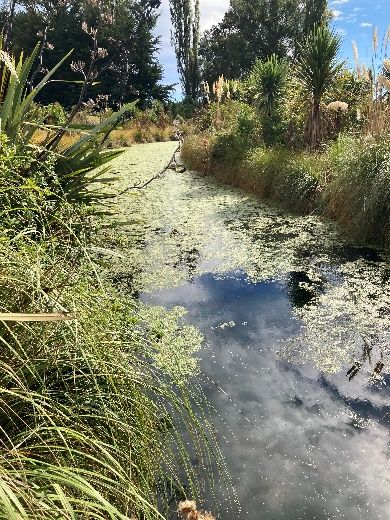
•    P3c: substrate size, substrate embeddedness, substrate compactness, extent of
          depositional or scouring zones, total cover of macrophytes, algae, leaf packs and large
          wood, bank cover

     •    P3d: buffer width and floodplain width, riparian vegetation type, height and cover,
          access to the stream, extent of bank erosion, and stream shading

     •    SAM2 & SAM 6: sediment cover and sediment depth.
Full details of Harding et al. (2009) P3 and Clapcott et al. (2011) SAM2 and SAM6, including
field-sheet templates, are provided in Appendix 1.
Photographs of the upstream and downstream views of each site were also taken.
Habitat assessments took place from 4-8 March 2021.

2.4         Macroinvertebrate community
Macroinvertebrates (e.g., insects, snails and worms that live on the stream bed) can be
extremely abundant in streams and are an important part of aquatic food webs and stream
functioning. Macroinvertebrates vary widely in their tolerances to both physical and chemical
conditions, and are used regularly in biomonitoring, providing a long-term picture of the health of
a waterway.
The macroinvertebrate community was assessed at each site within the same 50 m reach where
in-stream habitat was surveyed, from 4-8 March 2021.
Five replicate Surber samples (0.05 m2, 500-µm mesh) were collected from each of the 4 sites
following Protocol C3 of Stark et al. (2001). Surber samples were randomly collected from the
most appropriate habitat available 2 at each site and disturbed to an approximate depth of 5 cm.
Macroinvertebrate samples were preserved in 70% ethanol prior to sending to Boffa Miskell’s
taxonomy laboratory for identification and counting in accordance with protocol P3 of Stark et al
(2001). Macroinvertebrates were identified to species level, where possible, and thereafter to
MCI level.

2
 Protocol C3 of Stark et al. (2001) recommends the use of a Surber sampler for quantitative sampling. However, the
use of the Surber sampler can be ineffective in deep, low velocity areas as this sampling method relies on flow to wash
organisms dislodged from the substrate into the net.

                                  Boffa Miskell Ltd | Kā Pūtahi Creek Ecology | Five years after the realignment works | 19 July 2021   3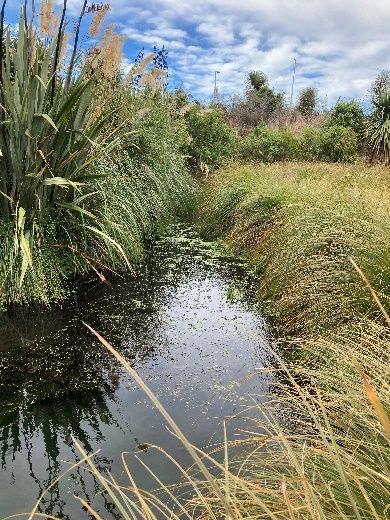
File Ref: BM200928_002_A4L_Monitoring.mxd
own risk. Where information has been supplied by the Client or obtained from other external sources, it has been assumed that it is accurate. No liability or responsibility is accepted by Boffa Miskell Limited for any errors or
This plan has been prepared by Boffa Miskell Limited on the specific instructions of our Client. It is solely for our Client's use in accordance with the agreed scope of work. Any use or reliance by a third party is at that party's
Be
lfas
tR
d
Rd
Fr
an
kC C2
kes
ox o
Bla
nR
d
74 y
wa
igh
te H
Sta
W il R3
l i am
Nic
hol
ls D
r
R2
omissions to the extent that they arise from inaccurate information provided by the Client or any external source.
R1
Tho
mp
son
sR
d
C1
4
y7
wa
gh
Hi
ate
St
Sourced from the LINZ Data Service and licensed for re-use under the Creative Commons Attribution 4.0
0 100 m LEGEND KĀ PŪTAHICREEK AQUATI
C ECOLOGY
°
Data Sources:
1:5,000 @ A4
Cadastre sourced from LINZ data service
Control sites
Realignment sites
Existing and realigned channel
Old Channel
2021 Monitoring Sites
Date: 14 June 2021 | Revision: 0
Fi
gur
e1
Waterways sourced from Christchurch City Council Plan prepared for Christchurch City Council by Boffa Miskell Limited
Projection: NZGD 2000 New Zealand Transverse Project Manager: t
anya.
blak el
y@bof
fami
sk el
l.
co.
nz | Drawn: AGa | Checked: TBl
www.
bof
fami
sk el
l.
co.
nz Mercator2.5 Fish community
Each site was revisited between 9 and 11 March 2021 to assess the fish community.
To allow for comparisons between sites and among years, the fish community was assessed at
all sites using a combination of fyke nets and Gee minnow traps. At each site, two fyke nets
(baited with tinned cat food) and five Gee minnow traps (baited with marmite) were set within
each of the 50 m survey reaches late in the afternoon and left overnight. The following morning,
all fish captured were identified and measured to the nearest 5 mm before being returned alive
to the stream.
Of the six sites surveyed, electric fishing was only suitable at Site C1, due to high sediment
cover, low water velocity and high macrophyte cover at all other sites. Electric fishing data was
not included in any analyses, however, findings from electric fishing at C1 are discussed.
Assessments of the fish community were conducted in accordance with Boffa Miskell’s research
and collection permit from the Department of Conservation (pursuant to section 26ZR of the
Conservation Act 1987) and a Special Permit from the Ministry for Primary Industry (pursuant to
section 97(1) of the Fisheries Act 1996.
2.6 Data analysis
Water quality
Water quality parameters were compared between treatments and across survey occasions,
and also against the Freshwater Outcomes indicator values as set out in the Canterbury Land
and Water Regional Plan 2015 (LWRP) and the CCC’s Comprehensive Stormwater Network
Discharge Consent (CSNDC, CRC214226).
Riparian and in-stream habitat assessments
The multiple measures across transects for the various riparian and in-stream habitat variables
recorded at each site were averaged to give an average value for each parameter per cross-
section. Cross-sections within a site were used as replicates in statistical analyses.
Two-way analyses of variance (ANOVAs) were used to test for differences in mean habitat
conditions among sites. Response variables were log (x+1) transformed where necessary to
meet assumptions of normality and homogeneity of variances. ANOVAs were performed in R
version 3.5.1 (The R Foundation for Statistical Computing 2018).
Where appropriate, values were also compared with the Freshwater Outcomes indicator values
as set out in the LWRP.
Macroinvertebrate community
The following macroinvertebrate metrics and indices were calculated to provide an indication of
stream health:
• Macroinvertebrate abundance – the average number of individuals collected in the
five replicate Surber samples collected at each site. Comparisons of abundance of
Boffa Miskell Ltd | Kā Pūtahi Creek Ecology | Five years after the realignment works | 19 July 2021 5macroinvertebrates among sites can be useful as abundance tends to increase in the
presence of organic enrichment, particularly for pollution-tolerant taxa.
• Taxonomic richness – the average number of macroinvertebrate taxa recorded from
the five Surber samples collected at each site. Streams supporting high numbers of
taxa generally indicate healthy communities, however, the pollution sensitivity /
tolerance of each taxon needs to also be considered.
• EPT taxonomic richness – the average number of Ephemeroptera (mayflies),
Plecoptera (stoneflies) and Trichoptera (caddisflies) recorded from the five Surber
samples collected at each site. These three insect orders (EPT) are generally sensitive
to pollution and habitat degradation and therefore the numbers of these insects provide
a useful indicator of degradation. High EPT richness suggests high water quality, while
low richness indicates low water or habitat quality.
• EPT taxonomic richness (excl. hydroptilids) – the average number of EPT taxa
excluding caddisflies belonging to the family Hydroptilidae, which are generally more
tolerant of degraded conditions than other EPT taxa.
• %EPT richness – the percentage of macroinvertebrates that belong to the pollution-
sensitive EPT orders found in the five Surber samples collected at each site, i.e. relative
to total richness of all macroinvertebrates at each site. High %EPT richness suggests
high water quality.
• %EPT (excl. hydroptilids) – the percentage of EPT taxa at each site, excluding the
more pollution-tolerant hydroptilid caddisflies.
• Macroinvertebrate Community Index (MCI-hb) 3 – this index is based on the tolerance
scores of Stark and Maxted (2007) for individual macroinvertebrate taxa found in the
five Surber samples collected at each site. These tolerance scores, which indicate a
taxon’s sensitivity to in-stream environmental conditions, are summed for the taxa
present at a site, and multiplied by 20 to give MCI-hb values ranging from 0 – 200.
• Quantitative Macroinvertebrate Community Index (QMCI-hb)3 – this is a variant of
the MCI-hb, which instead uses abundance data of the five replicate Surber samples.
The QMCI-hb provides information about the dominance of pollution-sensitive species
at a site.
Table 2 provides a summary of how MCI-hb and QMCI-hb scores were used to evaluate stream
health.
Table 2. Interpretation of MCI-hb and QMCI-hb scores for soft- bottomed streams (Stark & Maxted 2007).
Stream health Water quality descriptions MCI QMCI
Excellent Clean water >119 >5.99
Good Doubtful quality or possible mild enrichment 100-119 5.00-5.90
Fair Probable moderate enrichment 80-99 4.00-4.99
Poor Probable severe enrichmentTwo-way ANOVAs, with treatment and year as factors, were used to test for differences in
averages: (1) between treatments (control and realigned sites); (2) among years (2016 –
baseline, 2017 – 1-year post-realignment; and 2021 – 5-years’ post-realignment); and (3) the
interaction between treatment and year:
• macroinvertebrate abundance;
• taxonomic richness;
• EPT richness;
• EPT-except Hydroptilidae richness;
• MCI; and
• QMCI values.
Response variables were ln (x+1) transformed to meet assumptions of normality and
homogeneity of variances. ANOVAs were performed in R version 3.5.1 (The R Foundation for
Statistical Computing 2018).
A non-metric multidimensional scaling (or NMDS) ordination 4, with 999 random permutations,
using abundance data (averages from Surber samples) was used to determine if the
macroinvertebrate community found was similar among the 5 sites surveyed, between control
and rehabilitation sites, and through time (i.e., baseline, one-year, and five-years post-
rehabilitation).
NMDS ordinations rank sites such that distance in ordination space represents community
dissimilarity (in this case using the Bray-Curtis metric). Therefore, an ordination score (an x and
a y value) for the entire macroinvertebrate community found at any site can be presented on an
x-y scatterplot to graphically show how similar (or dissimilar) the community at a site is from that
found at another site. Ordination scores that are closest together are more similar in
macroinvertebrate community composition, than those further apart (Quinn and Keough 2002).
An analysis of similarities (ANOSIM), with 100 permutations, was then used to test for
significant differences in macroinvertebrate community composition: between control and
realigned sites; and among baseline (Boffa Miskell, 2015); one-year post-rehabilitation (EOS
Ecology, 2017); five-years post-rehabilitation (this survey).
It is helpful to view ANOSIM results when interpreting an NMDS ordination. An NMDS ordination
may show that communities appear to be quite distinct (i.e., when shown graphically, sites could
be quite distinct from one another in ordination space), but ANOSIM results show whether these
differences are in fact statistically significantly different 5.
If ANOSIM revealed significant differences in macroinvertebrate community composition (i.e., R
≠ 0 and P ≤ 0.05) between treatments (control and realigned sites), or among years (baseline,
4
Goodness-of-fit of the NMDS ordination was assessed by the magnitude of the associated ‘stress’ value. A stress
value of 0 indicates perfect fit (i.e., the configuration of points on the ordination diagram is a good representation of
actual community dissimilarities). It is acceptable to have a stress value of up to 0.2, indicating an ordination with a
stress value ofone-year, and five-years post-rehabilitation), similarity percentages (SIMPER) were calculated 6
to show which macroinvertebrate taxa were driving these differences.
NMDS, ANOSIM and SIMPER analyses were performed in PRIMER version 7.0.13 (Clarke and
Warwick 2001; Clarke and Gorley 2006).
Fish community
The fish capture data were expressed as ‘catch per unit effort’ (CPUE), to enable any future
comparisons of fish community information that may use different methods or sampling effort.
CPUE was calculated by dividing the number of fish captured by the total number of traps and
nets deployed at a site. CPUE was, therefore, expressed as number of fish per trap per night.
ANOVAs were used to test for differences in averages: (1) between treatments (control and
realigned sites); (2) among years (2016 – baseline; 2017 – 1-year post-realignment; and 2021 –
5-years post-realignment); and (3) the interaction between treatment and year of abundance
and total richness of fish captured.
Response variables were ln (x+1) transformed to meet assumptions of normality and
homogeneity of variances. ANOVAs were performed in R version 3.5.1 (The R Foundation for
Statistical Computing 2018).
An NMDS ordination, with 999 random permutations, using abundance data was also used to
determine if the fish community found was similar among the sites surveyed, between control
and realigned sites, and through time (i.e., baseline, one-year, and five-years post-
rehabilitation).
An analysis of similarities (ANOSIM), with 100 permutations, was then used to test for
significant differences in fish community composition: between control and realigned sites; and
among baseline (Boffa Miskell 2016); one-year post-rehabilitation (EOS Ecology 2017); and
five-years post-rehabilitation (this survey, 2021).
If ANOSIM revealed significant differences in fish community composition (i.e., R ≠ 0 and P ≤
0.05) between treatments (control and realigned sites), or among years (baseline, one-year,
and five-years post-rehabilitation), similarity percentages (SIMPER) were calculated to show
which fish species were driving these differences.
NMDS, ANOSIM and SIMPER analyses were performed in PRIMER version 7.0.13 (Clarke and
Warwick 2001; Clarke and Gorley 2006).
6
The SIMPER routine computes the percentage contribution of each macroinvertebrate taxon to the dissimilarities
between all pairs of sites among groups.
8 Boffa Miskell Ltd | Kā Pūtahi Creek Ecology | Five years after the realignment works | 19 July 20213.0 Ecological Conditions
3.1 Site descriptions
3.1.1 Control sites
The control sites, C1 and C2, were established in the baseline survey, and are located
upstream (C1) and downstream (C2) of the realigned reach of Kā Pūtahi Creek (Figure 1).
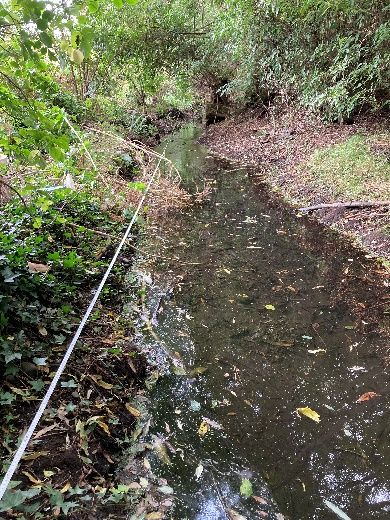
C1 (Photo 1) is located within an area of mature exotic trees and alongside the new CNC. Here,
the creek is an average of 1.3 m wide, shallow (average of 15.4 cm) and is dominated by run
and pool habitat. There is a small section of riffle (about 3 m long), which was the only riffle
seen at any of the survey sites. The water velocity was faster than at other survey sites,
however, was still slow at 0.02 m / s. Riparian vegetation on both banks is dominated by exotic
trees and shrubs, including elder and crack willow. The riparian buffer extends for approximately
60 m on the true left (TL) bank and 8 m on the true right (TR) bank, providing near-complete
shading for the creek along the surveyed reach. Wandering willy provides groundcover in some
places along the 50 m reach, however, the banks are typically bare earth. In some places, the
banks are eroding into the waterway.
There were no macrophytes along the survey reach at C1 in the 2021 survey, compared to
cover recorded in the ‘Year One’ survey (10.8%) and a very small amount of cover in the
baseline survey (0.6%). No algae was recorded along the reach, nor any log jams or large
boulders. There was less woody debris and leaf packs (average of 1.2 cm and 2.8 cm
respectively, across an average width of 1.34 m) present in 2021 than observed in the ‘Year
One’ survey (22.5 cm woody debris and 5 cm leaf pack across an average width of 1.8 m).
The stream bed substrates were dominated by silt and clay, with occasional patches of cobbles.
The substrates had an average compactness score of 2.3, where although dominated by finer
substrates, the riverbed substrates were mostly loose, with little compaction. Substrate was
moderately embedded with an average score of 2.7. Fine sediment cover was slightly lower in
the 2021 survey than previously, with 83.5% average cover, compared to 95% and 93%
recorded in the baseline and ‘Year One’ surveys respectively. Soft sediment was 10.75 cm
deep on average in this survey.
Photo 1. Site C1 view looking upstream (left) and downstream (right).
Boffa Miskell Ltd | Kā Pūtahi Creek Ecology | Five years after the realignment works | 19 July 2021 9Site C2 (Photo 2) is located downstream of the realigned reach of the Kā Pūtahi Creek and runs
through farm paddocks. Here, the waterway is entirely run habitat that is on average 2.9 m wide
and 22.1 cm deep. On the day of surveying, water flowed slowly with an average velocity of
0.02 m/s.
It is important to note that measuring velocity at this site was difficult due to a high cover of
macrophytes and debris restricting the available clear water to measure velocity.
Both TL and TR banks were vegetated with rank grass and intermittent mature exotic trees
(poplars and willows) along the wetted edge. These trees provide shading to the stream along
most of the reach. The root systems from these trees have created significant areas of stable
undercuts, with 31 m (of the total 50 m of stream length surveyed) of undercut habitat present
on the TR, and 14 m of undercut on the TL. The riparian buffer was 0.5-1.0 m wide on both
banks. The waterway is fenced on both sides, however, stock may be able to access the
waterway on the true left as there were areas where the fence had fallen over.
Macrophyte and algae cover was higher than that seen in previous surveys, with filamentous
algae covering approximately 20% of the bed (determined from an average measure across the
transects). Woody debris was prevalent along the reach and covered more of the reach than
observed in the baseline and ‘Year One’ surveys.
The substrate at C2 was almost entirely silt / sand and had a compactness score of 4 indicating
very compact substrate. Soft sediment cover and depth measurements reflected this, with an
average sediment depth of 36.5 cm and cover of 100%. Soft sediment at C2 was the deepest of
any site and was similar to that seen in previous surveys.
Photo 2. Site C2 view looking upstream (left) and downstream (right).
3.1.2 Realigned reach sites
The realigned section of the Kā Pūtahi Creek is approximately 350 m long. Three monitoring
sites were established in the ‘Year One’ survey (EOS Ecology, 2017) in the upstream, middle
and downstream sections of the realigned stream. This is the second survey undertaken at the
three sites, five years following the realignment of the waterway.
Site R1 (Photo 3) is the upstream-most of sites along the realigned section of Kā Pūtahi Creek.
The waterway at R1 was an average of 4.4 m wide and 21.4 cm deep. Dense macrophytes and
very slow water flow in areas clear of macrophytes prevented water velocity from being
accurately measured. The habitat is approximately half run and half pool habitat.
10 Boffa Miskell Ltd | Kā Pūtahi Creek Ecology | Five years after the realignment works | 19 July 2021The planted riparian vegetation at R1 has become well established and sedges (Carex species)
dominate the vegetation community along the wetted edge. Other species along the waters’
edge include flaxes and toetoe. These sedges at the downstream end of survey reach overhang
the waterway creating in-stream habitat, however, water levels were low at the time of the
survey and no vegetation overhung the water in the upstream part of the survey reach. Very
little shading is present over the stream, with some overhanging sedges providing a small
amount of shading immediately underneath them. Taller growing vegetation is set back from the
wetted edge and provides limited shade at times to the channel. In the upstream-most half of
the survey reach, macrophytes (watercress) entirely covered the width of the waterway
restricting water flow (Photo 3, downstream view).
A construction phase stormwater discharge pipe from the adjacent subdivision has been
installed since the 1-year post-realignment survey. While we did not observe this in our survey,
Belinda Margetts (Principal Waterways Ecologist visited the site on 16 July 2021 and noted that
there were no obvious effects from the discharge. The pipe discharges to ground (on the bank)
rather than into the waterway directly (Photo 3).
The substrate at this site is predominantly cobbles covered by a significant amount of sediment.
100% of the reach was covered by sediment, compared to 52% at the ‘Year One’ survey.
Sediment was an average depth of 4.6 cm, compared to 0.5 cm in the ‘Year One’ survey. Here,
fine sediment was not overly compact over and around the cobbles and the substrate was
slightly embedded, with an average score of 2.3. Sediment and cobbles were moderately
compact with an average compactness score of 2.7.
Photo 3. Site R1 view looking upstream (top left) and downstream (top right); construction-phase stormwater discharge
pipe (bottom).
Boffa Miskell Ltd | Kā Pūtahi Creek Ecology | Five years after the realignment works | 19 July 2021 11Site R2 (Photo 4) is in the middle of the realigned reach of the Kā Pūtahi Creek. The survey
reach largely follows a bend which is relatively narrow at the downstream end, widening at the
upstream end. The waterway has an average width of 3 m and average depth of 25.8 cm.
Habitat conditions at R2 are very similar to those at R1. The upper portion of the survey reach
was smothered by dense macrophytes (watercress) and velocity data was not able to be
collected. Downstream of the macrophytes, velocity was negligible. While the water is moving
very slowly, the habitat is almost entirely pool habitat (84%), with about 8 m of run habitat
present within the 50 m survey reach.
The riparian vegetation at R2 is in very good condition, with sedges, flaxes and toetoe having
grown to overhang the waterway providing good habitat for aquatic fauna. While again, there is
limited shading provided by taller vegetation over the channel, some shading is provided by
these trees and shrubs at times. The banks are well stabilised by the riparian vegetation. Where
the waterway widens in the upper part of the survey reach, watercress is prevalent, restricting
water flow. Macrophytes were present, on average, across 20.6% of transects, and algae over
8.2%.
The substrate at this site is, again, small cobbles covered by fine sediment. Sediment covered
the entirety of the site in a thin layer that was no deeper than 1 cm at any point measured. The
substrate is slightly embedded with an embeddedness score of 2 and is moderately loose with
an average compactness score of 2.2.
Photo 4. Site R2 view looking upstream (left) and downstream (right).
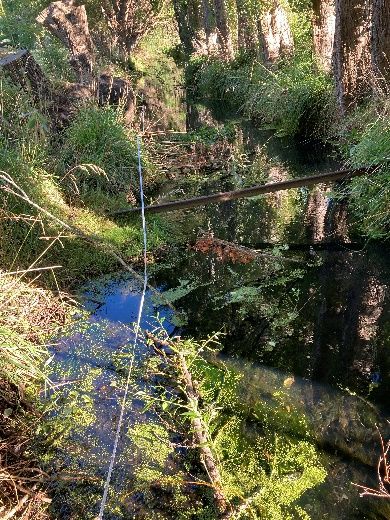
Site R3 (Photo 5) is located at the downstream end of the realigned section of Kā Pūtahi Creek.
The waterway is very wide (average width 7.9 m), and there is little to no flow, meaning habitat
is entirely pool or still habitat.
The riparian vegetation is well established, with large sedges, flaxes and toetoe alongside the
wetted edge on both banks. These sedges provide overhanging vegetation, creating habitat for
aquatic fauna. Taller growing vegetation, such as tī kōuka / cabbage trees and Pittosporum
species, is set behind the sedges, primarily on the TR bank. These taller species have grown
well to stabilise banks and provide some shading to the waterway at times. However, due to the
very wide nature of the channel, shading to the waterway from these trees will remain limited.
Most of the survey reach was covered by common duckweed (Lemna disperma), with dense
curly-leaved pondweed (Potamogeton crispus) throughout the water column beneath.
12 Boffa Miskell Ltd | Kā Pūtahi Creek Ecology | Five years after the realignment works | 19 July 2021The substrate at R3 is dominated by small cobbles. Sediment covers the entire site in a thin
layer over cobbles, with an average depth of 1 cm. There was no fine sediment cover observed
in the ‘Year One’ survey. The substrate is not embedded, with an average embeddedness score
of 1.3. The substrate is mostly loose and easily moved, with an average compactness score of
1.8.
Photo 5. Site R3 view looking upstream (left) and downstream (right).
3.2 General habitat conditions
3.2.1 Water quality
Table 3 provides a summary of the water quality parameters measured at the five sites in March
2021.
Table 3. Water quality parameters measured in Kā Pūtahi Creek in 2021, five years after realignment works.
Specific
Site Temperature
Date Time pH conductivity DO mg/L DO %
number °C
µS / cm
C1 4/03/2021 10:36 14.9 7.17 125.4 6.47 63.9
C2 5/03/2021 09:02 13.8 7.18 199.7 2.28 22.0
R1 4/03/2021 13:51 17.7 7.26 125.1 6.97 73.2
R2 5/03/2021 13:24 15.3 7.41 127.9 7.93 79.1
R3 5/03/2021 11:15 14.1 7.45 155.3 5.81 56.5
Water temperature varied across sites (Table 3) and were relatively similar to those recorded in
previous surveys. Temperature can fluctuate both daily and seasonally, so it is important to note
that water temperature was only measured once at each site on each sampling occasion.
pH was circum-neutral at all sites and is likely to be within a tolerable range for aquatic fauna.
pH levels at all sites were also within the LWRP guidelines of between 6.5 and 8.5. There were
no discernible differences in pH in any year between control and realigned sites.
Specific conductivity was variable across sites in this survey (2021). Conductivity was variable
through time, with levels recorded in this survey being lower than that measured in the ‘Year
Boffa Miskell Ltd | Kā Pūtahi Creek Ecology | Five years after the realignment works | 19 July 2021 13One’ survey (2017). Conductivity was only measured once at each site in each survey and can
fluctuate both daily and seasonally, which is important to consider when comparing this data.
Dissolved oxygen levels were relatively low at all sites, with very low dissolved oxygen (22%) at
C2 and the remaining sites ranging from 56% to 79% dissolved oxygen saturation and 2.28 to
7.93 mg / L. The LWRP sets a guideline of 70% as the minimum acceptable value for “spring-
fed – plains waterways” and “spring-fed – plains – urban waterways”, for which only two sites
were better than this minimum threshold (R1 and R2).
It is important to note that DO was also only measured once at each site. DO can fluctuate both
diurnally and seasonally and is also impacted by other factors such as cover of macrophytes.
However, high levels of sediment and large proportions of detritus could also have a role, and
the low DO concentrations at sites measured could be a real result. If this is the case, these low
DO levels may be adversely affecting in-river fauna.
3.2.2 Riparian and in-stream habitat
Wetted width
The average wetted width at realigned sites in the 2021 survey was 509.2 cm, compared to
213.6 cm at control sites (Figure 2). Wetted width was relatively similar to the previous (2017)
survey, and realigned sites were similar in average wetted width to that of the sites within the
oxbow (baseline survey). Wetted width at control sites in the baseline study were greater than
measured after the realignment, in 2017 and 2021. This was due to greater wetted width
measured at Site C2. A similar trend is seen for water depth, as discussed below.
When all data from the three surveys was analysed, there was no significant difference in
wetted width between treatments (i.e., control vs realigned sites) (F1,9 = 0.615, P = 0.187), nor
between surveys (F2,9 = 0.964, P = 0.255), due to the high variability in wetted width of the
waterway.
There was no significant interaction between treatment and year for the wetted width
(Treatment: Year interaction: F1,9 = 0.021, P = 0.799).
Figure 2. Average (±1SE) wetted width (cm) measured at the control and realigned sites for the baseline study (2016,
black bars), one-year post-rehabilitation (2017, grey bars), and five-years post-rehabilitation (this survey – 2021, white
bars).
14 Boffa Miskell Ltd | Kā Pūtahi Creek Ecology | Five years after the realignment works | 19 July 2021Water depth
The average water depth at realigned sites in this survey was 26.3 cm, compared to 20.5 cm at
control sites (Figure 3). It’s important to note that water depth was significantly greater at Site
C2 in the baseline study, compared to that measured in 2017 and 2021. Following realignment
water depth is relatively similar between realigned and control reaches; when analysing all data
from the three surveys, there was no significant difference in water depth between treatments
(F1,9 = 0.003, P = 0.868), nor between surveys (F2,9 = 0.618, P = 0.115). There was no
interaction between treatment and year for water depth (Treatment: Year interaction: F1,9 =
0.024, P = 0.656).
It’s unclear why water depth at Site C2 was so much greater in the baseline study than in 2017
and 2021. Wetted width was also greater at Site C2 in the baseline study, so it’s likely there was
a channel blockage downstream affected wetted width and water depth at C2. This may have
been removed prior between the baseline and Year 1 survey, or more likely channel capacity
was affected by the oxbow resulting in a wide wetland-like system at C2 prior to livening of the
realignment (refer to Figure 1 for location of sites).
Figure 3. Average (±1SE) water depth (cm) measured at the control and realigned sites for the baseline study (2016,
black bars), one-year post-rehabilitation (2017, grey bars), and five-years post-rehabilitation (this survey – 2021, white
bars).
Macrophyte cover
There was higher cover of macrophytes at the realigned sites, than control sites in 2021, with an
average of 60.7% cover in realigned sites and just 3.2% cover at control sites. This difference
was significant (F1,9 = 72.02, P < 0.05). While macrophyte cover at realigned sites in 2021
appeared much higher than in other surveys, there was no significant difference in macrophyte
cover between surveys (F2,9 = 0.618, P = 0.115).
There was no significant interaction between year sampled and treatment (Treatment: Year
interaction: F1,9 = 36.82, P = 0.052) (Figure 4).
Boffa Miskell Ltd | Kā Pūtahi Creek Ecology | Five years after the realignment works | 19 July 2021 15Figure 4. Average (±1SE) macrophyte cover (%) measured at the control and realigned sites for the baseline study
(2016, black bars), one-year post-rehabilitation (2017, grey bars), and five-years post-rehabilitation (this survey – 2021,
white bars).
Embeddedness & compactness
There was a significant difference in embeddedness between treatments (F1,9 = 15.51, P <
0.001), where embeddedness was higher at control sites than at realigned sites. There was no
significant difference in embeddedness between surveys (F2,9 = 0.52, P = 0.344). This is
reflected by the high sediment cover and absence of cobble materials at control sites.
There was no interaction between year and treatment when embeddedness data was analysed
(Treatment: Year interaction: F1,9 = 0.504, P = 0.161).
There was a significant difference in compactness between treatments (F1,9 = 1.216, P < 0.001),
where compactness was higher at control sites than at realigned sites (Figure 5). There was no
significant difference in average compactness between surveys (F2,9 = 0.113, P = 0.06).
There was also an interaction between year sampled and treatment for compactness, where
realigned sites in both 2017 and 2021 had a lower average compactness than that observed at
control sites, with the exception of control and realigned sites in 2021, which were not
significantly different (Treatment: Year interaction: F1,9 = 0.208, P < 0.01) (Figure 5).
16 Boffa Miskell Ltd | Kā Pūtahi Creek Ecology | Five years after the realignment works | 19 July 2021Figure 5. Average (±1SE) compactness measured at the control and realigned sites for the baseline study (2016, black
bars), one-year post-rehabilitation (2017, grey bars), and five-years post-rehabilitation (this survey – 2021, white bars).
Soft sediment cover
Soft sediment cover at realigned sites was on average 100% of each reach, with control sites
averaging 91.8% cover. There was no significant difference in sediment cover between
treatments (F1,9 = 0.06, P = 0.757), nor between surveys (F2,9 = 3.24, P = 0.124). Sediment
cover at realigned sites has increased from 17.3% average cover at the time of the ‘Year One’
survey to 100% cover in 2021.
There was no interaction between year sampled and treatment for sediment cover, where
realigned sites in 2017 had much lower average compactness than that observed at any other
time (Treatment: Year interaction: F1,9 = 2.32, P = 0.08 (Figure 6).
Figure 6. Average (±1SE) sediment cover (%) measured at the control and realigned sites for the baseline study (2016,
black bars), one-year post-rehabilitation (2017, grey bars), and five-years post-rehabilitation (this survey – 2021, white
bars).
Boffa Miskell Ltd | Kā Pūtahi Creek Ecology | Five years after the realignment works | 19 July 2021 17Sediment depth
At realigned sites in 2021, average sediment depth was 2.2 cm, compared to an average of
23.6 cm at control sites. There was a significant difference in sediment depth between
treatments (F1,9 = 23.62, P < 0.001), where sediment was significantly deeper at control sites
than at realigned sites (Figure 7). There was no significant difference in average sediment depth
between surveys (F2,9 = 1.57, P = 0.355), nor any interaction between year and treatment
(Treatment: Year interaction: F1,9 = 0.281, P = 0.534).
70
60
Average sediment depth (cm)
50
40
30
20
10
0
Control Realigned
Baseline Year 1 Year 5
Figure 7. Average (±1SE) sediment depth (cm) measured at the control and realigned sites for the baseline study (2016,
black bars), one-year post-rehabilitation (2017, grey bars), and five-years post-rehabilitation (this survey – 2021, white
bars).
Algae
Average algae cover was 8.2% at realigned sites and 27.9% at control sites in 2021. This is
compared to 64.5% cover at realigned sites and 1.6% cover at control sites in 2017. There was,
however, no significant difference in algae cover between treatments (F1,9 = 22.15, P = 0.124),
nor between surveys (F2,9 = 12.23, P = 0.481) (Figure 8). There was no interaction between
treatment and year (Treatment: Year interaction: F1,9 = 36.82, P = 0.056).
18 Boffa Miskell Ltd | Kā Pūtahi Creek Ecology | Five years after the realignment works | 19 July 2021Figure 8. Average (±1SE) algal cover (%) measured at the control and realigned sites for the baseline study (2016,
black bars), one-year post-rehabilitation (2017, grey bars), and five-years post-rehabilitation (this survey – 2021, white
bars).
Vegetation and canopy cover
Vegetation cover was assessed from the wetted edge of the waterway for 20 m at each
transect. Vegetation cover at realigned sites has increased substantially since the ‘Year One’
survey. Low cover vegetation (0-0.3 m) has increased from 21.7% (± 11.5 S.E.) in 2017 to
70.1% (± 10.8 S.E.) in 2021. Small shrubs and grasses (0.3-1.9 m of height) covered 7.9% (±
5.8 S.E.) in the ‘Year One’ survey, with an increase to an average of 68.7% (± 9.2 S.E.) cover in
this survey. In this survey, vegetation cover 2.0-4.9 m high was 10.6% (± 5.4 S.E.) on average,
and vegetation 5-12 m high was present on average in 2.2% (± 0.7 S.E.) of the area surveyed.
No vegetation had grown over 2 m at the time at the time of the ‘Year One’ survey.
Canopy cover was measured at 20 points at each site. Average canopy cover at realigned sites
in the ‘Year Five’ survey was 2.9%, compared to 88.1% at control sites. In 2017, average
canopy cover at realigned sites was 5.4%. This may be due to slight variation in transect
location rather than a decline in canopy cover.
Velocity
While water was visibly moving in places, velocity in the realigned reach of Kā Pūtahi Creek was
negligible, and unable to be measured in 2021 in most places. High macrophyte cover further
contributed to this.
Velocity was very slow at control sites, with an average of 0.02 m / s (±0.002 SE). Measuring
velocity was also difficult at control sites due to high cover of woody debris and filamentous
algae.
3.3 Macroinvertebrate community
3.3.1 Overview in 2021
A total of 46,318 individuals belonging to 49 taxonomic groups were collected in all Surber
samples across the five sites in 2021.
Boffa Miskell Ltd | Kā Pūtahi Creek Ecology | Five years after the realignment works | 19 July 2021 19The most diverse group was true flies (Diptera), for which there were 15 different taxa, followed
by caddisflies (Trichoptera) with 9 taxa, crustaceans with five taxa, molluscs with four taxa and
Odonata and true bugs (Hemiptera) each with three taxa. Aquatic worms (Annelida) were
represented by two taxa, and the remaining macroinvertebrate groups were represented by a
single taxon (mites, Acarina; spiders, Arachnids; Hydra, Cnidaria; beetles, Coleoptera; mayflies,
Ephemeroptera; roundworms, Nematoda; Nemertea; and flatworms, Platyhelminthes).
While crustaceans (made up by ostracods (seed shrimp) and Paracalliope amphipods) were not
particularly diverse, they were numerically dominant (i.e., the most abundant group). Snails
(Mollusca) were the next most dominant group numerically, followed by worms, then true flies.
Some taxa were present in only very low numbers, with only one or two individuals representing
a taxon in some cases.
Crustaceans were also the dominant macroinvertebrate group, making up 55% of all
macroinvertebrates collected from the five sites. The most abundant taxon was the freshwater
seed shrimp, which made up a significant proportion of communities found at each site.
Molluscs made up the next largest proportion of the community at 28%. True flies were the most
diverse group of taxa collected, but only made up 3.5% of the macroinvertebrate community
found.
There were several taxa found at all sites surveyed, including the highly abundant seed
shrimps, the snails Potamopyrgus sp. and Physa sp., and aquatic worms (Oligochaetea).
3.3.2 Total abundance
Macroinvertebrate abundance varied significantly among sites, with between 2,138 and 20,812
individuals collected in each Surber sample.
Average macroinvertebrate abundance, as determined from Surber samples, differed slightly
(but not significantly) between treatments (i.e., between control and realigned sites) (F1,9 = 1.92,
P = 0.054), where macroinvertebrate abundance was higher at realigned sites than at control
sites. However, no significant differences in abundance were detected over time (F2,9 = 1.03, P
= 0.31), nor any interaction between treatment (i.e., control versus realigned) and time sampled
(Treatment: Year interaction: F1,9 = 0.63, P = 0.24).
3.3.3 Taxonomic richness
Taxonomic richness was somewhat variable across sites in this survey, ranging on average
from 11 to 19 taxa per site.
The average number of macroinvertebrate taxa did not differ between control and realignment
sites (F1,9 = 24.23, P = 0.186). Nor was there a significant difference in taxonomic richness
among the survey years (F2,9 = 2.21, P = 0.912), or any interaction between treatment and year
for taxonomic richness (Treatment: Year interaction: F1,9 = 0.15, P = 0.913).
3.3.4 EPT richness and percent composition
The EPT insect orders (Ephemeroptera, mayflies; Plecoptera, stoneflies; and Trichoptera,
caddisflies) are generally sensitive to pollution and habitat degradation and are useful indicators
of stream health. High EPT richness suggests good water and habitat quality, while low EPT
richness suggests poorer water quality and degraded stream health. Caddisflies and mayflies
have been the only EPT taxa found in Kā Pūtahi Creek in all surveys, including this one.
20 Boffa Miskell Ltd | Kā Pūtahi Creek Ecology | Five years after the realignment works | 19 July 2021There was a total of 9 caddisfly taxa collected in the 2021 survey. This included Pycnocentria
and Polyplectropus for each of which only one individual was collected at Control Site 1. The
average number of EPT taxa collected ranged between one and eight taxa per site (average
range was 0.4 to 3.0 taxa per site). Caddisfly diversity was lowest at Realignment Site 2 which
had only one caddisfly taxa - the pollution tolerant taxon Oxyethira. Realignment Site 3 had only
two caddisfly taxa present, both of which belonged to the pollution-tolerant caddisfly family
Hydroptilidae (Oxyethira and Paroxyethira). EPT taxa richness was highest at Control Site 1,
where a total of 8 taxa were found, with an average of three taxa in each of the five Surber
samples.
Of the caddisfly taxa collected, the pollution-tolerant Oxyethira was the most abundant caddisfly
found, and was found at every site except Control 1. The other pollution-tolerant caddisfly taxa,
Paroxyethira, was found in low numbers at Realignment Sites 1 and 3, with four and eight
individuals found, respectively. No other EPT taxa were collected at Sites R2 and R3, with low
numbers (2-8 individuals) of Oecetis and Triplectides found at R1, and Triplectides at C2.
One mayfly taxon, Deleatidium, was found in low numbers at Control Site 1 (3 individuals).
Mayflies were not collected at any other site in 2021. Deleatidium was collected at Control Site
1 in and 2017 but not in 2016, and never at any other site previously.
Average EPT richness did not differ between treatments (i.e., between realignment and control
sites) nor across years (F1,9 = 1.9, P =0.19, F2,9 = 2.21, P = 0.91).
When the pollution tolerant taxa Oxyethira and Paroxythira were excluded from the analysis, no
significant difference in EPT taxa richness was found between realigned and control sites (F1,9 =
0.96, P = 0.96), nor a significant difference in average EPT taxa among years (F2,9 = 1.03, P =
0.24). There was also no interaction between treatment and year (Treatment: Year interaction:
F1,9 = 0.535, P = 0.216).
EPT made up a very small proportion of communities in all surveys. EPT taxa made up 0.1 -
0.9% of communities in the realigned reach and 3.1-3.3% at control sites in 2021. This is
compared to a maximum of 0.7% EPT taxa in the baseline survey (2016), and between 0.3 and
2.9% of the community in the 2017 survey.
Mayflies have only ever been detected at Control Site 1 in very low numbers - one individual in
2017 and four in 2021 (which equated to 0.14% of the community at that site).
3.3.5 Macroinvertebrate Community Index
MCI and QMCI scores are a measure of stream, or ecological, health with higher scores
indicating greater ecological condition. The hard-bottom versions of the MCI and QMCI were
used for Kā Pūtahi Creek as, although the bed of the waterway is now generally dominated by
soft, fine sediments, it would once have been a coarse-substrate dominated / hard-bottom
system. When using the MCI and QMCI for assessing ecosystem health, it’s important to use
the version (hard bottom versus soft bottom) most appropriate to the study system prior to
human modification.
MCI
MCI scores were somewhat variable across surveys and between realignment and control sites
(Figure 9). When data across all surveys was compared, there was no significant difference
between realignment and control sites’ average MCI scores (F1,9 = 158.7, P = 0.063 (Figure 9).
Boffa Miskell Ltd | Kā Pūtahi Creek Ecology | Five years after the realignment works | 19 July 2021 21You can also read


