MONTHLY FACTSHEET - Quantum Mutual Fund
←
→
Page content transcription
If your browser does not render page correctly, please read the page content below

M O N T H LY FAC T S H E E T

                              M A Y 2021

www.facebook.com/QuantumAMC       www.twitter.com/QuantumAMC        www.linkedin.com/Company/quantum-mutual-fund

                    www.youtube.com/QuantumMF         www.instagram.com/quantummutualfund/
Index

Contents                                       Page No.

Quantum’s View                                    03

Quantum Long Term Equity Value Fund - QLTEVF      09

Quantum Tax Saving Fund - QTSF                    15

Quantum Equity Fund Of Funds - QEFOF              21

Quantum India ESG Equity Fund - QESG              27

Quantum Liquid Fund - QLF                         34

Quantum Dynamic Bond Fund - QDBF                  40

Quantum Gold Savings Fund - QGSF                  45

Quantum Multi Asset Fund Of Funds - QMAFOF        51

Quantum Gold Fund - QGF                           58

Quantum Nifty ETF - QNIFTY                        64

Comparison Chart                                  69

Scheme Features                                   70

How To Read The Factsheet                         74

Statutory Details & Risk Factors                  75

Contact Us                                        75
QUANTUM’S VIEW FOR
MAY 2021
S&P BSE Sensex increased by 6.67% on a total return basis in
the month of May 2021. After the resurging covid-19 wave in
April, markets have reacted positively to the fall in the new
daily cases and overall positivity rate of infections this month.
On a trailing twelve-month (TTM) basis, the index has
returned 62.09%. A favourable base of May 2020 is getting
reflected in the TTM return. S&P BSE Sensex has
outperformed the developed market indices such as S&P
500 & Dow Jones Industrial Average which appreciated by
0.69% & 2.21% respectively, during the month. This has
helped the S&P BSE Sensex to reduce the
underperformance as compared to the S&P 500 & Dow
Jones Industrial Average on a YTD basis.
The broader market has done better than Sensex in the
month of May 2021. The S&P BSE Midcap Index appreciated
by 7.16% and the S&P BSE Small-cap Index rose by 8.93%.
Power & Capital goods were the winning sectors for the
month. As the Covid-19 wave receded during the month
domestic focussed sectors saw renewed interest.
Quantum Long Term Equity Value Fund saw a 7.11%
EQ U I TY O U T LOO K BY
appreciation in its NAV in May 2021. This compares to a
Sorbh Gupta 6.94% appreciation in its benchmark S&P BSE 200.
Outperformance for the month was driven by holdings in
Fund Manager, Equity Financials & Consumer discretionary. Cash in the scheme
stood at approximately 7.7% at the end of May. Our
Market Performance at a Glance approach remains to position the portfolio towards economic
recovery without undermining the risk associated with
Index YTD Returns (%) pandemic-related economic upheavals.
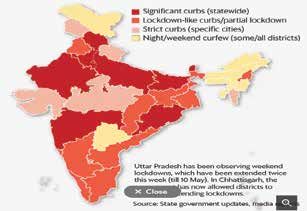
S&P BSE SENSEX 9.18 May has seen restrictions on mobility continue across most
S&P BSE 200 14.36 states. There has been some relief on the Covid-19 front as
S&P BSE MID CAP 21.80 the daily new cases, active cases and daily fatalities all are
S&P BSE SMALL CAP 30.71 trending down but the restriction on mobility has not eased.
S&P 500 12.16 The state governments are exhibiting extreme caution to not
repeat the mistakes of unlocking too quickly. Unlocking of
Past Performance may or may not be sustained in future restricted economic activity & general mobility should begin
*On Total Return Basis
Data Source: Bloomberg
in June if the covid-19 cases continue to trend downwards.
Maharashtra has already moved in that direction.
Covid Related Restriction on May 15th 2021 Daily New Covid Cases in 2021
Data Source: World-O-Meter
3
QUANTUM’S VIEW FOR
              MAY 2021
Inflation emerging as key risk:

We had flagged inflation as an emerging threat for economic recovery & equity markets in our last month’s newsletter.
Since then, there has been some let-up in global base metal prices driven by Chinese government intervention. However,
energy & food prices remain a concern. Retail petrol prices have already crossed Rs 100 per liter in many parts of the
country and diesel is following closely. The higher transportation cost is expected to seep into general inflation. Further
higher edible oil & pulses prices (India imports both these commodities in significant quantities) will add to the
discomfort of RBI in maintaining the status quo on interest rates because food forms close to 50% of the CPI basket’s
weight in India.

FII outflows continue for the second month:

After turning sellers last month FIIs have again sold Indian Equities in May.
They have sold US$ 388 mn worth of Indian Equities this month vs. selling of $1.6 bn in April. On a YTD basis, FPI inflows
stand at US$ 5.44 bn. DIIs have been buyers in May to the tune of US$ 280 mn. The sharp reversal in global interest rates
and recurrence of covid-19 induced uncertainty remains a risk to near-term foreign flows.

Equity markets moving from resilience to complacency:

Equity markets have welcomed the reduction of Covid-19 caseload and moved up sharply this month. They are already
factoring in improvement in economic data and pent-up demand to some extent as the unlocking happens. Economic
shocks like demonetization, an ill-planned GST implementation, IL&FS bankruptcy-induced credit tightness and lockdowns
have tested the best of the corporate balance sheets & business models in the last few years. While larger companies
are better placed to handle such jolts, it’s the smaller companies that face existential risks in such an environment. The
small & midcaps indices are up by 118% and 86% in the last one year (vs. Sensex return of 62%) and reflect some sense
of complacency in terms of risks. We would advise investors to exercise caution in this space.

Overall, Indian equities remain an attractive asset class and are expected to do well over the long term. A staggered
investment approach via SIPs remains the simplest way to tide over market cycles. The last 12-14 months have also been
a wake-up call for a balanced asset allocation plan and investors are suggested to ensure they spread their savings
across Equities, Debt and Gold based on their long term goals and risk & return preferences.

Refer page no. 14 for product label of Quantum Long Term Equity Value Fund

 4
QUANTUM’S VIEW FOR
     MAY 2021
                              Bond yields remained in a narrow range throughout the month. The
                              10-year government bond yield hovered around the 6% mark in the
                              month.

                              On month on month basis yield move was not uniform across the
                              maturity curve. The yield curve steepened during the month as the
                              short-term yields came down while the longer end moved up.

                              The 3-year Gsec yield dropped by about 7 basis points in the month
                              to 4.70% while the 30-year bond yield moved up by 17 basis points to
                              close at 6.94%. The 10-year G-sec yield closed flat on a
                              month-on-month basis at 6.02%.

                              The spread of PSU bonds over respective Gsecs narrowed at the front
                              end. The 3 year PSU bond yield fell by about 20 basis points from
                              5.35% to 5.15% during the month. Spreads on the longer end however
                              narrowed only marginally.

                              Money market yields moved up by about 10 basis points across
      D E BT O U T LOO K BY   treasury bills and PSU and private debt securities. At the month-end 3

    Pankaj Pathak
                              months, the Treasury bill was trading at 3.39% vs 3.30% in the previous
                              month.

     Fund Manager,            RBI interventions remain the key driver of the bond market. The RBI
      Fixed Income            conducted bond purchases of Rs. 350 billion under the second tranche
                              of GSAP 1.0. It also conducted a special OMO to purchase long-term
                              bonds while selling short-maturity treasury bills worth Rs. 100 billion.
                              Apart from direct market purchases, it tactically used cancellation debt
                              auctions and devolution on primary dealers to keep yields anchored.

                              In the monetary policy review announced on June 4, 2021, the
                              Monetary Policy Committee (MPC) of the RBI left the policy repo rate
                              unchanged at 4.0% and the reverse repo rate at 3.35%. It also
                              maintained the forward guidance to keep an ‘accommodative stance’
                              as long as necessary to revive and sustain growth on a durable basis,
                              while ensuring that inflation remains within the target going forward.

                              The RBI noted the negative impact of the second wave of covid-19 on
                              the economy and lowered the GDP growth forecast for the fiscal year
                              2021-22 to 9.5% from an earlier projection of 10.5%. The RBI reiterated
                              the need for policy support - “at this juncture, policy support from all
                              sides – fiscal, monetary and sectoral – is required to nurture recovery
                              and expedite return to normalcy”.

                              With regard to inflation, the RBI has adopted a wait and watch
                              approach highlighting risks emanating from rising commodity prices,
                              logistics costs and disrupted supply chains.

                              The RBI made a case for supply-side measures from the Centre and
                              State governments to soften inflationary pressures. The statement said

5
QUANTUM’S VIEW FOR
              MAY 2021
– “Excise duties, cess and taxes imposed by the Centre and States need to be adjusted in a coordinated manner to
contain input cost pressures emanating from petrol and diesel prices. Further supply-side measures are needed to
soften pressures on pulses and edible oil prices.”

The headline CPI inflation forecast is pegged at 5.1% in the fiscal year 2021-22. This implies a negative real rate of 110
basis points based on the policy repo rate of 4.0%. At this juncture, low-interest rates are needed to nurture the
recovery in economic activity. However, persistent low or negative real rates could weaken macroeconomic stability and
make the economy vulnerable to shock.

If growth recovery gets back on track with the lowering of new covid-19 infections, the focus may shift to policy
normalization. Going by the current trend, we expect the RBI to change its posturing towards the end of the year and
start withdrawing excess liquidity. On policy rates, it may start with hiking the reverse repo rate first by early next year
followed by a calibrated increase in repo rate.

From a bond market perspective, the biggest announcement was the extension of the RBI’s bond-buying program with
GSAP 2.0. The RBI raised the size of the GSAP program and committed to conduct secondary market purchases of
government bonds of Rs. 1.2 trillion in Q2 FY22 (July-September 2021).

Another significant move was to include state development loans into the GSAP ambit. It announced to split the
remaining Rs. 400 billion of GSAP 1.0 auction between the centre and state government bonds. The purchase operation
will be conducted on June 17, 2021.

This will help in containing the yield spread of SDLs over respective central government securities from rising sharply.
This will also support the ultra-long (30-40 years maturity) Gsecs which tends to follow SDL yields.

The extension of the GSAP program should bode well for the bond market and keep yields in a narrow range near 6%
in the coming months. However, the expectation of change in the monetary policy direction in the second half could
weigh on the market sentiment. We expect bond yields to move higher gradually over the medium term following
normalisation in liquidity conditions and policy rates.

Given the expectation of rising interest rates, it would be prudent for investors to focus on shorter-maturity funds which
impact less when yields rise. Remember bond prices and debt funds’ NAV fall when market yields move up.

Conservative investors should stick to very short maturity debt categories like the liquid fund. Investors with a longer
holding period and with an appetite to tolerate intermittent volatility could consider dynamic bond funds which can
change the portfolio’s risk profile depending on evolving market situations.

We also suggest investors lower their return expectation from debt funds as the potential for capital gains will be limited
going forward.

Source: RBI, Worldometer.info

Refer page no. 39 & page no. 44 for product labels of Quantum Liquid Fund & Quantum Dynamic Bond Fund

 6
QUANTUM’S VIEW FOR
          MAY 2021
                                                                In May, gold prices rose above the key psychological level of
                                                                $1,900 per ounce, ending the month roughly 8% higher and
                                                                turning positive for the year to date.
                                                                Much of May’s action in gold was a result of evidence
                                                                showing a rise in prices in the United States and the
                                                                weakening of its key rivals - the 10-year Treasury yield, the
                                                                Dollar Index and Bitcoin.

                                                                Higher inflation coupled with Fed’s dovish stance helped
                                                                gold regain its footing.

                                                                With trillions of dollars of stimulus trickling down to the real
                                                                economy, accelerating vaccination rollouts and unfixed
                                                                supply chains, higher inflation has become the central
                                                                market-moving theme so far in 2021.

                                                                In the U.S., Personal Consumption Expenditure — which is the
                                                                Federal Reserve’s preferred gauge for inflation, jumped 3.6%
                                                                in the year to April. The Consumer Price Index registered a
                                                                4.2% growth in April - its largest increase in almost 13 years.

                                                                With discussions to increase the minimum wage to $15 from
              G o l d O u t l oo k by                           the existing $7.5 underway in the US, we might see wage

      Chirag Mehta                                              inflation add to the already spiraling commodity price
                                                                inflation. This and President Biden seeking to run $1.3 trillion
                                                                deficits every year throughout the next decade will make
 Senior Fund Manager,                                           inflation more structural and sticky.
 Alternative Investment
                                                                A higher inflationary environment is good for gold, which is
                                                                seen as a reliable store of value especially when rates are
anchored at zero levels in much of the developed world.

Earlier this year, the dollar and U.S. bond yields rallied on signs of a swift turnaround of the U.S. economy, as investors
speculated the Fed will hike rates faster than anticipated. This triggered selling in gold as a strengthening dollar tends to
make gold more expensive to foreign buyers while rising bond yields reduce its attractiveness as it offers no yield. But
starting April, inflation expectations and related concerns over the purchasing power of the dollar instigated a retreat in
real yields and the dollar and helped the yellow metal claw its way back up.

The Federal Reserve has downplayed the impact of rising inflation terming it as “transitory” and pledged to keep a dovish
monetary policy for the foreseeable future. The U.S. central bank has the tricky job of curbing any possible outbreak of
inflation without throwing economic recovery off track. With the Fed stretching its inflation tolerance through its Flexible
Average Inflation Targeting framework and committing to keep rates low till 2023, it's likely that real rates will be on the
decline as inflation picks up, benefitting gold.

The economic bounce from stimulus earlier in the year begins to fade
Even as U.S. GDP growth for the first quarter of 2021 came in at an annual rate of 6.40%, other economic indicators are
slowing, a sign that the country’s recovery from the pandemic still faces challenges. U.S. non-farm payrolls increased by a
modest 266,000 jobs in April, far short of the one million that economists had forecast and left total employment down by
8.2 million from its pre-pandemic level. Similarly, retail sales in the U.S. did not grow month-on-month in April as the effect
of stimulus checks distributed earlier in the year faded. The housing market too is showing signs of fatigue, with new home
sales dropping in April by 5.9%. Consumer confidence also slipped to a reading of 117.2 vs a market expectation of 119.2
and durable goods sales were down 1.3%.

Confidence about the economic outlook thus seems to be fading now nudging investors to increase their allocation to
gold. Risk assets riding on easy money, however, continue to do well, raising concerns of frothiness and limiting a rally in
gold prices for now. But going forward, markets might get a reality check as the timing of recovery gets pushed further

 7
QUANTUM’S VIEW FOR
           MAY 2021
down the road and the disconnect between the economy and financial markets become evident. Gold will then yet again
prove to be a relevant portfolio asset.

Volatility in crypto sends investors fleeing to gold
The sheer price performance of cryptocurrencies or the fear of missing out lured many investors to chase this
well-marketed promise of an alternative form of digital currency and helped push Bitcoin to a record near $65,000. But this
journey upward has been one of extreme volatility given that it is a relatively new asset class with fewer participants and a
debatable intrinsic value, which makes it susceptible to large price fluctuations and speculation. Most recently, the
cryptocurrency saw a massive 37% correction in May. Maybe that's why, after chasing higher returns and enduring big
swings over the last few months, funds seem to be now reversing from cryptocurrencies like Bitcoin to gold as investors
appreciate the reliability and stability of the precious metal.

Inflation concerns keep stocks in check
Global equities markets have been supported by a coordinated effort from major central banks, which have pumped
trillions of dollars into financial markets since last year while committing to lower-for-longer interest rates. But higher
inflation could mean a scaling back of central banks' easy money policy. This prospect has led to global markets losing
growth momentum as investors see central banks slowly but surely moving towards a tightening policy.

Higher interest rates increase the cost of capital, hurting corporate profitability. Higher commodity prices too will lead to
higher input costs, impacting margins. This can spook markets and trigger volatility.

Gold's negative correlation to equities can increase its attractiveness for investors in these times of jittery equity markets.

Appreciating rupee hurts INR gold returns
Despite the second wave of Covid-19 and resulting restrictions raising concerns on the growth outlook, the Indian rupee
strengthened in May on account of foreign inflows and the weakening of the U.S. dollar. Higher prices and local lockdowns
adversely impacted local gold demand. Gold prices thus ended the month only 5% higher in INR terms.

What lies ahead
After a healthy correction due to rising confidence about the economic outlook, gold’s return to $1,900 levels seems
logical and overdue as prices were stretched to the downside given the fundamentals.

Just how much gold prices will rise and how strong its move will depend on how sustainable the economic recovery is, and
the resulting policy action which can either be status quo or tightening. Also, at any first signs of dwindling economic
momentum, central banks and governments can be expected to intervene with their usual prescription which entails higher
deficit spending. On the other hand, it will also depend on whether or not this higher inflation is transitory and in reaction,
whether or not the U.S. dollar and real yields trend down further.

Gold is also expected to reflect investor concerns over record debt and deficit levels, frothy financial markets and the
emergence of inflation, thus strengthening going forward.

Source: Bloomberg, World Gold Council

 8
Scheme Features

                                                 Fund Manager
    QUANTUM                                      Mr. Sorbh Gupta
                                                 Work experience: 15.9 years. He has been managing the

    LONG TERM                                    fund since December 1, 2020.
                                                 Mr. Nilesh Shetty

    EQUITY
                                                 Work experience: 17.5 years. He has been managing the
                                                 fund since March 28, 2011.

    VALUE FUND                                   Category of Scheme
    An Open Ended Equity Scheme                  Value Fund
    following a Value Investment Strategy

                                                 Inception Date       (Date of Allotment)

                                                 March 13, 2006

         Investment Objective                    Declaration of Net Asset Value (NAV)
To achieve long-term capital appreciation by     Every Business Day
investing primarily in shares of companies
that will typically be included in the S&P BSE
                                                 Entry / Sales Load
200 Index and are in a position to benefit
from the anticipated growth and development      Not Applicable
of the Indian economy and its markets.

                                                 Total Expense Ratio        (As on month end)

                                                 TER specified are the actual expenses charged
                                                 (i.e. effective rate) as at the end of the month

                                                 Direct Plan - Total TER = 1.29%
                                                 {Base TER 1.13% (Inclusive of 0.87% Management Fees &
                                                 0.26% Other Expanses) + 0.16% GST (18% GST on 0.87%
                                                 Management Fees)}

                                                 Regular Plan – Total TER = 1.79%
                                                 {Base TER 1.63% (Inclusive of 0.87% Management Fees &
                                                 0.26% Other Expanses & 0.50% Distributor Commission)
                                                 + 0.16% GST (18% GST on 0.87% Management Fees)}

                                                 Benchmark Index
                                                 S&P BSE 200 - Total Return Index

                                                 Minimum Application Amount
                                                 (Under each Option)
                                                 Purchase: `500/- and in multiples of `1/-
                                                 thereafter. Additional Purchase: `500/- and
                                                 in multiples of `1/- thereafter/ 50 units

9
Scheme Features

                                              Investment Options
 QUANTUM                                      Growth & Income Distribution cum Capital Withdrawal (IDCW)

 LONG TERM
                                              (Income Distribution cum Capital Withdrawal (IDCW) Option
                                              will in turn have two Facilities, Payout of Income Distribution

 EQUITY
                                              cum Capital Withdrawal (IDCW) Facility and Reinvestment of
                                              Income Distribution cum Capital Withdrawal (IDCW) Facility)

 VALUE FUND                                   Redemption Proceeds
 An Open Ended Equity Scheme                  Processed through RTGS/NEFT mode on T+3 basis from
 following a Value Investment Strategy        the date of transaction where the investor’s Bank
                                              details are available. Processed through cheque on T+3
                                              basis from the date of transaction where the required
                                              Bank details of investor are not available.

                                              Exit Load
                                              For complete details on Exit Load please refer page no. 12

                                              Taxation#
                                              The amount of Long Term Capital Gain in excess of
                                              Rs 1,00,000/- in a year will be taxable @ 10%.
                                              Tax on Short Term Capital Gains - 15%.

                                                NAV                                     Direct Plan                Regular Plan
                                                (as on May 31, 2021)                    (`/Unit)                   (`/Unit)
      Key Statistics
                                                IDCW Option                             72.42                      71.18
^^Standard Deviation               21.84%       Growth Option                           71.80                      70.77

^^Beta                                0.94
                                                                         AUM `(In Crores)
                                                                               (as on May 31, 2021)

^^Sharpe Ratio                        0.44                Average AUM*                                Absolute AUM
                                                               860.07                                      887.27

                                              *Cumulative Daily AUM / No of days in the month

      Brokerages &
      Commissions Details                       #
                                                  The mentioned Tax Rates shall be increased by applicable surcharge, If any, Health
                                                and Education Cess @ 4% where ever as applicable. Equity oriented schemes will
                                                also attract Securities Transaction Tax (STT) @ 0.001% at the time of redemption
Brokerages on Investments     ₹2,94,673.61      and switch to other schemes.
for May 2021
                                                Stamp Duty applicable on Investors subscription unit transactions including Switch
                                                in as per the rate mentioned in the Amendments to Indian Stamp Act,1899
Distributor commissions        ₹1,14,722.07
for May 2021                                    TRANSACTION CHARGES: No Transaction Charges shall be deducted from the
                                                investment amount for applications received in the Regular Plan.
Portfolio Turnover Ratio            3.38%
(Last one year)

10
Quantum Long Term Equity Value Fund Performance as on May 31, 2021
The Scheme is Mr. Nilesh Shetty is the Fund Manager managing the scheme since
co-managed by March 28, 2011.
Mr. Sorbh Gupta & Mr. Sorbh Gupta is the Fund Manager managing the scheme since
Mr. Nilesh Shetty. December 1, 2020.
For other Schemes Managed by Mr. Nilesh Shetty & Mr. Sorbh Gupta please see page no. 14
Performance of the Scheme Direct Plan
Quantum Long Term Equity Value Fund - Direct Plan - Growth Option
Current Value `10,000 Invested at
the beginning of a given period
Benchmark Additional Benchmark Additional
Benchmark Benchmark
Scheme S&P BSE S&P BSE Scheme S&P BSE S&P BSE
Period Returns 200 TRI* Sensex TRI (`) 200 TRI* Sensex TRI
(%) Returns (%) Returns (%) (`) (`)
Since Inception (13th Mar 2006) 13.82% 12.54% 12.39% 71,800 60,491 59,256
May 31, 2011 to May 31, 2021 (10 years) 12.59% 12.88% 12.42% 32,770 33,620 32,284
May 30, 2014 to May 31, 2021 (7 years) 11.89% 13.97% 12.99% 21,977 25,005 23,528
May 31, 2016 to May 31, 2021 (5 years) 11.75% 15.80% 15.68% 17,436 20,828 20,721
May 31, 2018 to May 31, 2021 (3 years) 11.10% 14.48% 15.04% 13,718 15,007 15,230
May 29, 2020 to May 31, 2021 (1 year) 70.98% 68.04% 61.66% 17,148 16,852 16,209
Past performance may or may not be sustained in the future. Load is not taken into consideration in scheme returns calculation.
Different Plans shall have a different expense structure.
Refer to the section “GIPS Compliance” on page no. 13 for GIPS related disclosure.
Returns are net of total expenses and are calculated on the basis of Compounded Annualized Growth Rate (CAGR).
*with effect from February 01, 2020 benchmark has been changed from S&P Sensex TRI to S&P BSE 200 TRI. As TRI data is not available since inception
of the scheme, benchmark performance is calculated using composite CAGR S&P BSE 200 index PRI Value from March 13, 2006 to July 31, 2006 and
TRI Value since August 1, 2006.
Performance of the Scheme Regular Plan
Quantum Long Term Equity Value Fund - Regular Plan - Growth Option
Current Value `10,000 Invested at
the beginning of a given period
Benchmark Additional Benchmark Additional
Benchmark Benchmark
Scheme S&P BSE S&P BSE S&P BSE S&P BSE
Returns 200 TRI* Sensex TRI Scheme 200 TRI* Sensex TRI
Period (`)
(%) Returns (%) Returns (%) (`) (`)
Since Inception (01st Apr 2017) 9.50% 14.76% 15.80% 14,601 17,758 18,435
May 31, 2018 to May 31, 2021 (3 years) 10.64% 14.48% 15.04% 13,547 15,007 15,230
May 29, 2020 to May 31, 2021 (1 year) 70.16% 68.04% 61.66% 17,065 16,852 16,209
Past performance may or may not be sustained in the future. Load is not taken into consideration in scheme returns calculation.
Different Plans shall have a different expense structure.
Refer to the section “GIPS Compliance” on page no. 13 for GIPS related disclosure.
Returns are net of total expenses and are calculated on the basis of Compounded Annualized Growth Rate (CAGR).
*with effect from February 01, 2020 benchmark has been changed from S&P Sensex TRI to S&P BSE 200 TRI. As TRI data is not available since inception
of the scheme, benchmark performance is calculated using composite CAGR S&P BSE 200 index PRI Value from March 13, 2006 to July 31, 2006 and
TRI Value since August 1, 2006.
11SIP Performance as on May 31, 2021
Total Amount Mkt Value as S&P BSE S&P BSE Scheme S&P BSE S&P BSE Sensex
Invested on May 31, 21 200 TRI Sensex Returns 200 TRI Returns TRI Returns
(`‘000) (`‘000) (`‘000) TRI (`‘000) (XIRR*) (%) (XIRR*)# (%) (XIRR*)@ (%)
SIP Since Inception 1,820.00 5,640.29 5,453.25 5,213.40 13.70% 13.31% 12.80%
10 Years SIP 1,200.00 2,402.78 2,646.64 2,558.33 13.34% 15.15% 14.51%
7 Years SIP 840.00 1,304.66 1,445.92 1,429.13 12.40% 15.29% 14.96%
5 Years SIP 600.00 845.26 926.25 924.25 13.74% 17.48% 17.39%
3 Years SIP 360.00 490.38 508.53 492.86 21.31% 23.96% 21.68%
1 Year SIP 120.00 156.03 152.43 147.26 61.78% 55.21% 45.94%
Past performance may or may not be sustained in the future. The above SIP performance is for Quantum Long Term Equity Value Fund - Direct plan - Growth option. Load is not
taken into consideration using applicable NAV on the SIP day (5th of every month). Return on SIP and Benchmark are annualized and compounded investment return for cash
flows resulting out of uniform and regular monthly subscriptions as on 5th day of every month (in case 5th is a non-Business Day, then the next Business Day) and have been
worked out using the Excel spreadsheet function known as XIRR. XIRR calculates the internal rate of return for series of cash flow. Assuming `10,000 invested every month on
5th day of every month (in case 5th is a non-Business Day, then the next Business Day), the 1 year, 3 years, 5 years, 7 years, 10 years and since inception returns from SIP are
annualized and compounded investment return computed on the assumption that SIP installments were received across the time periods from the start date of SIP from the end
of the relevant period viz. 1 year, 3 years, 5 years, 7 years, 10 years and since Inception. *XIRR - XIRR calculates the internal rate of return to measure and compare the
profitability of series of investments. With effect from February 01, 2020 benchmark has been changed from S&P Sensex TRI to S&P BSE 200 TRI. As TRI data is not available
since inception of the scheme, benchmark performance is calculated using composite CAGR S&P BSE 200 index PRI Value from March 13, 2006 to July 31, 2006 and TRI Value
since August 1, 2006. Refer to the section “GIPS Compliance” on Page no. 13 for GIPS related disclosure.
Returns are net of total expenses
#
Benchmark Returns.
@
Additional Benchmark Returns.
Exit Load:
Provisions % of Exit Load
10% of units if redeemed or switched out during exit load period i.e. 730 days from the allotment
NIL
Exit Load Period : 730 days from the date of allotment
Remaining 90% of units in parts or full :
(i) if redeemed or switched out on or before 365 days from the date of allotment 2%
(ii) if redeemed or switched out on or after 365 days but before 730 days from
1%
the date of allotment
If units redeemed or switched out after 730 days from the date of allotment NIL
Note: Redemptions / Switch outs of units will be done on First In First Out (FIFO) basis. The above mentioned Exit Load shall be
equally applicable to the special products such as Systematic Withdrawal Plan (SWP)/Systematic Transfer Plan (STP) and Switches
etc. However, no load shall be charged for switching in between option / plan within the scheme.
Industry Allocation (% of Net Assets) as on May 31, 2021
Finance 15.73%
So�ware 15.19%
Banks 14.62%
Auto 12.17%
Cement & Cement Products 6.56%
Pharmaceu�cals 6.20%
Power 5.25%
Ferrous Metals 4.46%
Gas 4.40%
Industrial Products 2.28%
Leisure Services 1.89%
Auto Ancillaries 1.81%
Oil 1.76%
0% 2% 4% 6% 8% 10% 12% 14% 16% 18%
12Portfolio as on May 31, 2021
QUANTUM LONG TERM EQUITY VALUE FUND
Market /
% to Yield to
Name of Instrument Industry +/ Rating Quantity Fair Value
NAV Maturity
(₹ in Lakhs)
EQUITY & EQUITY RELATED
A) Listed /Awaiting listing on Stock Exchanges
1. Housing Development Finance Corporation Limited Finance 2,95,173 7,535.32 8.49%
2. Infosys Limited Software 4,60,113 6,412.82 7.23%
3. HDFC Bank Limited Banks 3,58,422 5,433.14 6.12%
4. Tata Steel Limited Ferrous Metals 3,51,582 3,957.58 4.46%
5. Shriram Transport Finance Company Limited Finance 2,55,264 3,649.76 4.11%
6. Wipro Limited Software 6,63,748 3,577.93 4.03%
7. Mahindra & Mahindra Limited Auto 4,05,091 3,272.93 3.69%
8. ICICI Bank Limited Banks 4,82,440 3,197.37 3.60%
9. Hero MotoCorp Limited Auto 1,02,505 3,082.84 3.47%
10. State Bank of India Banks 7,22,931 3,067.76 3.46%
11. Lupin Limited Pharmaceuticals 2,49,872 3,047.19 3.43%
12. ACC Limited Cement & Cement Products 1,53,174 3,042.11 3.43%
13. Ambuja Cements Limited Cement & Cement Products 8,51,126 2,781.48 3.13%
14. LIC Housing Finance Limited Finance 5,95,442 2,776.25 3.13%
15. Bajaj Auto Limited Auto 60,089 2,519.41 2.84%
16. Cipla Limited Pharmaceuticals 2,58,452 2,453.61 2.77%
17. Power Grid Corporation of India Limited Power 10,49,463 2,368.11 2.67%
18. NTPC Limited Power 20,69,390 2,286.68 2.58%
19. Tech Mahindra Limited Software 2,07,036 2,115.18 2.38%
20. Cummins India Limited Industrial Products 2,57,151 2,023.52 2.28%
21. GAIL (India) Limited Gas 12,62,947 2,020.08 2.28%
22. Eicher Motors Limited Auto 71,904 1,924.26 2.17%
23. Gujarat State Petronet Limited Gas 6,94,031 1,881.17 2.12%
24. The Indian Hotels Company Limited Leisure Services 12,04,489 1,677.85 1.89%
25. Exide Industries Limited Auto Ancillaries 8,41,527 1,609.84 1.81%
26. Oil & Natural Gas Corporation Limited Oil 13,73,899 1,561.44 1.76%
27. Tata Consultancy Services Limited Software 43,526 1,375.05 1.55%
28. IndusInd Bank Limited Banks 1,25,832 1,274.68 1.44%
B) Unlisted NIL NIL
Total of all Equity 81,925.36 92.32%
MONEY MARKET INSTRUMENTS
A) Treasury Bills (T-Bill)
364 Days Tbill (MD 16/12/2021) Sovereign 50,000 49.04 0.06% 3.61%
Total of T-Bill 49.04 0.06%
B) TREPS* 6,830.36 7.70% 3.23%
Total of Money Market Instruments 6,879.40 7.76%
Net Receivable/(payable) -78.05 -0.08%
Grand Total 88,726.71 100.00%
* Cash & Cash Equivalents
GIPS Compliance
A) Quantum Asset Management Company Pvt. Ltd. claims compliance with the Global Investment Performance Standards (GIPS®).
GIPS® is a registered trademark of CFA Institute. CFA Institute does not endorse or promote this organization, nor does it warrant
the accuracy or quality of the content contained herein.
B) Indian Rupee (INR) is the currency used to express performance and other statistics.
C) Using Price Return for a benchmark is allowed by SEBI where the Total Return index values are not available. This requirement is
different from GIPS Standards wherein the GIPS compliant firms are required to provide benchmark returns in based on Total
Return Index value only
13PERFORMANCE OF THE FUNDS MANAGED BY SORBH GUPTA
QUANTUM TAX SAVING FUND
Mr. Sorbh Gupta is the Fund Manager managing the scheme since October 1, 2016.
May 29, 2020 to May 31, 2018 to May 31, 2016 to
Period May 31, 2021 (1 year) May 31, 2021 (3 years) May 31, 2021 (5 years)
Scheme S&P BSE Scheme S&P BSE Scheme S&P BSE
Return (%) 200 TRI Return (%) 200 TRI Return (%) 200 TRI
Returns# (%) Returns# (%) Returns# (%)
Quantum Tax Saving Fund -
Direct Plan - Growth Option 69.79% 68.04% 11.12% 14.48% 11.88% 15.80%
Quantum Tax Saving Fund -
Regular Plan - Growth Option 68.97% 68.04% 10.66% 14.48% NA NA
Past performance may or may not be sustained in the future.
#
Benchmark returns.
Returns are net of total expenses and are calculated on the basis of Compounded Annualized Growth Rate (CAGR).
Different Plans shall have different expense structure.
Mr. Sorbh Gupta manages 2 scheme of the Quantum Mutual Fund.
PERFORMANCE OF THE FUNDS MANAGED BY NILESH SHETTY
QUANTUM MULTI ASSET FUND OF FUNDS
Mr. Chirag Mehta Co-managing along with Mr. Nilesh Shetty since July 11, 2012.
May 29, 2020 to May 31, 2018 to May 31, 2016 to
Period May 31, 2021 (1 year) May 31, 2021 (3 years) May 31, 2021 (5 years)
Scheme Benchmark Scheme Benchmark Scheme Benchmark
Return (%) Return# (%) Return (%) Return# (%) Return (%) Return# (%)
Quantum Multi Asset Fund of Funds -
Direct Plan 20.48% 25.09% 9.59% 12.64% 9.41% 11.70%
Quantum Multi Asset Fund of Funds -
Regular Plan 20.08% 25.09% 9.33% 12.64% NA NA
Past performance may or may not be sustained in the future. Load is not taken into consideration in Scheme Return Calculation.
#
Benchmark has been changed from Crisil Composite Bond Fund Index (40%) + S&P BSE SENSEX Total Return Index (40%) + Domestic price of gold (20%) to CRISIL Composite
Bond Fund Index (20%) + S&P BSE Total Return Index (40%) + CRISIL Liquid Index (25%) + Domestic Price of Gold (15%) with effective from April 01, 2021.
It is a customized index and it is rebalanced daily.
Returns are net of total expenses and are calculated on the basis of Compounded Annualized Growth Rate (CAGR).
Different Plans shall have different expense structure.
Mr. Chirag Mehta manages 5 schemes of the Quantum Mutual Fund. Mr. Nilesh Shetty manages 2 schemes of the Quantum Mutual Fund.
Product Labeling
Name of the Scheme This product is suitable for investors who are seeking* Riskometer
Quantum Long Term • Long term capital appreciation Mod
erate
Moder
Highately
Equity Value Fund • Invests primarily in equity and equity related securities of to ate
er
Hi
od w
M Lo
gh
(An Open Ended Equity companies in S&P BSE 200 index.
Ver
Scheme following a
Low
y Hig
h
Value Investment
Investors understand that their principal will be
Strategy) at Very High Risk
*Investors should consult their financial advisers if in doubt about whether the product is suitable for them.
The Risk Level of the Scheme in the Riskometer is based on the portfolio of the scheme as on May 31, 2021.
^^ Note:
Risk Free Rate assumed to be 3.39% (FBIL Overnight MIBOR for 31st May 2021) for calculating Sharpe Ratio.
Standard Deviation, Sharpe Ratio & Beta are calculated on Annualised basis using 3 years history of monthly returns.
Definitions
Standard deviation measures historical volatility. A high standard deviation suggests high volatility, while lower standard deviation would refer to more stability.
Beta is the tendency of a fund's returns to respond to market swings. A beta of 1 indicates that the fund price will move with the market. A beta of less than 1 means
that the security will be less volatile than the market. A beta of greater than 1 indicates that the security's price will be more volatile than the market.
Sharpe Ratio is used to characterise how well the return of an asset compensates the investor for the risk taken. The greater a portfolio's Sharpe ratio, the better its
risk-adjusted performance has been.
Portfolio Turnover Ratio is the percentage of a funds assets that have changed over the course of a year.
14Scheme Features
Fund Manager
QUANTUM Mr. Sorbh Gupta
Work experience: 15.9 years. He has been managing this
TAX SAVING fund since October 1, 2016
FUND Category of Scheme
Equity Linked Saving Scheme (ELSS)
An Open Ended Equity Linked Saving
Scheme with a Statutory Lock in of
3 years and Tax Benefit Inception Date (Date of Allotment)
December 23, 2008
Declaration of Net Asset Value (NAV)
Every Business Day
Investment Objective
Entry / Sales Load
To achieve long-term capital appreciation by
investing primarily in shares of companies Not Applicable
that will typically be included in the S&P BSE
200 Index and are in a position to benefit
Total Expense Ratio (As on month end)
from the anticipated growth and development
of the Indian economy and its markets. TER specified are the actual expenses charged
(i.e. effective rate) as at the end of the month.
Direct Plan - Total TER = 1.29%
{Base TER 1.13% (Inclusive of 0.87% Management Fees
& 0.26% Other Expanses) + 0.16% GST (18% GST on 0.87%
Management Fees)}
Regular Plan – Total TER = 1.79%
{Base TER 1.63% (Inclusive of 0.87% Management Fees &
0.26% Other Expanses & 0.50% Distributor Commission)
+ 0.16% GST (18% GST on 0.87% Management Fees)}
Benchmark Index
S&P BSE 200 - Total Return Index
Minimum Application Amount
(Under each Option)
Purchase: `500/- and in multiples of `500/-
thereafter. Additional Purchase: `500/- and in
multiples of `500/- thereafter
Investment Options
Growth & Income Distribution cum Capital Withdrawal (IDCW)
15Scheme Features
Redemption Proceeds
QUANTUM Processed through RTGS/NEFT mode on T+3 basis from the
date of transaction where the investor’s Bank details are
TAX SAVING available. Processed through cheque on T+3 basis from the
date of transaction where the required Bank details of
FUND investor are not available.
An Open Ended Equity Linked Saving
Scheme with a Statutory Lock in of
Exit Load
3 years and Tax Benefit Nil
Taxation#
The amount of Long Term Capital Gain in excess of
`1,00,000/- in a year will be taxable @ 10%. Tax on
Short Term Capital Gains - 15%.
Lock-in Period
3 years from the date of allotment of the respective Units.
NAV Direct Plan Regular Plan
(as on May 31, 2021) (`/Unit) (`/Unit)
IDCW Option 71.28 70.24
Growth Option 71.28 70.24
Key Statistics
AUM `(In Crores)
(as on May 31, 2021)
^^Standard Deviation 21.53%
Average AUM* Absolute AUM
93.07 96.32
^^Beta 0.93
*Cumulative Daily AuM / No of days in the month
^^Sharpe Ratio 0.45
Brokerages &
Commissions Details #
The mentioned Tax Rates shall be increased by applicable surcharge, If any, Health
and Education Cess @ 4% where ever as applicable. Equity oriented schemes will
also attract Securities Transaction Tax (STT) @ 0.001% at the time of redemption
Brokerages on Investments ₹15,229.43 and switch to other schemes.
for May 2021
Stamp Duty applicable on Investors subscription unit transactions including Switch
in as per the rate mentioned in the Amendments to Indian Stamp Act,1899
Distributor commissions ₹22,806.19
for May 2021
TRANSACTION CHARGES: No Transaction Charges shall be deducted from the
investment amount for applications received in the Regular Plan.
Portfolio Turnover Ratio 5.76%
(Last one year)
16Quantum Tax Saving Fund Performance as on May 31, 2021
The Scheme is
Mr. Sorbh Gupta is the Fund Manager managing the scheme since
managed by October 1, 2016.
Mr. Sorbh Gupta.
For other Schemes Managed by Mr. Sorbh Gupta please see page no. 20
Performance of the Scheme Direct Plan
Quantum Tax Saving Fund - Direct Plan - Growth Option
Current Value `10,000 Invested at
the beginning of a given period
Benchmark Additional Benchmark Additional
Benchmark Benchmark
Scheme S&P BSE S&P BSE S&P BSE S&P BSE
Returns 200 TRI* Sensex TRI Scheme 200 TRI* Sensex TRI
Period (`)
(%) Returns (%) Returns (%) (`) (`)
Since Inception (23rd Dec 2008) 17.09% 16.81% 16.02% 71,280 69,170 63,567
May 31, 2011 to May 31, 2021 (10 years) 12.63% 12.88% 12.42% 32,875 33,620 32,284
May 30, 2014 to May 31, 2021 (7 years) 12.19% 13.97% 12.99% 22,394 25,005 23,528
May 31, 2016 to May 31, 2021 (5 years) 11.88% 15.80% 15.68% 17,531 20,828 20,721
May 31, 2018 to May 31, 2021 (3 years) 11.12% 14.48% 15.04% 13,726 15,007 15,230
May 29, 2020 to May 31, 2021 (1 year) 69.79% 68.04% 61.66% 17,028 16,852 16,209
Past performance may or may not be sustained in the future.
Different Plans shall have a different expense structure.
Refer to the section “GIPS Compliance” on Page no. 19 for GIPS related disclosure.
Returns are net of total expenses and are calculated on the basis of Compounded Annualized Growth Rate (CAGR).
*with effect from February 01, 2020 benchmark has been changed from S&P Sensex TRI to S&P BSE 200 TRI.
Performance of the Scheme Regular Plan
Quantum Tax Saving Fund - Regular Plan - Growth Option
Current Value `10,000 Invested at
the beginning of a given period
Benchmark Additional Benchmark Additional
Benchmark Benchmark
Scheme S&P BSE S&P BSE S&P BSE S&P BSE
Returns 200 TRI* Sensex TRI Scheme 200 TRI* Sensex TRI
Period (`)
(%) Returns (%) Returns (%) (`) (`)
Since Inception (01st Apr 2017) 9.56% 14.76% 15.80% 14,633 17,758 18,435
May 31, 2018 to May 31, 2021 (3 years) 10.66% 14.48% 15.04% 13,555 15,007 15,230
May 29, 2020 to May 31, 2021 (1 year) 68.97% 68.04% 61.66% 16,946 16,852 16,209
Past performance may or may not be sustained in the future.
Different Plans shall have a different expense structure.
Refer to the section “GIPS Compliance” on Page no. 19 for GIPS related disclosure.
Returns are net of total expenses and are calculated on the basis of Compounded Annualized Growth Rate (CAGR).
*with effect from February 01, 2020 benchmark has been changed from S&P Sensex TRI to S&P BSE 200 TRI.
17SIP Performance as on May 31, 2021
Total Amount Mkt Value as S&P BSE S&P BSE Scheme S&P BSE S&P BSE Sensex
Invested on May 31, 21 200 TRI Sensex Returns 200 TRI Returns TRI Returns
(`‘000) (`‘000) (`‘000) TRI (`‘000) (XIRR*) (%) (XIRR*)# (%) (XIRR*)@ (%)
SIP Since Inception 1,490.00 3,657.08 3,849.99 3,701.86 13.60% 14.34% 13.78%
10 Years SIP 1,200.00 2,408.64 2,646.64 2,558.33 13.38% 15.15% 14.51%
7 Years SIP 840.00 1,306.78 1,445.92 1,429.13 12.45% 15.29% 14.96%
5 Years SIP 600.00 845.95 926.25 924.25 13.77% 17.48% 17.39%
3 Years SIP 360.00 490.14 508.53 492.86 21.27% 23.96% 21.68%
1 Year SIP 120.00 155.58 152.43 147.26 60.95% 55.21% 45.94%
Past performance may or may not be sustained in the future. The above SIP performance is for Quantum Tax Saving Fund - Direct plan - Growth option. Scheme performance
has been calculated using applicable NAV on the SIP day (5th of every month). Return on SIP and Benchmark are annualized and compounded investment return for cash flows
resulting out of uniform and regular monthly subscriptions as on 5th day of every month (in case 5th is a non-Business Day, then the next Business Day) and have been worked
out using the Excel spreadsheet function known as XIRR. XIRR calculates the internal rate of return for series of cash flow. Assuming `10,000 invested every month on 5th day
of every month (in case 5th is a non-Business Day, then the next Business Day), the 1 year, 3 years, 5 years, 7 years, 10 years, and since inception returns from SIP are
annualized and compounded investment return computed on the assumption that SIP installments were received across the time periods from the start date of SIP from the end
of the relevant period viz. 1 year, 3 years, 5 years, 7 years, 10 years and since Inception. *XIRR - XIRR calculates the internal rate of return to measure and compare the
profitability of series of investments.
Returns are net of total expenses
#
Benchmark Returns.
@
Additional Benchmark Returns.
Industry Allocation (% of Net Assets) as on May 31, 2021
Finance 14.83%
So�ware 14.78%
Banks 14.05%
Auto 11.95%
Cement & Cement Products 6.82%
Pharmaceu�cals 5.88%
Power 5.10%
Ferrous Metals 4.75%
Gas 4.67%
Industrial Products 2.50%
Oil 1.82%
Leisure Services 1.70%
Auto Ancillaries 1.70%
0% 2% 4% 6% 8% 10% 12% 14% 16%
18Portfolio as on May 31, 2021
Quantum Tax Saving Fund
Market /
% to
Name of Instrument Industry Quantity Fair Value
NAV
(₹ in Lakhs)
EQUITY & EQUITY RELATED
A) Listed /Awaiting listing on Stock Exchanges
1. Housing Development Finance Corporation Limited Finance 31,145 795.09 8.25%
2. Infosys Limited Software 48,941 682.12 7.08%
3. HDFC Bank Limited Banks 36,012 545.89 5.67%
4. Tata Steel Limited Ferrous Metals 40,633 457.39 4.75%
5. Wipro Limited Software 72,341 389.95 4.05%
6. Shriram Transport Finance Company Limited Finance 25,076 358.54 3.72%
7. Mahindra & Mahindra Limited Auto 43,599 352.26 3.66%
8. ICICI Bank Limited Banks 53,144 352.21 3.66%
9. ACC Limited Cement & Cement Products 17,367 344.92 3.58%
10. Ambuja Cements Limited Cement & Cement Products 95,497 312.08 3.24%
11. State Bank of India Banks 73,399 311.47 3.23%
12. Hero MotoCorp Limited Auto 10,106 303.94 3.16%
13. Lupin Limited Pharmaceuticals 24,384 297.36 3.09%
14. Bajaj Auto Limited Auto 6,594 276.47 2.87%
15. LIC Housing Finance Limited Finance 58,990 275.04 2.86%
16. Cipla Limited Pharmaceuticals 28,284 268.51 2.79%
17. Power Grid Corporation of India Limited Power 1,11,665 251.97 2.62%
18. Cummins India Limited Industrial Products 30,636 241.07 2.50%
19. NTPC Limited Power 2,16,455 239.18 2.48%
20. GAIL (India) Limited Gas 1,46,497 234.32 2.43%
21. Eicher Motors Limited Auto 8,140 217.84 2.26%
22. Gujarat State Petronet Limited Gas 79,548 215.61 2.24%
23. Tech Mahindra Limited Software 21,052 215.08 2.23%
24. Oil & Natural Gas Corporation Limited Oil 1,53,943 174.96 1.82%
25. Exide Industries Limited Auto Ancillaries 85,824 164.18 1.70%
26. The Indian Hotels Company Limited Leisure Services 1,17,668 163.91 1.70%
27. IndusInd Bank Limited Banks 14,121 143.05 1.49%
28. Tata Consultancy Services Limited Software 4,316 136.35 1.42%
B) Unlisted NIL NIL
Total of all Equity 8,720.76 90.55%
MONEY MARKET INSTRUMENTS
a) TREPS* 907.71 9.42%
Net Receivable/(payable) 3.25 0.03%
Grand Total 9,631.72 100.00%
* Cash & Cash Equivalents
GIPS Compliance
A) Quantum Asset Management Company Pvt. Ltd. claims compliance with the Global Investment Performance Standards
(GIPS®). GIPS® is a registered trademark of CFA Institute. CFA Institute does not endorse or promote this organization,
nor does it warrant the accuracy or quality of the content contained herein.
B) Indian Rupee (INR) is the currency used to express performance and other statistics.
19PERFORMANCE OF THE FUNDS MANAGED BY SORBH GUPTA
QUANTUM LONG TERM EQUITY VALUE FUND
Mr. Nilesh Shetty managing the scheme since March 28, 2011 and
Mr. Sorbh Gupta managing the scheme since December 1, 2020.
May 29, 2020 to May 31, 2018 to May 31, 2016 to
Period May 31, 2021 (1 year) May 31, 2021 (3 years) May 31, 2021 (5 years)
Scheme S&P BSE Scheme S&P BSE Scheme S&P BSE
Return (%) 200 TRI Return (%) 200 TRI Return (%) 200 TRI
Returns# (%) Returns# (%) Returns# (%)
Quantum Long Term Equity Value Fund -
Direct Plan - Growth Option 70.98% 68.04% 11.10% 14.48% 11.75% 15.80%
Quantum Long Term Equity Value Fund -
Regular Plan - Growth Option 70.16% 68.04% 10.64% 14.48% NA NA
Past performance may or may not be sustained in the future. Load is not taken into consideration in Scheme Return Calculation.
#
Benchmark returns.
Returns are net of total expenses and are calculated on the basis of Compounded Annualized Growth Rate (CAGR).
Different Plans shall have different expense structure.
Mr. Nilesh Shetty and Mr. Sorbh Gupta manages 2 Schemes of Quantum Mutual Fund.
Product Labeling
Name of the Scheme This product is suitable for investors who are seeking* Riskometer
Quantum Tax Saving Fund • Long term capital appreciation Mod
erate
Moder
Highately
An Open Ended Equity • Invests primarily in equity and equity related securities of to ate
er
Hi
od w
M Lo
gh
Linked Saving Scheme companies in S&P BSE 200 index and to save tax u/s 80 C
Ver
with a Statutory Lock in of the Income Tax Act. Investments in this product are subject
Low
y Hig
h
of 3 years and Tax Benefit to lock in period of 3 years.
Investors understand that their principal will be
at Very High Risk
*Investors should consult their financial advisers if in doubt about whether the product is suitable for them.
The Risk Level of the Scheme in the Riskometer is based on the portfolio of the scheme as on May 31, 2021.
^^ Note:
Risk Free Rate assumed to be 3.39% (FBIL Overnight MIBOR for 31st May 2021) for calculating Sharpe Ratio.
Standard Deviation, Sharpe Ratio & Beta are calculated on Annualised basis using 3 years history of monthly returns.
Definitions
Standard deviation measures historical volatility. A high standard deviation suggests high volatility, while lower standard deviation would refer to more stability.
Beta is the tendency of a fund's returns to respond to market swings. A beta of 1 indicates that the fund price will move with the market. A beta of less than 1 means
that the security will be less volatile than the market. A beta of greater than 1 indicates that the security's price will be more volatile than the market.
Sharpe Ratio is used to characterise how well the return of an asset compensates the investor for the risk taken. The greater a portfolio's Sharpe ratio, the better its
risk-adjusted performance has been.
Portfolio Turnover Ratio is the percentage of a funds assets that have changed over the course of a year.
20Scheme Features
Fund Manager
QUANTUM Mr. Chirag Mehta
Work experience: 19 years. He has been managing this
EQUITY FUND fund since November 1, 2013
OF FUNDS Category of Scheme
Fund of Funds – Domestic
An Open Ended Fund of Funds scheme
Investing in Open Ended Diversified
Equity Schemes of Mutual Funds Inception Date (Date of Allotment)
July 20, 2009
Declaration of Net Asset Value (NAV)
Every Business Day
Investment Objective
Entry / Sales Load
The investment objective of the scheme is to
generate long-term capital appreciation by Not Applicable
investing in a portfolio of open-ended
diversified equity schemes of mutual funds
Total Expense Ratio (As on month end)
registered with SEBI. There can be no
assurance of positive returns from following TER specified are the actual expenses charged
the stated investment strategy. (i.e. effective rate) as at the end of the month.
Direct Plan - Total TER = 0.51%
{Base TER 0.46% (Inclusive of 0.26% Management Fees &
0.20% Other Expanses) + 0.05% GST (18% GST on 0.26%
Management Fees)}
Regular Plan – Total TER = 0.75%
{Base TER 0.70% (Inclusive of 0.26% Management Fees &
0.20% Other Expanses & 0.24% Distributor Commission)
+ 0.05% GST (18% GST on 0.26% Management Fees)}
Benchmark Index
S&P BSE 200 - Total Return Index
Minimum Application Amount
(Under each Option)
Purchase: `500/- and in multiples of `1/- thereafter.
Additional Purchase: `500/- and in multiples of
`1/- thereafter/ 50 units
Investment Options
Growth & Income Distribution cum Capital Withdrawal (IDCW)
(Income Distribution cum Capital Withdrawal (IDCW) Option
will in turn have two Facilities, Payout of Income Distribution
cum Capital Withdrawal (IDCW) Facility and Reinvestment of
Income Distribution cum Capital Withdrawal (IDCW) Facility)
21Scheme Features
Redemption Proceeds
QUANTUM Processed through RTGS/NEFT mode on T+3 basis from the
date of transaction where the investor’s Bank details are
EQUITY FUND available. Processed through cheque on T+3 basis from the
date of transaction where the required Bank details of
OF FUNDS investor are not available.
An Open Ended Fund of Funds scheme
Investing in Open Ended Diversified
Exit Load
Equity Schemes of Mutual Funds For complete details on Exit Load please refer page no. 24
Research Services
Quantum Information Services Private Limited (QIS) which
owns the website www.PersonalFN.com is the designated
agency to provide a recommended list of diversified equity
schemes to Quantum Equity Fund of Funds. The investments
in diversified equity schemes is made by Quantum Equity
Fund of Funds based on / from that recommended list of
diversified equity schemes provide by QIS
NAV Direct Plan Regular Plan
(as on May 31, 2021) (`/Unit) (`/Unit)
IDCW Option 47.484 47.128
Growth Option 47.484 47.128
Key Statistics
AUM `(In Crores)
^^Standard Deviation 21.04% (as on May 31, 2021)
Average AUM* Absolute AUM
^^Beta 0.93 63.49 65.99
*Cumulative Daily AuM / No of days in the month
^^Sharpe Ratio 0.45
Brokerages &
Commissions Details
Brokerages on Investments NIL
for May 2021
Distributor commissions ₹13,745.61
for May 2021
22Quantum Equity Fund of Funds Performance as on May 31, 2021
The Scheme is
Mr. Chirag Mehta is the Fund Manager managing the scheme since
managed by November 01, 2013.
Mr. Chirag Mehta.
For other Schemes Managed by Mr. Chirag Mehta please see page no. 25 & 26
Performance of the Scheme Direct Plan
Quantum Equity Fund of Funds - Direct Plan - Growth Option
Current Value `10,000 Invested at
the beginning of a given period
Benchmark Additional Benchmark Additional
Benchmark Benchmark
Scheme S&P BSE S&P BSE S&P BSE S&P BSE
Returns 200 TRI Sensex TRI Scheme 200 TRI Sensex TRI
Period (`)
(%) Returns (%) Returns (%) (`) (`)
Since Inception (20th Jul 2009) 14.02% 13.01% 12.44% 47,484 42,741 40,227
May 31, 2011 to May 31, 2021 (10 years) 12.99% 12.88% 12.42% 33,951 33,620 32,284
May 30, 2014 to May 31, 2021 (7 years) 13.50% 13.97% 12.99% 24,285 25,005 23,528
May 31, 2016 to May 31, 2021 (5 years) 13.40% 15.80% 15.68% 18,758 20,828 20,721
May 31, 2018 to May 31, 2021 (3 years) 11.05% 14.48% 15.04% 13,698 15,007 15,230
May 29, 2020 to May 31, 2021 (1 year) 58.83% 68.04% 61.66% 15,923 16,852 16,209
Past performance may or may not be sustained in the future. Load is not taken into consideration in scheme returns calculation.
Different Plans shall have a different expense structure.
Refer to the section “GIPS Compliance” on Page no. 25 for GIPS related disclosure.
Returns are net of total expenses and are calculated on the basis of Compounded Annualized Growth Rate (CAGR).
Performance of the Scheme Regular Plan
Quantum Equity Fund of Funds - Regular Plan - Growth Option
Current Value `10,000 Invested at
the beginning of a given period
Benchmark Additional Benchmark Additional
Benchmark Benchmark
Scheme S&P BSE S&P BSE S&P BSE S&P BSE
Returns 200 TRI Sensex TRI Scheme 200 TRI Sensex TRI
Period (`)
(%) Returns (%) Returns (%) (`) (`)
Since Inception (01st Apr 2017) 11.33% 14.76% 15.80% 15,645 17,758 18,435
May 31, 2018 to May 31, 2021 (3 years) 10.82% 14.48% 15.04% 13,615 15,007 15,230
May 29, 2020 to May 31, 2021 (1 year) 58.42% 68.04% 61.66% 15,882 16,852 16,209
Past performance may or may not be sustained in the future. Load is not taken into consideration in scheme returns calculation.
Different Plans shall have a different expense structure.
Refer to the section “GIPS Compliance” on Page no. 25 for GIPS related disclosure.
Returns are net of total expenses and are calculated on the basis of Compounded Annualized Growth Rate (CAGR)
23SIP Performance as on May 31, 2021
Total Amount Mkt Value as S&P BSE S&P BSE Scheme S&P BSE S&P BSE Sensex
Invested on May 31, 21 200 TRI Sensex Returns 200 TRI Returns TRI Returns
(`‘000) (`‘000) (`‘000) TRI (`‘000) (XIRR*) (%) (XIRR*)# (%) (XIRR*)@ (%)
SIP Since Inception 1,420.00 3,356.56 3,419.58 3,305.90 13.73% 14.02% 13.50%
10 Years SIP 1,200.00 2,557.04 2,646.64 2,558.33 14.50% 15.15% 14.51%
7 Years SIP 840.00 1,335.95 1,445.92 1,429.13 13.07% 15.29% 14.96%
5 Years SIP 600.00 855.82 926.25 924.25 14.25% 17.48% 17.39%
3 Years SIP 360.00 483.76 508.53 492.86 20.33% 23.96% 21.68%
1 Year SIP 120.00 148.32 152.43 147.26 47.82% 55.21% 45.94%
Past performance may or may not be sustained in the future. The above SIP performance is for Quantum Equity Fund of Funds - Direct plan - Growth option. Load is not taken
into consideration using applicable NAV on the SIP day (5th of every month). Return on SIP and Benchmark are annualized and compounded investment return for cash flows
resulting out of uniform and regular monthly subscriptions as on 5th day of every month (in case 5th is a non-Business Day, then the next Business Day) and have been worked
out using the Excel spreadsheet function known as XIRR. XIRR calculates the internal rate of return for series of cash flow. Assuming `10,000 invested every month on 5th day
of every month (in case 5th is a non-Business Day, then the next Business Day), the 1 year, 3 years, 5 years, 7 years, 10 years and since inception returns from SIP are annualized
and compounded investment return computed on the assumption that SIP installments were received across the time periods from the start date of SIP from the end of the
relevant period viz. 1 year, 3 years, 5 years, 7 years, 10 years and since Inception. *XIRR - XIRR calculates the internal rate of return to measure and compare the profitability of
series of investments.
Returns are net of total expenses
#
Benchmark Returns.
@
Additional Benchmark Returns
Exit Load:
Provisions % of Exit Load
10% of units if redeemed or switched out on or before 365 days from the date of allotment NIL
Remaining 90% of units if redeemed or switched out on or before 365 days from the date allotment 1%
If redeemed or switched out of units after 365 days from the date of allotment NIL
Note: Redemptions / Switch outs of units will be done on First In First Out (FIFO) basis. The above mentioned Exit Load shall be equally applicable
to the special products such as Systematic Withdrawal Plan (SWP) / Systematic Transfer Plan (STP) and Switches etc. However, no load shall be charged
for switching in between option / plan within the scheme.
Portfolio as on May 31, 2021
Quantum Equity Fund of Funds
Market / Fair Value % to Net
Name of Instrument Quantity
(₹ in Lakhs) Assets
MUTUAL FUND UNITS
1. L&T Mid Cap Fund - Direct Plan - Growth Option 4,73,233 939.27 14.23%
2. Invesco India Growth Opportunities Fund - Direct Plan - Growth Option 17,71,955 918.23 13.92%
3. Kotak Flexi Cap Fund - Direct Plan - Growth Option 17,78,053 917.83 13.91%
4. Invesco India Midcap Fund - Direct Plan - Growth Option 10,87,660 913.96 13.85%
5. Mirae Asset Large Cap Fund - Direct Plan - Growth Option 12,18,123 911.77 13.82%
6. Canara Robeco Bluechip Equity Fund - Direct Plan - Growth Option 22,26,794 902.97 13.68%
7. Axis Bluechip Fund - Direct Plan - Growth Option 19,77,024 894.01 13.55%
Total of Mutual Fund Units 6,398.04 96.96%
MONEY MARKET INSTRUMENTS
B) TREPS* 217.93 3.30%
Net Receivable/(payable) -17.28 -0.26%
Grand Total 6,598.69 100.00%
* Cash & Cash Equivalents
24You can also read