Activity Forecasts for the Period 2014-2015 to 2020-2021 - AIRSERVICES AUSTRALIA
←
→
Page content transcription
If your browser does not render page correctly, please read the page content below
Activity Forecasts for the Period 2014-2015 to 2020-2021

AIRSERVICES AUSTRALIA

Draft Final Report

25 February 2015

                                             International Air Transport Association

                                             800 Place Victoria, B.P. 113
                                             Montreal, Quebec
                                             Canada H4Z 1M1
                                             Tel: +1 (514) 874 0202
                                             Fax: +1 (514) 874 2662
                                             www.iata.org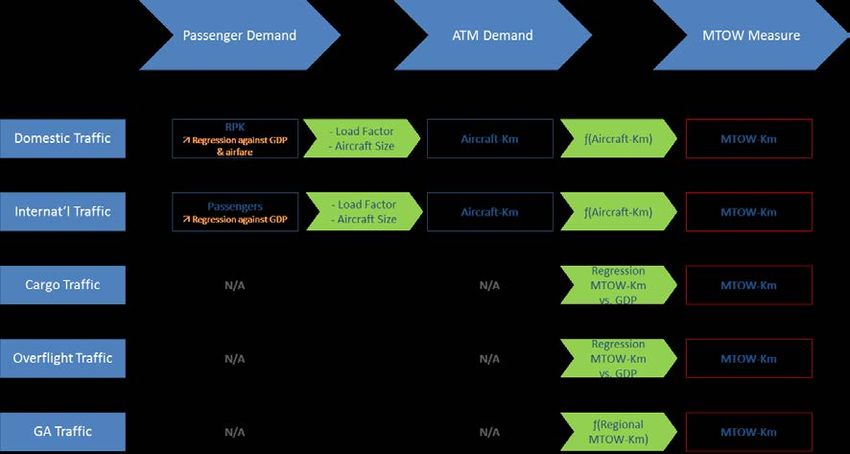
Preface

Airservices Australia (ASA) commissioned the International Air Transport Association (IATA) to
undertake this study.
This final report presents the primary assumptions considered by IATA Consulting and provides
results for the main activity forecasts.

For more information about this report or IATA please contact:
Laurent Delarue                                                   Damien Zaru
delaruel@iata.org                                                 zarud@iata.org
International Air Transport Association                           International Air Transport Association
800 square Victoria, PO Box 113                                   800 square Victoria, PO Box 113
Montreal Canada H4Z1M1                                            Montreal Canada H4Z1M1

DISCLAIMER.
IATA Consulting has prepared this report for the sole purpose of advising Airservices Australia on Australia’s growth in
aviation activity from the present to 2020-2021.
IATA Consulting is not hereby making any binding recommendations regarding the pricing of Airservices Australia’s
services. This report is not intended to serve as the only basis for any decisions that Airservices Australia may make with
respect to the subjects covered in this report. Rather, this report should be considered in conjunction with all other
information available to you, our valued customer.
This report is based on information provided by Airservices Australia, its respective advisers and representatives, and
selected third parties; it is limited in scope and content by the nature and quality of such information and the time
available for the analysis. IATA Consulting has undertaken limited independent investigation of the factual or substantive
accuracy or validity of such information. IATA Consulting makes no representations, warranties or other assurances,
express or implied, about the accuracy of the information contained herein.
The analysis and conclusions contained herein are based on many things, including certain assumptions and the analysis of
Airservices Australia management of certain information available at the time this report was prepared. The estimates,
assumptions and findings underlying the conclusions are inherently subject to significant economic and competitive
uncertainties and contingencies, many of which are beyond the control of Airservices Australia. IATA Consulting makes no
representations, warranties or other assurances, express or implied, that any of such conclusions will be realized.
IATA Consulting has undertaken the preparation of this report and the analysis contained herein solely at the request of
                                                                                                            th
Airservices Australia pursuant to IATA Consulting’s agreement for consulting services dated January, 20 2015 between
IATA and Airservices Australia.
This report is provided exclusively for the information of the senior management and key stakeholders of Airservices
Australia and its representatives. Neither this report nor any information contained herein may be disclosed or furnished
(in whole or in part) to any other person or entity, or quoted or referred to (in whole or in part) in any document or
communication without IATA’s prior consent. Nothing may be inferred beyond the matters expressly stated in this report.
This report is provided as of the date hereof and IATA Consulting undertakes no, and disclaims any, obligation to advise
Airservices Australia of any change in any information set forth herein occurring after the date hereof.

Activity Forecasts for the Period 2014-2015 to 2020-2021            DRAFT FINAL REPORT                      Page 2
Airservices Australia
Table of content
Preface ................................................................................................................................................... 2
Table of content ..................................................................................................................................... 3
List of tables ........................................................................................................................................... 5
List of Figures ......................................................................................................................................... 7
1 Executive Summary .................................................................................................................... 8
1.1 Objectives and approach ............................................................................................................ 8
1.2 Markets....................................................................................................................................... 8
1.3 Causal factors and analysis ......................................................................................................... 8
1.4 Data ............................................................................................................................................ 9
1.5 Recovery from the Global Financial Crisis and the further economic outlook .......................... 9
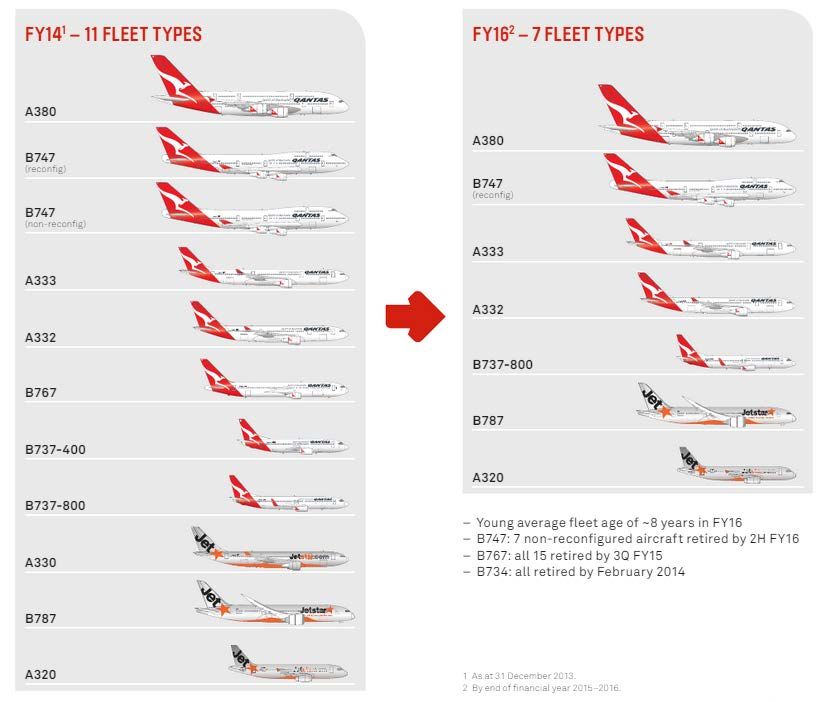
1.6 Fleet evolution ............................................................................................................................ 9
1.7 Airfare evolution....................................................................................................................... 10
1.8 Forecasts................................................................................................................................... 11
2 Introduction .............................................................................................................................. 12
2.1 Scope of the Study .................................................................................................................... 12
2.2 Key Forecast Factors ................................................................................................................. 12
2.2.1 En-Route Charges ........................................................................................................... 12
2.2.2 Terminal Charges............................................................................................................ 13
2.3 Approach .................................................................................................................................. 14
2.4 Data sources ............................................................................................................................. 15
2.5 Period of Historical Analysis, Base Year and Forecasting Horizon ........................................... 16
2.6 Study assumptions.................................................................................................................... 16
3 Aviation context ....................................................................................................................... 17
3.1 Global Aviation Environment – evolution since 2009 .............................................................. 17
3.2 Regional Aviation Environment ................................................................................................ 21
3.3 Changes in the Local Aviation Environment ............................................................................. 21
4 Economy Outlook ..................................................................................................................... 22
5 Major Domestic En-Route Forecast.......................................................................................... 24
5.1 Historical Traffic........................................................................................................................ 24
5.2 Major Domestic Passenger Traffic Forecast ............................................................................. 25
5.2.1 Fare assumptions ........................................................................................................... 25
5.2.2 Future Projection ........................................................................................................... 27
5.3 Major Domestic Airline Fleet Perspectives and Assumptions .................................................. 29
5.3.1 Qantas Group ................................................................................................................. 29
5.3.2 Virgin Australia ............................................................................................................... 32
5.3.3 Tiger Airways Australia ................................................................................................... 33
5.4 Load Factors and Aircraft Size .................................................................................................. 34
5.5 Major Domestic En-route Forecast .......................................................................................... 35
Activity Forecasts for the Period 2014-2015 to 2020-2021 DRAFT FINAL REPORT Page 3
Airservices Australia6 Major International En-Route Forecast .................................................................................... 37
6.1 Historical Traffic........................................................................................................................ 37
6.2 Adjustment Factors .................................................................................................................. 37
6.2.1 New Alliances on the Kangaroo Routes ......................................................................... 38
6.2.2 Air Service Agreements between Australia and Mainland China .................................. 38
6.2.3 Air Service Agreements between Australia and Hong Kong .......................................... 40
6.2.4 Air Service Agreements between Qatar and New Zealand ............................................ 40
6.2.5 Air Service Agreements between Mainland China and New Zealand............................ 40
6.3 Major International Passenger Traffic Forecast ....................................................................... 41
6.4 Major International Airline Fleet Perspectives......................................................................... 42
6.4.1 Qantas Group ................................................................................................................. 42
6.4.2 Virgin Australia ............................................................................................................... 44
6.4.3 Emirates ......................................................................................................................... 45
6.4.4 Singapore Airlines........................................................................................................... 46
6.4.5 Air New Zealand ............................................................................................................. 47
6.4.6 Cathay Pacific ................................................................................................................. 48
6.5 Load Factors and Aircraft Size .................................................................................................. 49
6.6 Major International En-route forecast ..................................................................................... 50
7 Regional Domestic En-Route Forecast ..................................................................................... 52
7.1 Historical Traffic........................................................................................................................ 52
7.2 Regional Passenger Traffic Forecast ......................................................................................... 54
7.3 Regional Airline Fleet Perspectives .......................................................................................... 55
7.3.1 Qantas Link ..................................................................................................................... 55
7.3.2 Virgin Australia Regional Airline ..................................................................................... 56
7.4 Regional load factor and aircraft size ....................................................................................... 56
7.5 Regional En-route Forecast ...................................................................................................... 57
7.5.1 Future Projection ........................................................................................................... 57
7.6 Regional International En-route Forecast ................................................................................ 60
8 Other En-route Forecasts ......................................................................................................... 61
8.1 Overflights ................................................................................................................................ 61
8.2 All-Cargo ................................................................................................................................... 63
8.3 General Aviation ....................................................................................................................... 65
9 Major Airports Forecasts .......................................................................................................... 67
9.1 Airport segmentation ............................................................................................................... 67
9.2 Historical Traffic........................................................................................................................ 68
9.3 Forecasts for Passenger Traffic at the Major Airports ............................................................. 69
9.4 Forecasts for terminal MTOW landed at the Major airports ................................................... 71
10 Regional Airports Forecasts ...................................................................................................... 72
11 Secondary Capital City Forecasts.............................................................................................. 75
12 Appendices - Major Airports Individual Forecasts ................................................................... 77
Activity Forecasts for the Period 2014-2015 to 2020-2021 DRAFT FINAL REPORT Page 4
Airservices AustraliaList of tables
Table 1 - Forecasts of Annual Growth in En-route Aviation Activity (in MTOW-Km) .......................... 11
Table 2 - Forecasts of Annual Growth in Terminal Activity (in MTOW Landed) .................................. 11
Table 3 - Relative Size of En-route Markets, Fiscal Year Ending June 2014 ......................................... 13
Table 4 - Average Real GDP Growth Rates during Previous Decades (% per annum) ......................... 23
Table 5 — Economic Growth Forecasts Used in Traffic Forecasts (%) ................................................ 23
Table 6 — Statistical Characteristics of the Major Domestic En-Route Traffic Regression ................. 24
Table 7 — Forecasts of Real GDP, Fares and Major Domestic Passenger-Km ..................................... 28
Table 8 — Fleet Size Forecast Qantas Group – Domestic Operations3................................................ 31
Table 9 — Fleet Size Forecast Virgin Australia – Domestic Operations1.............................................. 32
Table 10 — Fleet Size Forecast Tiger Airways Australia – Domestic Operations ................................ 33
Table 11 — Load Factors and Average Aircraft Size Forecast– Domestic Major Airlines Operations . 34
Table 12 - Forecast for Major Domestic Airline En-route Traffic ......................................................... 36
Table 13 — Statistical Characteristics of the Major international En-route Traffic Regression .......... 37
Table 14 — Opportunities for New Routes and Additional Frequencies Between Australia and
Mainland China ........................................................................................................................... 39
Table 15 - Forecast of Major International Passenger......................................................................... 41
Table 16 — Fleet Size Forecast Qantas Group – International Operations ......................................... 43
Table 17 — Fleet Size Forecast Virgin Australia – International Operations ....................................... 44
Table 18 — Capacity and Aircraft Size Forecast for Emirates – International Operations to Australia45
Table 19 — Capacity and Aircraft Size Forecast for Singapore Airlines – International Operations to
Australia ...................................................................................................................................... 46
Table 20 — Capacity and Aircraft Size Forecast for Air New Zealand – International Operations to
Australia ...................................................................................................................................... 47
Table 21 — Capacity and Aircraft Size Forecast for Cathay Pacific – International Operations to
Australia ...................................................................................................................................... 48
Table 22 — Load Factors and Average Aircraft Size Forecast– Major International Airlines Operations
..................................................................................................................................................... 50
Table 23 - Forecast of Major International Airline En-route Traffic > 20 Tonnes ................................ 51
Table 24 — Statistical Characteristics of the Regional Traffic Regression ........................................... 53
Table 25- Forecast of Regional Domestic En-route Passenger Traffic – Below 20 Tonnes MTOW ..... 54
Table 26 — Fleet Size Forecast Qantas Link – Domestic operations ................................................... 55
Table 27 — Fleet Size Forecast Virgin Australia Regional Airline – Domestic operations ................... 56
Table 28 - Forecast of Regional Airline En-route Traffic for Aircraft Below 20 Tonnes MTOW .......... 59
Table 29 - Forecast of Regional International Airline En-route Traffic (Below 20 Tonnes) ................. 60
Table 30 — Statistical Characteristics of the Overflight MTOW-Km Regression ................................. 61
Table 31 – Growth in World GDP and Forecasted MTOW-Km for Overflights .................................... 62
Table 32 — Statistical Characteristics of the All-Cargo MTOW-Km Regression .................................. 63
Table 33 – Growth in World GDP and Projected MTOW-Km of All-Cargo Flights ............................... 64
Table 34 – Growth Rate in Regional vs. GA MTOW-Km - Past and Forecasted Data .......................... 66
Activity Forecasts for the Period 2014-2015 to 2020-2021 DRAFT FINAL REPORT Page 5
Airservices AustraliaTable 35 – Growth in Regional MTOW-Km and Projected MTOW-Km for General Aviation .............. 66 Table 36 - Airports of Interest to Airservices Australia ........................................................................ 67 Table 37 - Results of Regression Equations for Individual Major Airports .......................................... 68 Table 38 – Historic and Forecasted Traffic Growth Rates at the Major Airports – in Passengers ....... 70 Table 39 – Projection of Terminal Passenger Demand Using the En-Route Demand Forecasts ......... 70 Table 40 – Terminal MTOW Forecast for the 8 Major Airports (Aggregated) ..................................... 71 Table 41 — Statistical Characteristics of the Regional Airports Passenger Traffic Regression............ 73 Table 42 - Forecast of Inbound Passengers at 20 Regional Airports (Aggregated) ............................. 73 Table 43 - Forecast of MTOW for Regional Airports (Aggregated) ...................................................... 74 Table 44 — Statistical Characteristics of the Secondary Airports MTOW-Km Regression .................. 75 Table 45 - Forecast of MTOW for Secondary Capital City Airports (Aggregated)................................ 76 Table 46 — Total Historic and Forecast Passengers and MTOW for Sydney Airport .......................... 77 Table 47 — Total Historic and Forecast Passengers and MTOW for Melbourne Airport .................... 77 Table 48 — Total Historic and Forecast Passengers and MTOW for Brisbane Airport ........................ 78 Table 49 — Total Historic and Forecast Passengers and MTOW for Perth Airport ............................. 78 Table 50 — Total Historic and Forecast Passengers and MTOW for Adelaide Airport........................ 79 Table 51 — Total Historic and Forecast Passengers and MTOW for Canberra Airport ....................... 79 Table 52 — Total Historic and Forecast Passengers and MTOW for Cairns Airport ............................ 80 Table 53 — Total Historic and Forecast Passengers and MTOW for Gold Coast Airport .................... 80 Activity Forecasts for the Period 2014-2015 to 2020-2021 DRAFT FINAL REPORT Page 6 Airservices Australia
List of Figures
Figure 1 – Summary of approach followed by IATA............................................................................. 14
Figure 1 –Monthly Passenger and Freight Development (in RPK and FTK) – 2007 to 2014 ................ 20
Figure 2 – Comparison of the Actual and Predicted Passenger-km Major Domestic Airline Traffic ... 25
Figure 3 - Evolution of Real Best Discounted Fares over the Past 15 Years on Major Domestic Airline
       Market ......................................................................................................................................... 26
Figure 4 – Comparison of Domestic Airfares in Europe, US and Australia (in Euro Constant) ............ 27
Figure 5 – Annual Growth in GDP and Passenger-Km ......................................................................... 28
Figure 6– Qantas Group Fleet Simplification ....................................................................................... 30
Figure 7 – Load Factor and Aircraft Average Size Evolution of Major Domestic Airlines .................... 34
Figure 8 – Total Aircraft Distance Traveled According to BITRE and ASA – Major Domestic En-Route
       Operations ................................................................................................................................... 35
Figure 9 – Aircraft Distance and MTOW-Km for Aircraft Above 20 tonnes – Major Domestic Airlines
       ..................................................................................................................................................... 36
Figure 10 – Network Change for QF Further to the Implementation of the Alliance with EK ............. 38
Figure 11 – Load Factor and Aircraft Average Size Evolution of Major International Airlines ............ 49
Figure 12 – Comparison of International En-route Distance and MTOW-Km ..................................... 51
Figure 13 – Historical Trend in Regional Domestic Passenger Traffic – 1998 to 2013 ........................ 52
Figure 14 – Total Aircraft Distance Traveled According to BITRE and ASA – Regional Domestic En-
       Route Operations ........................................................................................................................ 58
Figure 15 – Trends in Total Aircraft Distance and MTOW-Km – ASA measures .................................. 59
Figure 16 – Comparison of Overflights Actual MTOW-Km and the Trend Predicted by the Equation 62
Figure 17 – Comparison of All-Cargo Actual MTOW-Km and the Trend Predicted by the Equation... 63
Figure 18 – Historical Evolution of General Aviation and Regional Traffic MTOW-Km ....................... 65
Figure 19 – Actual and Estimated Qantas Seat Offer to/from CBR Between 2012-13 and 2015-16 (in
       One-Way Seats) ........................................................................................................................... 69
Figure 20 – Actual and Estimated Virgin Australia Seat Offer to/from CBR Between 2012-13 and
       2015-16 (in One-Way Seats) ....................................................................................................... 69
Figure 21 - Passenger Trend at the 20 Regional Airports .................................................................... 72
Figure 22 – Evolution of MTOW-Km (ASA) of Secondary Capital City Airports and Commodity Metal
       Prices ........................................................................................................................................... 75

Activity Forecasts for the Period 2014-2015 to 2020-2021                                DRAFT FINAL REPORT                                 Page 7
Airservices Australia
1 Executive Summary 1.1 Objectives and approach The purpose of the study is to advise Airservices Australia on Australia’s growth in aviation activity from the present to 2020-21. The study will serve as an input for the pricing of airlines services. The approach undertaken is to analyze the interaction between the prospects for future demand by the customers of domestic and international air transport services on the one hand, and the supply of these services by the airlines on the other. The forecasts of aviation activity result from this analysis. 1.2 Markets There are many air transport markets to consider, including major and regional domestic traffic, international traffic, overflights of Australian airspace by international services, all-cargo traffic and general aviation. Both en-route and airport traffic of relevance to Airservices Australia were analyzed. The en-route markets are also categorized by aircraft of greater than or equal to 20 tonnes MTOW, and less than 20 tonnes MTOW. 1.3 Causal factors and analysis Demand for air travel depends on such factors as income levels and airfares. At a global level, income is represented by Gross Domestic Product (GDP) — for Australia and for the world. Trends in these measures have a powerful effect on demand. Regression analysis of the impact of GDP and airfares on traffic demand was undertaken for most of the markets. The estimated relationships, together with assumptions about the future development of the causal factors, were used as a basis for forecasting passenger numbers. Assumptions about airline pricing and aircraft deployment strategies to meet future demand were incorporated into the forecasts. This process took into account the aircraft types in the existing airline fleets, the numbers and types of aircraft on order and the flexibility of the airlines to adjust delivery schedules. Passenger forecasts were translated into aircraft movement forecasts using assumptions about average load factors and aircraft size. These latter variables were influenced by airline response to developments in passenger demand. Activity Forecasts for the Period 2014-2015 to 2020-2021 DRAFT FINAL REPORT Page 8 Airservices Australia
1.4   Data

For the past trends and the regression analysis, GDP data were obtained primarily from IHS Global
Insight, a world leader in socio-economic forecasts. This data is largely used within the Aviation
Industry. Data for passenger-kilometers, passenger numbers, and airfare indices were obtained from
the Bureau of Infrastructure, Transport and Regional Economics (BITRE).

Aggregated historic data for aircraft-km, airport movements, seats and seat-km for domestic and
international passenger services were also obtained from BITRE and complemented by SRS Analyzer,
a leading airline schedule database. Together with the passenger data, this helped to understand
past trends in average load factors and aircraft size.

Detailed data on airline fleets, including aircraft numbers by aircraft type plus seating capacities for
aircraft types, together with numbers of aircraft on order and estimates of delivery dates, were
available from IATA databases and airline communications. This information was used to predict the
airline response to address passenger demand forecasts.

Data for aviation activity related to the pricing of air services was available from Airservices
Australia. This information was used to observe the historic relationships between aircraft distances
traveled and en-route MTOW-Km, and between the numbers of flights and terminal MTOW. These
relationships formed the links between the passenger and aircraft movement analyses using BITRE
data and the final forecasts of ASA’s concepts of en-route MTOW-Km and terminal MTOW. The
forecasts for the 2014-15 to 2020-21 period were built from the ASA database as at November 2014.

1.5   Recovery from the Global Financial Crisis and the further economic outlook

The economic outlook has been, and will continue to be, the major factor affecting the volume of air
traffic.

Following the financial crisis, the Australian economic growth almost bounced back to pre-crisis
levels (3.6% in 2012, back from 1.5% in 2009). At the same time, the total world economy grew by
2.5% in 2012, back from a downturn of 1.9% in 2009.

Since then, Australian economy has grown by 2.3% in 2013 and 3% in 2014, a range that it is
expected to sustain over the coming 7 years (CAGR of 2.8%). A dynamic 3.6% annual growth is
forecasted at the global level. The economic forecasts used as the basis for the traffic forecasts are
those published in January 2015 by IHS Global Insight.

1.6   Fleet evolution

On all segments, it was established that demand would be growing steadily over the forecast period,
fueled by economic growth. Airlines are anticipated to increase capacity at a slower pace in the first
two years in particular in an attempt to rationalize their operations. This will trigger load factor
upward.

Activity Forecasts for the Period 2014-2015 to 2020-2021   DRAFT FINAL REPORT              Page 9
Airservices Australia
Aircraft size is expected to slightly increase on domestic routes, while it should remain stable on
international routes. On domestic routes, more of the largest narrow-body aircraft (A320 and B737-
800) will be replaced by more efficient version (A320neo and B737-800MAX), while Qantas’B767 will
be retired in FY 2015. On regional routes, a few larger aircraft (ATR72 (VARA) and Dash 8-Q400
(Qantas Link)) are planned for delivery, contributing to slightly increase the average size of aircraft
International routes will mainly experience the roll-out of the 787s and the retirement of the 747s
both by Qantas, while foreign competitors while contribute to some addition of A380, A350 and 787
as well.

1.7   Airfare evolution

After a steep decrease in 2008-09, 2009-10 and 2010-11, domestic airfare caught up in 2011-12. It
however pursued its decrease over the following 2 years.

On the short term, despite the recent decrease in oil prices, domestic airfares are expected to
stabilize (-3% in 2014-15, +0.1% in 2015-16), as a result of the on-going airline rationalization and
hedging practices preventing airlines from taking immediately the benefit of the recent drop in Brent
crude prices.

On the longer run, airfare is overall expected to turn downwards again, supported by the lower fuel
costs and by the introduction of brand new - more efficient aircraft. It will however be partially
offset by the duopoly situation on the domestic market that will limit the ability to further reduce
domestic fares.

Activity Forecasts for the Period 2014-2015 to 2020-2021   DRAFT FINAL REPORT             Page 10
Airservices Australia
1.8     Forecasts

The tables below summarize the overall aviation activity forecasts produced in this study.

Table 1 - Forecasts of Annual Growth in En-route Aviation Activity (in MTOW-Km)

         Fiscal Year                                           En-Route Traffic
      ending June 30th
                                   Aircraft greater than 20 tonnes            Aircraft less than 20 tonnes

                                     MTOW-Km               Growth             MTOW-Km              Growth

             2014                    123,535,572            6.4%              11,092,932            -7.3%

             2015                    124,479,871            0.8%              11,502,147             3.7%

             2016                    125,432,440            0.8%              11,135,590            -3.2%

             2017                    129,194,082            3.0%              11,072,951            -0.6%

             2018                    134,284,256            3.9%              11,263,610             1.7%

             2019                    139,617,303            4.0%              11,506,371             2.2%

             2020                    144,431,016            3.4%              11,747,952             2.1%

             2021                    147,133,868            1.9%              11,978,955             2.0%
Sources: Airservices Australia, IATA estimates

Table 2 - Forecasts of Annual Growth in Terminal Activity (in MTOW Landed)

  Fiscal Year                                          Terminal Traffic
    ending
  June 30th                                                                           Secondary Capital
                         Major Airports                Regional Airports
                                                                                        City/Metro D
                    MTOW-Km           Growth       MTOW-Km           Growth        MTOW-Km          Growth

      2014          50,914,378         2.4%        4,525,222          3.1%          304,440           -0.8%

      2015          51,192,117         0.5%        4,690,096          3.6%          299,915           -1.5%

      2016          52,857,335         3.3%        4,671,190          -0.4%         305,330           1.8%

      2017          54,172,645         2.5%        4,666,939          -0.1%         310,980           1.9%

      2018          55,256,824         2.0%        4,772,250          2.3%          315,525           1.5%

      2019          56,899,875         3.0%        4,872,889          2.1%          317,950           0.8%

      2020          58,266,534         2.4%        4,971,957          2.0%          321,490           1.1%

      2021          59,502,129         2.1%        5,069,809          2.0%          324,560           1.0%
Sources: Airservices Australia, IATA estimates

Activity Forecasts for the Period 2014-2015 to 2020-2021     DRAFT FINAL REPORT                   Page 11
Airservices Australia
2 Introduction
2.1 Scope of the Study
Air Services Australia (ASA) requested that IATA prepare forecasts for en-route and airport activities
for the following types of traffic for the period 2014-15 to 2020-21:
MTOW-Km flown in the Australia FIR for en-route services with a focus on :
Domestic passenger en-route traffic
International passenger en-route traffic for flights to and from Australia
International overflights en-route traffic
Cargo aircraft en-route
Non-commercial (general aviation) en-route
MTOW landed at Australian airports. Specific forecasts were requested for each of the 8
Australian major airports, for the group of Australian regional airports and for another group of
secondary capital airports.
2.2 Key Forecast Factors
The relative importance of the various air transport markets depends on their traffic volumes.
2.2.1 En-Route Charges
En-route charges depend on MTOW-Km, which is determined by a formula specified by Air Services
Australia.
The measure of MTOW-kilometers encapsulates two aspects – the MTOW of the aircraft and total
aircraft-kilometers flown. It depends on the chargeable distance flown in Australian airspace
(measured as aircraft-Km). Total measures for these variables for the air transport markets in 2014
are shown in Table 3.
The domestic passenger traffic of the major airlines (namely Qantas mainline, Jetstar, Virgin
Australia and Tiger Australia) closely coincides with domestic passenger traffic on aircraft larger than
20 tonnes MTOW. The domestic passenger traffic of the regional airlines (including but not limited
to Qantas Link and Virgin Australia Regional Airlines) closely coincides with the domestic traffic on
aircraft smaller than 20 tonnes MTOW. Therefore IATA used the major and regional segments to
split the domestic en-route traffic into above and below 20 tonnes.
Activity Forecasts for the Period 2014-2015 to 2020-2021 DRAFT FINAL REPORT Page 12
Airservices AustraliaTable 3 - Relative Size of En-route Markets, Fiscal Year Ending June 2014
MTOW tonne-Km
Traffic type Below 20t Above 20t
(000) (% of total) (000) (% of total)
Domestic Pax 8,876 80.0% 45,741 37.0%
International Pax 314 2.8% 70,229 56.8%
Domestic and International Cargo 2,090 1.7%
Over-flights 5,475 4.4%
Non-commercial flights 1,904 17.2%
Total 11,093 100% 123,536 100%
Note: Domestic and International cargo flights have been allocated to above 20t as the large majority of the
related traffic belongs to this category. Similarly non-commercial flights have been allocated to below 20t.
Sources: Airservices Australia, IATA calculation
Domestic all-cargo flights are relatively minor in number. Some flights are on aircraft of sub-20
tonnes and some on aircraft of more than 20 tonnes. International all-cargo flights, which are
predominantly flown by aircraft above 20 tonnes are also a small part of the total market.
2.2.2 Terminal Charges
Terminal charges depend on MTOW. In 2014, Major Airports accounted for 91% of the landed
MTOW.
Activity Forecasts for the Period 2014-2015 to 2020-2021 DRAFT FINAL REPORT Page 13
Airservices Australia2.3 Approach
Figure 1 – Summary of approach followed by IATA
For the main Aviation Markets the approach has been to forecast passenger demand first, and
then aircraft movements to satisfy this demand.
Passenger demand has been derived from regression analysis of historical traffic
(measured in passenger-km for en-route markets and in passengers for terminal markets)
against causal variables. Several models were tested (including linear and logarithmic
regressions as well as trend-lines) and the ones returning the best results were selected.
More details on the modelling approach and the associated variables are provided in the
corresponding sections for each market).
Incorporated in the forecasts are ‘business-as-usual’ assumptions. In addition IATA studied
the impact on traffic of anticipated changes that were believed not to be part of the
‘business-as-usual’ assumptions. Such changes include for instance new or enhanced air
services agreements.
The forecast for aircraft movements (measured in aircraft-km for en-route markets and
ATM for terminal markets) has been developed using data and information on current and
future airline fleets and strategies. Detailed analysis and fleet modelling covered the major
Australian carriers and the top foreign carriers serving Australia, namely Singapore Airlines
group, Emirates, Air New Zealand and Cathay Pacific. These airlines account for 62% of the
seat supply (measured in seat-km) in FY2015.
The final step was to derive the traffic measures of direct interest to Airservices Australia,
which are the MTOW-Km and MTOW totals relating to the airspace and terminal demands
on the air traffic management system.
Activity Forecasts for the Period 2014-2015 to 2020-2021 DRAFT FINAL REPORT Page 14
Airservices Australia For Overflights, All-Cargo and General Aviation, simplified approaches were used to forecast
their associated MTOW-Km. More details are provided in the corresponding sections of this
report.
2.4 Data sources
The following data sources were used to analyze traffic flows, the causal factors affecting traffic, and
the outlook for the causal factors:
Bureau of Infrastructure, Transport and Regional Economics (BITRE)
For airline passenger numbers and passenger-km traveled
For airline passenger aircraft movements and aircraft-kilometers traveled
For airport passenger numbers and aircraft movements
For trends in airfares
Airservices Australia
For distances flown (aircraft-km), MTOW and MTOW-Km; for each air transport sector
IATA
For trends in fleet development
For historical data and projections about the Global and Regional Aviation Industry
For actual traffic and schedule data including O&D traffic and future schedules
IHS Global Insight
For economic forecasts for the world and regional economies as well as for Australia
Activity Forecasts for the Period 2014-2015 to 2020-2021 DRAFT FINAL REPORT Page 15
Airservices Australia2.5 Period of Historical Analysis, Base Year and Forecasting Horizon 2013-14 was used as the base year to establish the various regressions. For most regressions, the historical analysis was undertaken over a period of 20 years, from 1993-94 until 2013-14. Some data for 2013-14 needed to be extrapolated because the information was incomplete. It was the case for the split of Domestic Traffic into Major and Regional airlines. While it used to produce detailed report for both segments in the past, BITRE stopped this particular detail at the end of FY2013. IATA therefore estimated the split for 2013-14. In general the main traffic measures for 2014-15 were estimated using the most updated statistics at end of November and December 2014. Traffic measures were forecasted from 2015-16 onward. 2.6 Study assumptions The forecasts of aviation demand and traffic are based on various economic and industry assumptions. These are discussed at appropriate places in the report. The economic assumptions are expressed in terms of GDP growth which incorporates population growth and business cycle conditions, and are based on information published by official specialized agencies. Activity Forecasts for the Period 2014-2015 to 2020-2021 DRAFT FINAL REPORT Page 16 Airservices Australia
3 Aviation context
3.1   Global Aviation Environment – evolution since 2009

Since the recession that hit global air traffic in the end of the last decade, world economy and global
traffic have now fully recovered.

In 2010, worldwide air travel rose by 7.5% (in RPK), following a 1.9% decline in 2009. International
air travel grew 8.3% after a 2.5% fall the year before, while domestic air travel was up 6.1% following
a 0.9% decline.

By the end of 2010, most passenger markets except the US and Japanese domestic markets had
surpassed their pre-recession peaks. Asia-Pacific airlines grew 9% in RPKs but were held down by the
relative weakness of the Japanese market.

Air freight also fully recovered its losses in 2010, as international freight markets grew by 20.8%,
driven by the business inventory cycle (replenishment of the stocks). By the end of 2010, air freight
volumes were level with their pre-recession peak of early 2008.

In terms of capacity, available seat kilometers rose by 4.2% on average in 2010 (vs. the 7.5% growth
in traffic), and by 4.6% in international markets. It resulted in increased load factors.

While they increased by 6% in 2010, yields did not reached back prerecession levels, as airlines could
only recover part of the ground lost in fares (both passenger and freight markets). Indeed,
worldwide average passenger fares rose by 5% in 2010 (excluding surcharges), while they underwent
a decline of about 13% in 2009. Same trend was observed in international markets, where fares
grew up 17% from the lows of mid-2009, but still remaining 8% below prerecession levels.

Oil prices experienced a steep 30% increase between 2009 and 2010 (average price), causing an 11%
rise in fuel costs for the entire airlines industry. Airlines were however unable to fully recoup the
added fuel costs through fuel surcharges.

In cargo markets, fuel surcharges rose as airlines sought to recoup rising fuel costs. Underlying cargo
rates, however, declined in many markets, therefore partly offsetting the positive impact of the
higher surcharges.

Overall, airline profitability in 2010 saw its largest improvement in more than 60 years. The industry
went from net post-tax losses of US$9.9 billion in 2009 to net post-tax profits of US$18 billion in
2010.

In 2011, worldwide international and domestic demand (RPK) grew 5.9%, pursuing the rebound from
the recession of 2008/2009 despite slow economic growth in many regions.

Activity Forecasts for the Period 2014-2015 to 2020-2021   DRAFT FINAL REPORT             Page 17
Airservices Australia
Nevertheless, airlines struggled to make significant profits. Although revenues rose 9.4% to US$598
billion, profits fell by almost half compared with 2010, to US$7.9 billion. This was largely due to a
sharp increase in the cost of fuel, driven by the political unrest in the Middle East and North Africa
mainly. The average price of a barrel of oil consequently rose from US$79 in 2010 to US$111 in 2011.

After an exceptionally strong rebound in 2010, air freight metric ton kilometers flown fell 0.4%
worldwide in 2011.

Worldwide passenger capacity accelerated in 2011, with ASKs growing 6.6%, against +4% in 2010.
Domestic and international markets followed different patterns: in domestic markets, slightly less
capacity was added than growth in the market: 4.0% versus 4.1%, while an opposite situation
prevailed in international markets, where capacity increased at a greater pace (8.1%) than demand
(6.9%). Considering the limited overcapacity that was brought to the market, load factors did not
suffer the situation and remained close to historic highs in 2011, with a worldwide average of 78.3%.
Domestic markets even saw load factors rise to a new high of 79.6%.

Passenger yields worldwide rose 4% in 2011, mostly as a result of airlines attempting to recover
costs associated with the rise in the price of oil.

In 2012, passenger traffic (RPK) grew 5.3%, which is 2.5 times as fast as global GDP 1 that grew at a
low rate of 2.1%.

This robust performance lied in the strength of emerging markets, whose strong economic
developments offset the weak economic and air travel growth in the developed economies. During
2012, 65% of the growth in passenger numbers in international markets took place in markets linked
to emerging economies.

In contrast to passenger travel, air freight volumes were again weak relative to global economic
conditions. While world trade expanded by 2.9% in 2012, air freight (FTK) shrank 1.5% as it lost share
to other modes of transport.

2012 saw as well dramatic shifts in regional demand and supply balances on the oil market, in a
context of continuous social and political changes in the Middle East and North Africa. The sharp but
temporary dip in oil prices in mid-2012 followed a dispute within OPEC over whether US$100 a
barrel was the “right” target price. The influence of OPEC and strong demand from the BRIC
economies prevented a decline in price that new, non-OPEC supplies could have brought.

Eventually, the spot price of jet fuel in 2012 increased a couple of dollars above the previous year’s
level to average just under US$130 a barrel, setting a new record high.

Partly in response to the sustained high cost of jet fuel, the delivery of new, fuel-efficient aircraft
rose to a record level in 2012, bringing with them an additional 7%–8% to global capacity. This

1
    Note” air traffic growth usually averages 1.8 times that of global GDP

Activity Forecasts for the Period 2014-2015 to 2020-2021         DRAFT FINAL REPORT       Page 18
Airservices Australia
increase was partly offset by the retirement of older, less efficient aircraft. The net capacity increase eventually reached close to 4% in 2012. All in all, airline profits declined to US$7.6 billion in 2012 (vs. US$8.8 billion a year before). This however remained a positive achievement considering the global economic slowdown 2 and the average price of jet fuel reaching a record high. In 2013, airlines saw improved profitability, posting an industry-wide post-tax profit of US$10.6 billion. This was the fourth successive year of profitability. Profitability in 2013 was achieved largely on increased demand and slightly lower than expected fuel costs. Air travel markets gained 5.2% compared to 2012, despite high fuel costs and relatively slow global economic growth. Growth in air travel was again driven by solid economic expansion in emerging regions, where less mature air travel markets continue to strongly increase. Jet fuel averaged just under US$125 a barrel, about $5 less than in 2012. Demand for cargo and passenger services—expressed FTKs and in RPKs, respectively—showed signs of accelerated growth. This reflected the rebounding global economy (2% increase in global GDP) and an increase in world trade. In emerging economies, GDP growth had an even greater impact, generating more air travel per point of GDP increase than in mature markets. This trend was supported by significant price drops in airline fares in some African and Asian markets because of increasing competition. In terms of capacity, an overall 5% volume was added to the global market. Passenger load factors reached 80% in 2013 (a record high), as the result of an increase in passenger volumes coupled with strong capacity management. Consequently, the breakeven load factor came down for the first time since 2009, settling at 64.2% in 2013, from 64.8% in 2012. Passenger yields in 2013 remained unchanged from 2012. Cargo markets remained challenging in 2013, as weak load factors (45.3%) faced an increased capacity growth, (2.6% versus 1.4% in 2012). In 2014, global air travel expanded by a strong 5.9% compared to 2013, above its 10 year average growth rate of 5.6%. Economic conditions around the world showed considerable variation throughout the year, but the demand backdrop for air travel was supportive, particularly in emerging markets. 2 Note: over the past 20 years, whenever global economic growth has fallen to 2% the airline industry has gone from profit to loss; 2012 therefore proved to be a resilient year for the industry. Activity Forecasts for the Period 2014-2015 to 2020-2021 DRAFT FINAL REPORT Page 19 Airservices Australia
More than 50% of the growth in passenger travel arose from emerging markets, including Asia
Pacific and the Middle East. Asia Pacific carriers saw strong growth in domestic air travel demand,
particularly in China toward the end of 2014.

Although international RPKs grew by 6.1 % in 2014 compared to 2013, the growth rate is slightly
below its long-run average (6.3%). Moreover, the level of traffic has broadly tracked sideway since
August. The biggest downward influences over this period have been from African and Asian
carriers, whereas notable offsets have come from Middle Eastern and European carriers, despite the
latter region’s ongoing economic frailties. Although the Eurozone has fallen back toward very weak
economic expansion, partly as a result of the Russia-Ukraine crisis, carriers in some nations, including
Turkey, continue to expand strongly.

Industry load factors reached 79.7% overall in 2014, supported by stronger growth in demand than
expansion in capacity. Nonetheless, international load factors have displayed a downward trend
throughout 2014, particularly as a result of solid capacity expansion in Asia Pacific carriers.

The decline in oil prices over recent months should help support economic activity and passenger
demand in the months to come.

Figure 2 illustrates the evolution of both passenger and cargo demand in the recent years,
highlighting the recovery from the 2008-2009 recession.

Figure 2 –Monthly Passenger and Freight Development (in RPK and FTK) – 2007 to 2014

Source: IATA

Activity Forecasts for the Period 2014-2015 to 2020-2021   DRAFT FINAL REPORT              Page 20
Airservices Australia
3.2 Regional Aviation Environment Since 2010, the Asia-Pacific market has experienced a strong growth, outperforming most of the time the global air market. While the overall market grew by 7.5% in 2010, Asia-Pacific airlines grew 9% in the same year, although somewhat held down by the relative weakness of the Japanese market. In 2011, growth for the Asia-Pacific airlines was slightly slower than the global growth (5% vs. 5.9%), due mostly to the impact on travel of the tsunami and earthquake in Japan. In 2012, half of the growth arising from emerging markets came from Asia. Growth in passenger travel reached 7% in 2014, outperforming the global industry (5.9%). International traffic growth for Asia Pacific carriers reached 5.8% in 2014 overall, but the seasonally- adjusted level of traffic has been broadly flat over the past four months or so. This has come amid signs of a slowdown in regional production activity, although trade volumes have remained strong. With weakness in international air travel volumes during the latter parts of 2014, the upward trend in global travel was driven almost entirely by domestic traffic. Strong growth in the Chinese domestic market was one of the key contributors, with expansion reaching 11% in 2014 overall, in spite of ongoing signs of a slowdown in the Chinese economy and industrial activity. Annual growth in domestic air travel in Australia slowed to just 1.8% in 2014 overall, as the economy keep struggling to rebalance away from mining investment-led growth. For 2015, IATA foresees an increase in passenger travel (RPK) of 7.7% for Asia-Pacific 3.3 Changes in the Local Aviation Environment IATA examined more than a dozen anticipated changes in the aviation environment that are known to influence air traffic demand and further determined whether these changes may have an impact on the future traffic above and beyond the baseline forecast. These changes that have been studied are: New alliances on the Kangaroo routes (e.g. QF/EK) Air Service Agreements between Australia and Mainland China Air Service Agreements between Australia and Hong Kong Air Service Agreements between Qatar and New Zealand Air Service Agreements between Mainland China and New Zealand The results of our analysis are reflected in the relevant sections of the report. Activity Forecasts for the Period 2014-2015 to 2020-2021 DRAFT FINAL REPORT Page 21 Airservices Australia
4 Economy Outlook
Over the past 3 decades, average Australian economic growth over successive 10-year periods has
been higher than 3% per annum, despite periodic recessions (see Table 4).

Australia has systematically outperformed the seven major OECD countries, as those countries were
seriously affected the financial crisis of the end of the past decade (2008-2010)

The Australian economy also suffered from this crisis, seeing its growth rate drop from 3.7% in 2007-
08 to 1.2% in 2008-09. It however caught up pretty well as from 2009-10, with a real 2.2%, followed
by a 2.6% the year after and 3.8% in 2011-12. It has since then ranged between 2% and 3 % per
annum.

The tables on the next page present a summary of the past and future economic growth rates for
Australia and the World. It is to be noted that no forecast beyond 2015 could be found for Australian
real GDP, both from IMF and ABS.

IATA therefore relied exclusively on data sourced from IHS Global Insight, a leading global socio-
economic forecasting company, presented in Table 5 below.

Activity Forecasts for the Period 2014-2015 to 2020-2021   DRAFT FINAL REPORT           Page 22
Airservices Australia
Table 4 - Average Real GDP Growth Rates during Previous Decades (% per annum)

                                   1960s                      1970s                      1980s                         1990s                2000s      2010s (until 2014)

Australia                           5.1%                       3.0%                       3.3%                         3.4%                     3.1%                2.7%

7 Major OECD
                                                               3.5%                       3.1%                         2.5%                     1.5%                1.6%
Countries

Total World                                                                               3.2%                         3.1%                     3.9%                3.6%

Sources: ABS and OECD web sites; “Real” refers to GDP measures which have been adjusted to remove the effect of inflation.

Table 5 — Economic Growth Forecasts Used in Traffic Forecasts (%)

 Fiscal year                       2013-14       2014-15        2015-16       2016-17         2017-18        2018-19       2019-20    2020-21

 Australian Real GDP                  2.7%           2.9%           2.8%          2.9%              2.8%        2.8%           2.8%     2.8%

 World Real GDP                       2.6%           2.8%           3.3%          3.6%              3.6%        3.6%           3.7%     3.7%

Source for forecast of Australian GDP and World GDP growth was IHS Global Insight (January 2015);

Activity Forecasts for the Period 2014-2015 to 2020-2021                                                   DRAFT FINAL REPORT                                          Page 23
Airservices Australia
5 Major Domestic En-Route Forecast
5.1 Historical Traffic
A regression analysis of the traffic (measured in RPK) of the major Domestic airlines was undertaken:
The period of the analysis was 1993-94 to 2012-13;
Australian GDP, the ‘Best discount fares’ (both measured in real terms) and a dummy variable
introduced for the demise of Ansett in 2002 were the explanatory variables. Alternative causal
variables, such as Full Economy Fares, were tested and discounted;
The statistical significances of the explanatory variables were strong (see table below);
Table 6 — Statistical Characteristics of the Major Domestic En-Route Traffic Regression
Type of regression: Multilinear
Intercept value: 0
Causal Variable Coefficients t Stat Adj. R Sq.
GDP Australia 1.8 46.0
Airfare -0.7 -12.3 0.94
Ansett airlines -25.5 -2.4
Source: IATA estimates
During the previous 5-year forecast study (‘Activity Forecasts for the Period 2010-2011 to 2015-2016’),
BITRE advised caution on the published airfare statistics because of the complexity of airlines’ fare
structures. However, the information is the best available and presumably gives a reasonable idea
about the year-on-year movements. The Real Best Discount index is the best reflection of the market
place and its effect on passenger demand. Furthermore, its statistical performance in the demand
equation is relatively good.
Figure 3 compares actual passenger-km with that predicted by the equation given above. It highlights
the relevance of the above equation to model major domestic traffic. A Summary of the forecast for the
Real Best Discounted Fares can be seen in table 7.
Activity Forecasts for the Period 2014-2015 to 2020-2021 DRAFT FINAL REPORT Page 24
Airservices AustraliaYou can also read