Inflation forecasting methodology - Essential Services ...
←
→
Page content transcription
If your browser does not render page correctly, please read the page content below

Inflation forecasting
methodology

Melbourne Water

14 October 2020
Contact us:

Incenta Economic Consulting
Unit 1, 19-35 Gertrude Street
Fitzroy, Victoria, 3065
Telephone: +61 3 8514 5119
Website: www.incenta.com.au

Disclaimer:

This report has been prepared by Incenta Economic Consulting (“Incenta”) at the request of the client and for the purpose
described herein. This document is not intended to be utilised or relied upon by any other persons or for any other
purpose. Accordingly, Incenta accepts no responsibility and will not be liable for the use of this report by any other
persons or for any other purpose.

The information, statements, statistics and commentary contained in this report have been prepared by Incenta from
information provided by, or purchased from, others and publicly available information. Except to the extent described in
this report, Incenta has not sought any independent confirmation of the reliability, accuracy or completeness of this
information. Accordingly, whilst the statements made in this report are given in good faith, Incenta accepts no
responsibility and will not be liable to any person for any errors in the information provided to or obtained by us, nor the
effect of any such errors on our analysis, our conclusions or for any other aspect of the report.
Melbourne Water – Inflation forecasting
 methodology

Table of Contents
1. Executive Summary ........................................................................................................................ 1

2. Background and outline of report ................................................................................................... 7

 2.1 The Brief ................................................................................................................................. 7

 2.2 Background and ESC’s previous inflation forecasting approach............................................ 7

 2.3 ESC’s Guidance Paper ............................................................................................................ 8

 2.4 Victorian Department of Treasury and Finance’s approach to inflation forecasting .............. 8

 2.5 Treatment of Covid-19 in our advice ...................................................................................... 9

 2.6 Outline of report .................................................................................................................... 10

3. Analysis of inflation forecasting methods applied by other regulators ......................................... 11

 3.1 Introduction ........................................................................................................................... 11

 3.2 Assessment criteria ............................................................................................................... 11

 3.3 Potential inflation forecasting methods................................................................................. 11

 3.3.1 Market instruments ....................................................................................................... 12

 3.3.2 The AER Method .......................................................................................................... 14

 3.3.3 The DTF Method .......................................................................................................... 15

 3.3.4 Two years of explicit forecasts and a glide to the midpoint of the RBA’s target band. 16

 3.3.5 Market economists’ forecasts........................................................................................ 16

 3.4 Relative forecasting performance ......................................................................................... 16

 3.5 The RBA’s target inflation rate is the band, not its midpoint ............................................... 18

 3.6 The RBA’s May 2020 “Statement on Monetary Policy” ...................................................... 19

 3.7 Recommendations ................................................................................................................. 20

A Inflation forecasting methodologies applied by other regulators .................................................. 22

A.1 IPART (2014) ........................................................................................................................... 22

A.1.1 IPART’s 2014 guidance ........................................................................................................ 22

A.1.2 Inflation forecasting options assessed by IPART ................................................................. 22
Melbourne Water – Inflation forecasting
 methodology

A.1.3 IPART’s analysis .................................................................................................................. 23

A.2 AER (2017) ............................................................................................................................... 23

A.2.1 The AER’s analysis............................................................................................................... 24

A.2.2 AER’s conclusion ................................................................................................................. 25

A.3 QCA (2018) .............................................................................................................................. 25

A.3.1 Aurizon Network’s proposal ................................................................................................. 25

A.3.2 The QCA’s analysis .............................................................................................................. 25

A.3.3 QCA’s adopted methodology................................................................................................ 27

A.4 ESCOSA (2019)........................................................................................................................ 28

A.4.1 ESCOSA’s analysis .............................................................................................................. 28

A.4.2 ESCOSA’s (2019) conclusion .............................................................................................. 29

A.5 ESCOSA (2020)........................................................................................................................ 30

A.5.1 ESCOSA’s analysis .............................................................................................................. 30

A.5.2 ESCOSA’s (2020) conclusion .............................................................................................. 30

A.6 ERAWA (2019) ........................................................................................................................ 31

A.7 New Zealand Commerce Commission...................................................................................... 32

A.7.1 The NZCC’s approach .......................................................................................................... 32

A.7.2 NZCC 2016 review ............................................................................................................... 32

B. Empirical analysis of alternative inflation forecasting methods ................................................... 34

B.1 Alternative methods .................................................................................................................. 34

B.2 Inflation forecasts of market economists .................................................................................. 34

B.3 Victorian Department of Treasury and Finance (DTF) Method ............................................... 34

B.4 Market based measures ............................................................................................................. 35

B.5 AER Method ............................................................................................................................. 36
Melbourne Water – Inflation forecasting
 methodology

1. Executive Summary
The issue

Incenta Economic Consulting (Incenta) was engaged to advise Melbourne Water on the issue of the
inflation forecast that is used by the Essential Services Commission (ESC) as an input to determining
the allowance for the real cost of debt for the coming regulatory period.

We observe that if the forecast of inflation is higher (lower) than reasonable, then Melbourne Water
will be systematically undercompensated (overcompensated) for its trailing average debt costs. We
further note that a characteristic of the ESC’s approach to deriving debt costs is that an inflation
forecast over only the term of the regulatory period is required (i.e., 5 years) The ESC has proposed to
apply the Department of Treasury and Finance (DTF) inflation forecasts, and Melbourne Water has
asked Incenta to advise on the appropriateness of that approach relative to other alternatives that
might exist.

This is a matter of such concern to regulated businesses at the present time that the Essential Services
Commission of South Australia (ESCOSA) recently amended its stated policy on the matter, and the
Australian Energy Regulator (AER) has commenced a new review of inflation forecasting after
having determined its previous policy only in 2017.1

Treatment of Covid-19 in our advice

Melbourne Water’s new regulatory period will not commence until 1 July 2021, and so we assume
that the forecast that is applied will reflect the market conditions at the time. Accordingly, in this
advice, we do not address how to deal with the heightened difficulties with deriving a medium term
forecast of inflation at the present time. However, we do assume that the deflationary pressures that
had been present now for some time prior to the outbreak of Covid-19 continue to be present, and are
more likely than not stronger than was the case prior to Covid-19. Where we refer to “at present”, we
mean the market environment that existed just prior to the onset of Covid-19.

Available methods

In discussing alternative methods, we distinguish between short term (1 and 2-years) forecasts, and
medium-term forecasts (3 to 5 years). Medium-term forecasts present the greatest challenges as there
are few publicly available forecasts that extend from 3 to 5 years.2

We have identified the following four methods that have been applied (or proposed to be applied) to
forecast inflation:

• The DTF Method – This Victorian Department of Finance (DTF) determines 5-years ahead
 inflation forecasts of the Melbourne CPI each year for the Victorian budget, which it derives
 using an econometric model. We observe that DTF explicitly forecasts 2 years out then applies a
 2.5 per cent assumption (equivalent to the midpoint of the RBA band) to years 3 to 5.

1
 AER (7 April, 2020) Initiation Notice – Review of treatment of inflation 2020.
2
 The IMF publishes CPI forecasts for Australia. For example, IMF (6 February, 2020) Staff report for
 the Article IV Consultation.

 (1)
Melbourne Water – Inflation forecasting
 methodology

• Market instruments – these are:

 – The bond break even inflation rate (BBIR), which is the (Fisher effected) difference between
 nominal and CPI-linked government bond yields of the same term; and

 – Inflation swaps that are derivative instruments whereby parties exchange a fixed (nominal)
 cash flow stream for a variable (inflation linked cash flow stream).

• The AER Method – This method, which is applied by the AER and QCA uses the RBA’s 1 and
 2-year explicit forecasts and then assumes that inflation from years 3 onwards reverts to the
 midpoint of the of the RBA’s target band.

• Two years of explicit forecasts with glide path – ESCOSA and the NZCC also start with the first
 two years of the relevant central bank’s forecasts, but apply a glide path to link the explicit 2-year
 forecast and an assumed 5-year target level of inflation (the IMF forecast to 5 years in the former
 and the middle of the central bank’s target band in the case of the latter).

In contrast, regulators typically have not applied the forecasts of market economists as academic
research has found that the 1 and 2-year RBA forecasts are more informative. Moreover, market
economists rarely provide forecasts beyond 2 years and those that do are proprietary and hence lack
transparency.3

Assessment of the methods

Limitations of testing

We observe that one of the difficulties with deciding upon which is the best method for forecasting
inflation is that it is very difficult to conduct a reliable test of the accuracy of different methods. While
several Australian and New Zealand regulators have examined alternative inflation forecasting
methods and have sought to test the accuracy of different forecasting methods by comparing those
forecasts to the ex post outcomes, there are material limitations to the weight that one can apply to
those tests, and particularly in the current context.

• First, the fact that outturn inflation can vary dramatically due to exogenous shocks, means that an
 examination of inflation over a short period is uninformative, and a very long period of ex post
 observations is required in a period without major shocks in order to shed light on the efficacy of
 ex ante predictions.4 However, these results will only be relevant to the extent that the future
 market environment is expected to be materially the same as when the testing took place.

3
 Market instruments should be more informative than economist forecasts in the absence of risk premia
 and other possible biases in market prices. The issue that we draw attention to is that there is a strong
 opinion amongst commentators – which has some evidentiary support – that certain risk premia have
 been particularly pronounced in recent years, which makes these instruments less informative for
 deriving a forecast of inflation.

4
 A parallel difficulty faces researchers who estimate the market risk premium by looking at 50 to 100
 years of data.

 (2)
Melbourne Water – Inflation forecasting
 methodology

• Secondly, and related to the point above, the fact that we require a five-year forecast means that
 the most recent forecast that can be tested against the ex post outcomes is some distance in the
 past. Specifically, we are unable to test 5-year inflationary forecasts that were made after March
 2015, which means that such testing cannot be applied with respect to the more recent behaviour
 of inflation.5

Could market instruments be applied?

In principle, market instruments have a lot to offer as a means of forecasting inflation because they
reflect real market transactions (and hence information that is tested), can provide a contemporary
forecast, and could be a method that is straightforward to apply. For these reasons, regulators –
including the ORG / ESC – were initially attracted to market instrument-based estimates of future
inflation; however, all except the ERAWA have now discontinued using them. This is because of the
well-documented potential for material time varying inflation, liquidity and other premia /biases to
affect the prices of these market instruments.6

In our view, it would be difficult to have confidence in inflation forecasts derived from market
instruments until there is a better understanding of the materiality and / or quantification of these
premiums and biases. However, if there were empirical techniques developed that enabled a reliable
estimate of these biases – and hence their elimination from the inflation forecast – then a return to the
use of market instruments would be warranted.7

First two years – use of central bank forecasts

We observe that almost all of the regulators in Australia and New Zealand apply the relevant central
bank forecasts (i.e., Reserve Bank of Australia or Reserve Bank of New Zealand) for the term of those
forecasts, namely approximately 2 years. In our view, the continued use of central bank forecasts (and
RBA specifically) for the term of those forecasts remains best practice for the following reasons.

• First, the RBA’s short term (1 and 2-year) forecasts have performed relatively well and have been
 found to deliver superior forecasts to those of market economists.

• Secondly, the RBA is transparent as to the factors that it considers when preparing its inflation
 forecasts (which are released as part of its Monetary Policy Statement), and the RBA also has an
 ongoing research program focussed on testing and refining its empirical methods, which again has
 led to substantial public material.

5
 March 2015 is the last date at which 5-year forecasts applying the AER Method can be tested against
 outcomes for the 5 years up to March, 2020.
6
 There is a significant body of opinion that, in the current low inflation-rate environment, the inflation
 risk premium – which historically has raised the yield of nominal instruments (and so caused an
 upward bias to inflation forecasts, all else constant) – has switched direction, and for this reason all
 market instruments would be expected to under-forecast inflation at present.
7
 It would be particularly unwise to apply market instruments at a time of severe market dislocation such
 as in the Covid-19 world although, as we noted above, we do not address in this advice how to form a
 forecast in the midst of Covid-19.

 (3)
Melbourne Water – Inflation forecasting
 methodology

• Thirdly, the RBA’s forecasts are released quarterly in or around the end of the first week of May,
 August, November and February, and so there is generally a reasonably contemporaneous forecast
 available to coincide with a new regulatory period.

As discussed earlier, the DTF undertakes its own forecasting of inflation for the first two years,
although in practice the DTF forecasts have tended to be very close to those prepared by the RBA.
However, we prefer to use of the RBA inflation forecasts as the basis for the first two years for two
reasons.

• First, the DTF forecasts the Melbourne CPI whereas the appropriate indicator is the Australian
 (average of eight state capitals) CPI. Whilst these two indices move very closely together over the
 medium to long term, they can depart materially for shorter intervals.8

• Secondly, whilst the DTF contains some information about its approach to forecasting on its
 website, there is not anywhere near the same degree of transparency and continual development as
 exists in respect of the RBA’s forecasts.9

Forecasts for years 3 onwards10

As discussed above, the AER’s method when forecasting inflation has been to assume that inflation
reverts to the midpoint of the RBA target range from years 3 onwards. We observe that a key reason
for the AER adopting and remaining with this method is that it has performed very well historically,
and most notably from 1993 to 2010.

However, in recent years the RBA, researchers and other observers have commented on the lower
than expected inflation outcomes, which have remained largely below the bottom of the RBA’s target
inflation band. The RBA Governor, Dr Philip Lowe, has noted that in the current environment, the
RBA has less ability to affect the inflation rate using monetary policy. Inflation has remained low
partly because of relatively sluggish economic growth in the post global financial crisis economy. In
these circumstances it is questionable that the prevailing Australian regulatory assumption of a
relatively rapid reversion of inflation to the mid-point of the RBA’s target band can be sustained.11

In its letter to the AER, the RBA noted that assuming an instantaneous reversion to the middle of the
target band in year 3 would provide an inaccurate inflation estimate if there was a fundamental change
in inflationary expectations. In the ‘Overview’ of its 8 May 2020, Statement on Monetary Policy, the
RBA suggests that its baseline scenario is for inflation to remain “low” and “below 2 per cent for

8
 Over the past 20 years the outturn Melbourne CPI and Australian CPI have been almost identical,
 although there have been material variations in shorter (e.g., 5-year) periods.
9
 This is not intended as a criticism of the DTF, only a reflection of the fact that its forecasts are
 developed for a different purpose.
10
 As noted above, the context for which the ESC applies the inflation forecast means that a 5-year
 inflation forecast is required, although the methods employed by a number of other regulators implies
 that a 10 year forecast is needed.
11
 The RBA’s inflation target is to get inflation to within the target band (i.e., between 2 per cent and
 3 per cent) on average over the medium term. The RBA has no further authority to move inflation
 within the band (i.e., towards the midpoint). The RBNZ’s inflation target is slightly different in that it
 is required to pursue the midpoint of the band.

 (4)
Melbourne Water – Inflation forecasting
 methodology

some time,”12 and provides further analysis of market economists and unions that suggests reversion
to the lower part of its target band (2 to 2.5 percent) only over the “long-run” (6 to 10 years).

The RBA’s most recent, August 2020, Statement on Monetary Policy provides further updates of its
outlook for inflation over the next two years and beyond. Over the next two years to December 2021
and December 2022 the RBA’s forecast is for CPI increases of 1 per cent and 1.5 per cent
respectively.13 The RBA also reports that the 5-10 year CPI view of unions is approximately 2 per
cent, the outlook of market economists is approximately 2.25 per cent and the 6-10 year CPI forecast
of Consensus Economics is approximately 2.5 per cent.

The IMF has recently reviewed Australia’s monetary policy settings and forecasts, concluding that:14

 Monetary Policy has eased since mid-2019. The RBA cut the policy rate from 1.5 percent to
 0.75 percent in increments in June, July and October 2019, because of weaker than expected
 inflation and wage outcomes. It has indicated an accommodation bias, highlighting the need
 for an extended period of low interest rates to reach full employment and the inflation target.

Our view is that the views expressed by the RBA and IMF imply that over the “medium-term” (i.e.
over the next 3 to 5 years) inflation is most likely to approximate the lower bound of the RBA’s target
bound (2 per cent).

Recommendation

We recommend the following method be applied:

• The RBA’s explicit 1 and 2 year inflation forecasts be relied upon, as they have been found to be
 relatively accurate, and are subject to on-going research and scrutiny. While the DTF’s 1 and 2-
 year forecasts have provided a similar inflation forecast to the RBA, they are less transparent and
 estimate the Melbourne CPI rather than the Australia CPI.

• A more reasonable assumption about the medium-term horizon (years 3, 4 and 5) is that the RBA
 is able to achieve inflation outcomes near the lower bound of its target range (i.e. at 2 per cent).

• Hence, our recommendation based on the most current RBA Statement of Monetary Policy is as
 displayed in Table ES.1 below. The geometric mean of the series of forecasts is 1.64 per cent for
 the 5-year period starting January, 2021.

Table ES.1: Recommended CPI forecast at November, 2020 (5 years from January, 2021)

Calendar year 2021 2022 2023 2024 2025
Basis of estimate Geometric mean RBA RBA Bottom of RBA target band
CPI value 1.64% 1% 1.50% 2% 2% 2%

Source: Incenta based on latest RBA Statement of Monetary Policy

12
 RBA (8 May, 2020), Statement on Monetary Policy, p.5.
13
 RBA (August, 2020), Statement on Monetary Policy, Appendix: Forecasts.
14
 IMF (March 2020), Australia: 2019 Article IV Consultation – Press Release; Staff Report: and
 Statement by the Executive Director for Australia, p.8.

 (5)
Melbourne Water – Inflation forecasting
 methodology

• However, we also recommend that the assumption about the medium-term trend be kept under
 review up until the ESC prepares its final decision, and specifically we recommend a close
 reading of the current and future RBA Statements on Monetary Policy up to the time the decision
 is made and confirm that the recommended medium-term trend remains reasonable.

 – It is plausible that economic growth becomes sufficiently stimulated as a consequence of
 post Covid-19 measures that it becomes reasonable to assume that inflation reverts more
 quickly to the midpoint of the RBA target band.

 – However, a more likely scenario is that economic conditions worsen sufficiently that the RBA
 takes an extended period to stimulate inflation to the lower band (in which case a longer trend
 to the lower band may be more consistent with the RBA’s statements).

 (6)
Melbourne Water – Inflation forecasting
 methodology

2. Background and outline of report
2.1 The Brief
Melbourne Water engaged Incenta Economic Consulting (Incenta) to provide a report that would be
used to support Melbourne Water’s proposal to the Essential Services Commission (ESC) for an
appropriate methodology for forecasting inflation along the lines of the methodologies used by the
Australian Energy Regulator (AER), Independent Pricing and Regulatory Tribunal (IPART) or other
regulators.

The Project Brief required us to:

• Gain familiarisation with the ESC’s 2021 Guidance Paper to inform the context of the project;

• Identify and evaluate alternative inflation forecasting methodologies used in Australian regulatory
 jurisdictions; and,

• Recommend an appropriate deflator methodology that can be submitted to the ESC in support of
 Melbourne Water’s price submission.

The key focus of the report is to assess which methodology is most likely to deliver an accurate
inflation forecast, which would mitigate Melbourne Water’s risk.

2.2 Background and ESC’s previous inflation forecasting approach
Why inflation forecasts are important

Currently the ESC specifies a set of expected inflation rates in advance over Melbourne Water’s five-
year regulatory period, which are used to convert the nominal cost of debt that is derived under the
trailing average cost of debt method into a real cost of debt for use in the price submission. This
creates a risk that Melbourne Water may be required to apply a number that may not be the best,
unbiased forecast of inflation over the period. This is important because, under the ESC’s standard
revenue and price setting method, the actual return on debt that Melbourne Water receives will be
given by (ignoring the Fisher interaction term):

 Nominal cost of debt – ESC forecast of inflation + Actual inflation,

with the “actual inflation” component arising the indexation of prices / revenue and the Regulated
Asset Base (RAB). Thus, if the ESC forecast systematically overstates (understates) forecast inflation,
Melbourne Water will be systematically undercompensated (overcompensated) for its nominal trailing
average debt costs. Melbourne Water is seeking to mitigate that risk through the commissioning of
this report.

We note that some regulators (see Table 3.1 below) forecast inflation over a period of 10 years, while
others do so for the length of the regulatory period. Both approaches are correct for the purpose that
the inflation forecast is being applied. In Melbourne Water’s case the ESC applies the inflation
forecast in such a way that only a forecast to the end of the regulatory period is required (i.e. 5 years).

 (7)
Melbourne Water – Inflation forecasting
 methodology

The ESC’s previous inflation forecasting method

In the course of the ESC’s previous regulatory decision on Melbourne Water in 2016, the ESC applied
an inflation forecast of 2.20 per cent. The real risk free rate was calculated for the 40 day trading
period to 7 March 2016 based on what it termed “a paired bonds approach (using Commonwealth
Government inflation indexed bonds),” and “Forecast inflation was based on nominal bond rates
using the paired bond approach.”15

2.3 ESC’s Guidance Paper
The ESC has released a Guidance Paper for application of Melbourne Water’s 2021 price review,
which will be its first under the PREMO framework.16 The question of inflation forecasting is raised
at only a few points in the Guidance Paper:

• In section 3.8 at footnote 34 relating to the benchmark 10 year trailing average cost of debt the
 ESC states that it “will use a market based inflation estimate and specify the applicable inflation
 rate in the financial model.”

• In section 3.11 the ESC states that “the cost of debt is calculated in nominal terms then converted
 to real terms applying our inflation rate.”

• In section 3.21 the ESC states that:

 “The model will include a forecast inflation rate (based on the Victorian Department of
 Treasury and Finance inflation forecasts. The inflation rate will be used to estimate
 components of the regulatory rate of return (see section 3.8) and estimates for financial
 indicators (see section 3.20). We will use the latest forecasts for inflation.” [emphasis added]

These statements indicate that the ESC intends to apply the latest Victorian Department of Treasury
and Finance (DTF) inflation forecasts for the purpose of adjusting a nominal cost of debt to a real cost
equivalent.

2.4 Victorian Department of Treasury and Finance’s approach to inflation
 forecasting
The DTF website provides a high-level summary of the methodology that it uses to forecast inflation
for the purpose of informing its budget forecasts.17 In the “Consumer prices growth” section of that
document we learn that the approach has several components:18

 The trend value of consumer price growth is estimated to be (sic) correspond closely to the
 mid-point of the RBA’s inflation target band.

15
 Essential Services Commission (March 2016), Melbourne Water Price Review 2016, Draft Decision,
 p.64.
16
 Essential Services Commission (13 November, 2019), Melbourne Water’s 2021 water price review –
 Guidance paper.
17
 DTF (November, 2019), Method for making forecasts of macroeconomic indicators.
18
 DTF (November, 2019), p.11.

 (8)
Melbourne Water – Inflation forecasting
 methodology

 Method

 Headline inflation forecasts are developed using these CPI basket subsets. A combination of
 econometric modelling, extension of historical trends and judgement based on partial
 information underpin the forecasts.

 Inflation in market goods and services is forecast using an ordinary least squares
 econometric model. In the model, year-ended inflation in market goods and services is
 positively related to the inverse of the unemployment rate, an autoregressive term, inflation
 expectations, and a dummy variable to account for the introduction of the GST. Inflation is
 negatively related to the annual change in the unemployment rate.

 The remaining segment of the CPI basket, comprised of administered and other
 seasonal/volatile items, is forecast using a bottom-up approach based on historical trends
 and partial information, and informed by judgement of future trends and leading indicators.

 The headline inflation forecast for Victoria is based on the sum of the contributions to growth
 from inflation in market goods and services and the other seasonal/volatile items.
 Adjustments are made based on additional information such as recent movements in the value
 of the Australian dollar, developments in oil markets and relevant government policies.

Further in the document we find that inflationary expectations are derived as follows:19

 Inflation expectations are calculated as the difference between standard and indexed bond
 yields at a maturity of 10 years.

The summary explains that DTF uses an econometric model to forecast inflation, which includes
several explanatory variables including a measure of inflationary expectations based on the market-
based methodology that is commonly referred to as the “break-even” approach.

The DTF’s inflation forecasting approach formally described, however we have reviewed the DTF
inflation forecasts that have accompanied Victorian budget papers (see Appendix A). From the pattern
of explicit forecasts displayed in the budget papers we can surmise that the DTF has:

• Applied its modelling to determine explicit forecasts of CPI for the first two years; and

• Has then applied the middle of the RBA’s target inflation band (2.5 per cent) in years 3 to 5.

In principle, we conclude that the DTF inflation forecasting approach is similar to that applied by the
AER, except that it uses its own explicit inflation forecasts for the first two years (at least), rather than
applying the RBA’s explicit forecasts for that period.

2.5 Treatment of Covid-19 in our advice
We note that Melbourne Water’s new regulatory period will not commence until 1 July 2021, and
therefore assume that the forecast that is applied at that time will reflect those market conditions.
Hence, in the advice that we provide, we do not address how to deal with the heightened difficulties
with deriving a medium term forecast of inflation at the present uncertain time. We do however

19
 DTF (November, 2019), p.13.

 (9)
Melbourne Water – Inflation forecasting
 methodology

assume that the deflationary pressures that had been present for some time prior to the outbreak of the
current pandemic will continue to be present then, and are likely to be even stronger than was the case
prior to the pandemic. Therefore, when we refer to “at present” in this report we mean the market
environment that existed just prior to the onset of the Covid-19 pandemic.

2.6 Outline of report
Having provided some background and context to this report, the remainder of the report addresses
the next two tasks identified by the ESC, as follows:

• In section 3 we analyse several potential inflation forecasting methods; and

• Section 4 presents our recommendations.

Our appendixes present further detailed background and analysis that supports the main text:

• In Appendix A we summarise the analysis and conclusions of other regulators; and

• Appendix B reports our own empirical analysis comparing alternative inflation forecasting
 methods.

 (10)
Melbourne Water – Inflation forecasting
 methodology

3. Analysis of inflation forecasting methods applied by other
 regulators
3.1 Introduction
In recent years a number of regulators in Australia and New Zealand have addressed the question of
inflation forecasting. In this section we analyse the proposed DTF approach and several potential
methodologies that have been applied by other regulators.

3.2 Assessment criteria
In this section we analyse alternative inflation forecasting methods through the lens of several
desirable criteria:

• Accuracy – that is, accuracy in forecasting inflation over the coming regulatory period. This is a
 key objective in the case of Melbourne Water.

• Simplicity, transparency and replicability – these three characteristics of a workable inflation
 forecasting method are expected to be interrelated. That is, a simple and transparent method is
 also likely to be replicable.

• Robustness –a robust method will provide an estimate that is relatively insensitive to market
 phenomena. That is, it continues to operate reliably when the market is in different states (e.g.,
 market is subject to net inflationary or deflationary pressure) or is subject to material events (e.g.,
 the global financial crisis or a pandemic).

The ACCC / AER working paper examining this issue focussed attention on the objective of
providing “the best estimates of expected inflation”, as this was consistent with the National
Electricity Rules.20 It therefore placed considerable emphasis on congruence with market
expectations in its list of assessment criteria. Our first objective, accuracy, is a broader concept that is
tailored to the requirements of Melbourne Water.

3.3 Potential inflation forecasting methods
In this section we consider the major options that could be applied to Melbourne Water, including the
approach that has been proposed by the ESC, which is to use the forecasts that the Victorian
Department of Finance (DTF) uses in preparing the Victorian budget.

A summary of the methods applied by regulators in shown in Table 3.1 below, while a detailed
description of the analysis undertaken by regulators is contained in Appendix A. In the table we find
that three regulators apply what we term “the AER Method” (AER, QCA and IPART), which adopts
the first 2 years of the RBA explicit forecasts and moves immediately to the middle of the RBA’s
target band thereafter. In 2019 ESCOSA adopted a modified version of the AER Method but has since
modified this to include a glide path approach, similar to what has been applied for several years by

20
 ACCC / AER (2017), p.7. The National Electricity Rules (NER) 6.4.2 (b)(1) states that the contents of
 the post-tax revenue model must include as a minimum “a method that the AER determines is likely to
 result in the best estimates of expected inflation.”

 (11)
Melbourne Water – Inflation forecasting
 methodology

the NZCC. Only the ERAWA has continued to apply the BBIR Method. Due to the concerns of
stakeholders in the current uncertain environment, the AER has announced a fresh review of its
inflation approach.21

Table 3.1: Summary of regulator inflation forecasting methodologies

 Geometric average of RBA explicit Geometric average of RBA Geometric average of RBA Break-even rate Glide path to middle of target Period over which expected
 forecast for 2 years and middle of RBA explicit forecast for 1 year forecast for 2 years, g;idepath to inflation range (2% in New inflation to be estimated
 target band (2.5% ) thereafter and middle of RBA target IMF forecast at 2024 (years 3-5) Zealand)
 band (2.5% ) thereafter middle of RBA target band (2.5% )
 thereafter

 IPART 10 years
 AER 10 years
 QCA Length of regulatory period
 ESCOSA (2019) ESCOSA (2020) 10 years

 ERAWA Length of regulatory period

 NZCC Length of regulatory period

Source: Regulator decisions and guidance papers

3.3.1 Market instruments
During the 1990s and the 2000s up to the global financial crisis (2008/09) regulators like the ACCC
and AER were attracted to the bonds breakeven inflation rate (BBIR) as an inflation forecasting
method as it held many attractions. An inflation swaps market began to develop just prior to the
global financial crisis

Bond breakeven inflation rate (BBIR)

The BBIR reflects the market’s expectations with respect to inflation, as inferred from the (Fisher
effected) differential between nominal government bonds and CPI-indexed government bonds for a
given term to maturity. BBIR-implied inflation at a term of 10 years was adopted by several
Australian regulators in the 1990s and was then widely used in commerce and finance as the
long- term inflation estimate.

We agree with the AER that whilst the BBIR method would achieve several of our evaluation criteria,
since it a reflection of market opinions, is simple, replicable and transparent, it also suffers from
numerous data and theoretical issues. As discussed more fully in Appendix A, there are a number of
time varying biases and premiums that have been well documented in the literature, which suggest a
likely material but unquantifiable under-estimation of inflationary expectations using the BBIR
method. In particular:

• The inflation premium – nominal bond holders normally require a higher return for bearing
 inflation risk so the differential with CPI-indexed bonds (the BBIR) will normally over-estimate

21
 AER (7 April, 2020)

 (12)
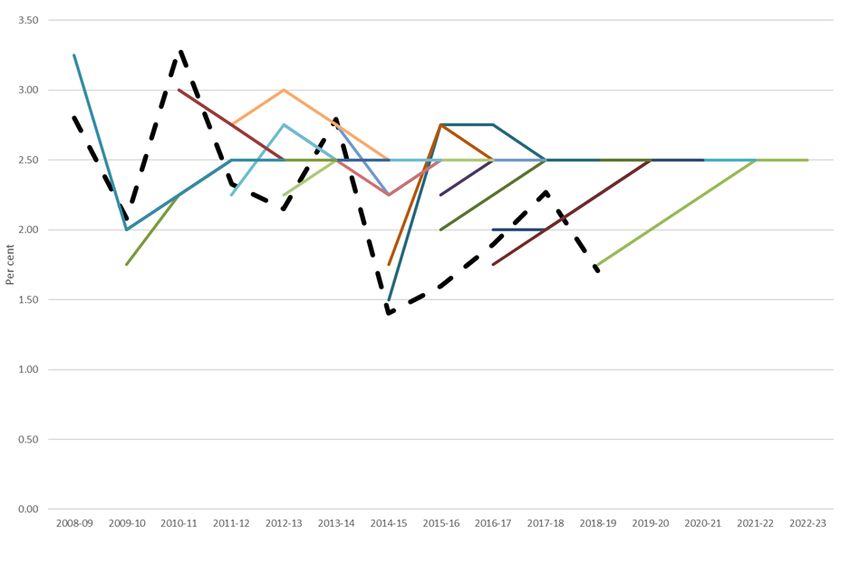
Melbourne Water – Inflation forecasting
 methodology

 inflation, however in recent years inflation has been so low that this premium is likely to be
 negative,22 which implies that BBIR will under-estimate the market’s inflationary expectations.

• The liquidity premium – because CPI-linked bonds are far fewer in value and much less traded
 than nominal bonds, the CPI-linked bonds are relatively less liquid, which would cause investors
 to require a higher yield, and would imply that the BBIR will under-estimate the market’s
 inflationary expectations.

Inflation swaps

Like the BBIR method, estimating inflation from swaps has a number of advantages against our
criteria. This method reflects market opinions, is simple, replicable and transparent, and as a
derivative instrument it suffers from data issues than the BBIR. However, it is likely that in recent
years a negative inflation risk premium has materially impacted swaps, which would result in an
under-estimate of the market’s inflationary expectations. For example, the European Central Bank
(ECB) has estimated that for 5 year swaps, relative to January 2014 only up to 20 basis points of the
80 basis point decline to June 2019 represented an actual decline in inflationary expectations over that
period, with the rest of the decline being due to a fall in the inflation risk premium.23

Figure 3.1: 5-year inflation forecast – BBIR vs inflation swaps

22
 That is, investors have more recently become concerned about deflation and a happy to have the
 inflation exposure of nominal bonds.
23
 Benoit Coeure (11 July, 2019), Inflationary expectations and the conduct of monetary policy, Speech
 by Benoit Coeure, Member of the Executive Board of the ECB, at an event organised by the SAFE
 Policy Center, Frankfurt am Main, 11 July 2019.

 (13)
Melbourne Water – Inflation forecasting
 methodology

Source: Bloomberg

Another problem that relates to all market instruments, is that in periods of extreme market distress,
such as the global financial crisis of 2008-09 or the current pandemic period, the BBIR and swap-
based estimates have been demonstrated to provide less supportable estimates of future inflation. As
seen in Figure 3.1 above, the current outlook for inflation over 5 years based on market instruments is
approximately 0.5 per cent (swaps) and approximately 0.25 per cent (BBIR), both of which are not
substantiated by broad market opinion. As the RBA’s recent Statement on Monetary Policy notes:24

 Both short- and long-term market-based measures of inflation expectations have declined
 since the widespread outbreak of COVID-19 in early 2020; however, it is difficult to interpret
 the magnitude of these declines because functioning in these markets has been significantly
 impaired recently.

To summarise, while we think that market measures of inflationary expectations have promise, it
would be difficult to use them to forecast inflation in the absence of better investigation and
understanding of the materiality of the biases and premiums that apply. In addition, an assumption
that these instruments would reflect an unbiased view of inflation expectations is subject to even more
criticism when material market disruptive events arise.

3.3.2 The AER Method
The AER Method is discussed in some detail in Appendix A below, and has been used or advocated
by the AER, IPART, the QCA and ESCOSA (2019). The method breaks the inflation forecasting
issue into two parts:

• Years 1 and 2: use the explicit inflation forecasts published quarterly by the RBA in its Monetary
 Policy Review.

• Beyond 2 years: assume that from year 3 there is an immediate reversion to the mid-point of the
 RBA’s target inflation band (2.5 per cent).

As discussed in Appendix A, and in section 3.4 below, there are relatively small differences between
the 1 and 2-year inflation forecasts that are made by the RBA, DTF and market economists.
Whichever one of these approaches were adopted for years 1 and 2 it would make relatively little
difference to the overall inflation forecast over 5 years.

In the case of Melbourne Water, what is assumed for years 3 to 5 is of greater materiality. The AER
Method’s immediate reversion to the midpoint of the RBA target band has resulted in material
forecasting error over the past 5 years. As it undertook its review of this issue in 2017, the AER
received a letter from the RBA titled “RE: Regulatory treatment of inflation – inflation
expectations.”25 The RBA noted that since it had “adopted inflation targeting in the early 1990s,
long- term inflation expectations have been anchored in line with the Bank’s target,” however:26

24
 RBA (May, 2020), Statement on Monetary Policy, p.85.
25
 RBA (5 July, 2017), RE: Regulatory treatment of inflation – inflation expectations.
26
 RBA (5 July, 2017), p.2.

 (14)
Melbourne Water – Inflation forecasting
 methodology

 If actual long-term inflation expectations were to move notably for a sustained period, it
 would not be valid to use the Bank’s target as a proxy.

More recently, in view of the persistently low inflation, the Economics Committee of the House of
Representatives asked the Governor of the RBA, Dr. Philip Lowe, how the RBA could effectively
meet the inflation target over the next few years. The committee reported his response as follows:27

 The governor advised that ‘you'd have to have much lower interest rates to get inflation up.
 It's just not practical at the moment to get inflation back to 2½ per cent in two years time or
 18 months’ time with monetary policy.’ The Governor explained that this is an issue being
 faced around the world:

 This is why I've got this focus very much on the medium term— getting there gradually over
 time. We've got to be realistic about what can be achieved with our instrument in a world
 where the relationship between unemployment and inflation is much weaker than it once was.
 We're seeing this in every country around the world. There are countries with unemployment
 at its lowest in 40 or 50 years and inflation is still not picking up. So, something's changed in
 inflation dynamics around the world, and the same is true in Australia, and we can't really
 hide from that.

The IMF has recently reviewed Australia’s monetary policy settings and forecasts, concluding that:28

 Monetary Policy has eased since mid-2019. The RBA cut the policy rate from 1.5 percent to
 0.75 percent in increments in June, July and October 2019, because of weaker than expected
 inflation and wage outcomes. It has indicated an accommodation bias, highlighting the need
 for an extended period of low interest rates to reach full employment and the inflation target.

We interpret these statements by RBA and IMF staff to suggest that in the medium term (3 to 5 years)
adopting an inflation estimate of 2 per cent (the lower bound of the RBA’s target range) rather than
2.5 per cent (the middle of the band) is prudent and realistic.29 In our view the progress of the Covid-
19 pandemic further reinforces the reasonableness of such a target, as it potentially heralds a sustained
period of low economic growth, relatively low interest rates and relatively low inflation.

3.3.3 The DTF Method
As described in more detail in Appendix A, the DTF Method in most cases applies the DTF’s own
explicit forecasts of Melbourne CPI for 1 and 2 years out, and then applies the middle of the RBA’s
target range (2.5 per cent). In this way, the method is very similar in principle to the RBA Method,
and we show in Appendix A and section 3.4 below, that they would have provided an almost identical
outcome had they both been applied late in 2014. Both methods would have over-estimated actual
inflation over the 5 years following from 2015.

27
 House of Representatives Standing Committee on Economics (March 2020), Review of the Reserve
 Bank of Australia Annual Report 2019 (First Report), p.11.
28
 IMF (March 2020), Australia: 2019 Article IV Consultation – Press Release; Staff Report: and
 Statement by the Executive Director for Australia, p.8.
29
 We would still consider the middle of the RBA’s target range of 2 to 3 per cent inflation to be a
 reasonable longer term (10 year) assumption.

 (15)
Melbourne Water – Inflation forecasting
 methodology

Our view is that while the DTF’s forecasts over 1 and 2 years are reasonable estimates, and relatively
close to those made by market economists (Surveys) and the RBA, they are not subject to the same
level of market scrutiny as the RBA forecasts. The fact that the DTF’s CPI forecasts target the wrong
index, the Melbourne CPI rather than the Australian CPI, is another reason for not using them.30

In addition, the second leg of the DTF Method, which relates to applying the midpoint of the RBA’s
target band in years 3, 4 and 5 is subject to the same criticisms that have been outlined above in
relation to the AER Method. Finally, there may be occasions on which the DTF’s forecasts are
delayed due to a delay in the Victorian budget.

3.3.4 Two years of explicit forecasts and a glide to the midpoint of the RBA’s
 target band.
In Australasia the glidepath approach was first introduced by the New Zealand Commerce
Commission (NZCC), which has applied 2 years of explicit inflation forecasts sourced from the
Reserve Bank of New Zealand (RBNZ), and then a glide path to the RBNZ’s inflation target of 2 per
cent over the remainder of the regulatory period. In addition, the NZCC analyses contemporaneous
market economist forecasts for 2 years to test that they generally conform with the RBNZ view. A
similar approach has recently been advocated by ESCOSA (2020), which has proposed a glide from
the RBA’s year-2 forecast to the year 5 forecast of the International Monetary Fund (IMF), which is
currently 2.5 per cent.

Our view is that in present market conditions a glide-path approach along the lines applied in New
Zealand or as now proposed by ESCOSA will improve the matching of inflation expectation targets
with the pronouncements of the RBA and central bankers elsewhere in the world. However, a glide to
the middle of the RBA’s target band during years 3, 4 and 5 does not appear to us to be fully
consistent with the RBA’s views. Our reading of the RBA’s view is that it would be unlikely to reach
the middle of the target band over that time horizon, although it would be more likely to be able to do
so over 10 years.

3.3.5 Market economists’ forecasts
No regulator has adopted market economists’ forecasts of inflation, owing to the fact that they are
generally not publicly available for periods longer than 2 years, which makes it difficult to ensure
transparency and replicability. In addition, it has been found that market economists’ forecasts of 1
and 2-year inflation have not outperformed those of the RBA.

3.4 Relative forecasting performance
When examining alternative inflation forecasting methods regulators have often applied ex post
testing of outturn inflation against those forecasts for matched periods. However, we note that such
testing is not very informative since outturn inflation over a relatively short period of time can vary
dramatically due to exogenous shocks that were not foreshadowed in the market’s expectations.
Hence, a very long period of ex post observations would be necessary to determine whether ex ante

30
 We note that the Melbourne CPI is not the wrong index to apply when forecasting the Victorian
 budget, which is the purpose for which the DTF derives it.

 (16)
Melbourne Water – Inflation forecasting
 methodology

predictions were on average biased in some direction. This is similar to the issue that faces researchers
trying to estimate the market risk premium by examining returns data over a period of 50 to 100 years.

In addition, we are not able to test 5-year inflationary forecasts that were made after March 2015,
which means that ex post testing cannot be applied to explain the more recent behaviour of inflation
except at shorter intervals than 5 years.31 This is precisely the period that is most at issue, since there
is evidence that some of the fall in medium term (5 year) inflation expectations implied by market
instruments during this period is likely due to a negative inflation risk premium rather than due to a
fall in actual inflation expectations.

Table 3.2 below shows the outturn inflation over the last 5 years compared to the forecasts that would
have been made applying alternative methods as at, 30 June, 2014.32 We have not included an “AER
glide path” method as the year 2 RBA forecast was already 2.5 per cent. In our view these results
show that:

• Every method displayed in the table would have over-estimated (by 87-97 basis points) the low
 outturn inflation (1.58 per cent) that occurred over the next 5 years.

• Inflation swaps would have achieved a closer matching to actual inflation had forecasts been
 made 6 months later, but that better matching would likely have been due to a falling (negative)
 inflation risk premium that resulted in an under-estimate of the true market inflation expectations
 at the time.

• The three methods that assumed an immediate jump to the mid-point of the RBA’s target range at
 year 3 (AER, DTF and Survey) and the “AER with glide path” method provided very similar
 outcomes, and over-estimated inflation by similar amounts, with the DTF Method marginally
 closer to the actual.33 This is partly because the overall outcome for all of those methods would be
 dominated by the assumption of a 2.5 per cent inflation rate in years 3 to 5.34

Table 3.2: Outturn inflation since 2015 and 5-year ahead inflation forecasts as at, June 2014,
using alternative forecasting methods

Forecast at 30 June 2014 for year ending: RBA DTF Survey (economists) Inflation Swaps Actual CPI
30 June 2015 2.75% 2.25% 2.60% 2.31% 1.51%
30 June 2016 2.50% 2.50% 2.70% 2.46% 1.02%
30 June 2017 2.50% 2.50% 2.50% 2.53% 1.93%
30 June 2018 2.50% 2.50% 2.50% 2.59% 2.08%
30 June 2019 2.50% 2.50% 2.50% 2.67% 1.59%
Geometric mean 2.55% 2.45% 2.56% 2.51% 1.58%

31
 At this time March 2015 would be the last date at which 5-year forecasts applying the AER Method
 can be tested against outcomes for the 5 years up to March, 2020. We have restricted our consideration
 to December 2019 in or to avoid the March 2020 quarter, which includes the effects of the Covid-19
 pandemic.
32
 We have used June 2014, as a DTF forecast was available at that time, and could be matched to the
 other methods.
33
 In Appendix B we show that the DTF Method provides very similar 1 and 2-year inflation estimates to
 both surveys and the RBA.
34
 For the same reason, a glide path approach is likely to provide almost the same result as an immediate
 jump to 2.5 Per cent.

 (17)
Melbourne Water – Inflation forecasting
 methodology

Source: Bloomberg, RBA and Incenta analysis

Further details regarding the ex post performance of potential inflation forecasting Appendix B.

3.5 The RBA’s target inflation rate is the band, not its midpoint
If the Australia-based non-market inflation forecasting methods outlined above assume that inflation
for each of the remaining years (3, 4 and 5) be assumed to be 2.5 per cent (middle of the RBA’s target
inflation band), it is this assumption that dominates the outcome.35 The AER Method applies a 2.5 per
cent inflation as if this is the target that the RBA seeks to achieve with its monetary policy. However,
the RBA’s website indicates that this not the case:36

 The Governor and the Treasurer have agreed that the appropriate target for monetary policy
 in Australia is to achieve an inflation rate of 2-3 per cent, on average, over time. This is a
 rate of inflation sufficiently low that it does not materially distort decisions in the community.
 Seeking this rate, on average, provides discipline for monetary policy decision-making, and
 serves as an anchor for private-sector inflation expectations.

 The inflation target is defined as a medium-term average rather than as a rate (or band of
 rates) that must be held at all times. This formulation allows for the inevitable uncertainties
 that are involved in forecasting, and lags in the effects of monetary policy on the economy.
 Experience in Australia and elsewhere has shown that inflation is difficult to fine-tune within
 a narrow band. The inflation target is also, necessarily forward-looking. This approach
 allows a role for monetary policy in dampening the fluctuations in output over the course of
 the cycle. When aggregate demand in the economy is weak, for example, inflationary
 pressures are likely to be diminished and monetary policy can be eased, which will give a
 short-term stimulus to economic activity.

The RBA never mentions a target 2.5 percent inflation rate and suggests that such a target would be
neither achievable nor desirable. Instead, the target is a broad range of 2 per cent to 3 per cent,
implying that monetary policy would let the economy run its course on either side of 2.5 per cent as
long as it remains within the band. In this way, we could expect the RBA not to intervene if the
inflation rate stayed at approximately 2 per cent (or 3 per cent) for a number of years.

In contrast to the RBA’s stated policy, the Reserve Bank of New Zealand (RBNZ) does apply an
explicit inflation target (of 2 per cent) within a target range. In a recent letter the RBNZ stated that its
“operational objective” is to:37

 Keep future annual inflation between 1 and 3 percent over the medium term, with a focus on
 keeping future inflation near the 2 percent mid-point.

35
 That is, differences in the methods used to obtain the years 1 and 2 forecasts are not as important, and
 the geometric average inflation rate over 5 years (and even more over 10 years) remains close to 2.5
 per cent. In the case of ESCOSA’s new method there is a glide path to the IMF’s 5-year inflation
 forecast, which is currently 2.5 per cent.
36
 See https://www.rba.gov.au/monetary-policy/inflation-target.html
37
 Minister of Finance and Governor of the RBNZ (14 February, 2019), Letter - The remit for the
 Monetary Policy Committee, Reserve Bank of New Zealand.

 (18)
You can also read