Games 2019 - Sports Destination Management
←
→
Page content transcription
If your browser does not render page correctly, please read the page content below

Methodology
Market sizing & forecasts
Key global trends
Newzoo’s Gamer SegmentationTM
Top 35 companies

    Global
    games
    market report

                                 FREE
                                VERSION

                                2019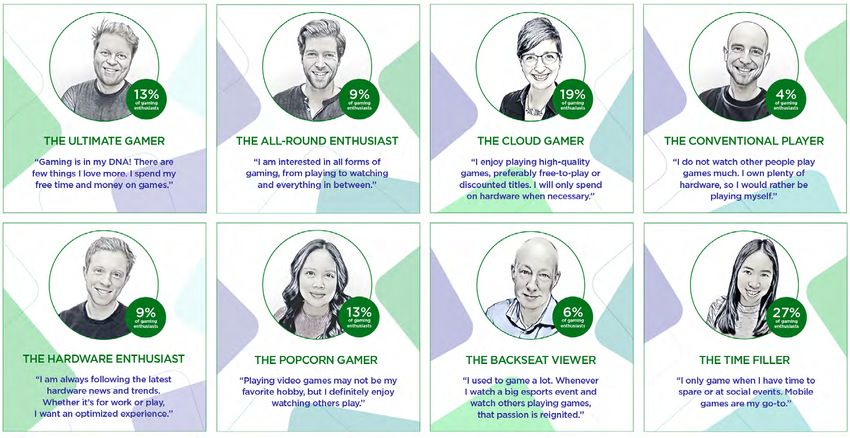
TABLE OF
                                                                                                                CONTENTS

                                                                                                2.                 4.               10.
                                                                                                FOREWORD           1. METHODOLOGY   2. THE GLOBAL
                                                                                                                   & TERMINOLOGY    GAMES MARKET

                                                                                                16.                22.              26.
                                                                                                3. KEY GLOBAL      4. SPECIAL       5. RANKINGS
                                                                                                TRENDS             FOCUS TOPICS

                                                                                                28.                33.
                                                                                                6. REGIONAL        ABOUT NEWZOO
                                                                                                OVERVIEW
          FREE 31-PAGE    FULL 130-PAGE
                                                                         COVER © SHUTTERSTOCK

          VERSION         VERSION
 FREE

                          $7500
VERSION

                     INCLUDES QUARTERLY UPDATES & DASHBOARD ACCESS
                      SUBSCRIBE: NEWZOO.COM/GLOBAL-GAMES-MARKET-REPORT

                                                                            ©2019 Newzoo                                              GLOBAL GAMES MARKET REPORT 2019   1
FOREWORD

    FOREWORD
    N E WZO O ’ S 2 019 G LO BAL GAM ES M ARK E T
    RE PO RT: CO N T E N T I S K I NG

    We are proud to present our 2019 Global Games Market Report. Now more than ever,                           mobile gaming. The only thing that will matter is which services
    gaming is at the heart of the entertainment business. The way consumers engage with                        offer the best gaming experiences and content.
    and through games is continually changing. Not only does this result in more overall                        The meteoric success of gaming is too impactful for brands
    engagement, but it also leads to entirely new segments of game enthusiasts.                                to ignore, with more and more huge names, including Google
     Brands from every corner of the consumer-facing market are seizing the opportunity                        and Netflix, choosing to enter the fray. Google announced its
    that gaming presents, especially when it comes to reaching younger generations. In the                     biggest move into gaming in March 2019 when it unveiled Google
    last decade alone, the years-long stigma against gamers has all but disappeared. What’s                    Stadia to the world, as well as the establishment of its own game
    more, the past year has seen many brands—including the biggest companies in apparel,                       studio. It will leverage YouTube’s massive user base to drive
    automotive, and even financial services—connect with gaming in bigger and better ways                      Stadia’s success, combining both video and interactive gaming
    than ever before.                                                                                          content. Meanwhile, Samsung partnered with Hatch to launch
     Gaming’s rise to the mainstream, particularly its shift toward more live events, profes-                  a 5G-powered game streaming service in the U.S., and Apple
    sional athletes, and entertainment spectacles, presents new crossover opportunities for                    is testing the waters for its new premium games subscription
    other sectors within the entertainment business. After all, more than 10 million enthu-                    service, Apple Arcade.
    siasts tuned in when the popular DJ Marshmello hosted a concert within the virtual                          At the same time, the mainstream spotlight also attracts the
    world of Fortnite. This year marks the first time that Netflix had a presence at E3, the                   public eye. New models of content monetization, pioneered by
    world’s largest gaming event for consumers. What’s more, popular game IP is increas-                       games, have drawn criticism from the community and politicians
    ingly being adapted for television, and the biggest games rival Hollywood in terms of                      alike. The nine-month freeze on game licenses in China last year
    grandeur, budget, narrative, and revenues.                                                                 was perhaps the most impactful consequence. The domestic
     Business models from general entertainment and games are also becoming intertwined.                       market is well on the road to recovery, but it has certainly taken
    Subscription-based distribution is now the de facto method of content consumption for                      a hit, albeit temporarily. In-game monetization is now the norm
    music and TV, and gaming is increasingly embracing the model. However, content is still                    in the most profitable games, even more so when subscriptions
    king and lies at the heart of any successful subscription service. This is why we foresee                  start to substitute the traditional paid game business model.
    a content gold rush going forward, as companies vie for the rights to lucrative gaming                     For publishers, finding the right mix of business models in an
    IP. The promise of cloud gaming—allowing players to play any game anywhere, anytime,                       extremely dynamic market, with pressure from politics and a          PETER WARMAN
    on any platform—brings us into a platform-agnostic future. In this future, we will no                      diverse game enthusiast community, will be the biggest challenge      CEO, Newzoo
    longer argue about what’s the best console, nor the differences between PC, console, and                   in the coming years.

2   © NEWZOO 2019 GET THE FULL REPORT: NEWZOO.COM/GLOBAL-GAMES-MARKET-REPORT                    ©2019 Newzoo                                                                          GLOBAL GAMES MARKET REPORT 2019   3
METHODOLOGY & TERMINOLOGY

                                                                                          METHODOLOGY
                                                                                          SIZIN G THE MA R KET WITH A VA R IETY O F DATA

                                                                                          Newzoo aims to provide clients with the best possible assessment of the size of the
                                                                                          overall games market, broken down into segments and regions. By developing many
                                                                                          data points, we ensure that our numbers make sense on a segment, regional, and
                                                                                          individual country/market level. Below, we describe our approach in more detail to

       1.
                                                                                          help clients understand what underpins our forecasts, facilitating comparisons with
                                                                                          other data sources.

                                                                                          At the highest level, Newzoo focuses on three key metrics for every market: players,
                                                                                          payers, and revenues.
                                                                                           The data on players and payers is mainly based on our own primary consumer
        METHODOLOGY                                                                       research, which continues to form the basis of our understanding of consumers and

        & TERMINOLOGY                                                                     games. In our primary consumer research, conducted from February to March 2019,
                                                                                          more than 62,500 invite-only respondents across 30 key countries/markets were sur-
                                                                                          veyed. The 30 countries/markets together represent more than 90% of global game
                                                                                          revenues. Respondents were carefully selected to represent the online population in
                                                                                          developed countries and the urban online population in selected major cities in emerg-
                                                                                          ing countries in Southeast Asia, Turkey, Saudi Arabia, and India. This research started
                                                                                          in 2009 with six countries; now, it is the world’s largest games-related consumer
                                                                                          research program.
                                                                                           The player and payer ratios resulting from our consumer research are projected
                                                                                          against the online population, using UN population and ITU internet penetration
                                                                                          metrics. The logic behind the model is that the online population is an important
                                                                                          driver of the number of potential gamers and an indicator of how much more struc-
                                                                                          tural growth a country can expect in its potential gamer population.
                                                                                           The differences between the player and payer numbers in the Global Games Market
                                                                                          Report and our Consumer Insights stem from the use of age boundaries and the core
                                                                                          city approach; that is, including only Tier 1 and 2 cities in Asia and the Middle East.
                                                                                          In the Global Games Market Report, the total population is considered, while our
                                                                                          Consumer Insights use the population aged between 10 and 50 or 65 years to best rep-
                                                                                          resent the online urban population in most countries.
                                                                                           The revenue data comes from our predictive games market model, which uses a top-
                                                                                          down approach to market sizing. We incorporate macroeconomic and census data
                                                                                          from the IMF and UN, such as household income and GDP per capita, transactional
                                                                                          and app store revenue data from our data partner Priori Data, our primary consumer
                                                                                          research, detailed financial information reported by more than 100 public companies,
                                                                                          and third-party research. We also receive valuable input from clients.

© NEWZOO 2019 GET THE FULL REPORT: NEWZOO.COM/GLOBAL-GAMES-MARKET-REPORT   ©2019 Newzoo                                                                            GLOBAL GAMES MARKET REPORT 2019   5
METHODOLOGY & TERMINOLOGY                                                                                                                                                                                                   METHODOLOGY & TERMINOLOGY

              Market size estimates and growth forecasts for individual segments, countries, and
                                                                                                                       GLOBAL FINANCIAL COMPANY ANALYSIS
            in aggregate for the total industry are validated against our analysis of various contex-
                                                                                                                       Game revenues of public and non-public companies
            tual metrics. For instance, our market model calculates the average annual spend per
            paying gamer, which is then compared with historical numbers, other regions, house-
            hold income, and GDP per capita.

                                                                                                                                                                                        SHARE OF PAYING PLAYERS (%)
                                                                                                                       POPULATION & ECONOMIC CENSUS DATA
              Our historical revenues and growth rates reflect the year-end US$ exchange rate.                                                                                                                          PLAYERS (#)
                                                                                                                       Projecting organic growth on a local and global scale
            Our projected growth rates assume steady exchange rates going forward, but we take
            into consideration historical growth rates in local currency rather than US$, as this
            gives a better picture of underlying growth.                                                               PRIMARY CONSUMER RESEARCH IN KEY COUNTRIES
              We define revenues as the amount the industry generates in consumer spending                             Understanding playing and spending behavior
                                                                                                                                                                               GLOBAL
            on games; physical and digital full-game copies, in-game spending, and subscription                                                                                GAMES
            services like PlayStation Plus and Xbox Game Pass. Mobile revenues include paid                                                                                    MARKET
            downloads and in-game spending on all stores, including third-party stores, and from                                                                               MODEL

                                                                                                                                                                                                                                           AVG. SPEND/PAYING PLAYER ($)
                                                                                                                       PARTNER DATA                                                                                     PAYERS (#)

            direct downloads. Our revenue numbers exclude taxes, consumer-to-consumer second-                          Actual download, revenue, and play time
            hand trade, advertising revenues earned in and around games, (peripheral) hardware,
            business-to-business services, and the traditionally regulated online gambling and
            betting industry (e.g., BWIN and William Hill).                                                            LOCAL DATA VALIDATION
              In terms of countries and regions, we define the market size as the amount com-                          With commercial companies in specific countries
            panies generate from consumers in that specific territory, as opposed to the amount
            companies based in a particular territory generate worldwide.                                                                                                                                                MONEY (#)

              The broader conceptual framework supporting our forecasts consists of the expected                       THIRD-PARTY RESEARCH

            growth of the online population plus the expected development of the key market                            Reported on a local and global scale

            indicators per region, as illustrated on the right. Overall, our forecasts are always the
            outcome of an iterative process, reviewing the implications of our assumptions on a
            very granular level. During this process, we rely on quantifiable metrics, such as his-
            torical growth rates, and include hard-to-quantify metrics, such as (gaming) culture,
            spending behavior, and other societal factors.

 6          © NEWZOO 2019 GET THE FULL REPORT: NEWZOO.COM/GLOBAL-GAMES-MARKET-REPORT                    ©2019 Newzoo                                                                                                  GLOBAL GAMES MARKET REPORT 2019                     7
METHODOLOGY & TERMINOLOGY                                                                                                                                                                               METHODOLOGY & TERMINOLOGY

            TERMINOLOGY
            D E F I N I T I O N O F M A I N TE RM S

            Augmented reality (AR): A technology that supplements real-life views of users with                         Game revenues: Consumer revenues generated by companies in the global games
            computer-generated sensory input as images or sounds.                                                       market, excluding hardware sales, tax, business-to-business services, advertising, and
                                                                                                                        online gambling and betting revenues.
            Boxed revenues: Revenues generated by the sales of games or game-related content
            delivered on physical storage media (i.e., discs or cartridges). Also includes physical                     Gamer personas: A new way of segmenting game enthusiasts across their playing,
            copies ordered in online stores.                                                                            viewing, and owning behavior. Please refer to the Special Focus Topic (page 23) to find
                                                                                                                        the definition of each persona.
            Browser PC games: Games played on casual game websites or social networks.
                                                                                                                        Games as a service: Also known as GaaS, games as a service provides game content or
            Cloud gaming: Also referred to as gaming on demand, cloud gaming is the ability to                          access to games on a continuous revenue model; for example, via a game subscription
            play a game on any device without owning the physical hardware required to process it                       service or a season/battle pass.
            or needing a local copy of the game itself.
                                                                                                                        Smartphone games: Games played on smartphones.
            Compound annual growth rate (CAGR): The constant growth rate over a period of
            years. In this report, all CAGRs are based on the years 2018-2022.                                          Online population: All people within a country/market or region who have access to the
                                                                                                                        internet via a computer or mobile device.
            Console games: Games played on a TV screen directly or through a console, such as Xbox,
            PlayStation, and Nintendo, or on handheld devices, such as a Nintendo DS or PS Vita.                        Payers or paying gamers: All people who have spent money to play games on a PC,
                                                                                                                        console, or mobile device.
            Digital revenues: Revenues generated by the sales of games or game-related content
            purchased directly from an online store, without a physical product being delivered.                        Pay-to-play (P2P) games: Games that must be paid for upfront or are paid subscription-
            Digital revenues include in-game purchases, subscription revenues, and any additional                       based games.
            downloadable content (DLC).
                                                                                                                        Peripherals: Gaming-related hardware products that are used for gaming, such as
            Downloaded/Boxed PC games: PC games downloaded from websites or services (e.g.,                             gaming mice, keyboards, headsets, controllers, or monitors.
            Steam or Epic Games Store) or purchased as a boxed product (CD/DVD), including client
            MMO and MOBA games.                                                                                         Players or gamers: All people who play (digital) games on a PC, console, or mobile device.

            Esports: Competitive gaming at a professional level and in an organized format (a                           Spend per payer: Annual average revenue generated per payer (game revenues/payers).
            tournament or league) with a specific goal (i.e., winning a champion title or prize money)
            and a clear distinction between players and teams that are competing against each other.                    Tablet games: Games played on a tablet (e.g., iPad).

            Free-to-play (F2P) games: Games that are (legally) free to download and play, often                         Virtual reality (VR): The computer-generated simulation of a three-dimensional image
            offering in-game spending opportunities.                                                                    or environment that can be interacted with in a seemingly real or physical way by a
                                                                                                                        person using special electronic equipment, such as a headset with a screen inside or
            Game enthusiasts: All people who engage with games through playing, viewing gaming                          gloves fitted with sensors.
            content, and/or hardware or peripheral ownership.

 8          © NEWZOO 2019 GET THE FULL REPORT: NEWZOO.COM/GLOBAL-GAMES-MARKET-REPORT                     ©2019 Newzoo                                                                             GLOBAL GAMES MARKET REPORT 2019   9
THE GLOBAL GAMES MARKET

                                                                                                   THE GLOBAL GAMES MARKET 2019
                                                                                                   A N OVERVIEW PER R EGION A N D SEGMEN T

                                                                                                   In 2019, the global games market will generate revenues of $152.1 billion, a +9.6% year-
                                                                                                   on-year increase. The following section provides an overview of how these revenues
                                                                                                   are divided per region and segment, and how they will develop toward 2022.

                2.
                                                                                                   •   Mobile gaming (smartphone and tablet) remains the largest segment in 2019,
                                                                                                       producing revenues of $68.5 billion—45% of the global games market. Of all
                                                                                                       mobile game revenues, 80%, or $54.9 billion, will come from smartphone games,
                                                                                                       with tablet gaming accounting for the remaining $13.6 billion.

                THE GLOBAL
                GAMES MARKET                                                                       •   Growth in mobile game revenues will continue to outpace growth on PC in the
                                                                                                       coming years, resulting in a shrinking PC market share toward 2022. Mobile will
                                                                                                       also outpace console’s revenue growth; still, console’s market share will remain
                                                                                                       relatively static.

                                                                                                   •   On PC, browser game revenues will continue to decrease as more gamers switch to
                                                                                                       mobile games. In 2019, revenues will decrease by -15.1% year on year. Competitive
                                                                                                       play will continue to drive downloaded/boxed PC games, which will generate
                                                                                                       $32.2 billion in 2019.

                                                                                                   •   The current console generation is coming to an end, meaning the installed base for
                                                                                                       the Xbox One and PlayStation 4 is at its highest. The Nintendo Switch also continues
                                                                                                       to be successful, which will be bolstered by the upcoming new models. These factors,
                                                                                                       coupled with the continued shift toward the games-as-a-service business model, will
                                                                                                       drive 2019’s console games revenues to $47.9 billion, growing at +13.4% year on year.

                                                                                                   •   Markets in the Asia-Pacific region will generate $72.2 billion in 2019, up +7.6% year on
                                                                                                       year, accounting for 47% of total global game revenues.

                                                                                                   •   For the first time since 2015, the U.S. will be the largest gaming market by revenues
NOTE: REVENUE ESTIMATES ARE FROM JUNE 2019. WE REVIEW THESE
QUARTERLY AND UPDATE THEM IF NEEDED: newzoo.com/key-numbers                                            globally with $36.9 billion this year. Driven by growth in console game revenues, it
                                                                                                       will overtake China for the #1 position.

         © NEWZOO 2019 GET THE FULL REPORT: NEWZOO.COM/GLOBAL-GAMES-MARKET-REPORT   ©2019 Newzoo                                                                               GLOBAL GAMES MARKET REPORT 2019   11
THE GLOBAL GAMES MARKET                                                                                                                                                                                THE GLOBAL GAMES MARKET

                                                                                                                     2019 GLOBAL GAMES MARKET
           KE Y D E V E LO P M E N TS TOWARD 2 02 2
                                                                                                                     PER REGION

           •   By 2022, the global games market will grow to $196.0 billion with a CAGR (2018-2022)
                                                                                                                               EUROPE,MIDDLE
               of +9.0%. Owing to the licensing freeze that heavily impacted China, Asia-Pacific                               EAST, AND AFRICA

               is no longer the fastest-growing region. Driven by improving infrastructure and                                 $34.7Bn
               an increased appetite for games and esports, Latin America is now the fastest-
                                                                                                                               +11.5% YoY
               growing games market in the world (based on the four regions illustrated on the
               right), boasting a CAGR of +10.4%.                                                                                                      23%
                                                                                                                      LATIN AMERICA                                                                    ASIA-PACIFIC

                                                                                                                      $5.6Bn                                  2019 TOTAL                             $72.2Bn
           •   Mobile gaming (smartphone and tablet combined) will produce revenues of $95.4                                                      4%         $152.1Bn          47%
                                                                                                                      +11.1% YoY                                                                            +7.6% YoY
                                                                                                                                                                +9.6%
               billion in 2022, growing with a CAGR of +11.3% to account for almost half (49%) of                                                                 YoY

               the entire games market. Revenues and growth will be driven predominantly by
               smartphones, with revenues of $79.7 billion by 2022 (a CAGR of +12.8%). Tablet will                             NORTH AMERICA
                                                                                                                                                        26%

               account for the remaining $15.7 billion. Emerging markets will contribute most                                  $39.6Bn
               to the segment’s growth. However, a range of other factors will also contribute,
                                                                                                                               +11.7% YoY
               including more cross-platform titles, more smartphone users, and improvements
               in hardware and infrastructure.

           •   Revenues generated by the console segment will reach $61.1 billion in 2022,                           This year, the Asia-Pacific (APAC) region will produce game revenues of $72.2 billion,
               increasing with a healthy CAGR of +9.7%. Revenues will be boosted both by                             accounting for 47% of total global game revenues. This represents year-on-year growth
               the imminent release of the next-generation Xbox and PlayStation consoles,                            of +7.6%. China’s licensing freeze has had a huge impact on the region’s revenue growth.
               the upcoming new Switch model(s), as well as the massive installed base of the                        Measures aiming to reduce the screen time of those under the age of 16 will also affect
               previous (now current) console generation.                                                            revenues in China. The licensing freeze impacts the mobile games market, APAC’s largest
                                                                                                                     segment by far, more than other segments, as it is more dependent on a steady stream of
                                                                                                                     new titles.
           •   Game revenues for PC will grow at a slower pace than mobile and console                                 North America will, once more, be the second-largest region (by game revenues), taking
               revenues. Nevertheless, the overall PC gaming market will grow with a CAGR                            more than a quarter (26%) of 2019’s total global games market with $39.6 billion. This
               of +3.5% to total $39.5 billion by 2022. The ongoing consumer shift from browser                      represents a +11.7% increase from last year, the fastest year-on-year growth rate of any
               PC games to downloaded/boxed PC games will reduce the browser segment’s                               region. Game revenue growth in the Europe, Middle East, and Africa region (EMEA) will be
               revenues by almost half from 2018 to 2022. Downloaded/boxed PC games will                             slightly lower than North America’s. With a year-on-year growth of +11.5%, EMEA will gen-
               grow with a CAGR of +5.4%, generating $37.3 billion by 2022.                                          erate revenues of $34.7 billion this year, representing 23% of the total global games market.
                                                                                                                     Meanwhile, Latin America will make up 4% of the games market, growing +11.1% year on
                                                                                                                     year to $5.6 billion.

12         © NEWZOO 2019 GET THE FULL REPORT: NEWZOO.COM/GLOBAL-GAMES-MARKET-REPORT                   ©2019 Newzoo                                                                                GLOBAL GAMES MARKET REPORT 2019   13
THE GLOBAL GAMES MARKET THE GLOBAL GAMES MARKET
REGIONAL BREAKDOWN
In 2019, mobile will again be the largest segment, generating revenues of $68.5 billion and
OF GLOBAL GAME REVENUES
comprising 45% of the global games market. Of global mobile game revenues, 80%, or $54.9
TOWARD 2022
billion, will come from smartphone games, with tablet gaming accounting for the remain-
ing $13.6 billion.
$196.0Bn
Across the board, the games market is in a healthy state, with every segment showing
$178.2Bn
$164.6Bn 22%
growth. Console is the second-largest segment, boasting revenues of $47.9 billion. It will
$152.1Bn 22% grow to $61.1 billion by 2022 with a CAGR (2018-2022) of +9.7%. In total, PC games will gener-
$138.7Bn 22% 4% ate $35.7 billion in 2019, making it the third-largest segment. Growth in downloaded/boxed
23% 4%
4%
PC games is partially offset by declining browser PC revenues, as browser gamers have
22% 26%
4% mostly transitioned to mobile. Browser PC revenues will continue to decline from $3.5
26%
4%
26%
26% billion this year to $2.2 billion in 2022, a CAGR (2018-2022) of -14.7%.
26%
48%
48% 48%
EUROPE, MIDDLE EAST & AFRICA 47%
48%
LATIN AMERICA
NORTH AMERICA
ASIA-PACIFIC
2018 2019 2020 2021 2022
2019 GLOBAL GAMES MARKET SEGMENT BREAKDOWN
PER SEGMENT OF GLOBAL GAME REVENUES
TOWARD 2022
BROWSER PC GAMES
$3.5Bn $196.0Bn
-15.1% YoY DOWNLOADED/BOXED $178.2Bn
PC GAMES $164.6Bn 19%
$32.2Bn $152.1Bn 20% 1%
CONSOLE GAMES 2% $138.7Bn 21%
1%
$47.9Bn +6.6% YoY 21%
2% 31%
21% 22%
2% 31%
+13.4% YoY
32% 2019 TOTAL 3% 31%
$152.1Bn 31%
32%
8%
8%
+9.6% 8%
YoY
9%
9%
DOWNLOADED/BOXED PC
41%
36% SMARTPHONE GAMES BROWSER PC
38%
40%
TABLET GAMES 9% $54.9Bn CONSOLE 35% 36%
$13.6Bn TABLET
+11.6% YoY SMARTPHONE
+5.0% YoY
2018 2019 2020 2021 2022
14 © NEWZOO 2019 GET THE FULL REPORT: NEWZOO.COM/GLOBAL-GAMES-MARKET-REPORT ©2019 Newzoo GLOBAL GAMES MARKET REPORT 2019 15
REGIONS GLOBAL                                                                                                                                                                 KEY GLOBAL TRENDS

                                                                                           4 . A LINK TO THE PAST: PUBLISHERS CAPITALIZE ON
                                                                                           NOSTALGIA

                                                                                           Nostalgia has always been a key selling point in the games market, with some of the
                                                                                           biggest franchises today, including Mario, Final Fantasy, and Pokémon, born as far back
                                                                                           as the early 1980s. Looking to capitalize on consumers’ nostalgia, companies are rereleas-
                                                                                           ing and remaking retro content—and even hardware—from years gone by.

         3.
                                                                                            Porting older games to current hardware has always been commonplace; for example,
                                                                                           Nintendo has traditionally ported its older titles to its handheld consoles, such as the
                                                                                           Game Boy (Color/Advance), and to console via its Virtual Console and now Nintendo
                                                                                           eShop. In the previous console generation (Xbox 360 and PlayStation 3), HD remasters
                                                                                           were a possibility. Many publishers realized that consumers are willing to repurchase
                                                                                           older titles at a discounted rate for upscaled or slightly updated visuals.
          KEY GLOBAL                                                                        However, the current console generation has seen publishers moving away from

          TRENDS                                                                           rereleases and remasters toward outright, from-the-ground-up remakes, released at
                                                                                           premium price points. Two beloved PlayStation platformer franchises from the 90s,
                                                                                           Crash Bandicoot and Spyro the Dragon, have seen major success here. Activision now
                                                                                           owns the rights to these IPs and remade the first three main games from both fran-
                                                                                           chises in two trilogy collections: the Crash Bandicoot N. Sane Trilogy and the Spyro
                                                                                           Reignited Trilogy, respectively. Similar remakes include 2018’s Shadow of the Colossus
                                                                                           and Ratchet & Clank on PlayStation 4, Pokémon Let’s Go Eevee and Let’s Go Pikachu on
                                                                                           the Switch, and Resident Evil 2. Each has seen critical and commercial success. There are
                                                                                           many highly anticipated remakes on the horizon, such as Final Fantasy VII and Crash
                                                                                           Team Racing Nitro-Fueled. Blizzard is getting involved in the PC space with Warcraft III:
                                                                                           Reforged and World of Warcraft Classic.
                                                                                            Blizzard’s upcoming remakes show that capitalizing on nostalgia goes beyond short-
                                                                                           term profit. Remakes or remasters can reignite the passion players have (or had) for fran-
                                                                                           chises and allows the publisher to bring these beloved franchises to a modern era, poten-
                                                                                           tially extending the timeline of these games for another decade or more. It also offers an
                                                                                           opportunity to modernize the revenue model of these classic titles.
                                                                                            Capitalizing on nostalgia offers publishers the chance to monetize games far beyond
                                                                                           the initial success of the game but commercial and critical success isn’t the only benefit
                                                                                           for publishers. Remaking games in this manner is less time consuming and more cost-
                                                                                           effective than designing an entirely new title. After all, the developers already have a
                                                                                           foundation, including character design, level layout, and story, from which to build. This
                                                                                           provides another way for companies to produce stable revenue alongside games-as-a-
                                                                                           service offerings. It also repurposes older content for new and younger audiences, who
                                                                                           expect to see high-fidelity visuals in games.

 © NEWZOO 2019 GET THE FULL REPORT: NEWZOO.COM/GLOBAL-GAMES-MARKET-REPORT   ©2019 Newzoo                                                                                 GLOBAL GAMES MARKET REPORT 2019   17
KEY GLOBAL TRENDS KEY GLOBAL TRENDS
MINI RETRO CONSOLES TOOK THE MARKET BY STORM, BRIEFLY UNLIKELY PARTNERSHIPS AND AN AMBIGUOUS FUTURE
On the hardware front, Nintendo kick-started a trend of companies releasing smaller The biggest cloud providers are Amazon Web Services (AWS), Google Cloud, Microsoft
versions of retro consoles, with the release of the NES Classic Edition in November 2016. Azure, IBM, and Alibaba Cloud. Interestingly, Amazon has not yet revealed plans for a
It was an unexpected success and consumer demand was far higher than the initial cloud gaming platform or partnership, despite being one of the world’s largest cloud
supply, leading the company to manufacture more. Nintendo followed this up with the providers. Moreover, Microsoft and Sony signed a memorandum of understanding, with
Super NES Classic Edition in 2017. This success inspired Sony to release the PlayStation both companies agreeing to work together on their respective cloud gaming solutions.
Classic in 2018 and Sega to announce the Sega Genesis Mini (Mega Drive mini in Europe) This means that Sony’s cloud gaming platform will be powered by Microsoft’s Azure.
for release in September 2019. Most recently, Capcom announced the Capcom Home While this seems an unlikely partnership, as Sony and Microsoft have been rivals in the
Arcade, another plug-and-play arcade system including 16 classic titles and the original console space since the mid-2000s, the two companies are consolidating their efforts in
controller layout from 80’s-style game arcades. However, consumer demand for these part to offset the looming threat of Google Stadia.
smaller retro consoles already seems to be diminishing. Also, since modern consoles All in all, cloud gaming is due to disrupt the market in some significant ways, including
often come with backward compatibility, we expect the market for hardware re-releases new features for consumers, new content-delivery methods, and potentially new pricing
to be limited and for retro and nostalgic software re-releases and remakes to have more models. We dive even deeper into these areas in the Special Focus Topics section in the
of a role to play in the games market going forward. paid version of this report.
7. THE PERFECT STORM: C LOU D GA M IN G TA KE S OFF 1 0. I NSTANT G AM E S : B R I D G I NG TH E G AP B E TW E E N GAMING
AND S O CI AL M E D I A
Just as mobile gaming expanded the market by making games accessible to billions
of people across the globe, cloud gaming has the potential to expand the market for Instant game platforms are becoming popular across the globe. In China, Tencent’s
premium games beyond the current console and PC audience. Cloud gaming presents WeChat mini games are most prominent, already solidifying themselves within the
an opportunity that was unattainable just 10 years ago: any game can be played on any Chinese games ecosystem. In the West, Facebook Instant Games shows great potential.
device without the consumer having to own the physical hardware required to process This has led to other Western-focused platforms, such as Snapchat, introducing similar
the game. As the tech continues to improve and cloud gaming grows, we expect an instant games. In China, Tik Tok is also beginning to introduce them.
increase in the overall demand for games as new consumer groups enter the ecosys-
tem. We also expect to see challenges and innovations in business models, game devel- MINI GAMES ROSE TO PROMINENCE IN CHINA FOLLOWING THE MINI-PROGRAM
opment, content discovery, engagement options, and even shakeups to gameplay itself. REVOLUTION
The past year has seen some key players unveiling cloud gaming platforms. Faster Mini programs were first introduced to Chinese smartphone users at the end of 2017.
Internet and the imminent release of 5G make the technology feasible in more markets Since then, they have grown into an integral part of many residents’ lives. Suitable for
than ever, and companies are striking when the iron is hot. Microsoft, for example, apps with low-frequency usage, mini programs are less work to design and develop com-
announced Project xCloud in October 2018, leaning heavily on this innovative new tech pared to traditional mobile applications. Unlike app stores, where extremely popular
for the upcoming console generation. Earlier this year, Google unveiled Stadia, marking apps generate most revenues, the more widespread distribution of mini programs allows
the tech giant’s biggest foray into the games business (outside the Google Play Store). for each mini program to enjoy an equal chance of reaching new users. Notably, the most
Google is leveraging YouTube’s popularity with Stadia, including a button that shares efficient way to acquire users is through group chat, where people share and recom-
directly to the video-streaming platform, as well as the ability for players to join stream- mend mini programs to friends. This shows mini programs’ heavy dependence on social
ers’ games. Google also announced its first-party development studio that will create networks. Game developers in China have already seen huge potential in this market,
Stadia-exclusive content. Of course, Sony is also active in the cloud gaming space and with WeChat starting to monetize mini games on Android through rewarded video ads
currently operates the world’s most popular cloud gaming platform, PlayStation Now, in April 2018.
which now has more than 700,000 users.
18 © NEWZOO 2019 GET THE FULL REPORT: NEWZOO.COM/GLOBAL-GAMES-MARKET-REPORT ©2019 Newzoo GLOBAL GAMES MARKET REPORT 2019 19KEY GLOBAL TRENDS KEY GLOBAL TRENDS
FACEBOOK INSTANT GAMES SHOWS STRONG POTENTIAL THE PLATFORM’S POTENTIAL IN EMERGING MARKETS
Facebook is the world’s biggest social media platform. More than 2.3 billion people use it All available titles on Facebook Instant Games were built in HTML5, meaning no down-
each month, with more than 1.5 billion people logging in daily. The tech giant has been loads are necessary, and users can access games regardless of personal device/network
involved with gaming to varying degrees throughout the past decade, but Facebook constraints. This gives the platform much growth potential in emerging markets,
Instant Games hints at the company’s plans to leverage its massive user base to stake a where Internet infrastructure is more limited. Similarly, Facebook Instant Games is
claim of the $152.1 billion global games market. now available on Facebook Lite, an app that allows mobile users across the world to
When Facebook first launched Instant Games’ closed beta in November 2016, there access Facebook on low-spec devices, and quality of Internet connection is not an issue.
were 17 different games available. In March 2018, however, Facebook threw open the Compatibility with Facebook Lite makes Instant Games even more accessible in emerg-
development floodgates, opening Instant Games to any developer wanting to release a ing markets such as India, which may have a big role to play in the continued success of
game on the platform. Now, it boasts more than 30 billion game sessions played across the platform. After all, one-tenth of the world’s active smartphones are located in India,
more than 7,000 titles. The platform has already come a long way, and all signs point to a country that will generate $1.5 billion in game revenues this year.
even further growth.
Facebook Instant Games is a platform-agnostic service, meaning any device compati-
ble with the Facebook/Messenger app can also run Instant Games. Users directly access 1 . R E ACH I NG YO U NG E R AU D I E NCE S V I A G AMING
the platform’s games through Facebook’s News Feed, Messenger conversations, or other
Facebook surfaces like the new Gaming tab. This means Facebook users can immediately
start playing a game without installing another app. Of course, Facebook is an inher- 2. G AM I NG ’ S P L ATFO R M -AG NOSTI C F U TU R E
ently social platform. Through Instant Games, playing titles together can be a seamless
part of users’ conversations. Therefore, social games are where Facebook Instant Games’
true potential lies, and this already shows. While there are some outliers (Everwing and 3 . NE W M O NE TI Z ATI O N M O D E L S FO R S E RV I CE S
Slotmate), most of the platform’s top-grossing titles are social games, including Words
With Friends, Draw Something, 8 Ball Pool, Quiz Planet, and Uno.
It also appears that games featuring social play have far more weekly players and 5 . P R E M I U M G AM E CO NTE NT R E TU R NS TO M O BIL E
higher retention rates on Instant Games. This speaks volumes for the platform’s poten-
tial going forward—especially given the rise of the games-as-a-service model. Most of
the top-grossing mobile games, across most markets, all feature this model and the mon- 6 . NE W P C D I STR I B U TI O N O P TI O NS E M P OW ER
etization options that come with it. D E V E LO P E R S
Adding to Instant Games’ potential, gaming groups are one of Facebook’s biggest and
most engaged communities, with more than 100 million people actively participating in
300,000 game-related groups every month. These groups are typically conversing about 8 . A V R H E ADS E T FO R E V E RY K I ND O F G AM E R
all things video games. Instant Games’ most popular titles, which combine gaming with
online social interaction, have major potential with this group in particular.
9. P C G AM I NG ’ S U NI Q U E VALU E P R O P OS I TI O N
FIND ALL 10 TRENDS IN THE FULL REPORT.
20 © NEWZOO 2019 GET THE FULL REPORT: NEWZOO.COM/GLOBAL-GAMES-MARKET-REPORT ©2019 Newzoo GLOBAL GAMES MARKET REPORT 2019 21SPECIAL FOCUS TOPICS
NEWZOO’S GAMER SEGMENTATION™
THE N EW STA N DA R D FOR A N EW B R EE D OF
GA ME EN THU SIASTS
Consumer engagement with games has changed dramatically over the past 10 years. Now
more multi-dimensional and fragmented than ever, gamers aren’t just playing games;
watching esports and game video content is an equally important part of the puzzle.
4.
Hardware and peripheral ownership is, in many cases, another vital component for many
game enthusiasts. These new dimensions of gaming demand a new segmentation that
captures all its unique, passionate fans.
Personas like ‘’casual gamers’’ and ‘’hardcore gamers’’ don’t cut it anymore, only
accounting for a fraction of gamers. The old way of segmenting gamers is linear, incom-
plete, and offers few benefits to the games business. This is why we spent the past year
SPECIAL pouring our consumer insights experience and games market expertise into developing
FOCUS TOPICS Newzoo’s Gamer Segmentation™ from the ground up. The result: eight unique personas
that encompass all aspects of consumer engagement with games: playing, viewing, and
owning. Everyone, from game publishers and hardware manufacturers to automotive
and apparel brands, stands to benefit from this new standard for segmenting games
enthusiasts. Brands can finally discover new personas that fit their brand, grasp a deeper
understanding of their target audience’s engagement patterns, and see which groups are
growing the fastest and in which markets.
Each of the eight personas represents a unique type of game enthusiast in the market.
The personas are mutually exclusive, meaning that a person can only belong to one
persona group and there is no overlap between them. The eight personas represent every
consumer in the global population of game enthusiasts, based on their preferences for
playing, viewing, and owning.
© NEWZOO 2019 GET THE FULL REPORT: NEWZOO.COM/GLOBAL-GAMES-MARKET-REPORT ©2019 Newzoo GLOBAL GAMES MARKET REPORT 2019 23SPECIAL FOCUS TOPICS SPECIAL FOCUS TOPICS
REACHING ALL SEGMENTS OF THE GAMES MARKET The size of each persona varies per region and per country, as do the demographics per
Newzoo’s Gamer Segmentation features target groups that fly under the radar of tradi- group. Using our Consumer Insights for games, esports, and mobile, we can dive deeper
tional segmentation, revolutionizing how these unique groups of individuals are under- into what motivates these groups to engage with games.
stood and approached. These groups are growing fastest, and—for the most part—have You can understand and explore combinations of engagement that are most common
plenty of disposable income to spend. This includes Popcorn Gamers, who typically do within your user base or target group. You can also grasp a deeper understanding of how
not play many games but love watching game video content/esports. This persona, there- people engage with games and their behavior patterns outside of gaming. For example,
fore, is easier to reach through mediums like Twitch and YouTube than with in-game use our data to find out their demographics, media behavior, brand preferences, hobbies
advertising. and interests, and spending behavior. The new segmentation and its personas give
Another fast-growing persona is the Cloud Gamer, those who enjoy high-quality game brands a complete picture of how modern consumers are engaging with gaming content
experiences, preferably free-to-play or discounted titles, but only spend on hardware through playing, viewing, and owning.
when necessary. The imminent cloud gaming platforms from Microsoft (xCloud) and
Google (Stadia), which do not require the consumer to buy expensive hardware, are a
potential game changer for this group.
Backseat Viewers watch game video content or esports but rarely play games. Many
consumers in this persona are lapsed gamers who once enjoyed playing games, but due
to work and/or family commitments no longer have time to play.
Ultimate Gamers live and breathe games across all spectrums of the market (playing,
owning, and viewing). In addition, these consumers are likely to have an interest in
computers, electronics, and gadgets, and enjoy watching movies in their spare time.
Compared to other personas, they are also likelier to live in a household with children.
The Conventional Player resembles the Ultimate Gamer of 10 years ago, before the
advent of game video content and the meteoric rise of esports. Watching others play
is of little interest to Conventional Players; still, they revel in staying up to date with
the latest game releases and developments. Nothing will get in the way of this persona
fulfilling their gaming needs, so owning the newest hardware and peripherals also a key
part of their engagement.
All-Round Enthusiasts are also avid gamers, playing for many hours each week. They
enjoy a holistic gaming experience, combining playing games, viewing game content,
and owning dedicated game hardware. While they may not be as dedicated as Ultimate
Gamers, games are still serious business for All-Round Enthusiasts. They are typically
full-time workers, so paying for the newest titles and hardware is no issue.
Meanwhile, Time Fillers are consumers who play games, typically on mobile, to pass
the time; for example, by playing a game of Candy Crush or Clash of Clans while com-
muting. They rarely spend more than a few hours gaming each week and don’t see
gaming as a major part of their lives.
Lastly, there is the Hardware Enthusiast. These consumers are casual about gaming
and don’t play many games each week. When they do play games, however, hardware
is vital for their experience. They simply cannot turn a blind eye to the newest gaming
READ OUR CLOUD GAMING SPECIAL FOCUS TOPIC
gear and peripherals, so they spend big on these products. And their love of computers,
IN THE FULL REPORT.
electronics, and gadgets extends beyond games.
24 © NEWZOO 2019 GET THE FULL REPORT: NEWZOO.COM/GLOBAL-GAMES-MARKET-REPORT ©2019 Newzoo GLOBAL GAMES MARKET REPORT 2019 25RANKINGS
TOP 35 PUBLIC COMPANIES 2018
In 2018, the top 35 public game companies generated $114.0 billion, up from $100.2 billion
in 2017. Together, these top 35 companies accounted for 82% of 2018’s global games market
revenues—the same share as 2017. Tencent was again the top company, with revenues
of $19.8 billion and year-on-year growth of +9%. Compared to the previous year (+51%
from 2016 to 2017), the slowed growth for 2018 is a direct result of China’s licensing freeze.
The company is hoping to offset this in 2019 by monetizing its PUBG Mobile userbase
5.
through new title Game for Peace. The top five companies alone accounted for 43% of
global games revenues. Console showed especially strong growth, predominantly driven
by the three platform holders: Microsoft, Sony, and Nintendo.
RANK COMPANY Q1 ($M) Q2 ($M) Q3 ($M) Q4($M) 2018 ($M) YOY GROWTH
1 TENCENT 5,502 4,687 4,903 4,641 19,733 9%
RANKINGS
2 SONY 3,079 3,117 3,612 4,410 14,218 41%
3 MICROSOFT 2,019 2,033 2,311 3,391 9,754 32%
4 APPLE 2,091 2,303 2,524 2,535 9,453 18%
ACTIVISION
5 1,872 1,537 1,352 2,131 6,892 6%
BLIZZARD
6 GOOGLE 1,383 1,463 1,522 2,129 6,497 22%
7 NETEASE 1,346 1,546 1,590 1,694 6,177 11%
8 EA 1,582 1,137 1,286 1,289 5,294 4%
9 NINTENDO 697 730 751 2,111 4,288 36%
10 BANDAI NAMCO 807 567 693 674 2,741 13%
TAKETWO
11 450 388 493 1,249 2,580 35%
INTERACTIVE
12 NEXON 803 424 615 409 2,252 8%
13 UBISOFT 666 449 416 691 2,221 3%
14 NETMARBLE 475 469 493 456 1,893 -17%
15 WARNER BROS 404 432 435 564 1,835 -5%
16 SQUARE ENIX 425 288 447 423 1,583 -9%
17 NCSOFT 366 322 330 324 1,343 -8%
18 CYBER AGENT 359 315 327 323 1,324 7%
19 MIXI 410 261 282 268 1,222 -17%
20 KONAMI 272 267 326 346 1,210 12%
ARISTOCRAT
21 167 326 326 326 1,146 187%
LEISURE
22 37 INTERACTIVE 232 240 319 300 1,091 27%
23 PERFECT WORLD 197 208 206 285 897 3%
24 SEGA 184 189 219 240 832 -3%
25 CAPCOM 384 122 181 121 809 49%
CENTURY
26 125 228 222 232 807 573%
HUATONG
27 DISNEY 195 193 191 216 795 -9%
28 DENA 223 191 188 175 777 -13%
29 IGG 194 194 180 180 749 23%
30 FACEBOOK 145 164 160 219 688 -3%
31 ZYNGA 162 165 168 177 671 6%
SEA GROUP
32 111 108 113 306 637 74%
(GARENA)
GUNGHO
33 134 129 130 171 563 -19%
ENTERTAINMENT
34 GREE INC. 138 146 132 125 540 -16%
DISCOVER MORE RANKINGS, INCLUDING THE TOP 50 35
YOUZU
INTERACTIVE
132 121 119 146 518 5%
COUNTRIES/MARKETS FOR 2019, IN THE FULL REPORT.
© NEWZOO 2019 GET THE FULL REPORT: NEWZOO.COM/GLOBAL-GAMES-MARKET-REPORT ©2019 Newzoo GLOBAL GAMES MARKET REPORT 2019 27REGIONAL OVERVIEW
NORTH AMERICA
2019 GA ME R EVEN U ES
TOP COUNTRIES BASED ON GAME REVENUES
Population
366,373,000 $36.9 Bn
$39.6Bn
6.
U.S. 2019 NAM Revenues
$2.8Bn
+11.7%
Canada
Online Population
YoY Growth 2018-2019
308,482,000
Gamers
197,581,000 #2
REGIONAL
OVERVIEW
Share of 2019
Global Revenues
#1
26.1%
LATIN AMERICA
2019 GA ME R EVEN U ES
TOP COUNTRIES BASED ON GAME REVENUES
Population
656,865,000
$1.8Bn
Mexico
$372M
$268M
Chile $5.6Bn
Colombia $1.6Bn 2019 LATAM Revenues
Brazil
#1
Online Population
$495M
Argentina +11.1%
YoY Growth 2018-2019
435,303,000 #4
Gamers #2
252,627,000
#5
Share of 2019
#3 Global Revenues
FIND DEEPER INSIGHTS, AS WELL AS DATA ON ALL 3.7%
30 COUNTRIES/MARKETS, IN THE FULL REPORT.
© NEWZOO 2019 GET THE FULL REPORT: NEWZOO.COM/GLOBAL-GAMES-MARKET-REPORT ©2019 Newzoo GLOBAL GAMES MARKET REPORT 2019 29REGIONAL OVERVIEW REGIONAL OVERVIEW
WESTERN EUROPE MIDDLE EAST & AFRICA
2 01 9 G A M E R E V E N U E S 2019 GA ME R EVEN U ES
TOP COUNTRIES BASED ON GAME REVENUES TOP COUNTRIES BASED ON GAME REVENUES
Population
$4.1Bn
$25.7Bn Population
1,754,998,000 $396M
$4.8Bn
410,058,000 France 2019 W-EU Revenues
Israel 2019 MEA Revenues
$758M
+11.0%
Saudi Arabia
Online Population
$2.7Bn
Italy +12.3% Online Population
$826M
Turkey
YoY Growth 2018-2019
364,334,000 $5.6Bn $6.0Bn
YoY Growth 2018-2019 657,787,000 #1 $458M
United Kingdom Germany Iran
#4
#3
Gamers #5
Gamers #2
$2.7Bn
215,502,000 Spain 359,539,000
$334M Share of 2019
Share of 2019 UAE Global Revenues
#2 Global Revenues
#1
#3
16.9% 3.2%
#5
#4
EASTERN EUROPE ASIA-PACIFIC
2 01 9 G A M E R E V E N U E S 2019 GA ME R EVEN U ES
TOP COUNTRIES BASED ON GAME REVENUES TOP COUNTRIES BASED ON GAME REVENUES
Population
$1.8Bn $4.2Bn Population
4,130,914,000
$6.2Bn $72.2Bn
352,499,000 Russia
2019 E-EU Revenues $1.5Bn
Republic of Korea
2019 APAC Revenues
$203M India
$36.5Bn
+7.4% +7.6%
Ukraine
China
$596M $19.0Bn
Online Population Online Population Japan
Poland
YoY Growth 2018-2019 YoY Growth 2018-2019
273,599,000 2,081,221,000
#3 #2
#1
#1
Gamers
#5
Gamers
#2
155,559,000 #4 1,331,242,000
#3 $1.9Bn
#5 Australia
Share of 2019 Share of 2019
Global Revenues
$195M Global Revenues
Romania $228M
Kazakhstan
2.8% #4 47.4%
30 © NEWZOO 2019 GET THE FULL REPORT: NEWZOO.COM/GLOBAL-GAMES-MARKET-REPORT ©2019 Newzoo GLOBAL GAMES MARKET REPORT 2019 31Newzoo is the leading global provider of games and esports analytics. We help some
of the world’s largest entertainment, technology, and media companies target their
audience, track competitors, spot opportunities, and make strategic and financial
GET THE REAL DEAL decisions.
TH E F U L L G LO B A L GAM E S M ARK E T RE P O RT
OUR USE CASES (SOLUTIONS)
REPORT CONTENT SUMMARY REGION SCOPE
EXPLORE CREATE OPTIMIZE
• Trends • Strategies • Marketing
• Industries • Business plans • Investments
• METHODOLOGY & TERMINOLOGY • NORTH AMERICA • Markets • New products • Product dev
• Forecasts • Target groups • Local efforts
• GLOBAL GAMES MARKET • LATIN AMERICA
• KEY GLOBAL TRENDS • EASTERN EUROPE
• THIRD-PARTY RESEARCH • WESTERN EUROPE
• RANKINGS • MIDDLE EAST & AFRICA OUR EXPERTISE
• SPECIAL FOCUS TOPICS • ASIA-PACIFIC
• GAMES MARKET PER REGION & COUNTRY • MARKET SIZING & CONSUMER INSIGHTS
FOR 30 KEY MARKETS
ANALYSIS SUPPORT ONLINE DASHBOARD & DATASETS
TOM WIJMAN
CONSUMER INSIGHTS TRACKING DATA MARKET FORECASTS
Sr. Market Analyst
Understand your most Metrics that come straight Our landmark reports.
valued consumers’ drivers, from the source. Track In-depth market forecasts
attitudes, and behavior. your market, optimize and trends ensure you
ORLA MEEHAN Segment your audience marketing, and product never miss an opportunity.
Research Analyst across 30 countries/ development while keeping Includes quarterly updates
markets using more than an eye out for blue-ocean and access to our forecast
200 variables. opportunities. dashboards.
BENTE DE HEIJ
Client Success Director EXPORT TO
SUBSCRIBE TODAY
SUBSCRIBE DIRECTLY: QUESTIONS?
newzoo.com/global-games-market-report 6000 EUR NEWZOO CLIENT PORTAL
OUR ONE-STOP SHOP
Tom Wijman
Sr. Market Analyst
OR GET IN TOUCH: 7500 USD GLOBAL ESPORTS
Access to all our reports, tom@newzoo.com
dashboards, and custom analysis
questions@newzoo.com PER YEAR & MOBILE MARKET REPORTS decks that we create for you in
one central place.
32 GLOBAL GAMES MARKET REPORT 2019 ©2019 Newzoo ©2019 Newzoo GLOBAL GAMES MARKET REPORT 2019 33You can also read


