Strategy Analysis of Real Estate Company Property Development in Medium Size City in China
←
→
Page content transcription
If your browser does not render page correctly, please read the page content below
Dept of Real Estate and Construction Management       Thesis no. 72
Msc Program in Real Estate Management                 Master of Science, 30 credits

     Strategy Analysis of Real Estate Company
 Property Development in Medium Size City in
                                  China

                            Author:       Ji Yiping
                            Supervisor:   Hans Lind

                                Stockholm 2011
Master of Science Thesis

Title:                       Strategy Analysis of Real Estate Company Development in
                             Medium and Small Size Cities in China, A case study of the
                             development of Fuxing Huiyu Company

Authors:                     Ji Yiping
Department:                  Department of Real Estate and Construction Management
                             Division of Building and Real Estate Economics
Master Thesis number:
Supervisor:                  Hans Lind

     Abstract:
     Real estate industry is a new economic growth point and main industry in Chinese
     gross domestic product nowadays. This paper analyzes the trend of Chinese real estate
     market development to help investors to understand the current situation of Chinese
     real estate markets and policies better, so as to make better real estate investment
     decisions in China in the future. Because of oversaturated with investment and higher
     cost of investment there are more and more limitations in investing in big cities in
     China. With the rapid development of the economy, the huge inner demand of real
     estate is increasing in medium and small sized cities. Some investigations show that
     there are huge spaces of the appreciation in Chinese real estate market in medium and
     small sized cities. The author will describe and analyze the investment strategy and
     development of Fuxing Huiyu Real Estate Corporation as a case study. The
     demonstrated company is a public company with rapid growth in a medium sized city
     named Wuhan in the central part of China. Other investment companies or real estate
     companies could get some ideas by analyzing the development and decision making
     process of this company.

     Key word: Real estate market, Policies, Housing demand, Housing supply,
     Medium and small size of cities.

                                               2
Content
1. Introduction ........................................................................................................................... 6
1.1 Background ................................................................................................................. 6
1.2 Aims and Objectives.................................................................................................... 7
1.3 Methodology ............................................................................................................... 7
2. General development of real estate market ........................................................................... 8
2.1 Urbanization process ................................................................................................... 8
2.2 Globalization process .................................................................................................. 8
2.3 Strategies for real estate companies............................................................................. 9
3. General description of Wuhan city ...................................................................................... 10
3.1 Introduction of the general information of Wuhan .................................................... 10
3.1.1 Introduction of location of Wuhan ................................................................. 10
3.1.2 Introduce the regional features and resource advantages of Wuhan .............. 10
3.1.3 Introduction of transportation ......................................................................... 12
3.2 Introduction of main industry and investment situation in Wuhan ........................... 13
3.3 Introduction of related real estate policies and influences......................................... 13
3.3.1 Monetary and financial policies in recent year ............................................... 14
3.3.2 From the view of control ................................................................................ 15
3.3.3 From the view of support ............................................................................... 16
3.3.4 Influence by policies ....................................................................................... 17
3.3.5 Some new real estate policies of Wuhan ....................................................... 18
3.4 Introduction of the economic development situation and trend in Wuhan ................ 19
3.5 Housing demand analysis in Wuhan ......................................................................... 20
3.5.1 Transportation................................................................................................. 20
33.5.2 Increasing the GDP......................................................................................... 21
3.5.3 Disposable income.......................................................................................... 21
3.5.4 Consumption................................................................................................... 21
3.5.5 Population demand ......................................................................................... 22
3.5.6 Investment demand ......................................................................................... 23
3.6 Housing supply analysis in Wuhan ........................................................................... 23
3.6.1 General housing supply information in Wuhan .............................................. 24
3.6.2 The influence to house market provision resulted from the quantity of land
supply and land price ............................................................................................... 24
3.6.3 The influence for house supply market by GDP and GDP per capita ............ 25
3.6.4 The influence for housing supply market by housing price ........................... 27
3.6.5 The influence for housing supply market by operation situation of
construction ............................................................................................................. 28
3.6.6 The influence for housing supply market by government policy ................... 29
3.7 Description and introduction of Xiaogan city ........................................................... 29
3.7.1 Why choose Xiaogan as their target ............................................................... 29
3.7.2 Introduce of Xiaogan ...................................................................................... 30
3.7.3 Demand analysis in Xiaogan .......................................................................... 30
4. Introduction of Fuxing Huiyu Real Estate Company .......................................................... 32
4.1 General introduction of the company ........................................................................ 32
4.2 The introduction of parent company ......................................................................... 32
4.3 General introduction of the financial aspect of the company .................................... 32
4.4 Market strategy-- reconstruction of the old city (urban renewal) .............................. 33
5 Description and analysis of the Shuian Xingcheng project in Wuhan ................................. 34
5.1Backgroud of the project ............................................................................................ 34
45.1.1Introduction of the competition in biding the land .......................................... 34
5.1.2 Introduction the characteristics of the district for the project ......................... 34
5.2 General residential supply in Wuhan......................................................................... 34
5.3 Analysis the situation and development trend in the project area ............................. 34
5.4 Target customers and demand analysis ..................................................................... 35
5.5 Compare with general high-end residential property ................................................ 36
5.6 SWOT analysis of the project.................................................................................... 36
5.6.1 Strength .......................................................................................................... 36
5.6.2 Weakness ........................................................................................................ 38
5.6.3 Opportunity..................................................................................................... 38
5.6.4 Threat.............................................................................................................. 39
6. Comparable in different size of cities (focus on the projects in Fuxing Huiyu Real Estate
Company) ................................................................................................................................ 40
7. Conclusion ........................................................................................................................... 43
Reference ................................................................................................................................. 45
51. Introduction
1.1 Background
As we all know there is a huge negative impact of economic crisis for the whole
world especially of those international investment companies in the western countries.
Many businesses have closed down and some investment banks have bankrupted all
over the world because of economic crisis and recession. The Chinese economy
suffered losses in the crisis too. Because of huge, sustaining domestic demand and
successive improvements of basic construction, the economic growth of China didn’t
slip as much as in western countries. Even though the export industry got a huge
negative impact in the economic crisis, the Chinese government had announced that
the growth of GDP has been kept at 8.7% in 2009. The most contribution towards the
Chinese GDP growth was the real estate industry. Most global investors want to get
profit from China's booming economy. One of their best choices is to invest in
Chinese real estate market as part of their portfolio diversification.
Real estate is a new economic growth point and main industry in Chinese gross
domestic product nowadays. Real estate market in China is facing unprecedented
opportunities and challenges now. This paper analyzes the trend of Chinese real estate
market development to help investors to understand the current situation of Chinese
real estate markets and policies better, and make better real estate investment
decisions in China in the future. Some investigation shows that there is a huge space
of the appreciation in Chinese real estate market.
From the aspect of Chinese real estate development trend analysis, on the one hand
the current trend in China is that there are more and more limitations in developing
real estate market in big cities that leads to less demand for residential and office
buildings. On another hand, urbanization process was never stopped in small and
medium cities and most of them are located in west and north China. The demand of
real estate is huge and the space of appreciation in these areas is bigger than east and
south of China.
In this paper the author will focus on the real estate market in medium size city and
small size city in China. The medium city is Wuhan and the small city is Xiaogan
which are all in the middle of China. Because there is not too much information for
the small city, most of the paper will focus on medium city Wuhan. There are
different methods to differentiate the size of cities. From population aspect,
permanent population in urban district less than 0.5 million is small city; 0.5 to 1
million is medium size city; 1 to 3 million is big city; 3 to 10million is megalopolis;
over 10million is super huge city. On another hand, the total GDP of Wuhan is about
450 billion Yuan in 2009 which is the 13th in whole China. From the above
perspectives, Wuhan is a megalopolis because the permanent population is about
66.66million and the rank of GPD is good. But from another point of view, GDP per
capita of Wuhan is 44148 Yuan in 2009 which is the 43th in all cities of China in
2008; it is the 114th in 2007; it is the 104th in 2006. GDP per capita is more
meaningful and realistic than total GDP, from this perspective, Wuhan is a medium
city in China.
1.2 Aims and Objectives
This paper will analyze the trend of Chinese real estate market development to help
investors to understand the Chinese real estate markets current situation, policies
better and make better real estate investment decisions in China in the future. With the
rapid development of the economy, the huge inner demand of real estate is increasing
in medium and small cities. Meanwhile, there is more and more limitation to invest in
big cities, such as, oversaturated with investment and higher cost of investment. This
paper analyses the reason why Chinese domestic real estate companies are expanding
the investment in medium and small cities instead of big cities. I will describe and
analyze the investment strategy and development of Fuxing Huiyu Real Estate
Corporation as an example which is a native, medium sized real estate company in a
medium city. But the company grows rapidly. The analysis of the decision made by
this company will help the investment companies to make their investment decisions
in future. How global investors can profit from China's booming economy? They
could get some idea from the investment trend of Chinese local investment
companies.
1.3 Methodology
This paper contains two main parts. The first part is a general introduction of the
urbanization process and globalization process of the city which I focus on and
policies of the real estate development. The second part is a case study; I focus on
analysis the development of investment strategy of Fuxing Huiyu Real Estate
Company. It is a medium size real estate company which is only famous in a medium
size city---Wuhan. I analyzed the development process of the company and how it is
growing in the residential real estate field.
The main method used in the paper is comparative analysis. I have compared two
local famous residential projects which belong to my target real estate company. And
these projects were constructed in two different cities, one is in a medium size city
Wuhan and another one is in a small size city Xiaogan. The medium size city
(Wuhan) which I chosen is a capital city in the province of Hubei (it is one province
in the middle of China). The small size city which I have chosen is a secondary city
and it is close to the capital city Wuhan. The comparative analysis approach is
compared investment situation and demand and supply in these two different sizes of
cities.
7There is a SWOT method when I analysis the main project in the medium size of city
Wuhan. It contains four parts with strength, weakness, opportunities and threat. It will
be used in the market analysis sector of case study.
The information of the cities and government policies comes from the official website
of local government and quantitative data of the project are comes from the official
website of Fuxing Huiyu real estate company.
2. General development of real estate market
2.1 Urbanization process
If we want to find out the demand of real estate in China, we should know the Chinese
policies and understand the urbanization process in China. Baizhan Li, Meng Liu and
K.G. McKinnell(2006) indicated that “after 1978, with the introduction of the
economic reform policy, the urbanization process began to seriously take off.” They
also found the regional differences in China’s pattern of urbanization. “Generally
speaking the eastern coastal areas are more developed with the west only receiving
serious attention over the past two to three years”. There is a research shows “In the
last 20 years, the level of urbanization in China has increased rapidly and in 1999, it
reached 30.9 per cent.” There is a prediction shows that in 2010, “the urban
population should reach 570 million and the level of urbanization 40.7 per cent; and it
is expected that the level of urbanization will be 52 per cent by 2020 (Xun, 2000).”
The real estate industry and its investment in China are developing together with the
progress of urbanization. Arthur O’Sullivan studies that urbanization economics is
one type of agglomerative economics. There are two types of agglomerative
economics: localization economics and urbanization economics. The large industrial
city develops because of agglomerative economics in production. By locating close to
one another, firms can produce at a lower cost. If one company moves to a city may
leads another company moves to the city too. From another aspect, economic
globalization is one of the important incentives for the progress of urbanization in
China. Globalization is often used to refer to economic globalization, that is,
integration of national economies into the international economy through trade,
foreign direct investment, capital flows, migration, and the spread of technology
(Bhagwati, Jagdish 2004).
2.2 Globalization process
Depending on the rapid development of the economy of China, the market of real
estate is much more mature than ever before. An investigation by Ling Hin Li (1996)
8shows that Real estate development and investment in China is not an investment
opportunity for most international investors, it has become a strategy. However, there
are still a lot of deficiencies in the Chinese real estate market. “One of these is the
difficulty in establishing values for real estate assets. The other is the complication of
the development procedures which affects property investment analysis”.
2.3 Strategies for real estate companies
Patrick X.W. Zou and Alison Wong (2008) identified the opportunities and risks and
develop effective business strategies for foreign design and construction management
companies to penetrate into the Chinese market. From interviews with some top
managers in construction and engineering firms who are operating in China they all
optimistic about the China market but there still some risks. The most risk is that the
company must cultivate a network of contacts, which comes from Chinese culture.
For example, the company must have a good relationship with local government to
get more profit. Most of local companies did it well than international companies.
The recent investigation from Antonio Wong (2009) suggests a mixed investment
strategy designed to capture the long-term growth of the Chinese economy. In an
international context, The investigation of Martin Hoesli, Jon Lekander and Witold
Witkiewicz in 2003 shows that real estate is found to be an effective portfolio
diversifier, and even more so when both domestic and international real estate assets
are considered.
93. General description of Wuhan city
3.1 Introduction of the general information of Wuhan
3.1.1 Introduction of location of Wuhan
Being the capital city of Hubei Province, Wuhan urban agglomeration is the core
central city in the middle of China and the political, economic, scientific and
technological and education center in inland China. It connects 9 provinces from
geographical position; we can see it from the China map below. Because it is about
1000 kilometers away from Shanghai in the east, Chongqing in the west, Guangzhou
in the south and Beijing in the north. There are 13 administrative districts in the city.
It covers an area of 8467 square kilometers and has a population of 8.31 million
involve 6.66 million permanent populations. Since the opening to the outside world,
Wuhan has developed very quickly and the economy has kept a continual and steady
growth. The average economy growth from 1992 to 1998 reached 16% which is
above the average level of the province and country. Belonging with the policies of
rising middle of China; Wuhan is the leader city of middle state of Yangzi River
economic circle. Wuhan is the 13th largest city of China with the GDP is 456 billion
RMB in 2009.
Figure 1 Map of China
3.1.2 Introduce the regional features and resource advantages of Wuhan
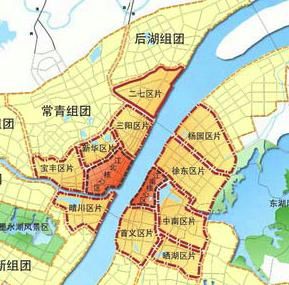
There are some comparative advantages in Wuhan such as natural eco-environment,
educational resources, industry basis, trade and logistics. First of all, from the map of
10Hubei province, we can see there are some big lakes in Wuhan obviously and it along
Yangtze River. It brings Wuhan good natural eco-environment, rich freshwater
resources and tourism resources to attract more business opportunities and
populations to live in there.
Figure 2 Map of Hubei
Secondly, there are high quality educational resources. Wuhan urban agglomeration is
the most densely educational resource area of China, both the quantity of researchers
and the quantity of research results are in the top of China. There are 59 research
institutes, 920,000 full time colleague students, 55 academies, 14 national top
laboratories at the end of 2008. The general strength of science research is the third of
China, only after Beijing and Shanghai. Meanwhile, there is some historical
significance in the city, because it was the birthplace of Chu Culture in ancient history
of China.
Thirdly, there are some abundant strength industries in Wuhan such as WISCO
Company and China Petrochemical Corporation Wuhan Branch. WISCO is short for
Wuhan Iron and Steel Groups Corporation; it commenced its construction from 1955,
and put into production on Sep 13, 1958. It is the first giant iron and steel complex
established after the founding of the People’s Republic of China and one of the
backbone enterprises under the leadership of the Central Government and the State
Council. China Petrochemical Corporation Wuhan Branch gained project of 800000
ton of ethylene which makes Wuhan as the base manufactory and produce supply
center in the middle of China. The two industries consist of the main raw material
suppliers in China.
Lastly, there are advanced commercial and logistical market in Wuhan. As one of the
important commercial cities in China, there are 69 in top 500 companies of the world
11established their branch in Wuhan. Moreover, there are series professional and
general merchandise trade markets which are famous in whole China.
3.1.3 Introduction of transportation1
1. Road
Higher transportation cost is a problem to attract inner and foreign investment and
progress of urbanization in Wuhan. The government did two important policies for
them: one is construct a ring road outside the city and it’s completed early 2008,
another is that the city is building Subway and Light Rail Transport system distribute
in whole city. The prediction of the project will be finished in 2012.
Because the main development zones are around the outskirts of the city, construct a
ring road is convenience for those companies to deliver the product to different cities.
As Wuhan is a big city with large population, going through the city will takes more
than two hours. Ring road is benefit for both citizen and enterprisers. Firstly, the
cargo trucks which pass by Wuhan could go through without entering the city.
Secondly, it will reduce pollution and congestion of the city.
2. Railway
There are 5 main railways through Wuhan as Jingguang, Jingjiu, Wujiu, Handan,
Changjing, and some branch line. The operating railway lines total archived 1129 km
in Wuhan Urban Agglomeration. Wuhan is the only city in China who has three big
train stations because of the high import geographic position.
3. Water transportation
Wuhan City is in the confluence of the Yangtze River and Han River and there are
some inland rivers like Hanbei River, Liangzi Lake, and the operating inland river
lines total archived 3773km, 970 berths in docks. There are 8 bridges across Yangtze
River inner Wuhan urban agglomeration and there are 4 bridges across Yangtze River
building now.
4. Air transportation
Wuhan City has a largest size airport in the middle of China which is named Wuhan
Tianhe International Airport. There are 158 air lines which connected 60 cities;
annual turnover is over 500million populations.
5. Inner city Rail Transit
1
All the resource about transportation of Wuhan is come from , the statistical
data is close at the end of 2007.
12There is 10 kilometers rail transit line inner the city.
6. Pipe transportation
There are 1073 kilometers high pressure and intermediate pressure petroleum and gas
pipe inner the city.
3.2 Introduction of main industry and investment situation in Wuhan
Targeted industries in Wuhan are optoelectronic information, automobile and steel
production, biological engineering and pharmaceuticals. The main economic
development zones are the Wuhan China Optics Valley located in the Wuhan East
Lake High Tech Development Zone (which specializes in laser and optics products) ,
the Wuhan Wujiashan Technology Development Zone (which specializes in the
food and bioengineering industries), and the Wuhan Economic and Technological
Development Zone (which specializes in high-tech and automobile industries). Most
of the technology development zones are led by foreign direct investment. For
example, the earliest and most famous develop zone in Wuhan is Wuhan Economic
and Technological Development Zone which is led by a French automobile company
Citroen and a Japanese automobile company Honda. At the beginning there is a
traditional truck manufactory company with their brand called Dongfeng in Wuhan.
But it is only good at truck industry which is not enough for modern life and
economic development. It attracted foreign investor by the good foundation of truck
industry and technology. There are 7 big automobile industries in the zone; and
meanwhile there are more than 160 auto part companies around them. The
accumulative total investment is 60 billion RMB till 2008. This zone is the biggest
agglomerated automobile industry in China already and the annually output will be 1
million automobile in 2008.
Except for the benefit of local government policy, the cheaper labor cost is another
attraction for foreign investor. Such as Citroen from above example, the French
company closed their factory in middle England (Ryton) and expanding their
investment in Wuhan as their operation strategy recently. The primary reason is lower
labor cost. The most active part of economic globalization is transnational companies.
Their main purpose is seeking the most advantage anywhere. Meanwhile, Wuhan is a
developing city of middle China, the cost of land, laborage, payment, consuming,
transportation are cheap here, so it is a best city for the transnational companies to
establish their industry.
3.3 Introduction of related real estate policies and influences
13The development of real estate industry is very close to the policy direction in China.
Recent year, the government paid attention to real estate industry and concerned about
real estate economic, land transaction, real estate tax, commercial residential,
low-income housing and so on.
3.3.1 Monetary and financial policies in recent year
The most powerful tools for the macroeconomics control by the government are
monetary and financial policies. Belong with financial policies and real estate periodic
adjustment, the government has a series flexible adjustment. Because of economic
crisis there are some adjustments of monetary policy in real estate industry recent year.
From the beginning of 2007 till the end of 2008, the central bank of China adjusted 19
times of RMB (Ren Min Bi) deposit reserve ratio.
Figure 3 Monetary policy adjustment in 2007-2008
Year 2007 Deposit reserve benchmark one year benchmark one year
ratio deposit rate lending rate
2007-01-15
↑0.5%(9.5%) — —
2007-02-25
↑0.5%(10%) — —
2007-03-18
— ↑0.27%(2.79%) ↑0.27%(6.39%)
…… ……
2007-12-21
— ↑0.27%(4.14%) ↑0.18%(7.47%)
2007-12-25
↑1%(14.5%) — —
Year 2008
2008-01-25
↑0.5%(15%) — —
……
2008-06-07
↑1%(17.5%) — —
2008-09-16
— — ↓0.27%(7.2%)
2008-09-25 Exclude main banks
others financial
institutions ↓1%
2008-10-08
— ↓0.27%(3.87%) ↓0.27%(6.93%)
14……
2008-12-05 All banks ↓1%
— —
Medium and small
financial
institutions↓2%
2008-12-23
— ↓0.27%(2.25%) ↓0.27%(5.31%)
2008-12-25
↓0.5%(15.5%) — —
Data resource: People's Bank of China (central bank of China)
From the graph above we can see that deposit reserve ratio raised from 9.5% in the
beginning of 2007 to 15.5% (big size banks) and 13.5% (medium and small deposits
financial institutions) in the end of 2008. Benchmark one year deposit rate decreased
from 2.79% to 2.25% in 2007 to 2008. Benchmark one year lending rate decreased
from 6.39% to 5.31% in 2007 to 2008.
3.3.2 From the view of control
Before September of 2008, in order to control the over-heated development of real
estate market and excessive growth of housing loans, decrease financial liquidity in
the market and reduce economics risk in real estate market, the central bank of China
used tight financial and monetary policy. There is the highest deposit reserve ratio of
17.5% in 7th of June in 2008 which broken historical records in the last 20 years.
Figure 4 Financial institutes’ deposit reserve ratio fluctuate in 2007 to 2008 in China
deposit-reserve ratio
18 16,5 15,5
17 15,5
16 14,5 17,5
15 13 17
14 12 16
13 11 15 16
12 10
11 12,5 13,5
10
9 10,5 11,5
8
9,5
Data resource: People's Bank of China (central bank of China)
As we know, the government published series real estate policies for macroeconomic
control. And there are some more policies by government to control overheated
development of real estate market from the beginning of 2003. Such as, controlling
15land supply; controlling debt of real estate, etc. The purpose of these policies were set
up the standard of development of real estate market; controlling real estate market
was overreached in some areas of China; controlling over investment in real estate
market; controlling over increasing in real estate market in some areas; controlling
low standard reconstruction; controlling unlawful appropriation of cultivated land;
controlling unbalance in real estate debt market. These series of policies bring certain
shocks in the real estate market in Wuhan, it makes some part of customers are
anticipating the housing price to go down and delay their purchase plan. But from
long views, these policies will make the real estate market more mature, rational and
keep the market health and steady development.
3.3.3 From the view of support
From the September of 2008, the government wanted to reduce the negative influence
of international economics crisis, the Chinese monetary and financial policies
changed to accommodative monetary policies to create incentives for company
investment and personal housing consumption. From 16th September of 2008, the
central bank turns down deposit reserve ratio 4 times, turns down benchmark one year
lending rate 5 times till the end of 2008.
Figure 5 Financial institutes’ housing mortgage loan fluctuated in 2007 to 2008 in
China
benchmark one year
lending rate
%
8
7,5 7,47 7,2
7,02 7,29 6,93
7 6,57
6,5 6,66
6,84
6 6,39
5,5 5,58
5,31
5
4,5
Data resource: People's Bank of China (Central Bank of China)
From the graph4 and 5, following the monetary adjustment, we can see that the
deposit reserve ratio decreased from 17.5% to 15.5% in big size deposit financial
institution, the deposit reserve rate decreased from 17.5% to 13.5% in medium and
16small size financial institutions. The benchmark one year lending rate went down
from the highest 7.47% to 5.31% in 2008.
On the other hand, there are some other policies that were issued as support the people
to buy the first house; low income house mortgage loan management; decrease the
first payment of normal residential mortgage loan and so on.
In the beginning of 2005, it was the first time that in government documents shows
that real estate industry was one support industry in Wuhan. It is meaning that the
government will be support, foster and encourage developing real estate market in
Wuhan. The behavior and documents of government made the local people and public
opinions are full of confidence in real estate market, and house price are increasing
with the publish of government document. The government documents also bring
high demand and supply in local market.
3.3.4 Influence by policies
Following the tight financial and monetary policy, there are some influences in the
real estate market. Firstly, the rate of residential mortgage loan kept working at a high
rate. Each commercial bank decides to control personal residential mortgage loan one
after another. The process and requirement turns stricter of mortgage loan for the
purchasers. Secondly, with the influence of the special loan policy of purchase the
second house, it is reduced the purchasing of the house only for investment not for
real living. Because the bank increased the rate of the first payment till 50% of the
total house price. It is a high threshold for most of people. The policy reduced
investment purchasing and real consumer purchasers are remaining hesitant. Thirdly,
some people are worrying about increase the interest rate of mortgage; they decided to
pay the mortgage in advance if they have enough money. Fourthly, the demand and
supply in real estate market are decreasing in most of cities in China in 2008.
Especially, the personal housing consumption mortgage loan is going down rapidly.
Finally, there is an increasing pressure of real estate developers and investors to pay
back the loan and short of cash flow. The developers turn down new real estate
investment and there are more and more housing are on sales.
But from another hand, macroeconomics control will not be hurt the development of
real estate market in China and Wuhan. Maybe there are some negative effects in the
source of money and sales for some real estate developers, but the policies will
control the condition of over higher price in real estate market.
Meanwhile, there would be survival of the fittest in real estate market during the
policies controlling process. Some excellent real estate companies will stand out in
the market, some low level and low strength real estate companies will be eliminated
in policies controlling process. At the end, whole level of real estate industry will
17increase in Wuhan. From another point of view, the government controlling policies
were raised up admittance and requirements for new real estate companies to enter in
real estate industry. It is a threat for some smaller real estate companies but it is a
good opportunities for high strength companies to develop the market.
All in all, belong with the real estate controlling policies; the real estate market will be
more marketization, fairer and more open.
3.3.5 Some new real estate policies of Wuhan
There are some new real estate policies in Wuhan to create incentive for the real
estate market out of the negative influence of international economic crisis in 2008.
1. From tax aspect
The deed tax decreased from 4% to 3% for personal purchasing non-ordinary
residence. The deed tax went down from 2% to 1.5% for personal purchasing
ordinary residence. The first house purchaser with the house area lower than 90
square meters just need to pay half of the transaction fee. No land value added tax for
personal housing transaction.
2. From loan support and interest rate support
The lowest down payment rate decreased to 20%. If you buy an apartment at first time
for the children who is older than 18 years old, the purchasing policy could be treated
as the first housing purchase policy in a family.
3. Migrants could get the registered for permanent residence through house purchase
Migrants could get the registered permanent residence if they buy a house which the
area is over than 100 square meters and the total payment should be exceeded 500,000
RMB.
Among these newly policies, the last one is quite important and useful and meaningful.
Having a registered permanent residence is the difference between urban residents
and rural residents in China. Through the method to buy a house in big city is a main
opportunity for some rich rural residents or people who want to move to another city.
Because the unbalance development in China, the welfare, benefit, retirement pension,
health insurance and education for the children and so on are various in different cities.
There are lots of people even living so many years in big city but they do not get the
registered permanent residence of the city, they can’t have the benefit and welfare of
the city. The standard to get the registered permanent residence in Wuhan is not too
difficult compared with other big size of city as Beijing or Shanghai. Through buying
18a house is a shortcut for some people to be a Wuhan citizen who are living in the
smaller city or town nearby Wuhan. It is the attractive method to get more money for
developing of the city by local government.
3.4 Introduction of the economic development situation and trend in
Wuhan
The growth speed of gross domestic product in Wuhan increase more than 10% every
year after 1990. The growth speed is higher than the average of China. All the
information shows that the growth of economics in Wuhan is in the high speed
increasing period, economic strength is continually expanding in Wuhan. Below is the
table shows the GDP in Wuhan and annual rate of growth GDP from 1998 to 2003
(unit a hundred million Yuan)
Figure 6 GDP and annual rate of growth GDP in Wuhan
Unit: a hundred million Yuan
2000 20%
1662.2
1492.7
15%
1500
1347.8
1206.8
1001.9 1085.7
12% 11.8% 12.1%
1000 12% 10%
11.2% 11%
500 5%
0 0%
1998 1999 2000 2001 2002 2003
GDP Yearly growth
Source: Statistic yearbook of Wuhan in 2004
From the table we can see that there is a rapid increase from 1999 to 2000. From 2000,
the yearly increase rate almost kept in 12% till 2003 and the GDP was raised from
1206.8 hundred million Yuan in 2000 to 1662.2 hundred million Yuan in 2003.
In recent years, the Wuhan city speeds up the transformation of economic growth, the
provincial uses great efforts to optimize the industrial structure. The overall GDP of
this region continues to grow, the economic proportion of Wuhan Urban
Agglomeration occupy the province’s economy has also increased year by year.
19From another part of view, there is an increase of investment in the fixed assets in
Wuhan from 1990. Government statistics shows the rate of investment in the fixed
assets achieved 51.5% in whole economic growth of Wuhan. Meanwhile, the rate of
infrastructure construction and development of real estate are raising the rate in
investment in the fixed assets in Wuhan. Below is a table that shows the investment in
the fixed assets with the annual rate of growth in Wuhan from 1998 to 2003.
Figure 7 Investment in the fixed assets with the annual rate of growth in Wuhan
Unit: a hundred million Yuan
800 16%
645.1
700 14%
570.4
600
12%
508.4
500 461.9
420.4 431.2 10%
400 10.1% 12.2% 13.1%
7.1% 8%
3% 2.6%
300 6%
200 4%
100 2%
0%
0
1998 1999 2000 2001 2002 2003
investment in the fixed assets Yearly growth
Source: statistic yearbook of Wuhan in 2004
3.5 Housing demand analysis in Wuhan
Wuhan is trying to develop high technology industry like fiber optic, automobile,
biological medicine these years. The development of the city is creasing more and
more job opportunities and investment opportunities. The city is attracting more and
more high-quality out-comer to live and work in Wuhan, meanwhile it is attracting
natives to live and work in the city instead of work in big cities as Beijing, Shanghai,
Guangzhou, and etc. There will be a huge housing demand on long terms in Wuhan.
3.5.1 Transportation
20The total mileage of high speed road reached 2300 kilometers in Hubei province
which is the 8th longest high speed road of China. The government of Wuhan raised
the traffic integration within the 8 small cities around Wuhan. It increased
transmission efficiency by logistics, information flows and stream of people. All of
these will lead the 8 small cities increasing the speed for urbanization process. The
urbanization process will enlarge the demand for real estate in some extent.
3.5.2 Increasing the GDP
From the international view of relationship between GDP and real estate development,
if the increasing rate of GDP is higher than 8%, the real estate market will be in high
speed increasing situation. It will raise the demand in real estate market.
3.5.3 Disposable income
The view of disposable income shows that there is an increasing of per capita
disposable income of the urban residential in Wuhan from 1990. The per capita
disposable income is 8525 Yuan in 2003 and the per capita living space for urban
residents exceeded 23 square meters. And the trend is the living conditions will
improve in future in Wuhan.
Figure 8 Per capita disposable income of the urban residential with the annual rate of
growth in Wuhan
Unit: Yuan
8525 15%
10000
7820 9.0%
8000 7305
6761 10%
6262
5913
6000
7.0% 5%
4000
5.9% 8.0% 8.0%
6.1%
2000
0%
0
1998 1999 2000 2001 2002 2003
Per capita disposable income Yearly growth
Source: statistic yearbook of Wuhan in 2004
3.5.4 Consumption
From the view of consumption in Wuhan these years, the consumption is not only for
daily life. The consumption is increasing in some new kind of hot consumption aspect
21such as residential house, automobile, communications and so on. For example, the
total value of retail sales was 12.4 billion Yuan for commercial residential building in
2003 by urban residential of Wuhan.
Figure 9 Total sales amount of consumer goods in Wuhan
Unit: a hundred million Yuan
15%
1000 12.0%
12.3% 13.2% 12.3%
12.3%
800 685.8 770.1 854.0
9.7% 10%
606.1
600
539.6
491.9
400 5%
200
0%
0
1998 1999 2000 2001 2002 2003
Total sales amount of consumer goods Yearly growth
Source: statistic yearbook of Wuhan in 2004
3.5.5 Population demand
We can see Wuhan demographics information below, the population is steady growth
these year. While the people who were born in baby boom years of 1980s are reached
in marriageable age, and the social development, the size of families tend to become
smaller and smaller, and the desire from the children to live separately with their
parents also become stronger and stronger. All of these results in the rigid demand of
residence for owner-occupier, and this part of requirement are not sensitive to the
22price. Besides, in the process of the forming the Wuhan City urban region, the
demolition activity promoted by the Old City reconstruction also makes the potential
demand of residence become rigid one, which increases the requirement for house in
the urban city.
Figure 10 Wuhan demographics from 2000 to 2008
Unit: million people
Year 2000 2001 2002 2003 2004 2005 2006 2007 2008
Total 7.49 7.58 7.68 7.81 7.86 8.01 8.19 8.28 8.33
population
Resource: Wuhan statistic bureau
3.5.6 Investment demand
In 2007, the increasing speed of the residence price slowed down, and the investment
prospect became unclear. All these factors weakened the confidence of investor to
some degree; they just hesitated about their actions. And, because of the recession of
the global economy, the China economy was also impacted. But, due to the sole
channel of doing investment in China, and the bear market of the stock market, real
estate market still attracted the eyes of investor as a relatively safe field to put their
money in. With the 5 years’ macro-control from the Chinese government, the
speculative investment in the real estate market in China is suppressed, but from the
long run point of view, the real estate market still has strong attraction to the investor
due to the existence of inflation pressure and the unrest of the stock market.
3.6 Housing supply analysis in Wuhan
Most of the supplies in Wuhan are normal and traditional residential apartments; there
are not many light spots and special, new creativities design in the local residential
market. Because of high rate of return in investment in real estate market in China,
there are more and more real estate companies going into residential market even
some industries companies are opening their residential apartments or branches. It
looks as a new industry in Wuhan, it is very important to build a famous brand in real
estate market for attracting customers. The real estate market in Wuhan need some
public praise real estate company with their famous brand and good after sales service
and good facilities services to be the leader in the market. The supply situation is the
market is lack of high quality residential and sub districts.
233.6.1 General housing supply information in Wuhan
The total investment in real estate market in Wuhan is about 46 billion Yuan in 2007,
there is a big increasing which is 25.63% compare with 2006 which include the
investment in residential market is about 33 billion Yuan in 2007. The total real estate
construction area is about 32000 thousand square meters which include residential
construction area is about 26600 thousand square meters in 2007. The total
commercial real estate sales 11354 thousand square meters which include residential
real estate sales 10700 thousand square meters in 2007 in Wuhan city. The total
commercial real estate sales 53 billion Yuan and it includes residential real estate
sales 48.3 billion Yuan in 2007. The total commercial vacancy area is 1319 thousand
square meters which include residential vacancy area 507 thousand square meters in
2007.
The residential real estate purchasers come from different groups in the first half of
the year of 2008: 40.52% purchasers are the local citizen but the rate of last year is
58.24%; 35.18% purchasers are the people comes from Hubei province but the rate
from last year is 27.19%; the purchase rate from outside Hubei province is 22.37%
and 14.45% in 2007; the purchase rate from foreigners is 1.93% and 0.12% in 2007.
3.6.2 The influence to house market provision resulted from the quantity of land
supply and land price
Because the land cost is the main part of the cost of real estate, the increasing in land
cost is meaning increasing in net cost for developers. Meanwhile, the quantity of land
supply determined the maxi volume of real estate supply. Land supply including two
parts: one part is the newly increasing of land supply and liquidizing remnant land.
And another part is depending on the marketing, if the market is booming the
developers will be more activity to develop and increasing the supply of the real estate,
vice versa.
From the table below, we can see that the land purchasing situation in Wuhan from
2000 to 2007. The land purchasing of square meters were in a downtrend after 2002.
But the rate of area for developing was increasing in area of land purchasing. Because
of the booming of the economy, the area of land developing is rapidly increasing in
2006 to the first half year of 2008.
Figure 11 Land purchase and develop situation in Wuhan from year of 2000 to the
first half year of 2008
24purchase area develop area
1600
1421,17
1400
1200
964,27 917,38
1000
772,78
800 693,49 471,88
608,85 535,03
600 523,69 511,48 502,87
458,95 428,83 449,73
360,09 322,21
400
191,63
200 53,34
0
2000 2001 2002 2003 2004 2005 2006 2007 first half
year of
2008
From the table above we can see the information of land stock situation in Wuhan.
For example, the total purchase area is 6088 thousand square meters in 2000, besides
the total develop area is 3600 thousand square meters, the difference between those
area is land stock area which is around 2500 thousand square meters. This kind of
land stock area is total archived 23800 thousand square meters from 2000 to 2007.
There will be a huge volume of land supply for Wuhan in future if we plus the unused
area before year of 2000 and the land stock area from 2000 to2007.
3.6.3 The influence for house supply market by GDP and GDP per capita
GDP or GDP per capita is an important index to measure the real estate development
situation for the city. The relationship between GDP, increase speed of GDP per
capita and development of real estate from World Bank Research are below2:
Figure 12 The relationship between increasing speed of GDP and real estate
development
Increasing speed Less than 4%-5% 5%-8% Bigger than
of GDP 4% 8%
Real estate shrink stagnation Steady High speed
development step development development
2
Chen, B.D., Xu,S.H., Chen, N., (2010),”The Effect of Construction of Wuhan Urban Agglomeration on the
Housing Price in Wuhan City”, Social Sciences Academic Press China, PP.400-432
25Figure 13 The relationship between GDP per capita and real estate development
Unit: us dollar
GDP per capita 0-800 800-4000 4000-8000 8000-20000
the step of real starting High speed Steady Slow down
estate period development development development
development period period period
Figure 14 The change of GDP and GDP per capita every year in Wuhan (1999-2007)
year GDP (million Increasing GDP per Increasing
Yuan) rate (%) capita (Yuan) rate (%)
1999 108568.37 -- 14667 --
2000 120684.00 11.16 16206 10.49
2001 134780.00 11.68 17882 10.34
2002 149274.00 10.75 19560 9.38
2003 166218.00 11.35 21460 9.71
2004 195600.00 17.68 24889 15.98
2005 223800.00 14.42 26238 5.42
2006 259076.00 15.76 29890 13.92
2007 314200.00 21.28 35264 17.98
First half year 183309.00 15.6 -- --
of 2008
Resource: statistic yearbook of Wuhan in 2000 to 2008
From the form above we found that the increasing speed of GDP is in high speed
development period after year of 1999 in Wuhan. Because the rate of increasing speed
of GDP in Wuhan was reached 10% every year and GDP per capita was bigger than
800 US dollars. (The current exchange rate of US dollar to Chinese Yuan is 6.65:1)
263.6.4 The influence for housing supply market by housing price
The must have an influence for housing supply by the changing of housing price.
Higher housing price will bring real estate developers higher profit and they will be
more activity to develop the land when the construction cost was fixed. And there is
an indirect influence for housing price. There will be more housing supply when the
housing price is higher than average price. If price of residential real estate is higher
in the market, there will be more profit of residential real estate for developers, and
they will prefer to develop more residential real estate, it brings more residential real
estate supply in the market, vice versa. If the other conditions are fixed, higher
housing price brings more housing supply.
Figure 15 Average prices per sqm. Residential real estate in Wuhan from 2000 to
2008
7000
6000 5824
5000
4518 average price
4000 for residential
3548 real estate
3000
2986
2000
2463
2023
1000 1745 1916
1636
0
2000 2002 2004 2006 first half
year of
Unit: RMB 2008
Figure 16 Average prices of residential real estate market in Wuhan from June 2006
to June 2008.
276500
6118
6000
5717 5916 6072
5500 5742 5797 average
5562 5664
price for
5000 5279 residenti
al real
4837 estate
4500
4187 4459
4000 4283
jun-07 aug-07 okt-07 dec-07 feb-08 apr-08 jun-08
From the figure above we can see that the housing price for residential in Wuhan is
uptrend from year of 2000. The average increasing speed is around 20% after 2004
and it reached 27.34% in 2007. Because the steady increasing of house price the
developer will be optimistic to the situation in future market and they will raise the
supply of residential house in Wuhan. But the increasing speed of house price turns
slowdown from the end of 2007 in table 7.
3.6.5 The influence for housing supply market by operation situation of
construction
The real estate operation ability shows directly from volume of construction areas and
complete construction areas.
Figure 17: The real estate development information from 1999 to 2007 in Wuhan
Unit: million square meters
Construction Complete Newly
year Vacancy area
area area started area
1999 8.60 3.37 3.75 --
2000 10.31 4.26 4.88 1.57
2001 12.08 5.00 5.07 2.07
2002 13.87 5.23 6.35 2.07
2003 16.20 6.00 6.59 1.23
2004 20.12 6.09 8.97 0.70
282005 22.98 7.22 10.48 1.09
2006 24.29 7.74 9.68 1.28
2007 26.60 8.12 10.38 0.51
First half
22.59 2.33 6.21 0.69
year of 2008
Resource: statistic yearbook of Wuhan in 2000 to 2007
The research shows the average complete construction of real estate is above 6
million square meters in Wuhan. Besides, real estate construction areas and complete
construction areas are upwards trends yearly.
3.6.6 The influence for housing supply market by government policy
There are some prerogatives and power by the government for land using in China.
For example, the local government has the power to decide the land to be used as
residential real estate or commercial real estate; the credit issued from bank to
developers was directed by government policy.
From the side of land, the government published a series of policies to tighten the
limit of land from the year of 2004. The policies reduced supply of land besides it
reduced supply of residential real estate. After that, the government adjusted the land
supply policy to enlarge the land supply to medium and small size residential use.
Meanwhile, the government had policies against developer is that was hoarding land.
If the developers didn’t operate the land after one year in contract it will be charged
land vacancy fee to the developers. The government has the power to retake the land
if the land was unused in two years.
From the side of bank, the government published a policy that the equity must be
above 30% for developers to get the loan from bank in June of 2003. The equity rate
changed to 35% in February of 2004.
3.7 Description and introduction of Xiaogan city
3.7.1 Why choose Xiaogan as their target
The parent company of Fuxing is located in one subordinate city which belongs to
Xiaogan. It has a good relationship with local government. And when a company
29turns big it always wants to do something contribution for its hometown to gain a
good in fame. That’s a simple guess why the company chooses Xiaogan as their first
station for the extension to secondary cities.
3.7.2 Introduce of Xiaogan
Xiaogan is a secondary city in Hubei province. The south part of Xiaogan connects
with Wuhan which is the capital of Hubei province. It has the longest common
boundary with Wuhan compare with other secondary cities in the province. The
distance is around 100 km between two cities and it takes about an hour's drive by car.
There is 11600 sq.km and population is 5.8 million which includes 0.3 million
population in inner urban district.
3.7.3 Demand analysis in Xiaogan
From demand of the market, the government policy is encouraged to develop and
invest in the medium size of cities. There is a trend that some manufacture companies
will establishing their factory in medium and small cities to replace of big cities
because of high cost in big cities. The company will get more loan and preferential
policies to invest in medium and small cities. It will lead that more and more people
come back to their hometown as Xiaogan to work who were used to work in southeast
coast of China. It’s a reason of increase of demand of new house.
China has opened its market several years, some people have been worked out of their
hometown many years from early period, and they already got enough money, it’s the
retire time for them to back and buy an apartment to spend their rest live.
Not all the successful people were born in big cities. Another demand comes from the
young and middle-aged people who are success with their work. In traditional
Chinese culture it is the time to repay to their parents. Maybe these kinds of people
are still working in big cities but their parents are living in their hometown. A
comfortable and high level of apartment and low price compare with big cities for
them is not difficult to afford. And it is an asset and low risk investment for people to
buy a house. And maybe they will consider back to stay their hometown as their
parents when they are retired.
Compare with other big cities, the supply of house types are quite simple in Xiaogan.
The situation supplies of house are simple and traditional types of apartment. There is
a demand for different types and high level of house in Xiaogan. The apartments with
big and more than one balconies are successful in Wuhan, Fuxing copied the business
model and the design of house in Wuhan then introduce this kind of apartment to
Xiaogan and they hope it will bring more profit as they got in Wuhan.
30There is another demand that comes from government. The local government wants to
raise the level of the city through attract such a big real estate investment. It will bring
a lot of opportunity for local employment. High level of houses is a symbol of high
level of cities. High level of house with high price will lead an increase of average
price of house in the city. It’s an incentive of local economic and brings more tax for
the local government. When the company just opened, they sold the apartment with
3000-3500 Yuan per square meter, and in 2007, the average price in the city was
about 1500-2000 Yuan per square meter. At present the price of per square meter sold
by Fuxing is the highest apartment in Xiaogan city.
31You can also read