Super Typhoon HAIYAN in Tacloban City & Leyte, Philippines
←
→
Page content transcription
If your browser does not render page correctly, please read the page content below
Super Typhoon HAIYAN
              in Tacloban City & Leyte, Philippines
                  Data & documentation from the landfall zone of a Category-5 cyclone.

storm               Super Typhoon HAIYAN (YOLANDA)
location & date     Tacloban City & Leyte, Philippines – 08 November 2013
report date         03 April 2014
author              Josh Morgerman                        version           1.0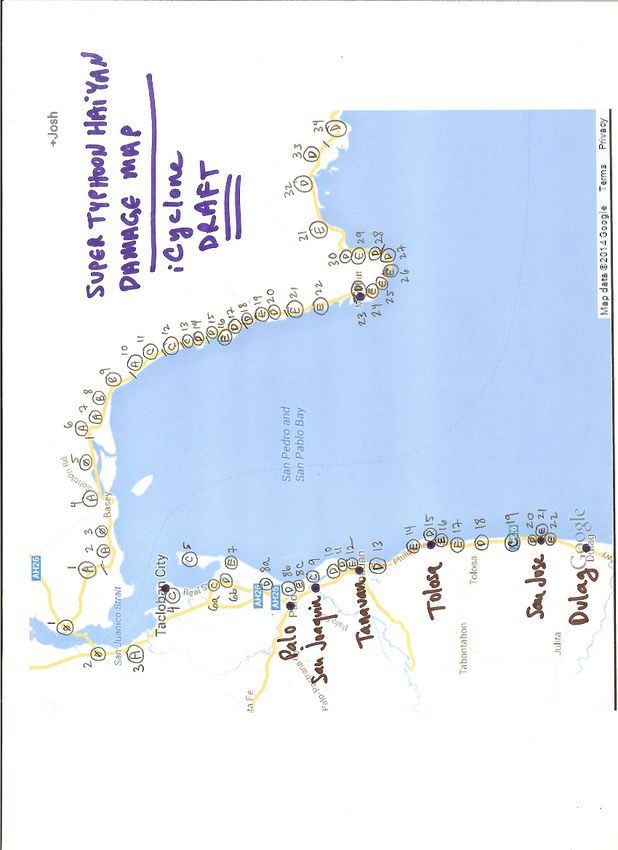
__

Contents
1.    INTRODUCTION ......................................................................................................................................... 1
      1.1       Purpose........................................................................................................................................... 2
      1.2       Background & Scope .................................................................................................................... 2
2.    LEYTE (GROUND SURVEY) ...................................................................................................................... 3
      2.1       Radar Track .................................................................................................................................... 4
      2.2       Wind Eye (& Center) ...................................................................................................................... 4
                2.2.1 Methodology ........................................................................................................................ 4
                2.2.2 Analysis & Findings ............................................................................................................. 5
      2.3       Wind Damage & Radii .................................................................................................................... 7
                2.3.1 Methodology ........................................................................................................................ 7
                2.3.2 Analysis & Findings ............................................................................................................. 9
3.    TACLOBAN CITY (DATA) ........................................................................................................................ 13
      3.1       Location ........................................................................................................................................ 13
      3.2       Chronology ................................................................................................................................... 14
      3.3       Air Pressure ................................................................................................................................. 14
                3.3.1 Methodology ...................................................................................................................... 15
                3.3.2 Analysis & Findings ........................................................................................................... 15
      3.4       Winds ............................................................................................................................................ 18
                3.4.1 Downtown .......................................................................................................................... 18
                3.4.2 S Tacloban (& San Jose Neighborhood) ........................................................................... 20
                3.4.3 Airport ................................................................................................................................ 20
      3.5       Storm Surge ................................................................................................................................. 21
                3.5.1 Methodology ...................................................................................................................... 22
                3.5.2 Analysis & Findings ........................................................................................................... 22
4.    CONCLUSION ........................................................................................................................................... 28
5.    APPENDICES............................................................................................................................................ 29
      5.1       A. Eyewitness Interview Notes ................................................................................................... 29
      5.2       B. Damage Scale Examples ........................................................................................................ 39
      5.3       C. Wind Damage Plots ................................................................................................................. 41
      5.4       D. Wind Damage Images ............................................................................................................. 43
      5.5       E. Landfall Radar Images—Close .............................................................................................. 44
      5.6       F. Tacloban City Tide Tables ...................................................................................................... 45

__

© 2014 Josh Morgerman / iCyclone (www.icyclone.com)                              iCyclone Report: Super Typhoon HAIYAN in Tacloban City & Leyte – 04.03.14
                                                                                                                                               page ii / 47
__

1. Introduction
On the morning of 08 November 2013, Super Typhoon HAIYAN (known by Filipinos as YOLANDA) struck
the Eastern Visayas region of the Philippines.

After first brushing S portions of the island of Samar in the early-morning darkness, the cyclone came ashore
on the island of Leyte just after dawn. The region’s capital, Tacloban City (pop. 221K), was in the firing line,
experiencing a direct hit from the cyclone’s inner core as the center crossed the coast ~14 n mi S of
Downtown.

HAIYAN was extremely severe at landfall in Leyte—a Category 5 on the Saffir-Simpson Hurricane Wind
Scale. Tacloban City is therefore the largest population center to receive a direct hit from such a strong
cyclone since Santo Domingo, Dominican Republic, was stricken by Hurricane David in 1979.

It’s difficult to overstate the storm’s impact on this region. The destruction was massive, and death-toll
estimates range from 6,000 to >10,000, making HAIYAN by-far the deadliest Philippines typhoon since the
    th
19 century.

Figure 1. Infrared satellite image of HAIYAN as it approached the Philippines, the night before landfall (1657Z
07 Nov 2013).

__

© 2014 Josh Morgerman / iCyclone (www.icyclone.com)     iCyclone Report: Super Typhoon HAIYAN in Tacloban City & Leyte – 04.03.14
                                                                                                                      page 1 / 47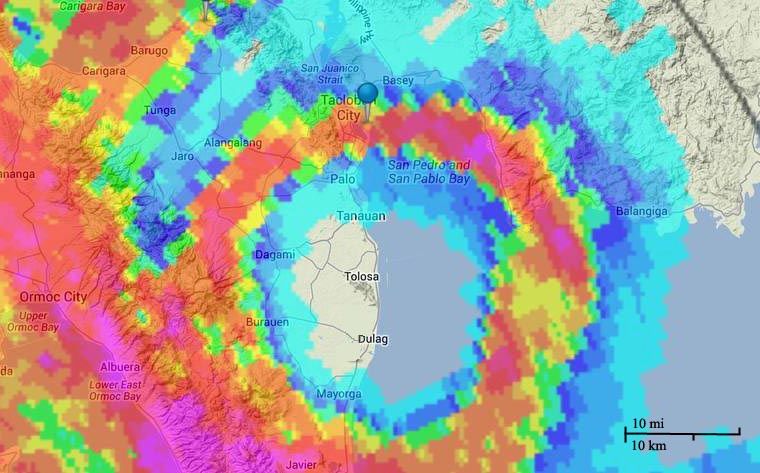
__

1.1           Purpose
HAIYAN struck a region of the world that isn’t covered by reconnaissance aircraft. The few weather stations in
the typhoon’s landfall zone—for example, Tacloban City’s airport—delivered sparse, incomplete data from the
event. The nearest radar site, Cebu City, is ~80 n mi from the landfall point and >85 n mi from Tacloban City.
Much of the stricken region is sparsely populated, with many residents living in small villages, in poverty.

Given all this, we're still learning about what happened in the typhoon’s direct-impact zone—that is, the
stretch of Leyte coast stricken by the typhoon’s inner core.

This report attempts to add to the growing body of knowledge about this typhoon’s meteorological
impact in Leyte.

1.2           Background & Scope
The author was in Tacloban City during the typhoon, collecting data, recording the event on time-stamped
video, and making detailed observations. The author returned to the region in late February and early March
2014 to research the cyclone’s impact in Leyte and Samar. These two expeditions—during and after the
typhoon—form the basis of this report.

Despite the above, this report is not comprehensive. It simply documents the data and information the
author was able to collect on the ground, in Leyte and neighboring Samar, during the two expeditions.
__

The author hopes that parties studying the impact of Super Typhoon HAIYAN will find this report helpful, and
that it will be a useful addition to the body of knowledge about this historic storm.

__

© 2014 Josh Morgerman / iCyclone (www.icyclone.com)     iCyclone Report: Super Typhoon HAIYAN in Tacloban City & Leyte – 04.03.14
                                                                                                                      page 2 / 47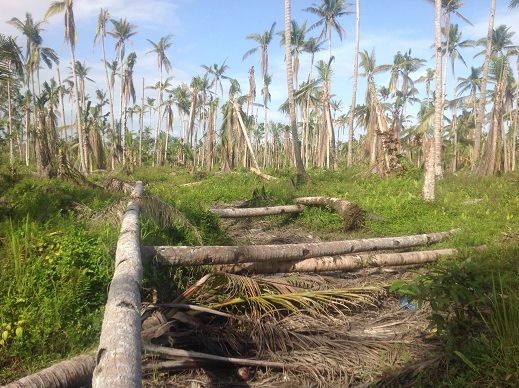
__
2. Leyte (Ground Survey)
Super Typhoon HAIYAN moved WNW across the Leyte Gulf, impacting portions of Samar before the center
crossed the Leyte coast just after 7:00 am PHT. At landfall, the storm was moving rapidly, at >20 kt. Agency
estimates of the maximum sustained (1-min/10-m) winds at landfall range from 140 kt (JMA—converted from
a 10-min wind of 125 kt) to 170 kt (JTWC). JMA estimates a central pressure of 895 mb.
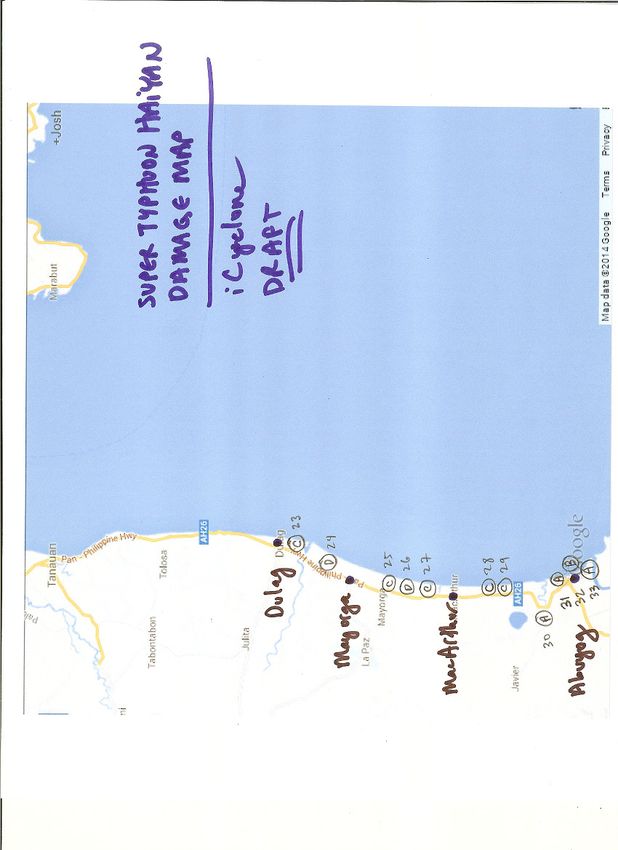
Below is a map of HAIYAN’s Leyte landfall, followed by an explanation of how each map feature was derived:
Figure 2. Map of HAIYAN’s Leyte landfall (referred to throughout this document as the Landfall Map).
__
© 2014 Josh Morgerman / iCyclone (www.icyclone.com) iCyclone Report: Super Typhoon HAIYAN in Tacloban City & Leyte – 04.03.14
page 3 / 47
__

2.1           Radar Track
Center positions (small green circles) represent the geometric centers of the eye, as derived from
PAGASA’s Cebu City radar imagery. These center positions can be used to reconstruct a storm track.

While HAIYAN was generally moving WNW, note that the center was wobbling almost due W at the time it
crossed the coast.

The radar center made landfall at ~7:05 am PHT near 11.03N 125.04E. This location (marked with an X in a
green circle) is:

     •    ~1.8 n mi S of Tolosa (Downtown)
     •    ~12.6 n mi S of Tacloban City (Downtown)

2.2           Wind Eye (& Center)
The large grey circle represents the approximate size and location of the wind eye at landfall. This was
derived via eyewitness interviews.

2.2.1         Methodology
Residents who rode out the cyclone in towns along the Leyte coast were interviewed. The objective:
determine the location/dimensions of the typhoon’s wind eye.

There were over 40 interview subjects, spread across the following towns (going from N to S):

     •    Tacloban City
     •    Palo
     •    San Joaquin
     •    Tanauan
     •    Tolosa
     •    San Jose
     •    Dulag
     •    Mayorga
     •    MacArthur
     •    Abuyog

Subjects were approached in busy market areas and civic centers in each town. (Most residents of this
region—across all socioeconomic levels—have some English proficiency, but a translator was on-hand.)

Willing subjects were asked to verify their location during the storm, then to describe what happened. While
all details were interesting, the primary goal in each interview was to understand if the subject had
experienced a calm or lull during the storm.

The author did his best to avoid asking “leading questions”—that is, ones that lead the interviewee to favor a
specific answer. So, for example, “Did you experience the eye?” was not an interview question. However,
subjects were sometimes asked questions like, “Was the wind strong the whole time, or did it change at some
point?” or, “Did the wind ever stop, or did it just keep going?”

Almost all subjects had been through the core of a violent, deadly typhoon, and interviews needed to be
conducted with appropriate sensitivity. Almost all subjects reported being very frightened during the storm.
Most experienced heavy damage to their dwellings, and many had been left homeless. Many had harrowing
stories of escape—for example, swimming across storm surge and riding out the cyclone clinging to a
coconut tree in powerful winds.
__

© 2014 Josh Morgerman / iCyclone (www.icyclone.com)    iCyclone Report: Super Typhoon HAIYAN in Tacloban City & Leyte – 04.03.14
                                                                                                                     page 4 / 47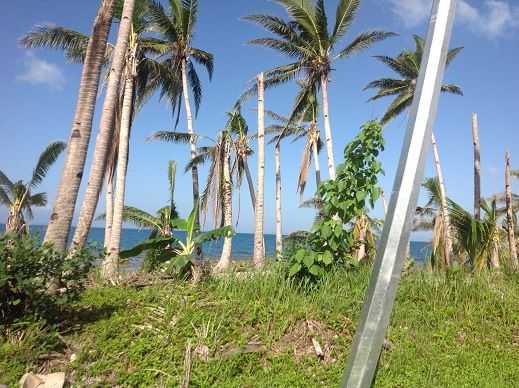
__

Given the above, subjects’ memories—and the sequences of events—weren’t always clear, and the
described timing and duration of events are not assumed to be completely accurate. Multiple subjects were
interviewed in each town, and in cases of conflicting accounts, judgment calls needed to be made.

Note: While this survey focuses solely on whether each subject experienced calm, see Appendix A for the
full account from each subject. There are many fascinating details.

2.2.2         Analysis & Findings
Following is a tally of reports from each town.

Y = definitely experienced distinct calm
N = definitely experienced no calm
M = experienced fluctuations, lessening, or can’t remember

     •    Tacloban City: numerous N (includes author’s firsthand recollection)
     •    Palo: 6N, 1Y
     •    San Joaquin: 1N, 3M (includes group interview—with father & daughter)
     •    Tanauan: 2N, 3M (includes group interview—with husband & wife), 2Y, 1?
     •    Tolosa (Downtown): 4Y
     •    Tolosa (S): 2Y (group interview—with husband & wife)
     •    San Jose: 3Y(group interview—with extended family)
     •    Dulag: 3Y, 1N
     •    Mayorga: 2M (group interview—with relatives), 1N, 1?
     •    MacArthur: 2N
     •    Abuyog: 2N

As can be seen, multiple residents in Tolosa, San Jose, and Dulag reported distinct calm, so these towns
are deemed to have been squarely in the typhoon’s eye. (The one report of no calm in Dulag is
discounted because of a serious language barrier, and it doesn’t jibe well with all other accounts there.)

But how far N and S did the eye reach?

2.2.2.1          Eye’s N Boundary

The one report of calm in Palo is discounted because 1) it conflicts with many other reports in Palo; 2) it’s
several miles N of any other reports of a calm; and 3) her recollection of the timing doesn’t jibe well with other
data. Both San Joaquin and Tanauan seem to have been in a sort of “border zone,” as several residents in
these towns seemed unsure of whether they’d had a calm—describing fluctuations or lessening in the wind.
However, two particularly articulate subjects in Tanauan—including a town worker who rode out the cyclone
in Town Hall—independently reported distinct calms, and they corroborate on a duration of 5-10 minutes.

Given the above: the N boundary of the eye is estimated to have passed between San Joaquin and
Tanauan, with Downtown Tanauan clipping the N edge of the eye and experiencing a very brief calm.

     •    Latitude of eye’s N boundary at landfall: 11.13N

2.2.2.2          Eye’s S Boundary

Dulag is believed to have been in the S portion of the eye. Subjects in MacArthur and Abuyog did not report
calm. This leaves Mayorga—the town in between—where two subjects reported fluctuations in the
windspeeds, one reported no calm, and one yielded no conclusion. It seems Mayorga was the border zone.

__

© 2014 Josh Morgerman / iCyclone (www.icyclone.com)      iCyclone Report: Super Typhoon HAIYAN in Tacloban City & Leyte – 04.03.14
                                                                                                                       page 5 / 47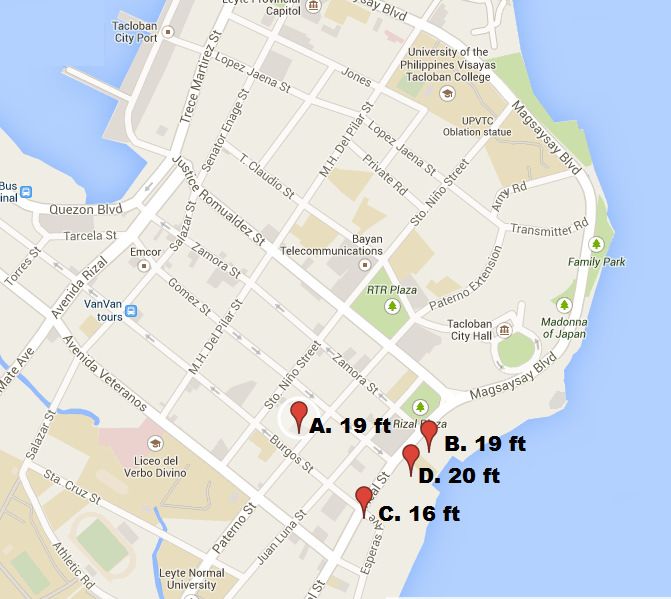
__

Given the above: the S boundary of the eye is estimated to have passed near Mayorga, with Dulag (to
the N) squarely in the eye and MacArthur (to the S) definitely outside of the eye.

     •    Latitude of eye’s S boundary at landfall: 10.90N

2.2.2.3          Eye’s Dimensions

The estimated N and S boundaries of the eye suggest the following dimensions at landfall:

     •    Eye Diameter = ~14 n mi
     •    Eye Radius = ~7 n mi

2.2.2.4          Landfall Point

The midpoint between the wind eye’s estimated N and S boundaries at landfall is 11.015N, and this is
deemed to be the center’s latitude at landfall.

Given this, the wind center is estimated to have made landfall shortly after 7 am PHT near 11.015N
125.04E. This location (marked with an X in a white circle) is:

     •    ~2.7 n mi S of Tolosa (Downtown)
     •    ~13.5 n mi S of Tacloban City (Downtown)

2.2.2.5          Radar Center vs. Wind Center: Comparison

There’s surprisingly good corroboration between the radar center and analyzed wind center.

The two centers are less than 1 n mi apart at landfall (with the radar center N of the wind center). Also, the
radar-eye boundaries correspond very well with the wind-eye boundaries (derived via eyewitness interviews).
Compare the Landfall Map (Figure 2, above) with the Radar Image (Figure 3, below):

Figure 3. Radar image of HAIYAN’s inner core at 07:00 PHT, near the time of landfall in Leyte.
__

© 2014 Josh Morgerman / iCyclone (www.icyclone.com)    iCyclone Report: Super Typhoon HAIYAN in Tacloban City & Leyte – 04.03.14
                                                                                                                     page 6 / 47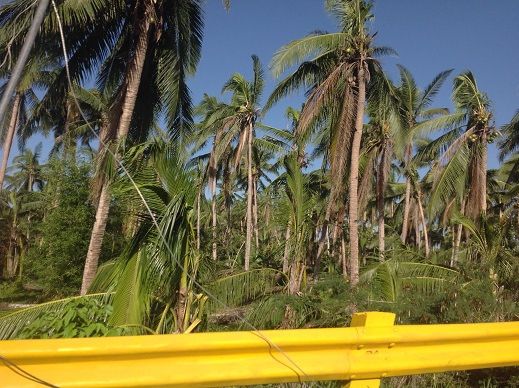
__

2.3           Wind Damage & Radii
The color coding shows the relative severity of the wind damage that occurred at (or near) the immediate
coast. The thickness of the colored area is exaggerated to enhance map readability.

While this report focuses primarily on HAIYAN’s Leyte impact, the effects in W Samar are included to give
wider context.

2.3.1         Methodology
Wind damage along the Leyte and Samar coasts was surveyed and documented. The objective: determine
the location/dimensions of the typhoon’s core, including relative wind radii and location(s) where the
highest winds occurred.

Please note: This survey assesses the location/dimensions of the typhoon’s core solely by comparing
damage severity between different locations. Estimating actual windspeeds is beyond the scope of this
survey, and therefore no conclusions regarding the storm’s intensity are offered.

2.3.1.1          Survey Area

Two ground surveys were performed on different days:

      •   Heading N from Tacloban City into extreme-N Leyte, across San Juanico Strait, then E across the S
          coast of Samar to Guiuan.
      •   Heading S from Tacloban City, down the E coast of Leyte to Abuyog.

2.3.1.2          Process

With a couple of special exceptions, the survey focused solely on wind damage to coconut palms—for two
reasons: 1) these are a plentiful feature all along the coast of the stricken region, thus offering a reliable way
to compare damage between locations; 2) assessing the relative quality of building construction in the
stricken area is outside the scope of this survey.

The process was as follows:

     1. Photos were taken of clusters of coconut palms at multiple points along the coast (34 points in
        Samar and 36 in Leyte). The distance between points was usually 2 n mi or less. Locations were
        recorded via GPS.
     2. Damage to palms at each point was rated on a relative scale from A to E (see next section).
     3. Points were plotted on a map and color-coded to reflect the damage rating.
     4. Where necessary, damage zones between points were interpolated to form a continuous band of
        color along the coast.

The result is shown in the Landfall Map (Figure 2, above). Appendix C shows the hand-plotted, numbered
points, with damage ratings.

Photo data from Abuyog are admittedly sparse. For this reason, a YouTube video showing numerous still
photos from the town right after the typhoon was used to supplement the estimates:
http://youtu.be/wAmhUG3UtFk

__

© 2014 Josh Morgerman / iCyclone (www.icyclone.com)      iCyclone Report: Super Typhoon HAIYAN in Tacloban City & Leyte – 04.03.14
                                                                                                                       page 7 / 47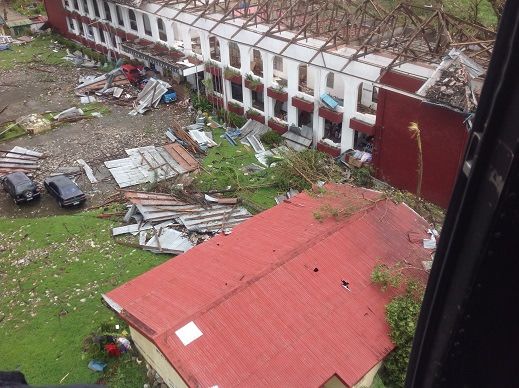
__

2.3.1.3          Damage Scale

The scale levels are as follows—with all damage descriptions pertaining to coconut palms. Examples are
shown in Appendix B:

     •    Level A: Strong. Light damage to palms, including minor tearing off or bending of fronds.
     •    Level B: Very Strong. Moderate damage to palms, including some (but not many) fronds torn off or
          badly bent.
     •    Level C: Severe. A wide category indicating extensive damage to palms. Examples include many
          fronds torn off or badly bent, and some trees blown town.
     •    Level D: Violent. Many palms snapped off at the trunk (but 50% of palms snapped off at the trunk and/or complete or near-complete
          defronding.

This damage scale does not indicate specific windspeeds, nor does it map to Saffir-Simpson Hurricane Wind
Scale categories. It is a purely relative scale, aimed only at comparing the severity of damage between
different locations. The objective was to understand the cyclone’s dimensions and the location of the
highest winds, not estimate the actual windspeeds.

Because the survey focused solely on wind damage to coconut palms, this meant:

     •    Building damage was generally not considered, as assessing the relative quality of building
          construction in the stricken area is outside the scope of this survey.
              o Exceptions. Two points that saw major wind-induced failures of concrete buildings (Point 6b
                  in S Tacloban City and Point 8a in Palo) were assigned Level D in the absence of sufficient
                  palm images. (See Figure 4 & 5, below.)

     •    All of the assessed damage is wind damage—not water damage. The palms analyzed were
          above the surge line (except for the bases in many cases). San Joaquin is an example of an area
          with extreme storm surge damage (much of the town was destroyed and there were many fatalities)
          that had a relatively low rating, because no examples of wind damage above Level C were seen. The
          same applies to Downtown Tacloban City: large sections of the City were leveled, but as it seemed to
          be mostly water damage, the highest rating in Downtown was Level C.

Figure 4. Major wind-induced failure of a concrete commercial building in the S part of Tacloban City (Point
6b on the plotted map in Appendix C). Given the absence of coconut-palm images at this point that
apparently experienced very high wind, this was considered in the survey and assigned Level D.

__

© 2014 Josh Morgerman / iCyclone (www.icyclone.com)     iCyclone Report: Super Typhoon HAIYAN in Tacloban City & Leyte – 04.03.14
                                                                                                                      page 8 / 47
__
Figure 5. Major wind-induced failure of a concrete building in N Palo (Point 8a on the plotted map in
Appendix C). Given the absence of coconut-palm images at this point that apparently experienced very high
wind, this was considered in the survey and assigned Level D.
Additional notes regarding the inherent limitations of this survey:
• Damage ratings are inevitably subjective. Assigning a rating was not always a cut-and-dried
verdict because 1) damage was streaky and 2) many locations showed combinations of damage
levels—for example, numerous snapped-off palms next to others that still had many fronds. In such
instances, judgment calls had to be made.
• Damage zones on the Landfall Map are approximate. The scope of the survey did not allow for
documenting every mile of the coast, and some town centers didn’t have coconut palms. Given this,
damage zones had to be interpolated between the 70 documented points, and the map should not be
viewed as precise down to the mile. Refer to Appendix C to view the 70 points that were plotted and
rated.
Despite these limitations, the author believes the Landfall Map gives the user a valuable overview of Super
Typhoon HAIYAN’s core dimensions, including the radial extent of destructive winds and the location of the
highest winds.
2.3.2 Analysis & Findings
The wind-damage survey yields valuable insights regarding HAIYAN’s core structure at landfall:
2.3.2.1 Eyewall
In some cyclones, the eyewall—that is, the inner ring of deep convection and destructive winds surrounding
the eye—is not easy to precisely define. In HAIYAN, however, the eyewall was a distinct, sharply-defined
structural feature—both on radar and on the ground—with clear boundaries and at least a partial moat
surrounding it.
On the Landfall Map, the Eyewall is defined by the radial extent of severe (Level C) winds. N of the
center, this zone extends only a little beyond Downtown Tacloban City. As can be seen, wind damage drops
off dramatically outside of this ring. Based on this:
• Eyewall Radius = ~15 n mi
__
© 2014 Josh Morgerman / iCyclone (www.icyclone.com) iCyclone Report: Super Typhoon HAIYAN in Tacloban City & Leyte – 04.03.14
page 9 / 47__
Two other sources support this estimate of ~15 n mi:
• Radar. Radar imagery, as shown in Figure 3 and Appendix E, also suggests the N eyewall
reached—but did not extend much beyond—Tacloban City. Notice the distinct moat NW and N of the
eyewall. (Note: Radar images, especially at this distance, are not expected to precisely reflect
conditions on the ground.)
• Video from Tacloban City. The author shot continuous, time-stamped video in Downtown Tacloban
City during the typhoon. The video clearly shows the arrival and exit of the eyewall, as well as the
preceding moat:
o Moat. The sky brightens around 6:32 am PHT, as the moat passes over.
o Eyewall Arrives. A sudden and dramatic increase in rain and winds (to very destructive
speeds) occurs ~6:45 am. Extremely turbulent conditions increase and peak between 7:10
and 7:30 am, when winds are most intense and visibility is near zero.
o Eyewall Exits. Video shows extremely turbulent conditions (and destructive winds)
continuing until at least 7:31 am. By 7:45 am, video shows conditions have markedly
improved—the rain is much lighter, the winds have lessened (though they’re still dangerous),
and the sky has brightened. Given this, the eyewall cleared Downtown sometime between
7:30 and 7:45 am, and it’s estimated to have occurred at ~7:40 am.
Measuring the distance from the approximate radar center to Downtown at the time of eyewall entry
(~6:45 am) and exit (~7:40 am) yields distances of ~14-16 n mi.
(Note: The author’s video footage referenced above can be viewed at these links:
http://youtu.be/4wrgrJwYdy8 and http://youtu.be/133F6-5qi2w.)
2.3.2.2 Radial Extent of Violent Winds
On the Landfall Map, the Radial Extent of Violent Winds encompasses locations experiencing at least
violent (Level D) winds. N of the center, this zone extends to the S neighborhoods of Tacloban City. Based
on this:
• Radial Extent of Violent Winds = ~12 n mi
Embedded within this larger zone of violent (Level D) winds were small streaks or pockets of extreme
(Level E) damage. These locations—from N to S—were:
• Point 7: S Tacloban City (San Jose neighborhood)
• Point 8c: Palo
• Point 12: Tanauan
• Point 14: Tolosa
• Point 16-17: Tolosa
• Points 21-22: San Jose
Figure 6 shows the palms at these locations of extreme (Level E) damage. As can be seen, >50% of the
palms are snapped off at the trunk in all of these images.
__
© 2014 Josh Morgerman / iCyclone (www.icyclone.com) iCyclone Report: Super Typhoon HAIYAN in Tacloban City & Leyte – 04.03.14
page 10 / 47__
S Tacloban City (San Jose neighborhood) (Point 7) Palo (Point 8c)
Tanauan (Point 12) Tolosa (Point 14)
Tolosa (Points 16-17) San Jose (Points 21-22)
Figure 6. Instances of extreme (Level E) wind damage along the Leyte coast, going from N to S. All images
were taken months later.
__
© 2014 Josh Morgerman / iCyclone (www.icyclone.com) iCyclone Report: Super Typhoon HAIYAN in Tacloban City & Leyte – 04.03.14
page 11 / 47__
2.3.2.3 Radius of Maximum Winds (RMW)
A precise Radius of Maximum Winds (RMW) has not been determined. However:
• The eye radius was ~7 n mi.
• The instance of extreme (Level E) damage furthest from the center is Point 7—which is ~11 n mi
from the center.
Wind damage at Points 12, 14, 16, and 17 is perhaps more severe than Points 7 and 8c (further N)—and,
it’s possible Points 7 and 8c were isolated incidents caused by localized disturbances (i.e., eyewall
mesovortices or microbursts). If this is accepted—that the damage at Points 12, 14, 16, and 17 was both
heavier and more representative of the storm’s circulation—then the wind max was likely WNW or ENE of the
center, not due N, since these four points were N of the center but in the eye. Unfortunately, this doesn’t
help us narrow the RMW range—and, in fact, it could be even greater than 11 n mi, as it’s unknown how far
WNW or ENE of the center these extreme winds might have occurred. It’s possible these winds were as much
as ~15 n mi from the center (the outer edge of the eyewall, as determined from radar and analysis).
However, the strongest winds were most likely in the inner portion of the eyewall.
Given this, the author believes the RMW was very likely between 7 and 11 n mi.
Wherever the RMW falls in this range, this makes HAIYAN a small typhoon.
__
© 2014 Josh Morgerman / iCyclone (www.icyclone.com) iCyclone Report: Super Typhoon HAIYAN in Tacloban City & Leyte – 04.03.14
page 12 / 47__
3. Tacloban City (Data)
The author rode out Super Typhoon HAIYAN in Downtown Tacloban City.
The cyclone’s center crossed the Leyte coast ~14 n mi S of Downtown, and came to within ~13 n mi at its
point of closest approach. Downtown was raked by the cyclone’s N eyewall, with the RMW and the ring of
most-violent winds passing a little S of the City center. A tremendous storm surge inundated most of
Downtown, leveling large areas of the City and causing thousands of deaths.
Despite the great danger, this was a unique opportunity to observe, document, and analyze a violent cyclone
from the inside. It’s exceedingly rare for an experienced observer to shoot video and collect data from the
inner core of a Category-5 cyclone.
This section documents the author’s rare data from this event, along with follow-up postanalysis.
3.1 Location
The author observed the typhoon’s passage from Hotel Alejandro, in the heart of Downtown, about three
blocks from the waterfront (11.2414N 125.0036E).
Figure 7. The location from which the author observed the passage of HAIYAN.
__
© 2014 Josh Morgerman / iCyclone (www.icyclone.com) iCyclone Report: Super Typhoon HAIYAN in Tacloban City & Leyte – 04.03.14
page 13 / 47__
3.2 Chronology
The cyclone was small and fast-moving—so it didn’t last long.
HAIYAN dealt a fast but devastating blow to Downtown. Following is a chronology of the event. Times
(PHT) are rounded to the nearest 5-minute increments:
• 6:30 am. Sky brightens, rain tapers in Downtown as “moat” passes over.
• 6:45 am. Eyewall arrives; wind & rain increase dramatically.
• 7:10 – 7:30 am. Peak winds, with particularly extreme gusts around 7:25 am.
• 7:12 & 7:20 am. Lowest air pressure (two devices).
• 7:30 am – 7:45 am. Storm surge inundates Downtown as eyewall pulls away. Lighting & thunder
observed.
• 8:00 – 8:15 am. Peak storm surge.
• 8:45 am. Winds & storm surge rapidly receding.
Note that:
• Peak winds (and heaviest rain) occurred near and after the center’s closest approach, in the NE
eyewall, as the center pulled away from the City.
• Peak storm-surge inundation occurred after the peak winds—after the eyewall had passed.
• Very destructive winds and storm-surge inundation lasted only a couple of hours—basically from
~6:45 am to ~8:45 am. This was a short-duration event compared with a typical tropical-cyclone
impact.
The above chronology and observations were reconstructed afterward from the author’s time-stamped video
footage of the event. Highlights can be viewed in these two online videos:
• Entire event (12:34): http://youtu.be/4wrgrJwYdy8
• Eyewall only (6:19): http://youtu.be/133F6-5qi2w
All footage is time-stamped in local time (PHT).
3.3 Air Pressure
Data from two devices suggest an extremely steep core gradient.
The author deployed two devices for measuring air pressure and collected continuous, quality-controlled data
during the entire passage of the typhoon’s core over this location. Lowest pressures and times (PHT) are as
follows:
• Device 1: 960.4 mb at 7:12 am (corrected from original 960.8 mb)
• Device 2: 959.9 mb at 7:20 am (corrected from original 960.3 mb)
Please note that these values are corrected 0.4 mb from the initial readings, as the devices had been
calibrated with a slightly incorrect elevation (see Methodology—Calibration, below).
The complete data traces for both devices appear below, in Figures 8-11. The healthy corroboration between
the two instruments, spaced four stories apart, gives some confidence to these readings—but not 100%. As
far as the author knows, these are the only complete, quality-controlled pressure data from HAIYAN’s
inner core at landfall.
__
© 2014 Josh Morgerman / iCyclone (www.icyclone.com) iCyclone Report: Super Typhoon HAIYAN in Tacloban City & Leyte – 04.03.14
page 14 / 47__
3.3.1 Methodology
3.3.1.1 Devices
Two devices were deployed in the hotel (Kestrel 4500s). The sampling rate was one reading per 30 seconds.
3.3.1.2 Calibration
USGS data indicate the ground elevation at the hotel is ~26 ft. Before the storm, the author attempted to
verify this with a three-block walk to the waterfront—to “eyeball it”—but it was difficult to assess with
confidence. Given this, 26 ft was used.
Device 1 was deployed in a small drawer in the hotel lobby, on the ground floor. Since it was several feet off
the ground, the device was calibrated (for sea-level readings) using an altitude of 30 ft.
Device 2 was deployed in our fourth-floor room. To calibrate this device, we used the air-pressure value from
Device 1 as a reference, setting the altitude in Device 2 to make the air-pressure value match that shown by
Device 1 (60 ft).
Upon returning to Tacloban City afterward, the author used a pressure altimeter to check the
elevation and found it was much lower than the 26 ft indicated by USGS data. The correct elevation is
~15 ft—which is 11 ft lower than the value used to calibrate the barometers. This required the air
pressure readings to be adjusted down 0.4 mb.
3.3.1.3 Disruption of Device 1
Sometime after 7:30 am (and probably after 7:45 am), storm surge flooded the hotel lobby, knocking over the
piece of furniture holding Device 1. The drawer holding Device 1 was submerged for a time—until the storm
died down and the author was able to retrieve it from the wreckage.
It’s unclear what effect this may have had on the air-pressure data—and there are no obvious irregularities in
the trace that can help identify when the disruption occurred. Either way, this disruption happened after the
lowest pressure was reached and the center was moving away from the city.
3.3.2 Analysis & Findings
3.3.2.1 Lowest Pressure & Intensity
As shown above, both instruments had low pressures of ~960 mb in the cyclone’s N eyewall. At this time, the
center was passing only ~13 n mi to the S.
Given that the typhoon was estimated to have a central pressure under 900 mb at the time, this suggests an
extremely steep core gradient of >4.5 mb/n mi.
3.3.2.2 Eyewall Irregularity
Data from both devices show a slight—yet distinct—irregularity from ~6:53 to ~6:56 am. This was just
minutes after we’d entered the typhoon’s eyewall, as the center was approaching and the pressure was still
dropping. This irregularity might be evidence of an eyewall mesovortex or other localized disturbance passing
near the building.
__
© 2014 Josh Morgerman / iCyclone (www.icyclone.com) iCyclone Report: Super Typhoon HAIYAN in Tacloban City & Leyte – 04.03.14
page 15 / 47__
3.3.2.3 Barograms—Clean
Following are clean barograms for both devices—plotted for the same time period (for easy comparison), and
excluding some non-representative pressure spikes:
Figure 8. Barogram—Device 1 (CLEAN)
Figure 9. Barogram—Device 2 (CLEAN)
__
© 2014 Josh Morgerman / iCyclone (www.icyclone.com) iCyclone Report: Super Typhoon HAIYAN in Tacloban City & Leyte – 04.03.14
page 16 / 47__
3.3.2.4 Barograms—Raw
Following are barograms of the raw data. Notice that the two devices ran for different periods—and also
Device 2 had some odd pressure spikes which are not considered representative:
Figure 10. Barogram—Device 1 (RAW)
Figure 11. Barogram—Device 2 (RAW)
__
© 2014 Josh Morgerman / iCyclone (www.icyclone.com) iCyclone Report: Super Typhoon HAIYAN in Tacloban City & Leyte – 04.03.14
page 17 / 47__
3.4 Winds
The max winds missed Downtown—but the City’s S neighborhoods weren’t as lucky.
The author did not collect wind data in this storm, and unfortunately, there are no known wind records from
anywhere in the City or along the Leyte coast.
On the Wind Damage Plots (Appendix C), Points 4 – 7 (in Leyte) cover Tacloban City. Damage across most
of the city was Level C, with Level D occurring in the S neighborhoods and a small pocket of Level E in the
San Jose neighborhood, near the waterfront.
3.4.1 Downtown
Although the RMW passed just to the S, Downtown Tacloban City was in HAIYAN’s N eyewall and
experienced very destructive winds. Significant wind damage occurred across Downtown—including
widespread unroofings and broken windows. Lethal flying debris filled the air during the height of the storm,
smashing into buildings to inflict serious secondary damage. Deciduous trees were completely defoliated and
in some instances debarked.
Despite the heavy damage, the author estimates that sustained hurricane-force winds lasted less than one
hour in Downtown—from ~6:45 am to ~7:40 am.
Unroofed government building. Extensive window breakage at modern church.
Figure 12. Wind damage in Downtown Tacloban City.
__
© 2014 Josh Morgerman / iCyclone (www.icyclone.com) iCyclone Report: Super Typhoon HAIYAN in Tacloban City & Leyte – 04.03.14
page 18 / 47__
Unrooofed church with damaged steeple. Unroofed church—from inside.
(Damage in foreground is from storm surge.)
Unroofed business (months later). Destroyed rooftop lounge.
Completely defoliated (& partially debarked) tree. Heavy tree damage.
Figure 12 (cont’d). Wind damage in Downtown Tacloban City.
__
© 2014 Josh Morgerman / iCyclone (www.icyclone.com) iCyclone Report: Super Typhoon HAIYAN in Tacloban City & Leyte – 04.03.14
page 19 / 47__
3.4.2 S Tacloban (& San Jose Neighborhood)
A pocket of extreme damage occurred in the City’s S outskirts, in the San Jose neighborhood—where many
palms were snapped-off at the trunk. Furthermore, at least one large concrete building failed in a nearby
commercial area, also in the S part of the City.
It’s unclear whether this damage pocket reflects the cyclone’s RMW, or perhaps a localized eyewall
disturbance—for example, a mesovortex or microburst.
Figure 13. Very heavy wind damage in S Tacloban—in the San Jose neighborhood and a nearby commercial
area—months later. (These images also appear in Figures 6 and 4, above.)
3.4.3 Airport
The Airport—on an exposed peninsula, 1.5 n mi ESE of Downtown—was devastated. While it was difficult to
distinguish between wind and storm-surge damage, the area was obviously swept by extremely high winds.
Figure 14. A fierce combination of wind and water destroyed Tacloban City’s airport.
__
© 2014 Josh Morgerman / iCyclone (www.icyclone.com) iCyclone Report: Super Typhoon HAIYAN in Tacloban City & Leyte – 04.03.14
page 20 / 47__
Figure 14 (cont’d). A fierce combination of wind and water destroyed Tacloban City’s airport.
3.5 Storm Surge
The surge inundated Downtown after the peak winds—as the center moved rapidly
away.
The most tragic force of Super Typhoon HAIYAN was its tremendous storm surge in Tacloban City.
As the center passed S of the City and pulled away to the SW, strong SE winds funneled water into San
Pedro Bay, causing a sudden and massive overflow into Downtown. Thousands of people in the City were
killed—many of whom were caught off guard by how fast the water rose. It didn’t last long—sweeping into the
City and then back out again with devastating speed.
At the author’s location (Hotel Alejandro in Downtown), the storm surge rose very suddenly and rapidly
between 7:30 and 7:45 am, and probably peaked between 8:00 and 8:15 am—well after the center’s
closest approach. By 8:45 am, it was already noticeably receding—so its impact was significant but short-
lived. During the peak surge, the hotel flooded to a depth of ~4 ft.
As per the author’s measurements during postanalysis, the surge reached 16-20 ft (above normal) in
Downtown.
__
© 2014 Josh Morgerman / iCyclone (www.icyclone.com) iCyclone Report: Super Typhoon HAIYAN in Tacloban City & Leyte – 04.03.14
page 21 / 47__
3.5.1 Methodology
Estimating storm surge requires knowing elevation—and elevation is unfortunately one of the more difficult
geographical features to accurately assess.
Before the typhoon struck, the author used USGS data to derive an elevation of 26 ft at his location. Since the
hotel flooded to a depth of ~4 ft, this resulted in an estimated storm surge of an incredible 30 ft.
Upon returning for postanalysis, the author used pressure altimeters (Kestrel 4500s) to get a more precise
measurement. The process was as follows:
1. The two devices were brought to the exact level of the Bay.
2. In the barometer function, the reference altitude was set to 0 ft, and the air pressure was noted.
3. Switching to the altimeter function, the reference air pressure was set to the noted value.
4. From here, the author brought the altimeters to known high-water marks to measure height above
current sea level.
5. The height-above-current-sea-level values were corrected for tide phases to get storm-surge-above-
normal values. (Normal = predicted astronomical tide.)
o Example: HAIYAN’s peak surge occurred at ~8:00 am, 08 Nov 2013, when the tide was
~0.05 m. If a high-water mark was measured in postanalysis with the altimeter when the tide
was 0.20 m, this required a correction of +0.15 m (~0.5 ft) to the measured value to get the
storm-surge-above-normal value.
Pressure altimeters are sensitive gadgets, easily affected by subtle environmental factors like wind and heat.
Therefore, the author performed these measurements at the same locations several times throughout the
week and noticed some variation in the readings. The accepted values were measured on a day when 1) the
two devices corroborated nicely, 2) the devices didn’t fluctuate as much, 3) the readings made sense in
relation to each other (i.e., higher elevations gave higher readings), and 4) the readings seemed in line with
other readings taken throughout the week.
Storm surge was measured at four locations. These locations were selected because eyewitnesses distinctly
remembered how high the water rose.
The most reliable location is considered to be Hotel Alejandro because:
• The author was there to witness the peak surge.
• The peak surge was captured on video, so there’s a clear record of how high it got.
• The surge occurred within an enclosed courtyard, so it’s a true height, without wave contamination.
3.5.2 Analysis & Findings
3.5.2.1 Maximum Heights
Following are the four locations, and the measured storm surge (above normal) at each:
• Point A. Hotel Alejandro (11.2414N 125.0036E) – 19 ft
o Time/date of measurements: 8:15-8:30 am, 01 Mar 2014
o Measured height above current sea level: 18 ft
o Correction for tide cycle: +0.5 ft
o Storm surge above normal: 18.5 ft
o Rounded value: 19 ft
o Notes: This surge occurred within an enclosed courtyard and was witnessed by the author.
No fatalities at this site, although guests were trapped in rising water and needed rescue.
__
© 2014 Josh Morgerman / iCyclone (www.icyclone.com) iCyclone Report: Super Typhoon HAIYAN in Tacloban City & Leyte – 04.03.14
page 22 / 47__
The following video stills give a clear record of how fast the water rose, how high it got, and when it
peaked at Hotel Alejandro:
Figure 15a. The surge was still rapidly rising at 7:57 am, when the author shot this video still. Notice the
water’s height against the door.
Figure 15b. This next video still is not time-stamped but is estimated to have occurred no more than 10 or 15
minutes after the previous one—probably around 8:10 or 8:15 am. The water is much higher and near its
peak. Again, notice the height of the water against the door. The author is seen rescuing an elderly woman
from the surge. (Video still courtesy of Earth Uncut TV.)
__
© 2014 Josh Morgerman / iCyclone (www.icyclone.com) iCyclone Report: Super Typhoon HAIYAN in Tacloban City & Leyte – 04.03.14
page 23 / 47__
• Point B. Villa Deriada Pensione (11.2410N 125.0064E) – 19 ft
o Time/date of measurements: 8:15-8:30 am, 01 Mar 2014
o Measured height above current sea level: 18 ft
o Correction for tide cycle: +0.5 ft
o Storm surge above normal: 18.5 ft
o Rounded value: 19 ft
o Notes: Much of this hotel was demolished, with multiple fatalities at this site.
• Point C. Home of Leo & Malyn Larraga (11.2396N 125.0050E) – 16 ft
o Time/date of measurements: 8:15-8:30 am, 01 Mar 2014
o Measured height above current sea level: 15 ft
o Correction for tide cycle: +0.5 ft
o Storm surge above normal: 15.5 ft
o Rounded value: 16 ft
o Notes: This building is right on the edge of a poor waterfront neighborhood that was
completely leveled, with many fatalities.
• Point D. Home of Mate Family (11.2405N 125.0060E) – 20 ft
o Time/date of measurements: 4:45 pm, 25 Feb 2014
o Measured height above current sea level: 18 ft
o Correction for tide cycle: +1.8 ft
o Storm surge above normal: 19.8 ft
o Rounded value: 20 ft
o Notes: Home of the City’s former Mayor, Uldarico E. Mate. There was heavy damage, with
much of the structure destroyed—however, there were no fatalities at this site.
Figure 16. Map of measured storm surge values in Downtown, showing a range of 16-20 ft above normal.
__
© 2014 Josh Morgerman / iCyclone (www.icyclone.com) iCyclone Report: Super Typhoon HAIYAN in Tacloban City & Leyte – 04.03.14
page 24 / 47__
Figure 17. Villa Deriada Pensione (Point B in Figure 16) was mostly demolished by the storm surge, which
is estimated to have reached ~19 ft at this location. Multiple fatalities occurred at this site.
__
© 2014 Josh Morgerman / iCyclone (www.icyclone.com) iCyclone Report: Super Typhoon HAIYAN in Tacloban City & Leyte – 04.03.14
page 25 / 47__
Figure 18. Remains of the Mate residence (Point D in Figure 16). Uldarico E. Mate was Mayor of Tacloban
City from 1988 to 1998. The surge is estimated to have reached ~20 ft at this location.
3.5.2.2 Characteristics
A few characteristics made HAIYAN’s storm surge in Tacloban City unique:
• Suddenness & speed. Survivors and eyewitnesses reported being surprised by the rapid onset of
the surge—so sudden they hardly had time to react. This no doubt added to the high death toll. In the
author’s hotel, first-floor guests were trapped in their rooms by rising water because they didn’t flee to
the upper floors at the first hint of inundation. At that location, the inundation was extensive but short-
lived. The author and his colleagues didn’t even realize the surge was flooding the neighborhood until
~7:45 am; it peaked by ~8:00 or 8:15 am; and it was already rapidly receding by around ~8:45 am or
9 am. The rapid onset (and equally rapid recession) was no doubt the product of the cyclone’s small
size, rapid motion, and great intensity.
• “Tsunami-like.” Related to the previous point… The terrific rush of water into the Downtown area
reminded residents of a tsunami—and many thought that’s what it was. In fact, the day after the
typhoon, rumors of “more tsunamis” on the way caused panic among survivors.
• Three waves. Multiple survivors at the shoreline described three large waves. One witness said the
first wasn’t too damaging, the second was dark from all the mud it carried, and the third was very
damaging because it carried a lot of debris.
• Pre-surge recession. Some eyewitnesses reported that the water actually receded early in the
morning, before the storm surge—with the water pulling out into the Bay and reducing to unusually
low levels.
__
© 2014 Josh Morgerman / iCyclone (www.icyclone.com) iCyclone Report: Super Typhoon HAIYAN in Tacloban City & Leyte – 04.03.14
page 26 / 47__
Figure 19. HAIYAN’s powerful storm surge brought almost total destruction to the City’s poorer
waterfront neighborhoods.
__
© 2014 Josh Morgerman / iCyclone (www.icyclone.com) iCyclone Report: Super Typhoon HAIYAN in Tacloban City & Leyte – 04.03.14
page 27 / 47__
4. Conclusion
The author expects that analysis of this historic and devastating cyclone landfall will continue, and that the
body of knowledge about Super Typhoon HAIYAN will only grow.
Feedback to this report is welcomed and encouraged:
Josh Morgerman
info@icyclone.com
Website
http://www.icyclone.com/
Facebook
http://www.facebook.com/iCyclone
YouTube
http://www.youtube.com/cyclonejosh
Thank you.
__
© 2014 Josh Morgerman / iCyclone (www.icyclone.com) iCyclone Report: Super Typhoon HAIYAN in Tacloban City & Leyte – 04.03.14
page 28 / 47__
5. Appendices
5.1 A. Eyewitness Interview Notes
Following are detailed notes from many—but not all—of the interviews conducted by the author. Color-coding
indicates whether the subject experienced calm or not. Notes Re: wind damage are included, where
relevant.
• YES: definitely experienced distinct calm.
• NO: definitely experienced no calm.
• MAYBE: experienced lessening, fluctuations, or can’t remember.
• NO RECORD: didn’t say, & can’t be inferred from the notes.
Tacloban City
Note: The author was in Downtown Tacloban City during the storm. There was no lull anywhere in the
City—not even a slight lessening of the winds as the center passed nearby. The highest winds happened
during and just after the lowest pressure. (See the Tacloban City—Chronology section, above, for more
details.)
Leo & Malyn Larraga (husband & wife)
• Downtown Tacloban City. They rode out the storm in second-story apartment in a modern building
near the waterfront. The windows exploded and they took refuge in a small room, so they didn't see
the surge, which came up almost to their second-floor apartment. A boy was swimming by their
balcony and they pulled him out of the water and into to their apartment. He'd been swept from his
parents, who survived in another house nearby.
Venus
• San Jose Neighborhood. When the surge came up, she had to swim for her life.
Peachy
• San Jose Neighborhood. Black, muddy water came up really fast. She stayed up in her attic for
three days after the typhoon, living on crackers. Dead bodies were everywhere. A friend of hers
described the house as "exploding" from the force of the wind.
Palo
Nimfa
• Power went out, very strong wind, lots of damage.
• Wind made whistling sound. (She pointed to her ears as she said this.)
• Strongest winds lasted one hour.
• Wind changed directions, but she did not recall a lull.
Alex
• Big wind, changing direction a lot—like a tornado, with fog.
• Strongest winds between 8 and 10 am.
• Whistling sounds.
• Subject did not recall a lull.
__
© 2014 Josh Morgerman / iCyclone (www.icyclone.com) iCyclone Report: Super Typhoon HAIYAN in Tacloban City & Leyte – 04.03.14
page 29 / 47__
April
• Wind was so strong she stayed in the house.
• After 7 am, the water inside the house was up to 5 ft.
• Once the roof blew off, she climbed on a wall to reach a neighbor’s house.
• Winds blew hardest for an hour or hour and a half.
• For 15 minutes it calmed and rain was light for a while—around 8 am.
• Then it started up again for an hour.
Genciano
• Strong wind—roofs were flying.
• Visibility was almost zero, couldn’t see.
• The wind was “like pressing the pedal of a motor engine”—like revving an engine.
• Worst was past 7 am.
• Lightning and thunder happened during the strongest winds.
• The most-intense part lasted 20 minutes.
• Past 8 am it was slower.
• It started SW and then shifted, with strongest winds from E.
• Subject did not recall a lull.
Lorna
• She couldn’t see neighbor’s house during height of the storm—“zero visibility”.
• Wind made a whistling sound—like airplanes.
• Some of the roof blew off.
• Strongest winds happened around 7 am and lasted an hour.
• Winds changed direction.
• Subject did not recall a lull.
Primitivo
• Winds started to pick up around 6 am.
• Ceiling started lifting off, so he ran to the bathroom.
• Only thing they could hear was “strong wind and rain”—like an airplane, or like trucks passing.
• It was strongest for 3 hours—steady for 3 hours.
• Subject did not recall a lull.
Charee
• Subject was emotional.
• She was at home during storm.
• At 4 am the wind got strong, and she was alarmed by it, said she “felt something was wrong” and “this
was the first time I experienced this.”
• Bu 6 or 6:30 am she gathered her children into one room.
• Strongest winds occurred around 7 am—and it was “very terrible” and everyone was crying.
• “Zero visibility”—like “fog and clouds”… swirling.
• She rescued the children.
• The wind changed direction, but she did not recall a lull.
San Joaquin
Jasmine
Note: This subject was interviewed in Palo—however, she rode out the storm in San Joaquin.
• The wind broke the windows.
• The wind shifted and the water came up.
• She went up to the attic and the roof blew off.
• After an hour, the water went down.
• It blew hard for two hours, and it was steady—no calm.
• She felt pressure on her ears.
__
© 2014 Josh Morgerman / iCyclone (www.icyclone.com) iCyclone Report: Super Typhoon HAIYAN in Tacloban City & Leyte – 04.03.14
page 30 / 47__
Ginalin
• She woke up at 4:30 am, wind got strong around 5.
• At around 5:30 am, windows smashed and it was getting stronger.
• At around 6 am, stuff was breaking and a door blew off.
• The water came up in a giant wave—3 waves:
o First came up to shins and then “calmed”…
o Second came in 3-5 minutes later.
o Third one swept her away, out the back door, with lots of wind.
• She held onto a tree for an hour, in “zero visibility”—saw only sky and water.
• Worst of it lasted an hour.
• She seemed to remember a calming or inconsistency in the windspeed—it seemed to fluctuate.
Joseph & Kirztin (father & daughter)
• Wind started destroying the house, so she (Kirztin) got under a cupboard in the kitchen.
• Water swept in and they were trapped.
• They climbed to the attic and spent an hour and a half there.
• The wind “hurt their ears.”
• The father (Joseph) seemed to describe intense downdrafts—said the wind was coming
downward—swirling.
• But rain was never very heavy.
• No lull, but wind seemed to fluctuate for an hour.
• Water came in 6 waves, spaced ~5 minutes apart.
Tanauan
Don
• At 5 am, the wind was strong.
• House shook, “like an earthquake.”
• At 6 am, it was getting stronger, and coconut trees were snapping off.
• At 7 am, the second floor of the house blew away.
• 12 people crammed into one small room and hid there.
• They heard whistling sounds, and airplane sounds.
• At 8 am, there was an “explosion” or “thunder.”
• The water came up between 8 and 9 am.
• There was a lull for 5-10 minutes.
• When the wind started up again, it was stronger than before—and he couldn’t see 2 meters away.
• He hugged a coconut palm until the storm ended.
• It died down around 10 or 11 am.
Fernando & Florinda (husband & wife)
Note: This interview was challenging, and the author had difficulty understanding some of what the subjects
were describing.
• By 7:30 am, the wind was “swirling” and had destroyed the house. The door blew open and they hid
under the sink.
• Water got up to their knees and within seconds up to their heads.
• Most of the house was gone, but they climbed into the remaining part.
• The waves were “dark… and black” and she felt like it was nighttime—couldn’t tell if the water was
rain or ocean—and they felt very cold.
• They held onto a coconut tree for the rest of the storm, until around 11 am.
• Strongest winds around 8:30 am, “darkness” around 9 am.
• Water came in 3 waves between 7:30 and 8 am—waves covered everything, like darkness.
• Lulls and fluctuations occurred between 7:30 and 9 am.
__
© 2014 Josh Morgerman / iCyclone (www.icyclone.com) iCyclone Report: Super Typhoon HAIYAN in Tacloban City & Leyte – 04.03.14
page 31 / 47You can also read