Australia's proposed 'Kyoto carryover' - nature, scale, implica8ons, legal issues and environmental integrity of the Paris Agreement - December ...
←
→
Page content transcription
If your browser does not render page correctly, please read the page content below
Australia’s proposed ‘Kyoto carryover’ -
nature, scale, implica8ons, legal issues
and environmental integrity of the Paris
Agreement

December 2019
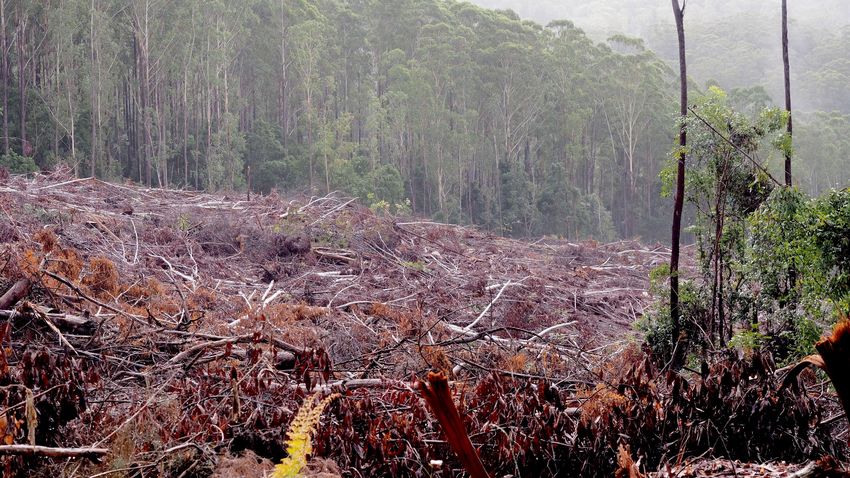
Australia’s proposed ‘Kyoto carryover’ - nature, scale, implications, legal
issues and environmental integrity of the Paris Agreement

December 2019

Climate Analytics Australia

This report, prepared by Climate Analytics Australia, has been
commissioned by the Australia Institute

Cover image
© Natives Rule
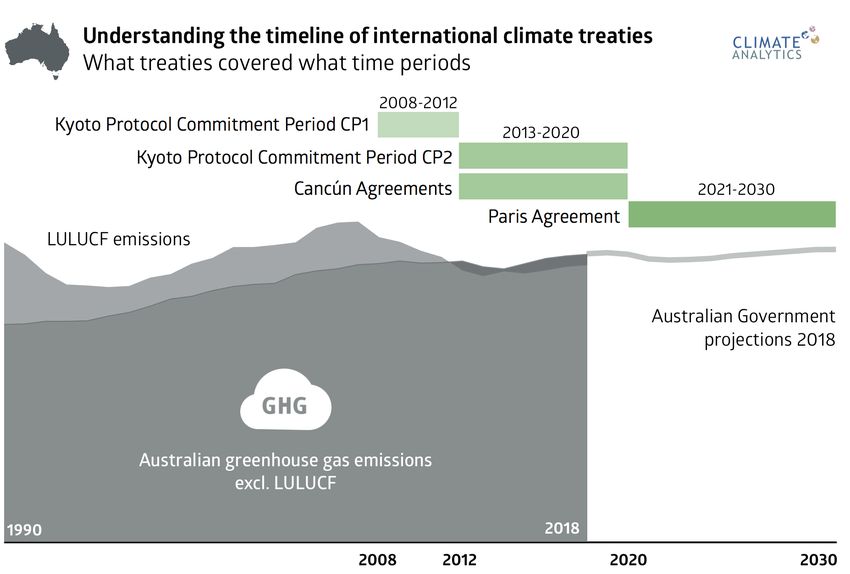
Table of Contents

Executive Summary .................................................................................................................... 2
Introduction ................................................................................................................................ 5
A. Australia's pledged emission targets under the Convention, Cancun Agreements,
Kyoto Protocol and Paris Agreement ......................................................................................... 6
  1. UN Framework Convention on Climate Change - 2000 ....................................................... 7
  2. Kyoto CP1 target and budget – 2008-2012 ......................................................................... 7
  3. Kyoto CP2 target and budget – 2013-2020 ......................................................................... 9
  4. Cancun Agreement Pledge – 2020 .................................................................................... 11
  5. Paris Agreement Nationally Determined Contribution - 2021 - 2030 ................................ 15
B. Australia's actual domestic emission levels and projected emission levels ......................... 15
C. Carryover rules under the Kyoto Protocol and Paris Agreement ......................................... 17
  1. Kyoto Protocol first commitment period carryover rules and scale of potential carryover
  for Australia following conclusion of the first commitment period ....................................... 17
  2. Kyoto Protocol second commitment period accounting rules and relevance to Australia’s
  “proposed carryover” ............................................................................................................ 18
  3. Paris Agreement accounting rules and relevance to Australia’s “proposed carryover” ... 22
D. Current scale and source of Australia's "proposed carryover" ............................................ 23
E. Impact of "proposed carryover" on Australia's target .......................................................... 25
F. Opportunities to deal with carryover in the Paris Agreement implementation negotiations
.................................................................................................................................................. 28
Tables and Figures
Table 1 Australian targets under climate agreements .............................................................. 7
Table 2 Australia’s First Kyoto Protocol commitment period accounting parameters and
emissions .................................................................................................................................... 9
Table 3 Australia’s Second Kyoto Protocol commitment period – selected accounting
parameters ............................................................................................................................... 11
Table 4 Greenhouse Gas Emissions for Australia for the period 1990-2017 – 2017 NIR CTF
Table 10 (data not yet reviewed) ............................................................................................. 16
Table 5 Australian historical emissions and projections to 2030 ............................................ 16
Table 6 Total available for carryover to KP CP2 ........................................................................ 18
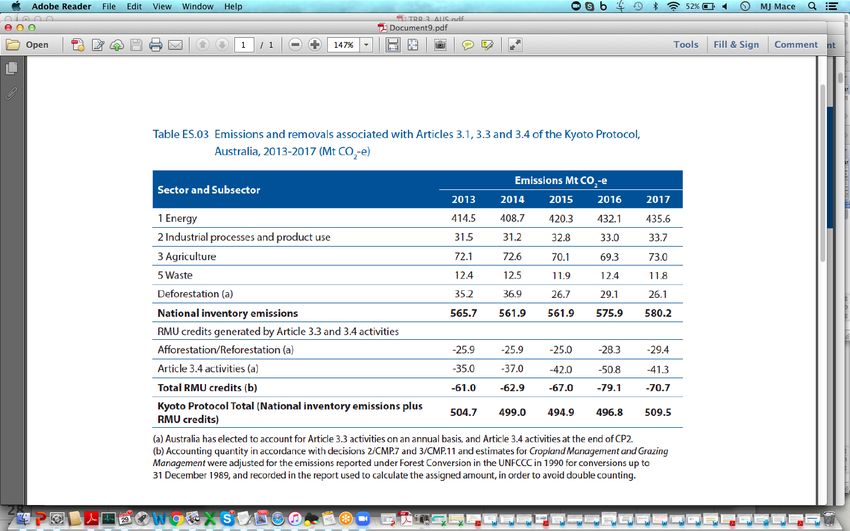
Table 7 Table ES.03 with Kyoto emissions and removals for 2013-2017 from the most recent
(2019) National Inventory Report (NIR) ................................................................................... 24
Table 8 Actual and projected Kyoto second commitment period surplus for Australia ........... 25
Figure 1 Timeline for agreements covered in this paper ........................................................... 5
Figure 2 Approach taken by the Australian government to develop its second commitment
Kyoto protocol budget. Taken from Figure 16 in the December 2018 government projections.
.................................................................................................................................................. 14
Figure 3 Approach taken by the Australian government to develop its second commitment
Kyoto protocol budget. Taken from Figure 28 in the December 2019 government projections.
.................................................................................................................................................. 14
1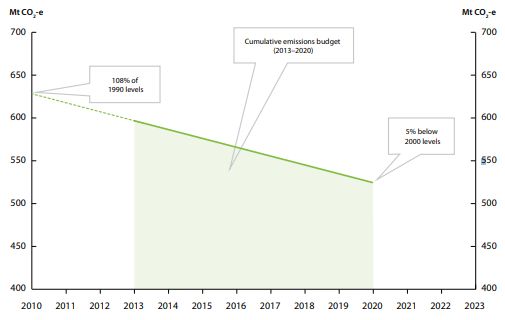
Executive Summary

Under the Paris Agreement, Australia has committed to reduce its emissions by 26-
28% below 2005 levels by 2030. Australia is now considering whether to count what it
portrays as “overachievement” over the first Kyoto commitment period (2008-2012),
and possible overachievement over the Protocol's second commitment period (2013-
2020), toward its emission reduction commitment (Nationally Determined
Contribution) for 2030 under the Paris Agreement.

This paper briefly explores the rule set giving rise to Australia's claim of
"overachievement", including the assumptions made in establishing Australia’s
budgets for the first and second Kyoto Protocol commitment periods. We conclude
that any claim of overachievement under the Kyoto Protocol does not represent any
real emission reductions but is technical only, resulting from anomalies under Kyoto
accounting rules and deliberate accounting choices Australia made. The same is true
of Australia's 2020 Cancun pledge.

Some or all of the technical Kyoto Protocol "overachievement" derives directly from
the fact that Australia had substantial domestic deforestation emissions in 1990,
which have reverberated through its climate change accounting over the last two
decades. It would be perverse, to say the least, to reward Australia in 2030 for large
scale deforestation that took place forty years earlier in 1990. A portion of this
recorded "overachievement" can also be said to come directly from Australia's
decisions to allow itself an 8% increase in its emissions in the first Kyoto commitment
period compared to 1990 levels and a minimal 0.5% reduction for the second -- in
other words, the adoption of earlier targets that were quite unambitious.

To the extent any “overachievement” in the pre-2020 period is ultimately portrayed as
having taken place under Australia’s 2020 Cancun pledge, rather than its Kyoto target,
this result will be equally artificial. First, such an assertion would assume that Australia
has reneged on its promise to the international community to increase its 2020
reduction effort up to 15% if the world reached a comprehensive treaty capable of
limiting concentrations of GHGs to below 450 ppm (the Paris Agreement is capable of
this, and a -15% target absorbs any “overachievement”). Second, even against a -5%
reduction target, an assertion of “overachievement” would also assume a creatively-
established and inflated budget against which to assess achievement, as well as a
creative means of measuring Australian emissions over the same period for
comparison with this budget, with both based on amalgam of carefully selected
Convention and Kyoto accounting options.

Efforts to seek recognition under the Paris Agreement for these historical artefacts, in
the guise of or repackaged as "overachievement", in an effort to minimise future
mitigation efforts required, would be contradictory to the goals and principles of the
Paris Agreement, to which Australia has itself subscribed as a Party.

                                                                                           2
Further, there is currently no legal basis for the "carryover" of pre-2021 units from the
Kyoto Protocol for use under the Paris Agreement. The Kyoto Protocol and Paris
Agreement are separate treaties. Even within its own legal framework, the Kyoto
Protocol does not permit the carryover of units or underlying reductions beyond the
2013-2020 second commitment period. There can be no carryover of allowed amount
units (AAUs) to a non-existent "subsequent" commitment period, or carryover of
certified emission reductions (CERs) to a non-existent third commitment period. Nor
is there a Paris Agreement CMA Decision expressly permitting "carryover" into the
Paris Agreement.
From the perspective of equity, it should also be noted that the Paris Agreement calls
for Parties to present their highest possible ambition, promote environmental integrity
and ensure the avoidance of double counting. Any use of old Kyoto allowances or
emission reductions achieved in another Party would clearly contradict these
elements of the Paris Agreement. It would also undermine the effective ambition of
the NDCs that have been presented, but also the goals, principles, fabric and
machinery of the Paris Agreement itself.
In sum, there are a number of reasons why it would not be legitimate or defensible --
from a factual, legal or equity perspective -- for Australia to use Kyoto Protocol
“overachievement” toward its Paris Agreement NDC.
Given Australia's projections it would almost certainly be best for Australia to openly
acknowledge the challenges it faces in meeting its 2020 and 2030 targets, and do its
utmost to put in place policies and measures that can bend its emissions trajectory.
Australia’s December 2018 projections indicate emissions levels of about 7% below
2005 levels in 2030 are expected from current policies. Its more recent December
2019 projections show a lower level of emissions for 2030, 16% below 2005 levels.
In addition, Australia would do well to support the development of robust Article 6
rules, including rules that preclude carryover, so that going forward it has both
flexibility in how it meets its target, and a transparent set of credible, multilaterally
agreed rules within which to do so.
Australia’s proposed carryover in December 2018 projections as 367 MtCO2e and in its
December 2019 projections had increased 411MtCO2e. These volumes would have a
significant effect on Australia's effective mitigation effort. Were this carryover to be
used, as Australia proposes, it would reduce Australia’s target in 2030 from 26% to
only a 14.9% reduction below 2005 emissions levels in the case of the December 2018
projections and 13.9% in the case of December 2019 projections. In other words,
Australia's proposed use of KP units or "overachievement" would eliminate much of
the reductions in 2030 anticipated from Australia's NDC. Carryover use would
substantially reduce the environmental effectiveness of Australia's already
“insufficient” 2030 NDC target.1 It would also have negative repercussions for the
1
See https://climateactiontracker.org/
3environmental integrity of Paris Agreement NDCs in aggregate, as well as the
Agreement's efforts to promote transparency, accuracy, consistency and
comparability and avoid double counting.
If Australia believes surplus AAUs should be available for use toward NDCs, the burden
is on Australia to pursue a Paris Agreement CMA2 decision expressly allowing this.
However, the likelihood of a Paris Agreement CMA decision approving the "carryover"
of AAUs to the Paris Agreement is virtually nil. This is due to the nature of AAUs as
time-bound allowances, the concerns previously raised at the international level about
the environmental integrity of surplus AAUs, the CMP's efforts to corral these units
even within the Kyoto Protocol rule set into Previous Period Surplus Reserves, and the
principles of the Paris Agreement, which require all Parties to promote environmental
integrity and express their highest possible mitigation ambition. Both the CMA and
CMP take decisions by consensus; the Alliance of Small Island States (AOSIS), the LDC
Group and a number of other developed and developing countries are already on the
record as opposing the carryover of Kyoto units to the Paris Agreement. In the
absence of a supporting decision, Australia’s claims to "carried over" AAUs will not be
plausible.
Although this should not be necessary, CMA Parties concerned with the possibility of
carryover may themselves wish to propose a draft decision that expressly precludes
use of Kyoto “surplus” AAUs toward Paris Agreement goals, precludes AAUs and CERs
toward Paris Agreement goals, or alternatively precludes use of any pre-2021 vintage
units or reductions, without being specific about which units are not permitted.
Other possible draft decisions - intended to provoke a discussion highlighting the
difficulty with CER use - could link to Paris Agreement compliance processes and focus
on double counting of credits or units by multiple Parties, or by the same Parties in
multiple periods. Within the Paris Agreement, both Article 4 and Article 6 of the Paris
Agreement require the Parties to ensure the avoidance of double counting. Australia’s
proposed CER use would lead to the double counting of these reductions by Australia
and the countries hosting these projects, unless an understanding is reached with
each host country, whereby that host agrees not to also count those reductions
towards its own NDC.
Under the Kyoto Protocol, CMP Parties might propose decision language recalling that
unused AAUs from Kyoto CP1 and CP2 are to be cancelled at the end of CP2’s true up
period.
If a formal decision is not possible due to Paris Agreement consensus rules, which
Australia may seek to exploit, like-minded Parties could simply join together to express
their shared understanding that AAUs do not survive the expiration of CP2, and that
they and CERs are not appropriate for use under the Paris Agreement.
2
CMA – Conference of the Parties serving as the meeting of the Parties to the Paris Agreement
4Introduction
Under the Paris Agreement, Australia has pledged to reduce its emissions by 26-28%
below 2005 levels by 2030. The two most recent projections by Australia show
different quantitative outcomes for 2030 however in both cases policies fall short of
meeting these emission reductions. In the absence of policies consistent with the
delivery of its target, Australia is considering whether to present what it portrays as its
"overachievement" of Kyoto Protocol targets over the first Kyoto period (2008-2012),
and possibly the second Kyoto period (2013-2020), toward achievement of its
Nationally Determined Contribution target for 2030 under the Paris Agreement.
This paper briefly explores the rule set giving rise to Australia's claim of "overachievement",
including the assumptions made in establishing Australia’s budgets for the first and second
Kyoto Protocol commitment periods, as well as the key assumptions underlying Australia's
2020 Cancun Agreement target. It considers the rules in place to address carryover within the
Kyoto Protocol, and the source, nature and quantum of the allowances and emission
reduction units Australia tags as constituting its "overachievement." See Figure 1 below for
schematic timeline of the agreements relating to the carryover question.
Figure 1 Timeline for agreements covered in this paper
The paper then places this proposed "Kyoto carryover" in the legal context of the Paris
Agreement, noting the absence of any reference therein to the Kyoto Protocol or to
“carryover”, the inconsistency of carryover with relevant aims, principles and provisions of the
Protocol and Paris Agreement, and the ongoing debate on the possible carryover of Kyoto
5CDM and Joint Implementation units and/or activities in negotiations under Article 6 of the
Paris Agreement. After identifying a series of impediments to Australia's use of what it has
termed “overachievement” under the Paris Agreement, the paper turns to approaches that
might be taken at various levels to address this issue directly, in view of the risk posed to the
environmental integrity of the Paris Agreement.
The December 2018 projections, including land use change and forestry for 2030 are
about 6% below 2005 levels, and some 5-6% above 2018 emission levels. Emissions
from fossil fuels industry and other industrial sources of greenhouse gases (excluding
land use change and forestry) are projected to be 8 percent above 2005 levels). The
new December 2019 emission projections are significantly different, 16% below 2005
levels and some 4% below 2018 emission levels (incl. LULUCF). In these projections
fossil fuels industry and other industrial sources of greenhouse gases (excluding land
use change and forestry) are projected to about the same as 2005 levels. There are
significant questions surrounding the most recent 2019 projections and associated
changes to the national greenhouse gas inventory and as a consequence both the
2018 and 2019 projections will be used in this report.
A. Australia's pledged emission targets under the Convention, Cancun
Agreements, Kyoto Protocol and Paris Agreement
Australia has adopted a series of emission reduction targets under the Convention, the Kyoto
Protocol and the Paris Agreement. Targets under these three different treaties rely on
different base years (1990, 2000, 2005) and apply a range of different accounting rules,
rendering comparison difficult. This paper will identify some common threads, so that the
claim of “overachievement” can be understood in context.
6Table 1 Australian targets under climate agreements
Year Treaty Australian Target Notes
target
set
1992 UNFCCC Parties aim to reduce emissions to 1990 levels Convention addresses
by 2000. both emissions and
• Emissions in 2000 were about 95% of removals
1990 levels, and current government
projections indicate they will remain
within 95% of 1990 levels until 2030
1997 Kyoto Protocol Limit increase in emission levels of Annex A Kyoto Protocol addresses
First Commit- listed GHGs (excluding LULUCF) to 8% above Annex A source emissions;
ment Period 1990 levels, over the period from 2008-2012 limited offsetting is
(CP1) • Target met, but average emission levels permitted from certain
of GHGs excluding LULUCF in the first land sector activities
Kyoto commitment period (CP1) (2008-
2012) were 28% above 1990 levels.
2010 Cancun Reduce emissions by 2020 to 5% below 2000 Australia has applied a mix
Agreements levels (unconditional); up to 15% below 2000 of KP and Convention
levels, or 25% below 2000 levels (conditional) accounting rules (see
TRR.AUS)
2012 Kyoto Second Reduce emissions 0.5% below 1990 levels over Emissions offset by certain
Commitment the period from 2013-2020 land sector activities; CP2
Period (CP2) not in force
2015 Paris Reduce emissions of all GHGs including LULUCF Australia proposes mix of
Agreement 26-28% below 2005 levels by 2030 following a KP and Convention
budget approach. accounting rules
1. UN Framework Convention on Climate Change - 2000
Under the UNFCCC, developed countries aimed to reduce their em issions individually
or jointly to 1990 levels by 2000. All Parties, both developed and developing, agreed to
report their national greenhouse gas emission inventories regularly. These inventories reflect
economy-wide anthropogenic emissions, reported both with, and without, emissions from
land use, land use change and forestry.
2. Kyoto CP1 target and budget – 2008-2012
For the first Kyoto Protocol commitment period, Australia took a quantified emission
limitation or reduction target (QELRC) of 108 per cent with respect to 19903 emission levels,
set out in Annex B of the Protocol. This represents a commitment to limit Australian GHG
emissions over the 2008-2012 budget period to 8 percent over 1990 emission
levels. 4 This target relates to a prescribed “basket” of greenhouse gases, from a set of
identified sectors and sources (energy, waste, industrial processes, solvent and other product
use, agriculture and waste), set out in Annex A of the Protocol – referred to as energy and
industrial GHG emissions (not including the land sector) or in shorthand "Annex A sources and
gases."
Under Article 3.7 of the Protocol, Parties’ quantified targets are converted to emissions
“budgets” over a multi-year “commitment period”, represented by units of “assigned amount”
3
Under Article 3.5, Annex I Parties undergoing the process of transition to a market economy were permitted to use periods
other than 1990; this did not impact Australia. Under Article 3.8, Parties were permitted to use 1995 as a base year for certain F
gases.
4
Only two other countries negotiated emission increases: Iceland (110) and Norway (101). See Annex B to the Kyoto Protocol.
7(or “assigned amount units” or “AAUs”). These budgets are calculated from Parties’ targets
and their base year emission levels. For example, a reduction target of 20% below the 1990
base year, in a five year commitment period, would be calculated as (.80) x (emissions in the
base year in tons) x (5 years). A given Kyoto target in effect represents a Party’s intended
average emission level over the course of the commitment period. At the end of the
commitment period, Parties must hold sufficient AAUs to cover their emissions over the entire
commitment period, or they are considered to be in non-compliance.
The Protocol permits Parties to add to their allowed Annex A emissions, calculated according
to Article 3.7, a limited quantum of emission "removals" resulting from CO2 sinks from certain
activities in the land sector.5 The Kyoto Protocol sets up a complex system of defining what
activities can be counted and under what circumstances. Accordingly, the Protocol takes a
different approach to accounting from the Convention.
Australia’s first commitment period budget benefited substantially from what has become
known as “the Australia clause" - so called because Australia lobbied hard for its inclusion and
benefited the most from its inclusion.6 The last sentence of Kyoto Protocol Article 3.7
provides that “Those Parties included in Annex I for whom land use change and forestry
constituted a net source of greenhouse gas emissions in 1990 shall include in their 1990
emissions base year or period the aggregate anthropogenic carbon dioxide equivalent
emissions by sources minus removals from sinks in 1990 from land use change for the purpose
of calculating their assigned amount.”7 (emphasis added)
As Australia's land-use change and forestry emissions were positive in 1990, this triggered the
application of the last sentence of Article 3.7. Because Australia’s land use change -
deforestation - emissions in 1990 were substantial at 131,544,513 t CO 2 eq (131.5
M tCO 2 e), this provision boosted Australia’s base year emissions figure by
about 24% for purposes of calculating its Kyoto CP1 budget. Further, because
Australia’s QELRC of 108 in effect allowed Australia to increase its emissions by 8% over its
1990 base year emissions over the 2008-2012 period, the effect of this base year bump up
related to deforestation was to add a significant number of AAUs to Australia’s overall first
commitment period AAU budget. This budget remained fixed, regardless of trends in
deforestation rates over the period.
Of Australia’s CP1 AAU budget – a full 710.2 MtCO2e or 24%, is derived from this clause.8
Australia’s total base year emissions including net emissions from deforestation, were 547.7
MtCO2e).9
5
When land sector activities take up carbon in aboveground biomass or soils this is called a sink, and is in effect a negative CO2
emissions.
6
For a discussion of this provision, see Australia and the Doha Amendment: a quick guide (2 December 2016), available at
https://www.aph.gov.au/About_Parliament/Parliamentary_Departments/Parliamentary_Library/pubs/rp/rp1617/Quick_Guides
/QG-DohaAmendment (recent analysis shows that Australia benefited the most from this clause.”)
7
See “Australia hits its Kyoto target but it was more a three inch putt rather than a hold in one”, discussing the Australia Clause,
in The Conversation, July 16, 2015. Available at https://theconversation.com/australia-hit-its-kyoto-target-but-it-was-more-a-
three-inch-putt-than-a-hole-in-one-44731
8
(131,544,513 tCO2 eq.x 5) (1.08). See Report of the review of the initial report of Australia, FCCC/IRR/2007/AUS, 16 January
2009 at Table 3, note a (providing deforestation figure). Available at Available at
https://unfccc.int/sites/default/files/resource/docs/2009/irr/aus.pdf
9
Id. at Table 3, note a, paras 134-135.
810
Table 2 Australia’s First Kyoto Protocol commitment period accounting parameters and emissions
Accounting parameter tCO 2 eq. M tCO 2 e
Base year emissions - 1990 416,155,330 416.2
Land use change - deforestation - 131,544,513 131.5
emissions in 1990 (Article 3.7)
Base year emissions for calculation of 547,699,841 547.7
Assigned Amount (including Article 3.7
deforestation emissions)
QUELRO in % 108
Assigned amount ((5 x base year 2,957,579,143 2,957.6
emissions for calculation of assigned
amount) x (1.08))
Total Reported GHG emissions in CP1 2,711,153,476 2,711.1
Total in retirement account (all AAUs) 2,711,153,478 2,711.1
AAUs requested for carryover from CP1 127,650,775 127.7
to CP2
CERs requested for carryover from CP1 to 21,768,290 21.8
CP2
Total requested for carryover 149,419,065 149.4
3. Kyoto CP2 target and budget – 2013-2020
For the 8-year second Kyoto commitment period (CP2), Australia presented a QELRC of 99.5
against 1990 base year emission levels, over the period 2013-2020. This target appears in the
third column of revised Annex B.11
In negotiations over rules for the second commitment period, Australia strongly resisted
deletion of the last clause of Article 3.7, linking this provision to its willingness to participate in
CP2 with an Annex B target. As a result, Article 3.7bis of the Doha Amendment retains the last
line of KP Article 3.7, again giving an accounting bonus to the few Parties with net emissions
from deforestation in 1990. See decision 1/CMP.8, Annex I.
W ith 3.7bis in place, Australia's assigned amount for the second com mitment
period was again close to 25% higher for CP2 than it would otherwise have
been. Australia’s base year emissions totalled 566,786 410 tonnes (566.8 MtCO2e),
including 148,163,361 tonnes (148.2 MtCO2e) from deforestation in 1990.
Of Australia’s CP2 AAU budget – 1,155 MtCO2e or 26%, is derived from the 1990 deforestation
allowance. It is worthwhile noting that due to inventory revisions the 1990 deforestation
emissions number is 12% higher than in the first commitment period, adding about 124
MtCO2e to the CP2 budget.
10
See Report of the review of the initial report of Australia, Report upon the expiration of the additional period for fulfilling
commitments by Australia (True Up Period Report) (December 2015).
11
Column 3 of the revised Annex B contains CP2 QELROs. Column 6 contains pledged emission reductions or reduction ranges for
2020 derived from Cancun Agreement pledges. Australia, Switzerland, Norway and Liechtenstein's column 6 pledges carry
footnotes emphasizing that these ranges reflect pledges under the Cancun Agreement, rather than new commitments under the
Kyoto Protocol.
9Australia’s assigned amount for CP2’s eight year commitment period was calculated at
4,511,619,826 tonnes (4,511.6 MtCO2e). 12 The cancellation applied under Article 3.7ter
of the Doha Amendment, to manage CP2 surplus, did not affect the calculation of Australia's
CP2 assigned amount, due to Australia's election under decision 2/CMP.11 to use the same
GHGs, sectors and source categories in calculating average annual emissions for 2008, 2009
and 2010 as it used to calculate the assigned amount for CP2. 13
Australia also included in columns 4 and 5, of revised Annex B, an optional additional target
expressed relative to a different reference year (a QELRC of 98 with a reference period of
2000). This target is expressly not binding under the Kyoto Protocol. The only country with a
stated reference year other than 1990 in column 4 is Australia. The chosen optional reference
year of 2000 is significant, as Australia's Year 2000 Annex A emissions -- emissions from
burning fossil fuels and industrial sources -- were about 15 to 16% above 1990 levels.14 By
seeking permission of Parties to include an additional reference year target (in addition to its
base year target ) Australia is able to give the appearance of an apparently deeper target in
the table, linked to its Cancun pledge conditional targets (that it has since distanced itself from
i.e., up to - 15% or -25%), and give some semblance of visual parity with other Annex B Parties
to the casual observer, if not parity in terms of ambition.
Regardless, the binding Kyoto target Australia took for CP2 is a 0.5% reduction relative to the
1990 base year, with a second substantial bump up for deforestation.
12
FCCC/KP/CMP/2019/6/Add.1, Annual compilation and accounting report for Annex B Parties under the Kyoto Protocol for 2019
(24 October 2019).
13
Decision 2/CMP.11 (Implications of the implementation of decisions 2/CMP.7 to 4/CMP.7 and 1/CMP.8 on the previous
decisions on methodological issues related to the Kyoto Protocol, including those relating to Articles 5, 7 and 8 of the Kyoto
Protocol, part I: implications related to accounting and reporting and other related issues).
14
The footnote to the column 6 entry states "Australia’s QELRC under the second commitment period of the Kyoto Protocol is
consistent with the achievement of Australia’s unconditional 2020 target of 5 per cent below 2000 levels. Australia retains the
option later to move up within its 2020 target of 5 to 15, or 25 per cent below 2000 levels, subject to certain conditions being
met. This reference retains the status of these pledges as made under the Cancun Agreements and does not amount to a new
legally binding commitment under this Protocol or its associated rules and modalities."
10Table 3 Australia’s Second Kyoto Protocol commitment period – selected accounting
parameters 15
Accounting parameter tCO 2 eq. MtCO 2 e
Base year emissions - 2000 418,623,049 418.6
Net deforestation emission in 1990 148,163,361 148.2
Total base year emissions for 566,786,410 566.8
calculation of Assigned Amount
(including net deforestation
emissions in 1990)
QUELRO in % 99.5
Assigned amount ((8 x base year 4,511,619,826 4,511.6
emissions for calculation of including GHG emissions from
assigned amount) x (99.5)) conversion of forests
(deforestation)
Approach used to calculate the The GHGs, sectors and source
average annual emissions for the categories as used to calculate
first three years of the first the assigned amount for the
16
commitment period second commitment period
Article 3.7 ter calculation (N.B., –237,336,202 -237.3
only a positive difference will
result in cancellation of assigned
amount)
Limitation on the additions to 117,214,453 117.2
Australia's assigned amount
resulting from forest management
under Article 3.4
Australia submitted a report to facilitate the calculation of the assigned amount for
the second commitment period to the secretariat, following the rules set out in
Decision 2/CMP.8. These reports were subject to a technical review by an expert
review team. Australia’s review took place in September 2016 and resulted in a
calculation of Australia’s CP2 assigned amount17 which, once recorded in the
compilation and accounting database, becomes fixed for the commitment period.18
4. Cancun Agreement Pledge – 2020
Under the Cancun Agreement in 2010, Australia presented a quantified
economy-wide emission reduction target by 2020 of -5% up to -15% or -25% below
15
Id. and FCCC/IRR/2016/AUS, Report on the review of the report to facilitate the calculation of the assigned amount for the
second commitment period of the Kyoto Protocol of Australiahttps://unfccc.int/sites/default/files/resource/docs/2017/irr/aus.pdf
16
Parties may elect to calculate average annual emissions for the first three years of the first commitment period, for purposes of
Article 3.7ter's cancellation provision, by including either (1) the gases and sources listed in Annex A to the Kyoto Protocol, or (2)
the GHGs, sectors and source categories used to calculate the assigned amount for the second commitment period. The
opportunity to make such an election was hard fought by Australia in Paris, as it enables Australia to include deforestation
emissions in its calculation of emissions for each of these three years, avoiding a cancellation of a portion of its assigned amount
under 3.7ter. This election was permitted in exchange for Australia's support for a 1.5 global goal under the Paris Agreement,
which it had previously resisted. See "Paris UN Climate Conference 2015: Australia backs target of limiting warming to 1.5
degrees", The Sydney Morning Herald, December 6, 2015.
17
See FCCC/IRR/2016/AUS, Report on the review of the report to facilitate the calculation of the assigned amount for the second
commitment period of the Kyoto Protocol of Australia.
18
Decision 3/CMP.11, para 3, operating in conjunction with decision 13/CMP.1 para 10.
112000 level. 19 The original communication of this pledge from Penny Wong to UNFCCC
Executive Secretary DeBoer, contains the following elaboration:
Australia will reduce its greenhouse gas (GHG) emissions by 25 per
cent compared with 2000 levels by 2020 if the world agrees to an ambitious
global deal capable of stabilizing levels of GHGs in the atmosphere at 450 ppm
carbon dioxide equivalent (CO2 eq) or lower. Australia will unconditionally reduce
its emissions by 5 per cent compared with 2000 levels by 2020 and by up to 15
per cent by 2020 if there is a global agreement which falls short of securing
atmospheric stabilization at 450 ppm CO2eq under which major developing
economies commit to substantially restraining their emissions and advanced
economies take on commitments comparable to Australia.20
More caveats followed,21 as did a number of efforts to recast this target, settling on an
unconditional 5% reduction from 2000 levels, using a 2013-2020 budget approach, and a
medley of different Convention and Kyoto Protocol accounting approaches -- some different
for purposes of measuring emissions and for purposes of measuring progress. This mix of
approaches is identified in the Technical Review Report of Australia’s Third Biennial Report.22
Significant elements that impact Australia’s effective 2020 mitigation effort are: (1) its
decision not to move from a -5% target to a -15% reduction target; (2) its decision to address
the -5% target through a budget based approach rather than as a single year target; and (3) its
decision to incorporate into this budget the effects of the Australia clause and its CP1 108
QUELRO, through Australia's choice of an artificial starting point for setting the straight line
trajectory establishing its 2013-2020 budget.
Australia explains that it assesses its progress towards its 2020 target using an emissions
budget for 2013 to 2020.23 It explains that a trajectory to achieve the emissions budget is
calculated by taking a linear decrease from 2010 to 2020, beginning from the Kyoto Protocol
first commitment period target level, which was 108 per cent of 1990 levels (583 MtCO2-eq)
as calculated in Australia’s latest National Inventory Report submission, and finishing at five
per cent below 2000 levels in 2020.24
While Australia's -5% reduction target for 2020 is expressed relative to 2000 emission
levels including LULUCF25, its 2013-2020 budget does not start with a figure for actual
2000 emission levels, actual 2010 emission levels or actual 2013 emission levels (523
19
Available at https://unfccc.int/files/meetings/cop_15/copenhagen_accord/application/pdf/australiacphaccord_app1.pdf
20
Id.
21
Further caveats were subsequently added. See Decision 1/CP.16 (2011), referencing FCCC/CP/2010/7/Add.1, referencing
FCCC/SB/2011/INF.1. See also https://unfccc.int/topics/mitigation/workstreams/pre-2020-ambition/compilation-of-economy-
wide-emission-reduction-targets-to-be-implemented-by-parties-included-in-annex-i-to-the-convention: "In defining its targets for
2020, Australia considered that these targets refer to Australia’s net emissions from the sector and source categories included in
Annex A of the Kyoto Protocol as well as from afforestation, reforestation and deforestation activities, for the base year (2000)
and 2020. The 25% target is conditional to the inclusion of forests (reducing emissions from deforestation and forest degradation
in developing countries) and the land sector in the global agreement, while the 15% target is conditional on progress for their
inclusion". Further, "The 15% target is conditional to access on deeper and broader functional carbon markets. The 25% target is
conditional on global action that mobilizes greater financial resources, including from major developing economies, and results in
fully functioning global carbon markets". See FCCC/TP/2011/1, Quantified economy-wide emission reduction targets by
developed country Parties to the Convention: assumptions, conditions and comparison of the level of emission reduction efforts
(June 3, 2011).
22
FCCC/TRR.3/AUS, Report on the technical review of the third biennial report of Australia (October 2, 2018).
23
See Australia’s Emissions Projections 2018, at 38.
24
Id.
25
547 MtCO2e or 536 MtCO2e depending on whether the 2018 or 2019 projections are used.
12MtCO2e), or even the average of Australia’s inflated CP1 budget under the
Kyoto Protocol (592 MtCO 2 e/yr 26 ).
Instead, to generate a starting point for its budget calculation in 2010, the calculation
applies the nominal 108% increase formula from the first commitment period but
chooses to apply this formula to the total of "land use change and forestry" emissions
-- which are significantly higher than the category of land-use change emissions to be
used in the operationalisation of Article 3.7) (see Figure 2).
It is important to note that the Cancun target budget calculation changes with each
annual projection and has increase significantly from the 2018 to the 2019 projections.
In the December 2018 projections the 1990 land-use change emissions estimated for
this calculation were 163 MtCO2eq and December 2019 projections 185 MtCO2eq.
These numbers are to be compared to land use change emissions used in the CP1
calculated assigned amount of 131.5 MtCO2e (See Table 2) and the value of 148.2
MtCO2e used in the CP2 assigned amount calculation (which is already 12% higher
than in the original CP1 calculation estimates) (See Table 3). The December 2018
(2019) projections estimate of land use emissions for 1990 result in an emission
starting point in 2010 of 629 (653 MtCO2e), some 6% (10%) above the already inflated
first commitment period average annual allowed emissions (average of Assigned
Amount or 592MtCO2e26). The new December 2019 projections revised land and use
emissions for 1990 result in a higher budget.
As a consequence, Australia’s Cancun target budget calculation has increased from the
December 2018 to the December 2019 projections due to the increase in 1990
deforestation emissions estimate (even though the 2000 emissions estimate is lower
in the 2019 projection report the increase in 1990 is larger). The budget calculated for
2013-2020 in the 2018 Projection report is 4488 MtC02eq (“target trajectory”, table 1,
2018 Projection report), and has increased to 4508 MtC02eq in Projection Report
2019.
Parties recently raised t concerns about the choice of start point for Australia’s 2013-
2020 budget during Australia's multilateral International Assessment and Review (IAR)
process.27
Australia's Cancun pledge budget uses a starting point that borrows from the Kyoto
Protocol the 8% emissions increase in emissions Australia allowed itself in the first
Kyoto accounting period, as well as the so-called Australia Clause secured under the
Kyoto Protocol. These elements have the combined effect of enlarging Australia’s
2020 Cancun Agreement pledge emissions budget substantially, and consequently
reducing Australia's required mitigation effort substantially. If Australia had used
actual 2010 emission levels, or actual 2013 emission levels, its 2020 Cancun
26
Australia’s CP1 Assigned amount was 2,957.6 MtCO2e ((5 x base year emissions for calculation of assigned amount) x (1.08))
and hence the average is 592MtCO2e/yr.
27
See A compilation of questions to - and answers by - Australia exported 11 June 2019 by the UNFCCC Secretariat , available at
https://unfccc.int/sites/default/files/resource/SBI50_AUS_MA_QA.pdf
13Agreement budget would be significantly lower -- and the amount of
“overachievement” significantly smaller.
Figure 2 Approach taken by the Australian government to develop its develop its Cancun 2020 Pledge budget.
Taken from Figure 16 in the December 2018 government projections.
Figure 3 Approach taken by the Australian government to develop its Cancun 2020 Pledge budget. Taken from
Figure 28 in the December 2019 government projections.
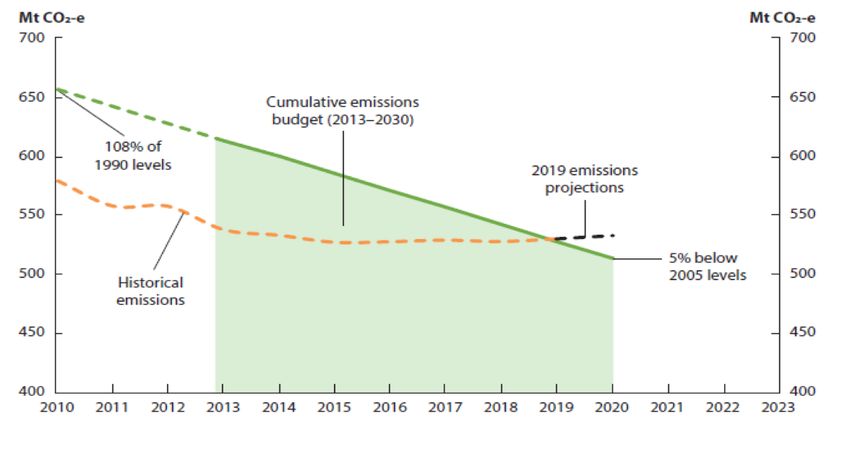
The Technical Review Report of Australia’s Third Biennial Report provides a useful
depiction of Australia’s actual and projected emissions from 2013-2020 as compared
to this constructed budget. See Figure 1 below, from FCCC/TRR.3/AUS:
14Figure 2. Net GHG emissions compared with the cumulative emission budget for the period 2013-2020. Taken
from Figure 1 the Report on the technical review of the third biennial report of Australia at p. 8.
5. Paris Agreement Nationally Determined Contribution - 2021 - 2030
Australia’s Paris Agreement target is a 26-28% reduction below 2005 levels by 2030,
covering 100% of the greenhouse gases and removals in Australia's national GHG
inventory. Australia states in its NDC its intention to account based on UNFCCC inventory
reporting categories, and that it assumes that accounting provisions under the PA will
preserve the integrity of the agreement by ensuring that claimed reductions are genuine and
not double counted.28
Australia's methodology for calculating the emission reductions required to meet the 26 and
28% reduction targets, and accompanying trajectory budgets, may be found in Australia's
Emissions Projections 2018.
B. Australia's actual domestic emission levels and projected emission
levels
Australia’s latest National Inventory Report was submitted in May 2019. It presents provisional
inventory data for 2017 that have not yet been reviewed. 29 The document contains multiple
sets of emission figures:
• One set of figures to satisfy Convention reporting obligations, prepared using
UNFCCC sectoral classifications and presented both with and without LULUCF
emissions
28
Australia’s Intended Nationally Determined Contribution to a new Climate Change Agreement | August 2015 ( Accounting
approach "Australia intends to account based on UNFCCC inventory reporting categories using a net-net approach. Australia will
apply IPCC guidance for treatment of natural disturbance and variation. Australia’s INDC assumes that accounting provisions
under the Paris agreement will: - Preserve the integrity of the agreement by ensuring claimed emissions reductions are genuine
and are not double counted; and - Recognise emissions reductions from all sectors.")
29
National Inventory Report 2017, Volume 1, The Australian Government Submission to the United Nations Framework
Convention on Climate Change, Australian National Greenhouse Accounts.
15• A set of figures to satisfy Kyoto reporting obligations, applying Kyoto
classifications and accounting rules (Table ES.03 and ES.04)30
• A set of figures used to track progress with its Cancun Agreem ent pledge
applying a combination of Convention and Protocol accounting approaches (Table
ES.02) 31
• A set of figures used to track progress with its Paris Agreement NDC (Table ES.01),
reflecting net emissions 32
Looking strictly at Convention reporting figures, in 2017 Australia’s total greenhouse gas
emissions, excluding the LULUCF sector, were 554.1 M t CO 2 eqt in 201733 -- an increase of
31.8% (133.8 M t CO 2 e) above 1990 levels.
When LULUCF sector emissions and removals are included in the total, Australia’s net
greenhouse gas emissions in 2017 were 534.7 M t CO 2 -eq -- a decrease of 11.6 % (70.2
Mt) on net emissions recorded in 1990. In 2017, the LULUCF sector was a net sink of 19.4
Mt CO2-e.
Table 4 Greenhouse Gas Emissions for Australia for the period 1990-2017 – 2017 NIR CTF Table 10 (data not yet
reviewed)
Greenhouse Gas Emissions for Australia for the period 1990-2017 – 2017 Percent
NIR CTF Table 10 (data not yet reviewed) Change
1990 2000 2005 2010 2015 2016 2017 1990- 1990-
2016 2017
Without 420,315.32 485,018.62 521,801.01 537,275.25 535,173.67 546,771.76 554,126.56 30.7 31.84
LULUCF
With 604,903.78 536,153.69 610,587.52 585,955.43 531,635.84 530,430.53 534,695.45 -9.0 -11.61
LULUCF
Australia’s emissions are projected to grow by 24-25 M t CO 2 -eq between 2015 and 2020
and another 19-23 M t CO 2 -eq between 2020 and 2030.34
Table 5 Australian historical emissions and projections to 2030
December 2018 Projections Historical Projected % %
change change
wrt 2005 wrt 1990
Australia’s emissions 1990 2000 2005 2010 2015 2020 2025 2030
trends, 1990 to 2030 (Mt
CO2-e)
GHG excl. LULUCF 420 485 522 538 537 553 551 564 8% 34%
GHG incl. LULUCF 577 547 605 560 516 540 548 563 -7% -2%
According to the Technical Review of the Australia's Third Biennial Report, Australia is
only on track to meet its 2020 target because it is combining elements of Kyoto and
Convention reporting rules. If UNFCCC classifications are used, Australia’s projected
30
NIR 2017, Volume 3, Chapters 11 to 15.
31
Id., Table ES.02 Net emissions by KP classification, Australia, 2000 and 2017 (Mt CO2-e)
32
Id., Table ES.01 Net greenhouse gas emissions under the UNFCCC by sector, Australia, 1990, 2005, 2010, 2016 and 2017 (Mt
CO2-e), at P. xi of NIR
33
NIR 2017, Volume 1, at 34.
34
See Australia’s emissions projections 2018 https://www.environment.gov.au/system/files/resources/128ae060-ac07-4874-
857e-dced2ca22347/files/australias-emissions-projections-2018.pdf and Australia’s Seventh National Communication on Climate
Change at 87.
16emissions in 2020 would be approximately the same level as they were in 2000.35 If
Australia applied the relevant Kyoto accounting elements for its 2020 target, then
Australia would see a decline of 0.05% below 2000 levels in 2020.36
Australia is using different assumptions for its National GHG Inventory numbers (which
do not apply elements of Kyoto accounting) and for its reports on progress toward its
target and future emission projections (which do use elements of Kyoto accounting).37
C. Carryover rules under the Kyoto Protocol and Paris Agreement
1. Kyoto Protocol first commitment period carryover rules and scale of potential
carryover for Australia following conclusion of the first commitment period
Units under the KP are fungible, which is to say that a variety of units have the same
equivalence and all can be retired toward a Party’s quantified commitment equally.
AAUs, CERS, RMUs from land sector activities, and ERUs fall into this category. AAUs,
CERs and ERUs could be acquired from other Parties. In the first commitment period,
RMUs (removal units) could be generated domestically from elected land sector
activities, including forest management, with a ‘forest management cap’ that applied
to both additions and subtractions from a Party’s assigned amount.38
While these units were fungible for use toward targets, not all units could be carried
over to subsequent Kyoto commitment period if they were not retired.
Article 3.13 of the Kyoto Protocol provides that “If the emissions of a Party included in Annex I
in a commitment period are less than its assigned amount under this Article, this difference
shall, on request of that Party, be added to the assigned amount for that Party for subsequent
commitment periods.” By decision 13/CMP.1, Parties agreed to the following restrictions and
limitations on carryover for the first commitment period:
• AAUs could be carried over without limitation
• CERs and ERUs from emission reduction projects could be carried over up to a
quantity equal to 2.5% of the Party’s initial assigned amount
• Any units issued on the basis of a LULUCF activity, including RMUs, tCERs, lCERS, and
ERUs generated by Joint Implementation LULUCF projects (and converted from RMUs)
may not be carried over.
Under the KP, if a Party has AAUs, ERUs or CERs remaining in its registry after it has
retired a sufficient number of units to cover its Annex A emissions for the period, it
may ask that these units be carried over to the subsequent CP, consistent with existing
rules. The Party must include a list of these units by serial number in its True Up
35
FCCC/TRR.3/AUS, Report on the technical review of the third biennial report of Australia (October 2, 2018), para 61.
36
Id.
37
Id., para. 17.
38
See Kyoto Protocol Reference Manual on Accounting of Emissions and Assigned Amount at 14-15. Australia did not elect Article
3.4 activities for the first KP commitment period, but did for the second (forest management, cropland management, grazing land
management and revegetation. See FCCC/TRR.3/AUS, para. 87.
17Report.39 After the ERT reviews the True up Report, it confirms the number available
for carryover. See Section 7.6 of the Accounting Manual
At the end of the first commitment period, Australia had 127,650,775 AAUs available for
carryover to CP2, and 21,768,290 CERs available for carryover to CP2.40 Taken together,
149,419,065 units were available. Australia’s True Up Report requested carryover in these
amounts and these calculations were subsequently approved for carryover.
Table 6 Total available for carryover to KP CP2
Units 41 tCO 2 e M tCO 2 e
AAUs 127,650,775 127,650.8
CERs 21,768,290 21,768.3
ERUs 0 0
Total 149,419, 065 149,419.1
Australia’s True Up Report for CP1 provides the serial numbers of the CERs requested for
carryover, which enables a review of the projects underlying these units and the volumes of
units from each. These CERs come from 30 different countries and from a wide array of
42
project types. Substantial volumes come from large hydro projects – a project type
considered least likely to present reductions that are "additional", 43 and hence potentially
problematic for environmental integrity. Further substantial volumes come from a coal
efficiency project at an Adani facility in India, contested by local stakeholders - at a time
when the IPCC has spoken to the need to phase out coal. Information on each of the True
Up Report's underlying projects is available at the UNFCCC's CDM web interface. 44
2. Kyoto Protocol second commitment period accounting rules and relevance to
Australia’s “proposed carryover”
Kyoto Parties altered land sector accounting rules for the second commitment period.
Forest management accounting became mandatory. Additional land sector activities
could be elected for accounting, or were mandatory if they had been elected in CP1.
Parties were required to provide forest management reference levels, and are
required to constrain the volume of removals used toward their targets by a
calculated forest management cap.45
39
These serial numbers indicate among other things the host party, vintage of reduction and relevant commitment period.
40
FCCC/KP/CMP/2016/CAR/AUS, Final compilation and accounting report for Australia for the first commitment period of the
Kyoto Protocol, (2 August 2016)
41
Id.
42
True Up Period Report attachment: Information on the serial numbers of Kyoto units request to be carried over to the second
commitment period (XLSX - 55.82 KB) available at https://www.environment.gov.au/climate-change/climate-science-
data/greenhouse-gas-measurement/publications/kyoto-true-up-report (referring to Host Parties AM, AR, BR, CL, CN, CO, CR, EC,
EG, GE, GT, HN, ID, IL, IN, JO, KE, KR, MX, MY, NG, PE, PH, PK, TH, TN, UY, UZ, VN, ZA).
43
See Cames, et al, How additional is the Clean Development Mechanism? Analysis of the application of current tools and
proposed alternatives Berlin, March 2016 available at
https://ec.europa.eu/clima/sites/clima/files/ets/docs/clean_dev_mechanism_en.pdf (at p 110-114)
44
See., e.g., hydro project in Vietnam in 2006 (VN-152), supercritical coal-fired power plant project (IN-2716), implemented by
Adani Power Ltd. and objected to by multiple Indian NGOs. https://carbonmarketwatch.org/publications/open-letter-regarding-
authorization-and-approval-letter-for-cdm-project-2716-grid-connected-energy-efficient-power-generation/
45
This cap is 3.5 per cent of the base year GHG emissions excluding LULUCF times the duration of commitment period in years.
See 2/CMP.7, para.13: “For the second commitment period, additions to the assigned amount of a Party resulting from forest
management under Article 3, paragraph 4, and from forest management project activities undertaken under Article 6, shall not
18Kyoto Parties also revamped the carryover rules for the second commitment period to
address the growing problem of surplus AAUs. The revised rules aimed to manage
surplus from the first commitment period and avoid the creation of substantial surplus
in the second commitment period. Two innovations included: (1) the establishment of
Previous Period Surplus Reserve (PPSR) accounts to manage CP1 surplus carried over
to CP2; and (2) a new Article 3.7ter, which aimed to truncate the establishment of new
CP2 surplus derived from unambitious CP2 targets, by trimming assigned amount for
certain Parties.
As a result of these new rules, any carryover of surplus AAUs from KP CP1 to KP CP2
would see these AAUs deposited into a new Previous Period Surplus Reserve for CP2
for each Party with an Annex B target for CP2. Once there, these AAUs are only
available for use up to the extent by which a Party may fall short of its CP2 target, and
only available during the true up period. These units are not available for use where
there is no subsequent commitment period. These rules constrain Australia's use of
surplus CP1 AAUs.
Decision 1/CMP.8, paras. 23-25, set out the process for carryover in CP2 as follows
(emphasis added):
23. Decides that each Party included in Annex I with a commitment
inscribed in the third column of Annex B as contained in annex I to this
decision shall establish a previous period surplus reserve
account in its national registry;
24. Decides also that where the emissions of a Party referred to in
paragraph 23 above in a commitment period are less than its assigned
amount under Article 3, the difference shall, on request of that Party, be
carried over to the subsequent commitment period, as follows:
(a) Any ERUs or CERs held in that Party’s national registry that have
not been retired for that commitment period or cancelled may be carried
over to the subsequent commitment period, up to a maximum for each unit
type of 2.5 per cent of the assigned amount calculated pursuant to Article
3, paragraphs 7 and 8;
(b) Any AAUs held in that Party’s national registry that have not been
retired for that commitment period or cancelled shall be added to the
assigned amount for that Party for the second commitment period.
That part of a Party’s assigned amount consisting of AAUs held
in that Party’s national registry that has not been retired for
that commitment period or cancelled shall be transferred to
its previous period surplus reserve account for the subsequent
commitment period, to be established in its national registry;
exceed 3.5 per cent of the base year greenhouse gas emissions excluding land use, land-use change and forestry pursuant to
Article 3, paragraphs 7 and 8, or any amendments thereto, times the duration of the commitment period in years.” The value of
this figure for Australia for CP2 is 117,214.453 Kt
19You can also read