A Snapshot of Future Sea Levels: Photographing the King Tide - 12 January 2009 Department of Environment, Climate Change and Water NSW
←
→
Page content transcription
If your browser does not render page correctly, please read the page content below
A Snapshot of Future Sea Levels:
   Photographing the King Tide

                          12 January 2009

             Department of
             Environment, Climate Change and Water NSW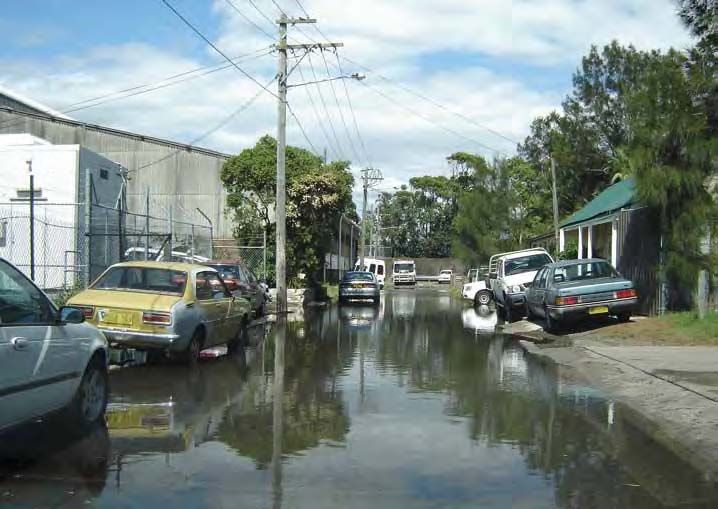
Front cover, left:
Sydney, botany bay
Tidal waters penetrating back up through
the stormwater system, 15 December 2008.
Photo: Warwick O’Brien.

Top right:
Sydney, Bondi Beach
Waves breaking over the ocean baths at the southern
end of the beach, 12 January 2009.
Photo: Dennis Gray.

Bottom right:
newcastle, carrington
Tidal waters of the Hunter River submerging
residential streets, 14 December 2008.
Photo: Bruce Coates.

Acknowledgments
DECCW would like to acknowledge the contributions from
all photographers who kindly donated their time to capture
images of the peak of the high tide in their local areas.
DECCW would also like to acknowledge the vision and
dedication of Phil Watson (Team Leader, Coastal Unit) who
made this initiative and report possible. Similarly, Ainslie
Frazer (Senior Natural Resource Officer, Coastal Unit) has
been responsible for the monumental task of collating and
coordinating the thousands of images received.
DECCW would also like to acknowledge the contributions
of the many parties that made it possible to coordinate the
project, acquire the data and prepare the report, including:
Dr John Church (Chief Research Scientist,
Marine and Atmospheric Research, CSIRO)
Dr Kathleen McInnes (Principal Research Scientist, Centre
for Australian Weather and Climate Research: a partnership
between CSIRO and the Bureau of Meteorology)
Dr Bill Mitchell (Director, National Tidal Centre,
Bureau of Meteorology)
Sarah Hesse (Manly Hydraulics Laboratory,
Department of Commerce)
Matthew Smith (Manly Hydraulics Laboratory,
Department of Commerce)
Gary Batman (Sydney Ports Corporation)
Tony Nusco (Sydney Ports Corporation)
Geoff Withycombe (Sydney Coastal Councils Group)
Chris Tola (Coastalwatch)

© DECCW 2009                                                                 Published by:
This report has been prepared by the Coastal Unit, Department of             Department of Environment, Climate Change and Water NSW
Environment, Climate Change and Water NSW (DECCW) to summarise               59–61 Goulburn Street; PO Box A290 Sydney South 1232
the state-wide photographic event which captured impacts of the king         Phone: (02) 9995 5000 (switchboard)
tide on 12 January 2009. The report is not to be reproduced in part or       Phone: 131 555 (environment information and publications requests
whole by third parties without the permission of DECCW.                      Phone: 1300 361 967 (national parks information and publications
The Department of Environment, Climate Change and Water NSW has              requests)
prepared this publication with all due care and attention, but we don’t      Fax: (02) 9995 5999
guarantee its accuracy or its application to any particular circumstances.   TTY: (02) 9211 4723
Users of this publication should, as necessary, seek expert advice before    Email: info@environment.nsw.gov.au
applying this information to particular circumstances.                       Website: www.environment.nsw.gov.au

Suggested citation: Watson PJ and Frazer A (2009),                           ISBN 978 1 74232 472 2
A Snapshot of Future Sea Levels: Photographing the King Tide                 DECCW 2009/722
12 January 2009, Department of Environment, Climate Change                   November 2009
and Water NSW, November 2009.                                                Printed on recycled paper
Contents                                                      Foreword:
                                                              Protecting our coast
Foreword: Protecting our coast                            1   The interface between tidal waters and the land holds a very
                                                              special place within our culture. While supporting most of our
Summary: About this report                                2   population, the coastal zone is dealing with increasing
                                                              development, tourism and resource use as well as the effects of
Photographing the king tide                               2
                                                              natural physical processes and climate change.
Ocean water levels and tides                              4   Clearly we need to take great care in managing the interrelated
                                                              environmental, social, economic and planning issues within the
What happened on 12 January 2009?                         8   coastal zone, particularly in response to one of the major
                                                              threats: sea level rise. In this regard, the photographic event
How climate change is affecting sea level                10
                                                              during the January 2009 king tides proved a very successful
Impacts highlighted by the photos                        18   community effort in gathering a state-wide snapshot of areas
                                                              currently vulnerable to tidal inundation and raising public
Implications for                                              awareness about rising sea level.
photographing future king tides                          20   The enthusiastic response from the community, environmental
                                                              groups, and local and state government agencies deserves
Conclusions                                              22   recognition. More than 250 people joined in photographing the
                                                              foreshores around the peak of the king tide along the State’s
What happened on                                              intertidal margins.
13 and 14 December 2008?                                 24
                                                              As a national first, the Department of Environment, Climate
Appendix 1: Synoptic charts                              26   Change and Water (DECCW) has since fielded many enquiries
                                                              seeking to expand the program around the country in 2010.
References                                               28   Given the success of this as a public awareness campaign, there
                                                              may be substantial benefits in capturing this valuable data
                                                              regularly on a national basis.
Abbreviations                                                 DECCW is now involved in developing a NSW Climate Change
                                                              Action Plan. Over the coming years, this Action Plan will provide
AHD        Australian height datum – national standard
                                                              a blueprint for NSW’s response. By giving an insight into the
           survey datum which approximates mean sea level
                                                              effects of sea level rise, this photographic event highlights the
CSIRO      Australian Commonwealth Scientific                 need for us all to take action.
           and Industrial Research Organisation
                                                              We need the community and all spheres of government to work
DECCW      Department of Environment,                         together to meet the challenges posed by sea level rise. I would
           Climate Change and Water NSW                       like to thank the DECCW Coastal Unit for its leadership in
EDT        eastern daylight time                              developing this innovative project. This report will undoubtedly
           (equivalent to eastern standard time)              be a valuable source of information for coastal zone managers
                                                              and the broader community alike.
EST        eastern standard time
           (equivalent to eastern daylight time)
IPCC       Intergovernmental Panel on Climate Change
                                                              Lisa Corbyn
TGZ        Tide gauge zero at Fort Denison. The zero on the
           gauge is approximately 925 mm below AHD.           Director General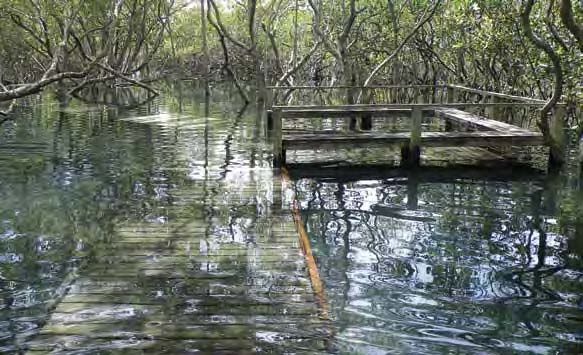
Summary:                                                      Photographing
About this report                                             the king tide
The summer king tide event forecast for 12 January was        The idea of photographing the impacts of the January 2009
the largest predicted tide for 2009 that would be visible     king tide was initially canvassed only six weeks before the
during daylight hours. This presented a wonderful             event. We thought we might be successful in covering
opportunity to engage the community in photographing          some high priority sites. However, the enthusiasm of the
the peak of the king tide along the whole NSW coastline,      NSW coastal community rapidly turned the exercise into
with two primary objectives in mind:                          a state-wide initiative.
•   identifying areas vulnerable to tidal inundation,         More than 250 photographers captured over 4,000
    capturing the tide level against revetments, seawalls,    images during the peak of the high tide, covering areas
    jetties and other marine infrastructure; and              along the open coast and within the estuarine margins of
•   raising awareness throughout the wider community          the state. The participants came from a wide cross-section
    about the current projections for sea level rise to the   of the community, including staff from NSW government
    end of the century (approximately 90 cm).                 agencies, local government authorities, catchment
                                                              management authorities, Manly Hydraulics Laboratory,
This photographic event proved successful in engaging         Water Research Laboratory, volunteers from the State
over 250 people to capture over 4,000 images providing        Emergency Service, local environmental groups, beachfront
a broad, state-wide snapshot of areas and assets currently    and waterfront property owners and a large contingent of
vulnerable to the threat of tidal inundation.                 the broader community.
The strongest message for the community is that               The NSW Department of Lands arranged for aerial
all tide levels reached could well be 90 cm deeper            photography around the high tide at selected locations
by the end of the century. Alternatively, rare (‘king’)       to augment the on-ground coverage. In addition, the
                                                              Department of Environment, Climate Change and Water
tide water levels in 2009 are likely to be relatively
                                                              NSW (DECCW) was given access to beach imagery from the
common water levels by 2100.                                  monitoring network of Coastalwatch cameras to assist with
                                                              this unique state-wide photographic exercise. Not
This report presents a selection of the photographs
                                                              surprisingly there was a heavy concentration of
taken around the peak of the king tide on 12 January 2009,
                                                              photographic coverage in the Sydney Harbour basin, but
and some images from the very high spring tide that
                                                              the state-wide coverage of known vulnerable areas was
occurred in December 2008. It presents a summary of the
                                                              also significant. (See map of the coverage, opposite.)
information gleaned from the photographic event, along
with general technical information about tides and the
                                                              Coffs Harbour Jetty
current status of information on climate change and
rising sea levels.                                            Tidal waters of Coffs Creek penetrating back up
                                                              through the stormwater system, 12 January 2009.
                                                              Photo: Mel Bradbury, NSW Department of Primary Industries.

2                                                                  A Snapshot of Future Seas Levels: Photographing the King Tide 12 January 2009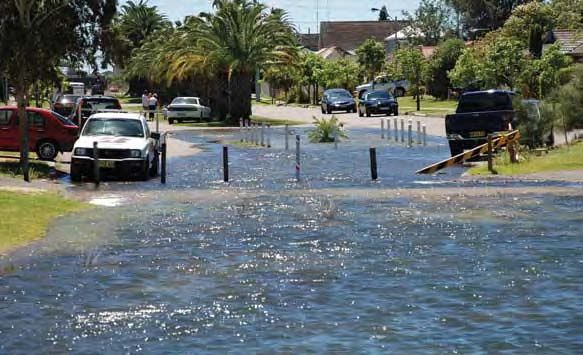
Photographic coverage of the NSW coastline, 12 January 2009

                                                              Photos are
                                                              arranged
                                                              from north
                                                              to south.

                                                              Note: Grid coordinate
                                                              system is Map Grid of
                                                              Australia (MGA).

Department of Environment, Climate Change and Water NSW                               3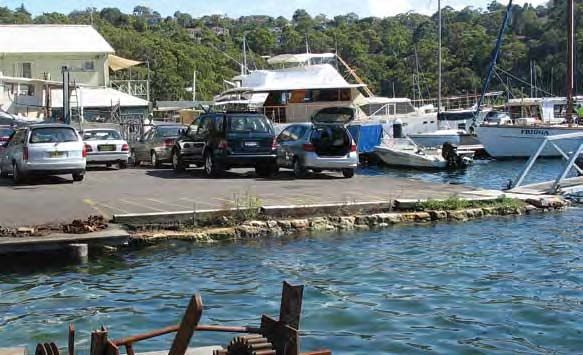
Ocean water levels and tides
Ocean water levels are continually being influenced           We need to understand the contributions of each of these
by three interacting systems:                                 components (particularly during extreme ocean storms) so
•   the prevailing weather (e.g. winds, barometric            we can assess probable inundation levels when designing,
    pressure, El Niño and La Niña episodes), and              planning and managing the coastal environment.

•   oceanic processes (e.g. waves and currents),              There is another force at work here as well. We know
    superimposed on                                           beyond doubt that ocean water levels are rising due
                                                              to climate change. The rare (‘king’) tide water levels we
•   the prevailing astronomical tide.
                                                              experience in 2009 are likely to be relatively common water
During extreme ocean storms, the combined influences          levels by 2100. This is discussed under ‘How climate change
of weather systems, waves and tides have resulted in wave     is affecting sea level’.
run-up on exposed ocean beaches measured as high as
7 metres above mean sea level at isolated locations. Inside
estuaries, where ocean wave penetration is limited, the
                                                              The influence of the Sun and Moon
water levels are comparatively lower, governed generally      The regular and predictable changes in the ocean level that
by weather conditions, local wind-driven waves and the        we refer to as astronomical tides are due to the combined
prevailing tide.                                              influences of the Sun and the Moon and their position
                                                              relative to the Earth at a given point in time.

Photos of the
2009 king tide
12 January 2009
The water level you see in
these images of the 2009 king
tide is currently exceeded for
only about 22 hours per year
(based on long-term data
from Fort Denison, Sydney
Harbour). However, by the
end of the century, assuming
sea level will rise by 90 cm,
these depicted water levels
could be reached or exceeded
for approximately 39% of the
time, which is equivalent to
almost 4.7 months a year.
Similarly, these photos show
the impacts of tidal water
levels which are projected
to be up to 90 cm deeper
by 2100.

1 & 2: Tweed Heads,
Ukerabah historic site
Boardwalk submerged.
Photos: Lance Tarvey, DECCW.

4                                                                 A Snapshot of Future Seas Levels: Photographing the King Tide 12 January 2009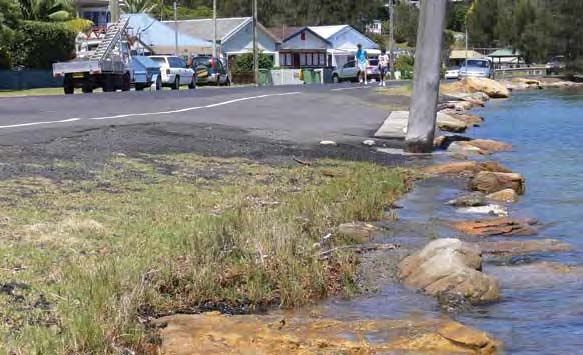
The tide is, in effect, a very long and slow-moving wave Spring tides occur every 14.5 days
governed by the complex range of gravitational forces
So-called ‘spring’ tides occur throughout the year at regular
applied by the Moon and Sun which are also modified by
intervals. When talking about tides, the term ‘spring’ simply
the motion of the Earth. The Moon, with a gravitational
refers to the larger range of tides. The ‘spring’ tidal range
influence almost twice that of the Sun, is the primary factor
occurs every 14.5 days when the Moon is either full or
controlling the temporal rhythm and height of the tide.
new and results from the Sun, Earth and Moon falling
The NSW coast experiences two high and two low tides into alignment, therefore combining their gravitational
daily. A tidal cycle (high-low-high or low-high-low) takes attractions on the ocean water surface.
approximately 12 hours and 25 minutes. A tidal day
therefore is approximately 24 hours and 50 minutes. The ‘King’ tides are the highest ‘spring’ tides –
reason the tidal day is longer than 24 hours is that the
Moon orbits the Earth in the same direction that the Earth
occurring twice a year
spins, and while the Earth takes 24 hours to complete a full The term ‘king’ tide is a common term with no particular
rotation, the Moon has moved slightly along its orbit. Thus scientific meaning. It has been coined to describe the
the Earth has to spin a little further (for 50 minutes) before highest ‘spring’ tide. While spring tides occur every
the same location on the Earth faces the Moon again. For 14.5 days, on the full or new phases of the Moon, orbits
this reason, the same tidal phase (e.g. peak high tide) of the Moon around the Earth and the Earth around the
occurs 50 minutes later each day (MetEd 2006). Sun result in distinct variations to the spring tide range.
3: North Ocean Shores
Sea water backing up
through the stormwater
system.
Photo: Brett Miller,
Water Research Laboratory.
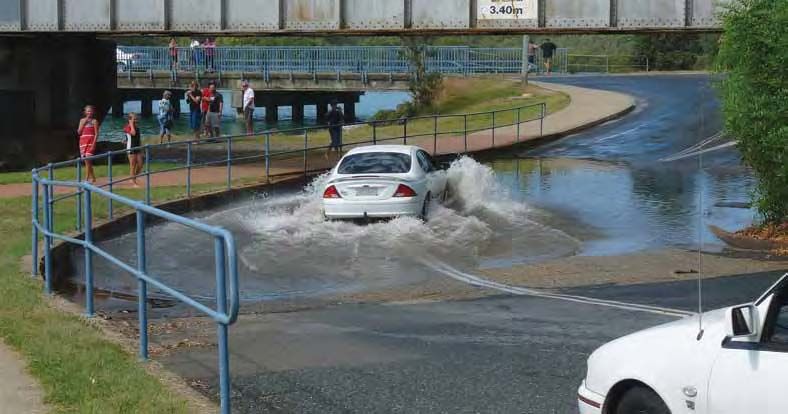
4: Near Brunswick Heads,
foreshore of the
Brunswick River
Water level allowing only
limited clearance for a bike
track under the Pacific
Highway.
Photo: Brett Miller,
Water Research Laboratory.
Department of Environment, Climate Change and Water NSW 5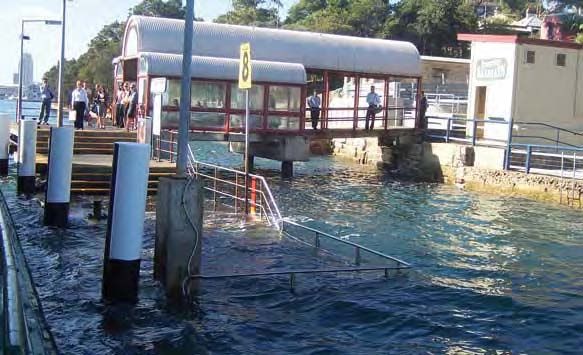
The Moon has a slightly elliptical orbit around the Earth
and therefore is closer to the Earth at certain times,
                                                                  How we predict tide levels
increasing its gravitational attraction on the ocean water        Tidal predictions are calculated at over 90 locations
surface as a result. Similarly, the Earth follows an elliptical   around Australia by the National Tidal Centre (Bureau of
orbit around the Sun, being closer during the summer and          Meteorology). By analysing the water levels observed over
farthest away during winter, creating distinct seasonal           a sufficiently long time period we can isolate the
variations in the gravitational pull on the ocean surface.        contributions made by the Sun, Earth and Moon. The
                                                                  contributions from each particular process or gravitational
As a result, in the southern hemisphere the spring tide           interaction are known as tidal constituents, and each
ranges peak during December, January and February and             particular location on the planet has site-specific tidal
also during June, July and August. Due to the combined            constituents including:
influences of the respective gravitational contributions,
the highest spring tide occurring on the new or full moon         •   gravitational and centrifugal forces caused by rotation
during these seasons is colloquially termed the ‘king’ tide.          of the Earth-Moon system

During the summer months the high spring tides occur              •   the Sun’s gravitational pull
during daylight hours and during the winter months the            •   changes in the angle of the Earth-Moon-Sun plane
high spring tides occur at night. In NSW, the peak spring         and numerous other and progressively weaker
tide (or ‘king’ tide) is usually higher than 2 m above tide       astronomical influences.
gauge zero (TGZ) at Fort Denison in Sydney Harbour.
                                                                  In all, the National Tidal Centre considers 114 tidal
(This translates to higher than 1.08 m AHD.                       constituents (specific influences due mainly to the sun
TGZ is approximately 0.925 m below AHD.)                          and moon) when predicting tides for a specific location.

5: Byron Bay,
Belongil Beach
Beach and public access at
Manfred Street submerged.
Photo: Ben Fitzgibbon,
Byron Shire Council.

6: Byron Bay CBD
Beach submerged at Jonson
Street protection works.
Photo: Ben Fitzgibbon,
Byron Shire Council.

6                                                                      A Snapshot of Future Seas Levels: Photographing the King Tide 12 January 2009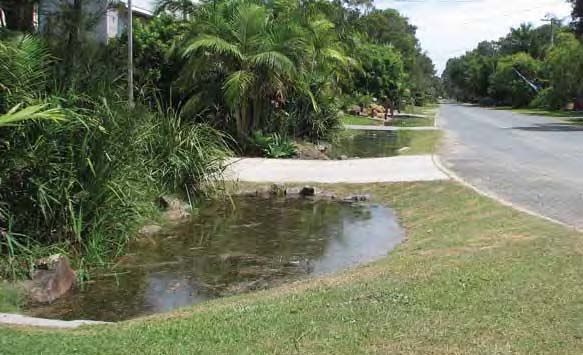
However, tidal predictions are also based on an assumed      The tide gauge at Fort Denison in Sydney Harbour has been
atmospheric pressure at mean sea level. Local weather        recording ocean water levels since 1866 and is the longest
including atmospheric pressure systems (the highs and        continuous record of ocean water levels in NSW. From
lows shown on weather report synoptic charts) can have a     these records we know that most tidal anomalies are
substantial impact on actual water levels. This means that   between minus 10 cm and plus 20 cm. The largest tidal
ocean water levels (excluding wave impacts) could differ     anomaly (from 1914 to 2009) was 59 cm recorded in May
from the predicted tide level by as much as plus 60 cm or    1974 during the most significant ocean storm on the
minus 20 cm.                                                 historical record.

                                                                                             9: Ballina, Tamar Street
The difference between measured
                                                                                             bus interchange
water levels and tidal predictions                           7: Lennox Head, southern        Tidal waters of the
Although we can predict the astronomical influences on       end of Seven Mile Beach         Richmond River penetrating
ocean water levels with great precision, other more local    Wave overtopping                back up through the
factors can also affect ocean water levels. The difference   the public walkway.             stormwater system.
between the predicted tide and the measured ocean level      Photo: Richard Hagley, DECCW.   Photo: Ballina Shire Council.
is referred to as the tidal anomaly.
                                                             8: Ballina                      10: Ballina, Tamar Street
Typical processes and phenomena which can alter ocean
                                                             Wave overtopping the            Tidal waters of the
water levels relative to the predicted tide include:
                                                             breakwater structure            Richmond River penetrating
atmospheric pressure, winds, waves, the El Niño Southern
                                                             at the entrance to the          back up through the
Oscillation (ENSO), ocean currents and temperatures,
                                                             Richmond River.                 stormwater system.
coastal trapped waves and harbour waves.
                                                             Photo: Warren Scanlon.          Photo: Ballina Shire Council.

Department of Environment, Climate Change and Water NSW                                                                      7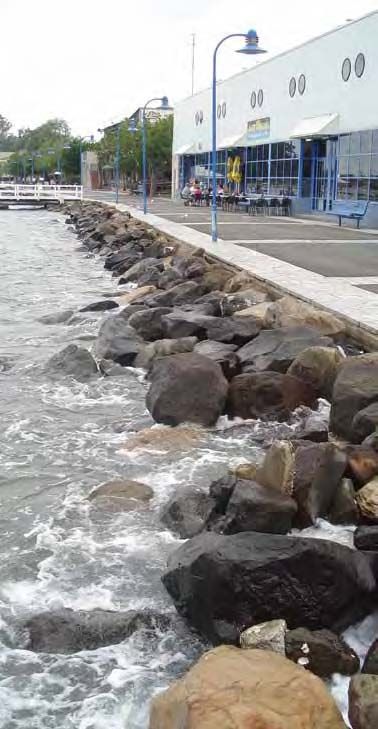
What happened on 12 January 2009?
The peak of the 2009 summer king tide occurred at            Based on analysis of the long-term data from Fort Denison,
0850 hours EST on 12 January. The peak water level           on average we would expect to reach a water level of this
was 9 cm lower than predicted, mainly due to a high          measured peak (1.96 m) for approximately 22 hours per
pressure system over the majority of the NSW coast.          year.
                                                             One of the primary reasons the measured water level was
At 0850 hours EST the tide gauge at Fort Denison (Sydney     lower than the predicted tide at most locations within the
Harbour) measured a peak water level of nearly 2 m above     NSW ocean water level recording network was due to the
tide gauge zero (1.96 m above TGZ, translating to 1.035 m    influence of a large high pressure system dominating
AHD). This peak was 0.09 m (9 cm) lower than the predicted   much of the NSW coastline at the time of the king tide
peak of 2.05 m above TGZ.                                    (see Appendix 1: Synoptic charts) which had the effect
                                                             of depressing coastal sea levels.

11: Ballina, Ballina
Quays canal estate
Limited clearance between
tidal waters and floor levels.
Photo: Ballina Shire Council.

12: Ballina CBD
Limited clearance
between tidal waters and
the foreshore along the
Richmond River, close to
an apartment complex.
Photo: Peter O’Keefe,
Ballina Shire Council.

8                                                                A Snapshot of Future Seas Levels: Photographing the King Tide 12 January 2009
13: Ballina, Burns
Point Ferry Road
Tidal waters of the
Richmond River penetrating
back up through the
stormwater system.
Photo: Ballina Shire Council.
14: Wooli, River Street 16: Gordon Park
Tidal waters of the Wooli Tidal waters of the Nambucca
Wooli River flooding the River submerging a section of
rear of the Wooli Kiosk. the public walkway along the
Photo: Wayne Jubb. foreshore.
Photo: Nancy Zek.
15. Coffs Harbour,
Coffs Creek 17: Port Macquarie,
Tidal waters lapping at Hastings River
the ground-floor level of Stormwater drainage canal
commercial premises. completely submerged.
Photo: Martin Rose, Photo: Gordon Cameron,
Coffs Harbour City Council. Hastings Council.
Department of Environment, Climate Change and Water NSW 9How climate change is affecting sea level
We know that one of the consequences of climate change graphic demonstrations of the impact of higher sea levels,
is that mean sea level will be significantly higher than it is and we know from studies, that existing infrastructure,
today. Inevitably this means that low-lying land and coastal facilities and development will be need to be upgraded,
areas, particularly land within the tidal zone, will change replaced or re-designed. For example:
forever. The natural environment and the built environment • Existing gravity-controlled street drainage and
will be dealing with: stormwater systems that drain to the sea will
• inundation by seawater become less capable over time.
• higher tides and higher storm surges • The boundaries of waterfront properties referenced
• receding shorelines, and to the mean high water mark will move successively
landward over time, with the land becoming more
• salt water intruding into freshwater environments. vulnerable to inundation.
The obvious questions are – how much, and when? • Seawalls and other coastal defence systems will
Can we predict critical sea levels and dates, and how also have to be incrementally upgraded over time to
accurate are our predictions? What will the social, address the increasing threat from larger storm surges
environmental and engineering consequences be? and inundation at higher projected water levels.
Observing and recording king tides gives us an invaluable (Watson and Lord 2008)
snapshot of future sea levels. We can see from these
18: Wallabi Point
Sea water overtopping the
berm into Saltwater Lagoon.
Photo: Lisa Reddon and Kirsty
Hughes, Mid North Coast Water.
19: Dunbogan
Foreshore Reserve
Limited clearance between
the Camden River and the
reserve adjoining the
roadway.
Photo: Peter Dorman.
10 A Snapshot of Future Seas Levels: Photographing the King Tide 12 January 2009What is causing sea level to rise?
There are several processes causing mean sea level
to rise over time:
• Ocean temperatures are increasing overall, and as the
water warms it expands, increasing its volume – this is
the biggest component of sea level rise (about 60%). 20: Tea Gardens, 22: Nelson Bay Marina
• Glaciers, ice caps and ice sheets are melting and losing Myall River Limited clearance to
mass, and permafrost is thawing, causing runoff into Tidal waters lapping at the ground-floor levels.
the ocean. ground-floor level of a café. Photo: NSW Department
of Lands.
• Sediments being deposited into the ocean are
Photo: Kevin Haskew.
building up on the ocean floor; and 21. Newcastle,
• The mass of water stored within the earth as fresh Shortland Esplanade
water is changing. Waves overtopping the
(IPCC 2001) seawall and foreshore
pathways.
Photo: Kristy Munro,
Newcastle City Council.
Department of Environment, Climate Change and Water NSW 11What is ‘mean sea level’? We also talk about eustatic changes in sea level,
meaning global changes in sea level due to water mass
Mean sea level is defined as the height of the sea with added or removed from the oceans (from melting ice
respect to a land benchmark, averaged over a period sheets, for example). To detect eustatic changes in sea level,
of time, such as a month or a year, long enough so that the movement of the land needs to be subtracted from the
fluctuations caused by waves and tides are largely records of tide gauges and geological indicators of past
removed. sea level.
Changes in the level of land masses are referred to as
Relative, eustatic and isostatic changes isostatic changes. Widespread land movements are
Changes in mean sea level measured by tide gauges are caused by isostatic adjustment resulting from the slow
called relative changes in sea level, because they can viscous response of the Earth’s mantle to the melting of
come about either by movement of the land on which large ice sheets and the addition of their mass to the ocean
the tide gauge is situated or by changes in the height of since the end of the most recent glacial period (‘Ice Age’).
the adjacent sea surface (both considered with respect to
We need to take these different contributing factors into
the centre of the Earth as a fixed reference).
account in order to accurately measure changes in sea level
and understand how sea level is changing.
23: Norah Head,
Cabbage Tree Harbour
Wave run-up penetrating to
the base of the escarpment,
submerging the beach.
Photo: Greg White,
Wyong Shire Council.
24. Central Coast,
Brisbane Water, Tascott
Limited clearance to the crest
of the foreshore revetment
protecting the road along
Brisbane Water Drive.
Photo: Phil Watson, DECCW
12 A Snapshot of Future Seas Levels: Photographing the King Tide 12 January 2009Measuring past sea levels From detailed analysis of global tide gauge records, the
Intergovernmental Panel on Climate Change (IPCC 2007)
We measure sea level from several data sources concluded that the rate of observed sea level rise increased
including long-term tide gauge records and more from the 19th to 20th century and that the total 20th
recent technologies including satellite altimetry. century rise was estimated to be 17 ± 5 cm. IPCC (2007)
similarly concluded that global average eustatic sea level
Tide gauge records from around the rise over the period from 1961 to 2003 is estimated at
world show sea levels increasing over 1.8 ± 0.5 mm/year.
the long term
Satellite measurements confirm
Sea level rise has been evident from very long-term tide
gauges stationed around the world, particularly those in
what we know from the tide gauges
northern Europe. The two longest continuous tide gauge Since 1992 we’ve been able to measure the altitude of the
records in Australia, Fremantle (from 1897) and Fort surface of the ocean using satellites – this is called satellite
Denison (from 1866) show similar trends in increasing sea altimetry. Satellite measurements reveal that global sea
level over time. Tide gauge records from 1920 to 2000 tell level is slowly rising, confirming what we have observed
us that the change in relative mean sea level around the from tide gauges around the world.
Australian coastline was about 1.2 mm/year over that When we examine both tide gauge data and satellite
timeframe. (Church et al. 2006) altimetry data there is clear evidence that global average
sea level has been rising slowly, at an increasing rate.
Global Mean Sea Level (GMSL) − 1870 to 2007
300
1
tide gauge data & error
250
satellite altimeter data2
200
150
GMSL (mm)
100
50
0
−50
Yearly average data 1
Updated from Church and White (GRL, 2006)
Latest data: 2007
Figure updated: 24−Jul−2008 2
Combined TOPEX/Poseidon + Jason−1 (CSIRO)
−100
1860 1870 1880 1890 1900 1910 1920 1930 1940 1950 1960 1970 1980 1990 2000 2010 2020
Year
Source: www.cmar.csiro.au
25. Central Coast,
Brisbane Water,
Davistown
Limited clearance to the top
of the foreshore revetment
and public reserve.
Photo: Leon Brooks,
Gosford State Emergency Services.
26. Central Coast,
Brisbane Water,
Pretty Beach
Limited clearance between
tidal waters and floor levels.
Photo: Fiona Lambell.
Department of Environment, Climate Change and Water NSW 13Projecting future sea levels IPCC (2007) advises that while there will be a rise in global
average sea level, there will be considerable regional
The Intergovernmental Panel on Climate Change (IPCC) variability in the rate of sea level rise. Recent modelling
represents a consensus of the world’s leading scientists undertaken by CSIRO (2007) indicates the ocean water
studying climate change. IPCC has made projections about levels off the NSW coastline could be of the order of 0-8 cm
sea level rise based on a set of possible future scenarios. and 0-12 cm higher than the global average by 2030 and
These scenarios take into account differing world socio- 2070, respectively.
economic conditions and population regimes, and differing
levels of greenhouse gas emissions. Considering the IPCC (2007) continues to build on the reliability of previous
different scenarios enables IPCC to generate a range of sea level rise projections through improved understanding
predictions. of complex governing ocean-atmosphere relationships,
improved understanding of global water budgets, greater
IPCC (2007) projections of global average sea level rise over diversity and capacity of mathematical models and
the 21st century, from the various modelled emission synthesis of longer and improved measured data from
scenarios, range from 18 to 59 cm (at 2090–2099 relative to integrated tide gauge networks and satellite altimetry.
1980–1999). A further allowance of 10 to 20 cm is advised
for the upper range of sea level rise scenarios in the event Although the international scientific community is
that ice sheet flow rates increase linearly with global continuing to improve our knowledge of climate change
average temperature change. Importantly, IPCC (2007) impacts and predictions, our understanding of all the
advises that larger sea level rises cannot be excluded. complex, interrelated climatic, atmospheric and oceanic
processes remains incomplete. Current satellite altimetry
27: Central Coast,
Brisbane Water,
Pretty Beach
Tidal waters overtopping the
foreshore revetment along
Pretty Beach Road.
Photo: Fiona Lambell.
28: Sydney Northern
Beaches, Bilgola
Waves overtopping
and submerging Bilgola
ocean baths.
Photo: Peter Marshall.
14 A Snapshot of Future Seas Levels: Photographing the King Tide 12 January 2009measurements from 1992 to present indicate measured
global average sea level rise over this period at
approximately 3.2 ± 0.4 mm/year, in line with the upper-
bound IPCC (2007) model predictions.
IPCC (2007) advises that sea level rise under global
warming is inevitable. Thermal expansion would continue
for many centuries after greenhouse gas concentrations
have stabilised, for any of the CO2 emission scenarios
assessed, causing an eventual sea level rise much larger
than projected for the 21st century. The eventual 31: Sydney, Manly Beach
29: Central Coast, Beach width and public
contributions from Greenland ice sheet loss could be
Pearl Beach access significantly reduced
several metres (and larger than from thermal expansion),
should warming in excess of 1.9 to 4.6°C or more above Limited beach width at the southern end of the
pre-industrial levels be sustained over many centuries (IPCC available above the beach.
2007). The long timescales of thermal expansion and ice wave run-up. Photo: Rafiqul Islam,
Photo: Graham Williams. Manly Council.
sheet response to warming imply that stabilisation of
greenhouse gas concentrations at or above present levels
30: Sydney, 32: Sydney Harbour,
would not stabilise sea level for many centuries (IPCC 2007).
Freshwater Beach Little Manly Beach
Beach width reduced Foreshore accessways
at high tide. submerged.
Photo: Debbie Millener, Photo: Sarah Hesse,
Warringah Shire Council. Manly Hydraulics Laboratory.
Department of Environment, Climate Change and Water NSW 15How much will sea level rise, and when? Notes:
(1) Estimates of sea level rise
(derived estimates) have
Sea level rise estimates for NSW: 40 years and 90 years from 2010 been determined from a
synthesis of authoritative
Since 1992 sea level rise has been tracking at or above the worst-case scenario shown
and up-to-date sources of
in the table below. However, this is a relatively short time frame, and we need to look at the information regarding sea
best-case, medium and worst-case scenarios to work out how to cope with rising sea levels. level rise including IPCC
and CSIRO publications.
All derived estimates are
Year 2050 Year 2100 relative to a baseline of
1990 mean sea level.
Estimate Recommended Estimate Recommended
of sea planning of sea planning (2) Recommended planning
allowances have been
level rise (1) allowance (2) level rise (1) allowance (2)
rounded to the nearest
(cm) (cm) (cm) (cm) 10 cm and are provided for
guidance only. Given the
Best-case scenario 06 (3) 10 18 (5) 20 uncertainty associated with
sea level rise (SLR) estimates
Medium estimate (7) 22 25 56 55 – the difference between
the best-case and worst-
case scenarios – planners
Worst-case scenario 38 (4) 40 94 (6) 90 are advised to use a risk
management approach
when choosing a planning
Source: After Watson and Lord 2008 allowance.
33: Sydney Harbour,
Castlecrag Marina,
Limited clearance
to the carpark.
Photo: Nicola Faith,
Willoughby Council.
34: Sydney Harbour,
Balmoral Beach
Beach width
significantly reduced.
Photo: Helen McParlane.
16 A Snapshot of Future Seas Levels: Photographing the King Tide 12 January 2009Since 1992, albeit a relatively (6) SLR estimate from Table
short timeframe, SLR has SPM.3, IPCC, 2007, using the
been tracking at or above 59 cm advised (relative to
the worst-case scenario 1990 levels). An additional
(the upper-bound IPCC 20 cm has been added to
trajectory curves). account for the possibility
of ice sheet flow rates
(3) SLR estimate derived from
increasing linearly with
Figure 11.12, IPCC 2001.
increased temperature for
(4) SLR estimate derived from upper-bound projections
Figure 11.12, IPCC 2001, as advised by IPCC (2007).
with the addition of 10 cm A further 15 cm has been
to estimate the upper- added to estimate the
bound regional increase upper-bound regional 37: Sydney, Ryde,
in SLR above the global increase in SLR above the 35: Sydney Harbour,
average based on linearly global average based on Milsons Point Kissing Point Park
interpolating upper-bound linearly extrapolating Base of the south pylon of Carpark adjoining the
modelled estimates for 2030 upper-bound modelled the Sydney Harbour Bridge. Parramatta River submerged.
and 2070 (CSIRO 2007). estimates for 2030 and 2070
Photo: Adrian Turnbull, Photo: Peter Mitchell.
(CSIRO 2007).
(5) SLR estimate from Table North Sydney Council.
SPM.3, IPCC, 2007. (7) Medium position between 38: Sydney, Meadowbank
best-case (lower-bound) and 36: Sydney, Hunters Hill,
worst-case (upper-bound) Submerged revetment
Tarban Creek Reserve, and lighting poles along
estimates rounded up to the
nearest cm. Retaining wall protecting the the foreshore of the
foreshore submerged. Parramatta River.
Photo: Socs Cappas. Photo: Peter Stuart.
Department of Environment, Climate Change and Water NSW 17Impacts highlighted by the photos
This report contains a brief sample of the photos that were • widespread submergence of gravity stormwater
taken during the peak of the 2009 king tide. The extensive drainage systems, fixed jetty and wharf infrastructure,
array of images, covering the length of the NSW coastline, as well as public walkways, boardwalks, bicycle paths
identify many areas and assets that will become and carparks situated around the intertidal foreshores
progressively more vulnerable over time as sea level of estuaries;
continues to rise. • substantial narrowing of useable beach widths;
The key impacts – many of them state-wide – include: • overtopping of beach berm barriers in areas where
• localised tidal inundation penetrating through intermittently open and closed lakes and lagoons
stormwater systems and affecting private property, are currently closed to the sea;
public reserves and local road networks; • increased tidal currents within estuaries and larger
• limited clearance between the peak water level and the rip systems on open-coast beaches;
crest of revetments and seawalls currently protecting • inundation and destruction of nesting within
waterfront properties, commercial precincts, public endangered bird roosting sites (such as little terns);
reserves and significant public infrastructure;
• immediate threats to indigenous cultural heritage
sites such as middens located with close proximity
to intertidal margins;
39: Sydney Harbour,
Balmain
Darling Street Wharf
at low tide. The fixed jetty
infrastructure has been
designed to accommodate
high tides.
Photo: Fay Briggs.
40: Sydney Harbour,
Balmain,
Darling Street Wharf
at high tide.
Photo: Fay Briggs.
18 A Snapshot of Future Seas Levels: Photographing the King Tide 12 January 2009• widespread proximity of tidal waters to sewerage pump
stations and associated sewerage infrastructure;
• floor levels of numerous commercial premises and
dwelling structures around harbour and estuarine
foreshores within 50 cm of the king tide level; and
• wave action submerging and overtopping numerous
public ocean bath facilities. 43: Sydney Harbour,
41: Sydney Harbour, Man O’ War Steps
Pyrmont
Historic steps submerged.
Limited clearance to top Photo: John Hudson,
of decking for fixed jetty NSW Planning.
infrastructure.
Photo: Steven Morrison. 44: Sydney Harbour,
Double Bay, Bay Street
42: Sydney,
Tidal waters lapping
Darling Harbour
at the crest of the
Limited clearance to foreshore revetment.
hardstand walking areas. Photo: Craig Morrison,
Photo: John Gan. Sydney Coastal Councils Group.
Department of Environment, Climate Change and Water NSW 19Implications for photographing future king tides
Despite the short lead time involved with organising this Notwithstanding the success of the 2009 exercise,
inaugural photographic event, the remarkable level of there are opportunities to build on the information
involvement by the NSW community at large, including obtained, for example:
local councils and government agencies, coupled with the • Establishing a database of images, linked to a GIS
high level of media interest, clearly demonstrates the value platform, as a publicly available resource for coastal
of this initiative. zone managers. DECCW is investigating the feasibility
The peak water levels recorded on 12 January 2009 fell of making this available through its website.
short of the predicted astronomical tide, but the high • Targeting areas that were not covered during the
water levels still exposed numerous areas vulnerable to 2009 exercise. The short lead-time for arranging the
tidal inundation. The implications are state-wide. Images 2009 photographs meant that some important areas
collected from the photographic event could provide were missed in this first staging of the event. Some
coastal zone managers and the community with a broad- areas around the Sydney Basin and Central Coast were
ranging pictorial insight into our current vulnerability and covered extensively, but the coverage state-wide was
the challenges that lie ahead in managing sea level rise. mixed, with the lower and mid-north coast and far south
coast experiencing comparatively lower coverage.
Similarly, the coverage of various tidal waterways
around the State’s major river systems was inconsistent.
45: Sydney, Bondi Beach
Waves overtopping and
submerging the ocean baths.
Photo: Dennis Gray.
46: Sydney Harbour,
Double Bay
Limited clearance to the floor
of the sailing club premises.
Photo: Craig Morrison,
Sydney Coastal Councils Group.
20 A Snapshot of Future Seas Levels: Photographing the King Tide 12 January 2009• Coordinating the state-wide organisation. • Establishing a network of volunteer photographers.
The coverage could be improved by engaging with A state-wide core of volunteers involved in the photo
all NSW coastal councils and catchment management event could provide a network that could be called
authorities early in the planning process. upon at short notice to capture unusual events such
• Seeking national coverage. During the short lead-in as extreme beach erosion or inundation.
to the 2009 photo event, DECCW was contacted by
numerous members of the community in other states 49: Shellharbour
wishing to participate. It is obvious that the benefits of Submerged fish cleaning
the NSW initiative would apply elsewhere, and there is facilities at the boat harbour.
an opportunity to gain a national perspective here. Photo: Andrew Williams,
47: Wollongong Harbour Shellharbour City Council.
• Using measuring sticks to visualise the threat from
Waves overtopping the
projected higher sea levels. Future photographic 50: Burrill Lake, west
breakwater structure.
exercises could generate an even more powerful of the Princes Highway
Photo: NSW Department of Lands.
message if standardised measuring sticks were included
Limited clearance to the
in some of the photographs to depict the height of 48: Lake Illawarra top of revetments
projected sea level rise to the end of the century. protecting properties
Submerged pathways
along the foreshore. along the foreshore.
Photo: Shellharbour City Council. Photo: Keith Bourke.
Department of Environment, Climate Change and Water NSW 21Conclusions
By photographing the king tide, the public was able to gain Clearly the issue of planning to combat or accommodate
an understanding of how a relatively rare water level today sea level rise in coastal communities will present complex
could be quite common by the end of the century if sea challenges for local communities and all spheres of
level rise projections prove correct. Those taking part in government. Photographing the king tide provides an
photographing the peak of the king tide in their local areas extremely valuable repository of images and a clear visual
had the opportunity to visualise the direct impacts of perspective on the many current threats and vulnerabilities
ocean water levels being 90 cm deeper by 2100. posed by tidal inundation which will all be exacerbated by
sea level rise.
In addition to capturing a library of images highlighting
key vulnerabilities, the event was specifically tailored to The extent of public engagement and media interest
raise public awareness about the additional threat from concerning this photographic initiative demonstrates the
projected future sea level rise. The consensus of scientific keen interest within the community regarding coastal zone
information available at present indicates the upper range management issues. This initial exercise provides a solid
of sea level rise projections could be close to a metre by foundation upon which to build further initiatives and
the end of the century without significant greenhouse DECCW highly commends the effort and enthusiasm of all
gas mitigation. the individuals and groups that volunteered their time to
take part in this event.
51: Narooma, 52: Batemans Bay CBD
Old Municipal Wharf Limited clearance to the top
Limited clearance to of the seawall protecting
the foreshore areas and commercial premises along
roadway next to the wharf. the foreshore.
Photo: Greg Watts, Photo: Lindsay Usher
Eurobodalla Shire Council. and Norm Lenehan,
Eurobodalla Shire Council.
22 A Snapshot of Future Seas Levels: Photographing the King Tide 12 January 2009In order to better understand and adapt to sea level rise,
the NSW Government has developed a Sea Level Rise Policy
Statement. This Policy provides two benchmarks for
consistent planning and assessment purposes along the
NSW coast: 40 cm at 2050 and 90 cm at 2100, relative to
1990 sea level. A Technical Note is also available to describe
the science behind these benchmarks for NSW. Guidelines
are also being prepared to assist councils and coastal 53: North Batemans Bay
specialists to implement these benchmarks in coastal
Wave run-up submerging
hazard assessment, coastal flood assessment and landuse
low-lying foreshores, close
planning. These are available at: www.environment.nsw.
to protection works.
gov.au/climatechnage/sealevel.htm.
Photo: Lindsay Usher,
Eurobodalla Shire Council. 55: Batemans Bay CBD
Limited clearance to the
54: Merimbula top of the seawall along
Limited clearance to the the foreshore.
foreshore boardwalk. Photo: Lindsay Usher
Photo: Derek van Bracht, and Norm Lenehan,
Bega Valley Shire Council. Eurobodalla Shire Council.
Department of Environment, Climate Change and Water NSW 23What happened on 13 and 14 December 2008?
The peak of an abnormally high spring tide Based on analysis of the long-term data from Fort Denison,
occurred at 0806 hours EST on 14 December 2008. on average we would expect to reach a water level of this
The peak water level was 13 cm higher than measured peak (2.15 m) for approximately 1.2 hours per
predicted, mainly due to a low pressure system year.
in the Tasman Sea north-east of Tasmania. There was a similar story on the following day. At 0912
hours EST on 14 December 2008 the Fort Denison tide
The dynamic influences of local weather and gauge measured a peak water level of 2.17 m above TGZ
meteorological conditions on ocean water levels (1.245 m AHD), 0.12 m (12 cm) higher than the predicted
were clearly evident during the high spring tides peak of 2.05 m above TGZ. This was the highest recorded
which coincided with the full moon on the weekend water level at Fort Denison during 2008 and, on average,
of 13 and 14 December 2008. we would expect to reach such a level once every 1.2 years.
At 0806 hours EST on 13 December 2008 the Fort Denison One of the primary reasons the measured water level was
tide gauge measured a peak water level of 2.15 m above significantly higher than the predicted tide was due to the
TGZ (1.225 m AHD). This peak was 0.13 m (13 cm) higher influence of a deep low pressure system in the Tasman Sea
than the predicted peak of 2.02 m above TGZ. north-east of Tasmania. This low influenced the entire NSW
coast during 13 and 14 December and coincided with the
high spring tides.
56: Newcastle,
Carrington
Yidal waters penetrating into
Hargrave and Garrett Streets,
14 December 2008.
Photo: Bruce Coates, DECCW
57: Newcastle,
Carrington
Tidal waters of the Hunter
River submerging Robertson
Street, 14 December 2008.
Photo: Bruce Coates, DECCW.
24 A Snapshot of Future Seas Levels: Photographing the King Tide 12 January 2009Both the low pressures and the strong southerly winds Photos of the December 2008 spring tide
resulted in higher sea levels, particularly along the
These images of localised flooding from the abnormally high
southern NSW coast.
spring tide in December 2008 were also sent to DECCW.
Based on analysis of the state-wide ocean water level The peak water level recorded in these images (2.17 m)
recording network, the elevation of the measured water is currently exceeded on average only once every 1.2 years.
level above the predicted peak was comparatively larger However, by the end of the century, assuming sea level will rise
towards the southern end of the NSW coast, mirroring by 90 cm, the depicted water levels could be reached or exceeded
barometric pressure gradients and stronger southerly approximately 25% of the time, or alternatively, for a total of
winds evident along the coastline from the synoptic charts almost 3 months per year. Similarly, these photos show the
(see Appendix 1). impacts of tidal water levels which are projected to be up to
90 cm deeper by 2100.
Given the relative rarity of the water levels reached over the
course of the weekend, the media reported many areas
that were extensively inundated by sea water. Some of the
images in this report, from 13 to 15 December 2008, depict
the extent of this inundation at isolated locations.
58: Wollumboola Lake
Little tern nesting sites
destroyed by inundation,
14 December 2008.
Photo: Frances Bray,
NPWS volunteer.
59: Sydney Harbour,
Fort Denison
Water lapping against
the western seawall,
13 December 2008.
Photo: Phil Watson, DECCW.
Department of Environment, Climate Change and Water NSW 25Appendix 1: Synoptic charts 12 january 2009 Synoptic chart for 1100 hours EDT 12 January 2009 (Bureau of Meteorology) 26 A Snapshot of Future Seas Levels: Photographing the King Tide 12 January 2009
13 december 2008
Synoptic chart for 1100 hours
EDT 13 December 2008
(Bureau of Meteorology)

14 december 2008
Synoptic chart for 1100 hours
EDT 14 December 2008
(Bureau of Meteorology)

Department of Environment, Climate Change and Water NSW   27
References
Bureau of Meteorology website (BoM 2009), IPCC (2001), Climate Change 2001: The Scientific Basis,
www.bom.gov.au. Third Assessment Report of the Intergovernmental Panel
on Climate Change (IPCC), Cambridge University Press,
Church JA and White NJ (2006), ‘A 20th Century
UK, 944 pp.
Acceleration in Global Sea Level Rise’, Geophysical Research
Letters, Vol. 33, L01602, doi:10.1029/2005GL024826. IPCC (2007), Climate Change 2007: The Physical Science Basis,
Summary for Policy Makers, Fourth Assessment Report of
Church JA, Hunter JR, McInnes KL and White NJ (2006),
the Intergovernmental Panel on Climate Change (IPCC).
‘Sea Level Rise around the Australian Coastline and
the Changing Frequency of Extreme Events’, MetEd (2006), Introduction to Ocean Tides, report produced
Australian Meteorology Magazine, 55: 253-260. by the Cooperative Program for Operational Meteorology,
Education and Training (COMET), University Corporation
CSIRO (2007), Projected Changes in Climatological Forcing for
for Atmospheric Research, Boulder Colorado, US,
Coastal Erosion in NSW, project undertaken for the
www.meted.ucar.edu
Department of Environment and Climate Change NSW,
August 2007. Watson PJ and Lord DB (2008), Fort Denison Sea Level Rise
Vulnerability Study, report prepared by the Coastal Unit,
CSIRO Marine and Atmospheric Research Sea Level Rise
Department of Environment and Climate Change NSW.
website (2009), www.cmar.csiro.au/sealevel/
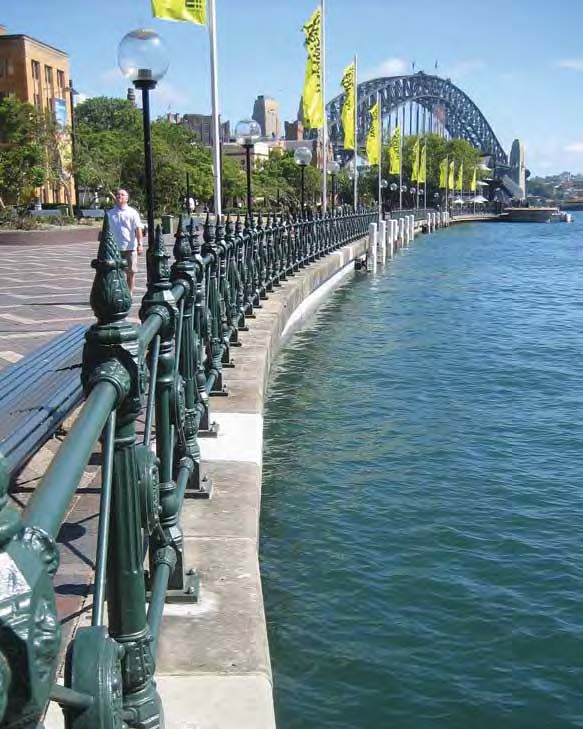
60: Sydney Harbour,
West Circular Quay
Limited clearance to
the crest of the sea wall.
Photo: John Hudson,
NSW Planning.
28 A Snapshot of Future Seas Levels: Photographing the King Tide 12 January 2009www.environment.nsw.gov.au
You can also read