Role of Seaweed in Diets of Samoa and Kiribati: Exploring Key Motivators for Consumption
←
→
Page content transcription
If your browser does not render page correctly, please read the page content below
sustainability

Article
Role of Seaweed in Diets of Samoa and Kiribati:
Exploring Key Motivators for Consumption
Hayley Butcher 1 , Sarah Burkhart 1,2 , Nicholas Paul 3 , Ulusapeti Tiitii 3,4 ,
Karibanang Tamuera 5 , Taati Eria 5 and Libby Swanepoel 1,2, *
 1    School of Health and Sport Sciences, University of the Sunshine Coast, Maroochydore 4557, QLD, Australia;
      hrb014@student.usc.edu.au (H.B.); sburkhar@usc.edu.au (S.B.)
 2    Australian Centre for Pacific Islands Research, University of the Sunshine Coast, Maroochydore 4557,
      QLD, Australia
 3    School of Science and Engineering, University of the Sunshine Coast, Maroochydore 4557, QLD, Australia;
      npaul@usc.edu.au (N.P.); Sapeti.Tiitii@maf.gov.ws (U.T.)
 4    Ministry of Agriculture and Fisheries, Apia WS1300, Samoa
 5    Ministry of Fisheries and Marine Resources Development, PO Box 64 Bairiki, Tarawa, Kiribati;
      karibanangt@mfmrd.gov.ki (K.T.); taatie@fisheries.gov.ki (T.E.)
 *    Correspondence: lswanepo@usc.edu.au

 Received: 30 July 2020; Accepted: 2 September 2020; Published: 8 September 2020

 Abstract: Edible seaweeds have significant potential to contribute to sustainable diets that promote
 health of Pacific Islanders in ecologically, economically, and socially acceptable ways. No studies
 to date have investigated motivators for and the consumption of edible green seaweed from the
 genus Caulerpa (sea grapes) in Samoa and Kiribati. An observational, cross-sectional study utilized
 an interviewer-administered questionnaire to explore consumption behaviors and the role of sea
 grapes in the current diets of individuals in Samoa and Kiribati. Of the total 145 participants
 (n = 79, 54.5% Samoa; n = 66, 45.5% Kiribati), half (n = 76, 52%) reported consuming sea grapes.
 A significantly greater proportion of Samoans (n = 56, 70.9%) reported consumption than I-Kiribati
 participants (n = 20, 30.3%). A greater proportion of consumers were male (n = 47, 61.8%).
 Samoan consumers reported consumption of sea grapes with a higher diversity of foods and being
 related to traditional events or ceremonies. Motivators for consumption varied between countries,
 with Samoan consumers reporting strong agreement for taste and value for money, and identified sea
 grapes as nutritious food, as influences on consumption. Easy access was a motivator in Kiribati only.
 The findings of this study are underpinned by the degree of food security and differences in culture
 in Samoa and Kiribati. Future public health efforts to integrate traditional fresh food into local food
 systems will need to work within the existing social parameters in each respective country.

 Keywords: sustainable diet; algae; Caulerpa; research for development; RDI; livelihood; Pacific;
 nutrition; NCDs

1. Introduction
      The Pacific Islands are a collection of island nations located across the Pacific Ocean, which divide
into the regions of Melanesia, Micronesia, and Polynesia [1]. Many Pacific populations are in nutrition
transition, manifesting as changes in dietary intake and a move away from local food supply chains [2,3].
These nutrition transitions have coincided with a rise in the incidence of diet-related non-communicable
diseases (DR-NCDs), such as cardiovascular disease, type 2 diabetes mellitus, and cancer [4], and these
diseases are the leading cause of mortality in the Pacific region, accounting for 70–75 percent of
deaths [5]. Poor diets are a major contributory factor to the rising prevalence of malnutrition in all
its forms [6]. Following a sustainable healthy diet can promote optimal growth and development,

Sustainability 2020, 12, 7356; doi:10.3390/su12187356                        www.mdpi.com/journal/sustainability
Sustainability 2020, 12, 7356 2 of 13
support functioning and physical, mental, and social wellbeing at all life stages for present and
future generations, contribute to preventing all forms of malnutrition, reduce the risk of DR-NCDs,
and support the preservation of biodiversity and planetary health [6]. Malnutrition is a key risk factor
for NCDs, exhibiting as nutrient disorders caused by either deficient, excessive, or imbalanced intake
of energy and nutrients [7]. Obesity, hyperglycemia and hypertension are diet-related risk factors
linked to the manifestation of NCDs in the Pacific Islands [8].
Samoa and Kiribati are two countries located in the Pacific Islands region, close to the equator
but separated by 1200 km [1] (Figure 1). Samoa, an independent country in Polynesia, is made up of
two main islands, Upolu and Savai’i, and smaller islands as part of the archipelago, with a land area
of 2841 km2 . In 2018, Samoa had a population of 201,000 and a Gross Domestic Product (GDP) per
capita of US$ 6022 [9]. The Republic of Kiribati, located in Micronesia, is one of the most remote and
geographically dispersed countries in the world, comprised of 32 atolls and one coral island with a land
area of 811 km2 [5]. In 2018, Kiribati had a population of 110,000, half of whom reside in the capital of
South Tarawa, and a GDP per capita of US$ 1981 [10]. In 2020, according to World Bank classifications,
Samoa was ranked as an upper-middle-income country, whilst Kiribati was a lower-middle-income
country [11]. While both are in the Pacific Ocean, Samoa and Kiribati have different food systems based
on their geographical location, participation in trade, and land mass (volcanic soil in Samoa vs. coral
atolls in Kiribati). A positive association between GDP per capita and intake across all food groups has
been found, indicating poorer dietary diversity and diet quality in lower-middle-income countries [12].
Dietary shifts toward a modernized and less varied dietary pattern are considered a major factor in the
rise of obesity and NCDs in Pacific Island countries, including in Samoa and Kiribati [13,14]. Samoa has
higher dietary diversity in comparison to Kiribati, primarily due to greater access to a variety of
foods (tubers, legumes, fresh fish and meat, fruit, and green leafy vegetables) [15]. Greater dietary
diversity is typically indicative of better diet quality and improved health status [16]. The low dietary
diversity in Kiribati has been linked to the high cost of imported foods, low socio-economic status,
limited agricultural capacity secondary to environmental effects of climate change and geographic
remoteness [17]. Each of these factors also increases the vulnerability of I-Kiribati people to food
insecurity, defined as the situation that exists when people lack secure access to sufficient amounts and
types of safe, nutritious food [13].
Edible green seaweeds (genus Caulerpa, commonly referred to as sea grapes) are a natural resource
that grows on shallow reefs around Samoa and Kiribati. The term sea grapes includes several species
of Caulerpa, two of which (C. racemosa and C. chemnitzia) are available in Kiribati and Samoa. Sea grapes
can be cultivated for local consumption [18], and also potentially exported, providing economic
opportunity for Pacific Island countries [17], although neither country is involved in cultivation or
exports at present. Like other edible seaweeds, sea grapes are a rich source of nutrients, including fiber,
vitamin A, iron, and calcium [19–21], thus providing potential to contribute to the nutritional adequacy
of Samoan and I-Kiribati people. Given the coexistence of undernutrition and overnutrition in the
Pacific region [22], the high fiber and micronutrient content of indigenous sea grapes may potentially
offer preventative health solutions. To date, the population consumption practices of seaweed in Pacific
Island Countries is not known and will, therefore, be explored in this study. Additionally, the role
that sea grapes play in the anthropology of Samoan and I-Kiribati diets is unknown. If seaweeds
are a possible positive addition to Pacific Islanders’ diets, it is important to first understand if, how,
and why these populations are including seaweeds in their diets. Thus, the aim of this study was to
undertake an initial exploration of how sea grapes are currently included in Samoan and I-Kiribati
diets by quantifying intake and exploring motives for consumption.Sustainability 2020, 12, 7356 3 of 13
Sustainability 2020, 12, x FOR PEER REVIEW 3 of 12
Figure
Figure 1. 1. Location
Location of of territorial
territorial waters
waters of Kiribati
of Kiribati (Tarawa,
(Tarawa, red dot)
red dot) and Samoa
and Samoa eithereither
side ofside
the of the
equator
inequator in the
the Pacific Pacific
Ocean, Ocean,
from from CartoGIS
CartoGIS Services, Services,
College ofCollege of Asia
Asia and and the The
the Pacific, Pacific, The Australian
Australian National
National University.
University. [23]. [23].
2. 2.Materials
Materialsand
andMethods
Methods
AnAnobservational,
observational, cross-sectional
cross-sectionalstudy
studydesign
designwas
wasused
usedto to
explore
explorethethe
consumption
consumption behaviors and
behaviors
role
andof role
sea grapes
of sea in the current
grapes in thediets of individuals
current in Samoa and
diets of individuals Kiribati.
in Samoa and AnKiribati.
interviewer-administered
An interviewer-
survey was usedsurvey
administered to collect
was quantitative and qualitative
used to collect quantitativedata
andtoqualitative
analyze consumption behaviors,
data to analyze including
consumption
thebehaviors,
frequencyincluding
of intake,the frequency
portion of intake,
size, and methods portion size, and
of inclusion methods
in the of inclusion
diet. Motives behindinparticipants’
the diet.
Motivestobehind
decision consume participants’
sea grapes decision to consume
were explored seapurpose
with the grapes ofwere exploreddifferences
identifying with the purpose
betweenofthe
identifying
Samoa differences
and Kiribati betweenEthical
populations. the Samoa and Kiribati
approval populations.
was granted Ethical approval
by the University was granted
of the Sunshine Coast
by the University of the Sunshine Coast Human Research Ethics Committee
Human Research Ethics Committee (S181186) and local government approvals were granted through (S181186) and local
thegovernment
Ministry ofapprovals
Agriculture were granted
and through
Fisheries the and
(Samoa) Ministry of Agriculture
the Ministry and Fisheries
of Fisheries (Samoa)
and Marine and
Resources
the Ministry of Fisheries
Development (Kiribati). and Marine Resources Development (Kiribati).
2.1.Recruitment
2.1. Recruitment
Recruitmentfor
Recruitment forthis
thisstudy
studywas
wasundertaken
undertaken in
in two
two locations,
locations, Samoa
Samoaand
andKiribati.
Kiribati.This
Thisstudy
studyused
used
a convenience sampling method, whereby intercept interviewer-administered surveys
a convenience sampling method, whereby intercept interviewer-administered surveys took place with took place
with eligible
eligible participants
participants in the in the Fish
Apia ApiaMarket
Fish Market and Fungalei
and Fungalei Market
Market (Samoa,
(Samoa, JuneJune
2018)2018)
andand in
in local
local villages in South Tarawa, Kiribati (June 2019). In both instances, participants were initially
villages in South Tarawa, Kiribati (June 2019). In both instances, participants were initially approached
approached by a local research assistant from the Ministry of Agriculture and Fisheries in Samoa
by a local research assistant from the Ministry of Agriculture and Fisheries in Samoa (four staff) and
(four staff) and the Ministry of Fisheries and Marine Resources Development in Kiribati (eight staff),
the Ministry of Fisheries and Marine Resources Development in Kiribati (eight staff), in tandem with a
in tandem with a member of the university research team. Participant eligibility was determined by
member of the university research team. Participant eligibility was determined by initially asking two
initially asking two questions to confirm that participants were aged 18 years or over and identified
questions to confirm that participants were aged 18 years or over and identified as a resident of either
as a resident of either Kiribati or Samoa. A participant information sheet was available for
Kiribati or Samoa. A participant information sheet was available for participants prior to commencing
participants prior to commencing the interview and participants provided verbal consent to
the interview and participants provided verbal consent to participate in the study. No incentive was
participate in the study. No incentive was provided for participation.
provided for participation.
2.2. Tool
The interviewer-administered structured survey contained three sections: (1) Demographics, (2)
Consumption behaviors, and (3) Motivators for consumption. Demographic questions includedSustainability 2020, 12, 7356 4 of 13
2.2. Tool
The interviewer-administered structured survey contained three sections: (1) Demographics,
(2) Consumption behaviors, and (3) Motivators for consumption. Demographic questions included
gender and age. Caulerpa species were referred to in the survey by their common name, sea grapes,
acknowledging that the term encompasses multiple species of Caulerpa in Samoa and Kiribati including
C. racemosa and C. chemnitzia. Questions on consumption behaviors were informed by the wording
used in the Dietary Questionnaire for Epidemiological Studies, Version 3.2 (DQES v3.2, Cancer Council
Victoria, Australia) and included two multiple-choice questions: On average, last year how often did
you eat sea grapes? (options from never to six or more times a day), and choose the usual portion size
of sea grapes that you would eat (with the interviewer showing the participant an actual serve size
of sea grapes as sold in the country) on a scale of less than 14 serving to more than one serving (with
interviewer recording amount over one serving). Section 2 also included the questions: Do you eat sea
grapes on their own? (yes/no, if not, please describe how you include them in your meals and what
else do you eat with them), and are there any traditional meals or dishes that you include sea grapes
in? (yes/no, if yes, please describe these traditional dishes and how often would this occur, and how
did you learn to prepare these dishes?). Section 3 included questions relating to motivations for eating
sea grapes. These questions were informed by a review of the literature which identified key factors
influencing food choice and read as follows: Thinking about the factors that influence your decision to
eat sea grapes, please rate the level to which you agree with each of the following statements (on a
four-point scale of strongly agree to strongly disagree) for: I like the taste, texture, smell, it is nutritious,
it is healthy, it is value for money, it is a local food, it is fresh, and it is natural. Participants were
also asked one open-ended question: Please describe any other reasons that influence your decision
to eat sea grapes. The survey questions were reviewed by the research team for content validity.
Additionally, the survey was reviewed by a member of the in-country research team and piloted with
five participants in each country, prior to data collection in Samoa and Kiribati. Minor changes were
made to wording of questions to ensure culturally appropriate language was used in each country.
Researchers and research assistants were provided with in-country training to ensure a consistent
process was followed to collect survey data. Surveys took between 10 and 15 minutes to complete.
Surveys were completed in English, however, researchers provided the option to verbally translate
into the local language (Samoan or I-Kiribati) if the participant chose not to converse in English.
2.3. Analysis
Descriptive analysis was completed in Statistical Package for Social Sciences (SPSS version 24, SPSS
Inc., Chicago, IL, USA). Demographic data and reported consumption are presented with frequency
and proportion for each variable. Likert scale responses regarding motivators for consumption are
presented as a proportion of each category. Chi-square analysis was performed to identify associations
between nationality and consumption status, consumption status and gender, and consumption status
and age.
To determine an average portion size in each country, responses to the question on the usual
portion size were assigned a gram equivalent to an average bunch weight of sea grapes (640 g).
The average bunch weight of sea grapes is based on data collected by the Ministry of Agriculture and
Fisheries (personal communication, June 2018). The average portion size for each eating occasion
was subsequently calculated for both Samoa and Kiribati. A Mann-Whitney U test was performed to
analyze the difference in portion size between the samples.
Conventional content analysis of qualitative data was performed based on the limited
understanding of this phenomenon [24]. Working independently, two researchers (H.B. and L.S.)
initially immersed themselves in the data by reading through this repeatedly [24]. Both researchers
then identified exact thoughts or concepts and highlighted these on a Microsoft Excel spreadsheet
(Microsoft Office 2019), while making notes to describe the initial analysis [24]. From here, code labels
emerged from the data and were recorded on the spreadsheet. The codes were then categorized intoSustainability 2020, 12, 7356 5 of 13
categories, based on related thoughts or ideas [24], and then further grouped into meaningful clusters
(key categories) [24]. At this point, the researchers H.B and L.S discussed the analysis and resolved any
discrepancies in coding. This analysis was completed by two authors (H.B. and L.S.) for triangulation
and to increase research rigor. The results of the open-ended questions are presented as key categories,
with examples of responses where relevant.
3. Results
3.1. Participant Characteristics and Consumption Behaviours
A total of 145 participants completed the interviewer-administered survey, with n = 79 (54.5%)
from Samoa and n = 66 (45.5%) from Kiribati. Half (52%) of the total participants in this study (76 of
145) reported consuming sea grapes, with a significantly greater proportion of consumers in Samoa
(n = 56, 70.9%) than Kiribati (n = 20, 30.3%) (p < 0.01). Of those who reported consuming sea grapes,
a greater number of these were male (n = 47, 61.8% vs. female n = 29, 38.2%). Overall, there was no
significant difference in reported consumption across age categories (Table 1).
Table 1. Participant characteristics in the Samoan and I-Kiribati participants. Raw number and
percentage (bracket).
Samoa n (%) Kiribati n (%)
Consumers * (n = 56) Non-Consumers (n = 23) Consumers (n = 20) Non-Consumers (n = 46)
Sex
Male 33 (59) 9 (39) 14 (70) 23 (50)
Female 23 (41) 14 (61) 6 (30) 23 (50)
Age (years)
18–30 9 (16) 7 (30) 6 (30) 8 (17)
31–49 31 (55) 11 (48) 6 (30) 20 (44)
50+ 16 (29) 2 (9) 8 (40) 18 (39)
Undisclosed 3 (13)
* Greater proportion of consumers in Samoa (p ≤ 0.01).
Of the participants who reported frequency of consumption (n = 55), most reported consumption
of sea grapes one to three times a month. No participants reported consumption more than once a
day (Figure 2). Self-reported average portion size was larger in Samoa (365 g) than in Kiribati (240 g),
but not significantly different (p = 0.218).
Conventional content analysis revealed that Samoan consumers primarily eat sea grapes with taro
(68.9%, n = 31), banana (28.9%, n = 13), breadfruit (15.6%, n = 7), fish (15.6%, n = 7), and other meats
(13.3%, n = 6). I-Kiribati consumers reported less variety, with consumers reporting fish (55.6%, n = 10),
breadfruit (50%, n = 9) and rice (44.4%, n = 8) to accompany sea grapes. Further, most Samoans who
reported consuming sea grapes (92.1%, n = 35) identified that it is consumed at traditional events or
ceremonies, such as weddings, birthdays, and Church services. The I-Kiribati did not associate sea
grape consumption with any special events.Undisclosed 3 (13)
* Greater proportion of consumers in Samoa (p ≤ 0.01).
Of the participants who reported frequency of consumption (n = 55), most reported consumption
of sea grapes one to three times a month. No participants reported consumption more than once a
day (Figure2020,
Sustainability 2). Self-reported
12, 7356 average portion size was larger in Samoa (365 g) than in Kiribati (240 g),13
6 of
but not significantly different (p = 0.218).
30
25
Number of participants
20
15
10
5
0
1 – 3 times a Once a week 2 – 4 times a 5 – 6 times a Once a day
month week week
Frequency of consumption
Samoa Kiribati
Frequencyofofconsumption
Figure2.2.Frequency
Figure consumptionininSamoan
Samoanand
andI-Kiribati
I-Kiribatiparticipants.
participants.
3.2. Motivators for Consumption
Conventional content analysis revealed that Samoan consumers primarily eat sea grapes with
Motivations
taro (68.9%, for banana
n = 31), sea grape consumption
(28.9%, n = 13),differed between
breadfruit Samoan
(15.6%, n = 7), = 56)(15.6%,
(nfish and I-Kiribati
n = 7), consumers
and other
(n = 20), with a greater proportion of Samoan consumers reporting strong agreement for taste, value
for money, and that sea grapes are nutritious, as influences on consumption (Figure 3).
Conventional content analysis of the open-ended questions allowed participants to clarify their
primary motivators for eating sea grapes or offer new factors that were not listed in the previous
question. Three key categories emerged as motivators: Taste, health, and price. No new factors
emerged from the qualitative comments, with the three key categories corroborating quantitative
responses in the previous question (Figure 3). In line with quantitative ratings of key motivators
(Figure 3), only Samoan respondents qualitatively described the importance of taste as a positive
influence on them eating sea grapes (n = 33, 41.3%), as illustrated through the following quotes:
“I like the bitter salty taste from the sea.” [Participant 6, Samoa]
“It tastes so good and is delicious with taro. I crave it when I see other people eating it.” [Participant
43 Samoa]
Health and price were important to consumers in both countries (Samoa n = 35, 43.6%; Kiribati n
= 14, 66.6%), as evidenced through the following quotes (limu is the Samoan name for seaweed):
“It’s free and healthy.” [Participant 49, Samoa]
“It’s good for my throat, the saltiness of limu makes my throat clearer.” [Participant 20, Samoa]
“It’s healthier than salt and helps to prevent high blood pressure.” [Participant 54, Samoa]
“It’s the number one health food to consume.” [Participant 7 Kiribati]grape consumption with any special events.
3.2. Motivators for Consumption
Motivations for sea grape consumption differed between Samoan (n = 56) and I-Kiribati
consumers2020,
Sustainability (n =12,20),
7356with
a greater proportion of Samoan consumers reporting strong agreement 7 of for
13
taste, value for money, and that sea grapes are nutritious, as influences on consumption (Figure 3).
Figure3.3. Proportion
Figure Proportion of
of Samoan
Samoan andand I-Kiribati
I-Kiribati consumers
consumers and
and level
level of
of agreement
agreement of
of factor
factor as
asan
an
influence
influenceononconsumption
consumptionofofsea
seagrapes.
grapes.
4. Discussion
Conventional content analysis of the open-ended questions allowed participants to clarify their
primary motivators
The aim for eating
of this study was tosea grapes or
undertake offer new factors
a preliminary that were
exploration of hownot
sealisted in are
grapes thecurrently
previous
question. Three key categories emerged as motivators: Taste, health, and price.
included in Samoan and I-Kiribati diets by quantifying intake and exploring motives for consumption. No new factors
emerged
Our studyfrom the qualitative
provides comments,
first insights into howwith the three
the edible key categories
seaweed corroborating
Caulerpa (sea quantitative
grapes) is included in
responses
Samoan andinI-Kiribati
the previous question
diets. Given the(Figure
potential3).that
In sea
linegrapes
with quantitative ratings of key
may play in contributing motivators
to sustainable
(Figurediets,
healthy 3), only
this Samoan respondents
understanding makes qualitatively described to
a valuable contribution thetheimportance of taste
literature and as a positive
can inform future
influence
practice andon policy
them eating
effortssea
to grapes
support(nsustainable
= 33, 41.3%),diets
as illustrated
and promotethrough
humanthe following
health. Our quotes:
findings
confirm the complexity of food choice in this setting, as we uncovered multiple intertwined factors
“I like the bitter salty taste from the sea.” [Participant 6, Samoa]
that influence sea grape consumption. We found that sea grapes are eaten in both countries, however,
“It tastes so good and is delicious with taro. I crave it when I see other people eating it.”
consumption is more common, more frequent, and in potentially larger amounts in Samoa compared
[Participant 43 Samoa]
with Kiribati. Despite being indigenous to both countries, an exploration of consumption practices
revealed different motivating factors for consumption.
4.1. Reported Consumption
While only half of all participants reported eating sea grapes, consumption was more likely in
Samoans than the I-Kiribati. In both countries, the majority of consumers did not report consumption
greater than one to three times per month. As such, it is unlikely that sea grapes contribute substantially
to the international targets for specific nutrients [25], despite having a favorable nutrient profile and
the portion size being relatively high (365 grams). Samoans also reported consuming sea grapesSustainability 2020, 12, 7356 8 of 13
alongside a higher variety of foods, such as taro, banana, breadfruit, fish, and meat. Samoans have a
preference for high fat, processed foods, which are characteristically high in added sugar and salt [26].
Dietary diversity in Kiribati, on the contrary, is low [17].
Interestingly, despite knowing that seaweeds are indigenous species to the Pacific, readily available
for consumption, and have possible health benefits [27], their potential contribution to meeting
recommended nutrient intakes is largely unknown. Further investigation to describe how seaweeds fit
within a broader diet and the amounts needed to meet recommended nutrient intakes for groups of
individuals of different ages and genders is warranted. Sea grapes are an affordable source of nutrients,
available locally that could replace less healthy alternatives in the diet. The various motivators
identified could be used to inform culturally and geographically appropriate health promotion efforts
to help encourage such a change.
4.2. Motivators for Sea Grape Consumption
Gaining insight into the various interconnecting factors that influence food intake is needed to
develop holistic policies and programs that promote sustainable diets. Sensory perception is a known
determinant of nutrition and eating [28]. Sensory drivers for consumption, such as taste, texture,
and smell, were important to all consumers in our study. To a lesser degree, our study revealed the
importance of health and nutrition, and cultural connectedness to sea grapes as key factors motivating
consumption for some Samoan participants. Whilst in Kiribati, value for money and local accessibility
were more commonly identified as motivators.
4.3. Sensory Drivers for Consumption
Sensory drivers for consuming sea grapes were important to all participants in our study,
however, Samoans were more likely to be motivated by taste compared with the I-Kiribati. Taste as a
motivator in food choices in low-middle income countries (LMICs) has not been well researched [2].
Given socioeconomic status is a key determinant of food security [29], it is possible that the difference
in taste motivators seen in our sample is due to the greater relative socioeconomic advantage in
Samoa compared with Kiribati. Importantly, a positive association between GDP per capita and
intake across all food groups has been found, indicating poorer dietary diversity and diet quality in
low socioeconomic countries [12]. The prevalence of food security in Samoa and Kiribati is difficult
to compare due to a lack of accurate food security data reporting in Kiribati. However, the Global
Nutrition Index (GNI) ranks Samoa as more advantaged than Kiribati, with a GNI of 0.681 and 0.650,
respectively [30]. While this data is not without its limitations, we postulate that Kiribati is at higher risk
of food insecurity, which underpins the lack of emphasis on taste by I-Kiribati consumers. It is possible
that motivators for consuming food in Kiribati is driven by satiety, rather than sensory satisfaction.
Another possible explanation for this finding is the lower dietary diversity in Kiribati when compared
to Samoa [15,17], suggesting that I-Kiribati people are accustomed to having low variety in their diet,
and as such, do not seek to diversify in flavor and texture.
4.4. Health and Nutrition
Samoan consumers identified health and nutrition as one of the motivators in their decision to
consume sea grapes. This finding confounds the existing literature, as it is typically those of high
socioeconomic status who opt for food choices based on the premise of health [31]. Our study may be
limited due to participant bias, as only consumers of sea grapes were asked to identify motivators
for its consumption, as such, it is possible that these participants (who currently eat sea grapes) are
already more health-conscious. It is also possible that Samoans have a greater awareness of the link
between dietary behaviors and health outcomes (health literacy) with Samoans previously reported as
having basic knowledge of NCDs [32]. Future research targeting both consumers and non-consumers
is warranted to capture both barriers to, and enablers for, sea grape consumption.Sustainability 2020, 12, 7356 9 of 13
4.5. Freshness and Food Access
Freshness was identified by the Samoans as a key motivator for the consumption of sea grapes,
which was not the case for I-Kiribati participants. Freshness is a dimension of food access that, alongside
other factors within the food environment, are known to influence dietary health [33]. Access and
availability of nutritious, culturally appropriate food, key pillars of food security [34], are issues in
Kiribati, given its isolated geographical location, poor soil quality, overcrowding, and limited space.
Household decisions around food procurement in Kiribati are primarily based on the foods that are
accessible and available across seasons [35]. Low dietary diversity in Kiribati is likely due to the limited
availability and affordability of nutritious foods [17]. Given the population density and scarcity of fresh
food vendors in South Tarawa, the I-Kiribati people may rely on imported processed foods and home
food production. A key barrier to fresh food production in Kiribati is the perceived effort of home
gardening in comparison to easy access of other imported foods [35]. As a ‘no feed’ crop that does
not require exogenous feeding [36], edible seaweeds grow plentifully in oceans and can be cultivated
with little or no costs [37]. Involvement in seaweed production can contribute to improved wellbeing
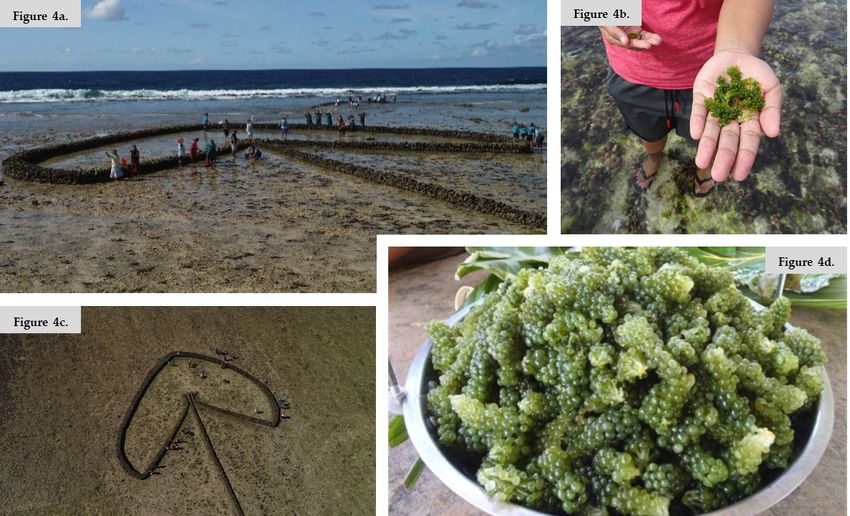
through positive economic and social impacts [38]. Given the ready access to reef flats (Figure 4) and
the desire of I-Kiribati people to develop new edible seaweed supply chains [39], there is great potential
to overcome the barriers of access and availability that currently hinder sea grape consumption in
Kiribati. However, currently, we have little understanding of fishery access in Kiribati, as opposed
to the long-term monitoring of fisheries (including sea grapes) by the Ministry of Agriculture and
Fisheries in Samoan markets. The highly exposed, fringing reef flats common in Kiribati are different
from those of Samoan reefs. Revision of ministerial processes to include structured field auditing
operations is warranted to determine if, and how, habitat influences the abundance of sea grapes in
Kiribati. For this study, the Kiribati samples of sea grapes shown to participants during the survey were
collected primarily from walls of the artisanal fish traps on the exposed reefs (Figure 4), which were
traditionally owned and cared for by coastal communities to capture fish for their daily sustenance.
Sustainability 2020, 12, x FOR PEER REVIEW 9 of 12
Figure 4.
Figure 4. (a).
(a). Kiribati
Kiribati women
women collecting
collecting sea
sea grapes
grapes (Caulerpa
(Caulerpa chemnitzia)
chemnitzia) from
from the
the wall
wall and
and sheltered
sheltered
pools of an artisanal fish trap at Temwaiku village, South Tarawa; (b). Close up of Pacific
pools of an artisanal fish trap at Temwaiku village, South Tarawa; (b). Close up of Pacific Island sea Island sea
grapes (Caulerpa racemosa); (c). Harvesting environment, low tide on the reef flat utilizing
grapes (Caulerpa racemosa); (c). Harvesting environment, low tide on the reef flat utilizing buckets for buckets for
collection; (d).
collection; (d). Close
Close up
up ofof prepared
prepared Pacific
Pacific Island
Island sea
seagrapes
grapes(Caulerpa
(Caulerpachemnitzia).
racemosa).
4.6. Cultural Connectedness
Sea grapes are consumed in a number of locations across the world and are a culturally
significant food source in Hawaii, Japan, Indonesia, Malaysia, Fiji, and the Philippines [40]. In our
study, Samoan consumers recounted the importance of sea grapes as a local food, that was not
evident in Kiribati. In Samoa, the consumption frequency and the inclusion of sea grapes at
ceremonial events suggest that it may hold a traditional place within the diet. The associationSustainability 2020, 12, 7356 10 of 13
4.6. Cultural Connectedness
Sea grapes are consumed in a number of locations across the world and are a culturally significant
food source in Hawaii, Japan, Indonesia, Malaysia, Fiji, and the Philippines [40]. In our study, Samoan
consumers recounted the importance of sea grapes as a local food, that was not evident in Kiribati.
In Samoa, the consumption frequency and the inclusion of sea grapes at ceremonial events suggest that
it may hold a traditional place within the diet. The association between sea grapes and the Samoan
culture may be attributed to the strong food culture in Samoa [41,42]. Most festivities or celebrations
are centered around food in Samoa, including the traditional to’onai (Sunday lunch), Lotu Tamaiti
(White Sunday), in addition to weddings, birthdays, village or church meetings. The composition of a
meal is reflective of status, for instance, the butchering of a pig or a large deep-sea fish is considered
appropriate for ali’i sili (High Chief) visits [41]. The nostalgia that Samoan consumers associated with
sea grapes was not reciprocated in Kiribati, where consumption was reported to be infrequent and
local food and culture did not emerge as a motivator to consume. These results highlighted a key point
of difference between the two countries. As Samoan consumers associated sea grapes with a local food
that may link to their cultural background and heritage, the I-Kiribati did not. Limited recorded data
exist in relation to the role of food in the I-Kiribati culture. The diet is based on seafood, however,
due to the low dietary diversity and poorer access to fresh foods [17], it is possible that food does not
play a significant role in the I-Kiribati culture in comparison to the Samoan. This insight suggests that
a cultural component is important to complement edible seaweed promotion efforts in Kiribati.
Samoan’s have repeated exposure to sea grapes through their cultural heritage and attendance
at ceremonial events that serve traditional foods. Familiarity with a food is known to increase
consumption [43]. Whilst research into Pacific food environments is emerging, it has been found that
perceptions of food availability are significantly and positively associated with food acquisition [34].
The culmination of these factors (cultural traditions and familiarity) may potentially be enhancing
consumption in Samoa, and lessening consumption in Kiribati. Understanding the cultural drivers
underpinning sea grape intake in Samoa offers promising insights that could inform culturally
appropriate promotion strategies in Kiribati and elsewhere. Research in Samoa [26,44] and Solomon
Islands [45] has demonstrated a preference for local foods. Nostalgic past-focused marketing
(as opposed to present-focused marketing) can lead to more favorable brand awareness and greater
intent to purchase a product [46]. From a marketing perspective, private companies and the food
industry could employ similar strategies whereby advertising is designed to directly elicit feelings
of nostalgia that connect consumers to eating sea grapes. Future studies, including qualitative
investigations, should explore the factors that would motivate a change in behavior in those who do
not consume sea grapes.
4.7. Limitations
There are several limitations to our study. Firstly, our sample size was modest, and our results
are not representative of the broader Samoan and I-Kiribati people. Given our sample size, limited
statistical analysis was able to be undertaken. As we used an intercept interviewer-administered survey,
we did not record those individuals who declined to participate in the survey. However, given the
exploratory nature of this work, our descriptive results are novel and provide a starting point for
further work to understand seaweed consumption patterns and motivators in Samoa, Kiribati, and the
wider Pacific region. Given the cross-sectional nature of our study design, we relied on self-report data
and typical bundle size to quantify sea grape consumption. We acknowledge that there are limitations
to self-report dietary data and there may be variance in typical bundle size between vendors and over
the course of the year. The literature suggests that differences in typical diets exist between urban
and rural areas in Samoa and Kiribati [44], so it is likely that further research may find variations in
consumption behaviors across these countries, and the broader Pacific region.Sustainability 2020, 12, 7356 11 of 13
4.8. Conclusions
This study provides preliminary findings on seaweed consumption behaviors and motivators in
Samoan and I-Kiribati people. In Samoa, the cultural significance of sea grapes is evident through
its inclusion in celebratory meals that occur on a weekly or monthly basis. Sea grapes could play an
important role in Kiribati to address poor access to and availability of fresh food, as a sustainable
diet approach to tackle low dietary diversity, multiple micronutrient deficiencies, food insecurity,
and livelihoods.
Future research from a whole-diet approach, with a larger sample size, is warranted to determine
the contribution that sea grapes (and other edible seaweeds) have towards improving diet quality and
addressing the malnutrition in all its forms. Our exploration of motives for consuming sea grapes
provides first insights that can inform the food industry and private companies, as well as future
practice and policy efforts to support sustainable diets and promote human health. Our findings
also confirm the complexity of food choice in this setting, recognizing the interplay between multiple
influences, necessitating the adoption of sociological and anthropological approaches for a robust
understanding of dietary motivators in this context.
Author Contributions: Conceptualization, L.S., S.B. and N.P.; methodology, H.B., L.S., S.B. and N.P.;
formal analysis, H.B., L.S. and S.B.; investigation, H.B., L.S., S.B., K.T., T.E. and U.T.; resources, H.B., L.S. and N.P.;
data curation, H.B., L.S., S.B., K.T., T.E. and U.T.; writing—original draft preparation, H.B.; writing—review and
editing, L.S., S.B. and N.P.; supervision, L.S., S.B. and N.P.; project administration, L.S.; funding acquisition, L.S.
and N.P. All authors have read and agreed to the published version of the manuscript.
Funding: This research was funded an Australian Centre for International Agricultural Research (ACIAR)
project ‘Diversification of Seaweed Industries in Pacific Island Countries’, grant number FIS/2010/098
(https://aciar.gov.au/project/fis-2010-098), and an internal research grant from the University of the Sunshine
Coast. Student involvement in this research was funded by the Australian Government New Colombo Plan.
Acknowledgments: This research was conducted as part of an ACIAR project ‘Diversification of Seaweed
Industries in Pacific Island Countries’ (FIS/2010/098). We acknowledge and thank our participants for their
involvement in this study. We are also greatly appreciative of the support of our local staff from the Kiribati
Ministry of Fisheries and Marine Resource Development and the Samoan Ministry of Agriculture and Fisheries.
We also acknowledge the hard work and assistance of our dedicated student research volunteers; Charli Ash,
Kashmira Lal, Emma Lavelle and Joseph Martin.
Conflicts of Interest: The authors declare no conflict of interest.
References
1. Kirch, P.V. On the Road of the Winds: An Archaeological History of the Pacific Islands before European Contact;
University of California Press: Berkeley, CA, USA, 2001.
2. Bottcher, C.; Underhill, S.; Aliakbari, J.; Burkhart, S. Food Purchasing Behaviors of a Remote and Rural Adult
Solomon Islander Population. Foods 2019, 8, 464. [CrossRef] [PubMed]
3. Dawe, D.; Ahuja, V.; Bloem, S.; Damen, B.; Martyn, T.; Whiting, L. Dynamic Development, Shifting Demographics,
Changing Diets; FAO: Rome, Italy, 2018.
4. Matheson, D.; Park, K.; Soakai, T. Pacific island health inequities forecast to grow unless profound changes
are made to health systems in the region. Aust. Health Rev. 2017, 41, 590–598. [CrossRef] [PubMed]
5. Phongsavan, P. Kiribati NCD Risk Factors: STEPS Report; WHO: Geneva, Switzerland, 2009.
6. FAO. WHO: Sustainable Healthy Diets—Guiding Principles. Available online: http://www.fao.org/3/
ca6640en/ca6640en.pdf (accessed on 1 September 2020).
7. Branca, F.; Lartey, A.; Oenema, S.; Aguayo, V.; Stordalen, G.R.R.; Arvelo, M.; Afshin, A. Transforming the
food system to fight non-communicable diseases. BMJ 2019, 364, 1296. [CrossRef]
8. Lim, S.; Vos, T.; Flaxman, A. A comparative risk assessment of burder of disease and injury attributable to 67
risk factors and risk factor clusters in 21 regions, 1990 and 2013: A systematic analysis for the Global Burden
of Disease Study. Lancet 2010, 380, 2224–2260. [CrossRef]
9. Australia-Oceania: Samoa. Central Intelligence Agency: McLean Langley, Virginia VA, U.S. Available online:
https://www.cia.gov/library/publications/the-world-factbook/geos/ws.html (accessed on 1 September 2020).Sustainability 2020, 12, 7356 12 of 13
10. Australia-Oceania: Kiribati. Central Intelligence Agency: McLean Langley, Virginia VA, U.S. Available
online: https://www.cia.gov/library/publications/the-world-factbook/geos/print_kr.html (accessed on
1 September 2020).
11. World Bank. World Bank List of Economies. 2014. Available online: siteresources.worldbank.org/
DATASTATISTICS/Resources/CLASS.XLS (accessed on 1 September 2020).
12. Dave, D.; Doytch, N.; Kelly, I. Nutrient intake: A cross-national analysis of trends and economic correlates.
Soc. Sci. Med. 2016, 158, 158–167. [CrossRef]
13. Ghattas, H. Food Security and Nutrition in the Context of the Global Nutrition Transition. Available online:
http://www.fao.org/in-action/voices-of-the-hungry/en/ (accessed on 1 September 2020).
14. Snowdon, W.; Raja, A.; Reeve, E.; Fesaitu, J.; Cateine, K.; Guignet, C. Processed foods available in the Pacific
Islands. Glob. Health. 2013, 9, 9. [CrossRef]
15. Global Nutrition Report. 2018. Available online: https://globalnutritionreport.org/reports/global-nutrition-
report-2018/ (accessed on 1 September 2020).
16. Alkerwi, A. Diet quality concept. Nutr. Diet. 2014, 30, 613–618. [CrossRef]
17. Eme, P.; Burlingame, B.; Douwes, J.; Kim, N.; Foliaki, S. Quantitative estimates of dietary intake in households
of South Tarawa, Kiribati. Asia Pac. J. Clin. Nutr. 2019, 28, 131–138.
18. Morris, C.; Bala, S.; South, G.; Lako, J.; Lober, M.; Simos, T. Supply chain and marketing of sea grapes,
Caulerpa racemosa (Forsskål) J. Agardh (Chlorophyta: Caulerpaceae) in Fiji, Samoa and Tonga. J. Appl.
Phycol. 2014, 26, 783–789. [CrossRef]
19. Paul, N.; Wegner, A.; Tuart, I.; Tamuera, K.; Teata, T.; Tioti, T.; Tanielu, E. Biochemical Database and Product
Sheets for Seaweeds from Fiji, Samoa and Kiribati; University of the Sunshine Coast: Queensland, Australia, 2020.
20. Dignan, C.; Burlingame, B.; Kumar, S.; Aalbersberg, W. The Pacific Islands Food Composition Tables; FAO: Rome,
Italy, 2004.
21. Paul, N.; Neveux, N.; Magnusson, M.; De Nys, R. Comparative production and nutritional value of ‘sea
grapes’—the tropical green seaweeds Caulerpa lentillifera and C. racemosa. J. Appl. Phycol. 2014, 26,
1833–1844. [CrossRef]
22. Peng, W.; Mu, Y.; Hu, Y.; Li, B.; Raman, J.; Sui, Z. Double Burden of Malnutrition in the Asia-Pacific Region-A
Systematic Review and Meta-analysis. J. Epidemiol. Glob. Health. 2020, 10, 16–27. [CrossRef] [PubMed]
23. CartoGIS Services, College of Asia and the Pacific; ANU: Canberra, Australia. Available online: http:
//asiapacific.anu.edu.au/mapsonline/base-maps/kiribati-pacific (accessed on 1 September 2020).
24. Hsieh, J.; Shannon, S. Three approaches to qualitative content analysis. Qual. Health Res. 2005, 15, 1277–1288.
[CrossRef] [PubMed]
25. Diet, Nutrition and the Prevention of Chronic Diseases: Report of a Joint WHO/FAO Expert Consultation; World
Health Organization: Geneva, Switzerland, 2002.
26. Farrell, P.; Thow, A.; Schuster, S.; Vizintin, P.; Negin, J. Access to a Nutritious Diet in Samoa: Local Insights.
Ecol. Food. Nutr. 2019, 58, 189–206. [CrossRef] [PubMed]
27. Preez, R.; Paul, N.; Mouatt, P.; Majzoub, M.; Thomas, T.; Panchal, S.; Brown, L. Carrageenans from the Red
Seaweed Sarconema filiforme Attenuate Symptoms of Diet-Induced Metabolic Syndrome in Rats. Mar. Drugs.
2020, 18, 97. [CrossRef] [PubMed]
28. Stok, F.M.; Hoffmann, S.; Volkert, D.; Boeing, H.; Ensenauer, R.; Stelmach-Mardas, M.; Kiesswetter, E.;
Weber, A.; Rohm, H.; Lien, N.; et al. The DONE framework: Creation, evaluation, and updating of an
interdisciplinary, dynamic framework 2.0 of determinants of nutrition and eating. PLoS ONE 2017, 12,
e0171077. [CrossRef] [PubMed]
29. Lo, Y.; Chang, Y.; Lee, M.; Wahlgvist, M. Health and nutrition economics: Diet costs are associated with diet
quality. Asia Pac. J. Clin. Nutr. 2009, 18, 598–604.
30. Rosenbloom, J.; Kaluski, D.; Berry, E. A Global Nutrition Index. Food Nutr. Bull. 2008, 29, 266–277. [CrossRef]
31. Darmon, N.; Drewnowski, A. Does social class predict diet qualtity? Am. J. Clin. Nutr. 2008, 87, 1108–1117.
[CrossRef]
32. Bollars, C.; Sørensen, K.; Vries, N.; Meertens, R. Exploring Health Literacy in Relation to Noncommunicable
Diseases in Samoa: A Qualitative Study. BMC Public Health. 2019, 19, 1151. [CrossRef]
33. Caspi, C.; Sorensen, G.; Subramanian, S.; Kawachi, I. The local food environment and diet: A systematic
review. Health Place 2012, 18, 1172–1187. [CrossRef] [PubMed]Sustainability 2020, 12, 7356 13 of 13
34. Turner, C.; Kalamatianou, S.; Drewnowski, A.; Kulkarni, B.; Kinra, S.; Kadiyala, S. Food Environment
Research in Low- and Middle- Income Countries: A Systematic Scoping Review. Adv. Nutr. 2019, 19, 730.
[CrossRef] [PubMed]
35. Kodish, S.; Grey, K.; Matean, M.; Palaniappan, U.; Gwavuya, S.; Gomez, C.; Iuta, T.; Timeon, E.;
Northrup-Lyons, M.; McLean, J.; et al. Socio- Ecological Factors That Influence Infant and Young Child
Nutrition in Kiribati: A Biocultural Perspective. Nutrients 2019, 11, 1130. [CrossRef]
36. Mahadevan, K. Seaweeds—A sustainable food source. In Seaweed Sustainability: Food and Non Food Applications;
Elsevier: Cambridge, MA, USA, 2015; pp. 347–364.
37. Pickering, T. Advances in seaweed aquaculture among Pacific Island countries. J. Appl. Phycol. 2006, 18,
227–234. [CrossRef]
38. Larson, S.; Stoeck, N.; Fachryc, M.; Mustafa, M.; Lapong, I.; Purnomoe, H.; Rimmer, M.; Paul, N. Women’s
well-being and household benefits from seaweed farming in Indonesia. Aquaculture 2020, 530, 735711.
[CrossRef]
39. Swanepoel, L.; Tioti, T.; Eria, T.; Tamuera, K.; Tiitii, U.; Larson, S.; Paul, N. Supporting Women’s Participation
in Developing A Seaweed Supply Chain in Kiribati for Health and Nutrition. Foods 2020, 9, 382. [CrossRef]
[PubMed]
40. Wright, A.; Hill, L. Rearshore Marine Resources of the South Pacific; International Centre for Ocean Development:
Halifax, NS, Canada, 1993.
41. Ministry of Health. Food and Cultural Practices of the Samoan Community in Australia—A Community Resource;
Metro South Health: Brisbane, Queensland, Australia, 2015.
42. Bindon, J. Food, Power and Globalization in Samoa; University of Alabama: Tuscaloosa, AL, USA, 2006.
43. Hough, G.; Sosa, M. Food Choice in Low Income Populations—A Review. Food Qual. Prefer. 2015, 40, 334–342.
[CrossRef]
44. Jones, A.; Dempewolf, H.; Armstrong, R.; Gallucci, K.; Tavana, N. Staple food choices in Samoa: Do changing
dietary trends reflect local food preferences? Ethnobot. Res. Appl. 2011, 9, 455–462. [CrossRef]
45. Horsey, B.; Swanepoel, L.; Underhill, S.; Aliakbari, J.; Burkhart, S. Dietary diversity of an adult Solomon
Islands population. Nutrients 2019, 11, 1622. [CrossRef]
46. Ju, I.; Kim, J.; Chang, M.; Bluck, S. Nostalgic marketing, perceived self-continuity, and consumer decisions.
Manag. Decis. 2016, 54, 2063–2083. [CrossRef]
© 2020 by the authors. Licensee MDPI, Basel, Switzerland. This article is an open access
article distributed under the terms and conditions of the Creative Commons Attribution
(CC BY) license (http://creativecommons.org/licenses/by/4.0/).You can also read


