The Operational Consequences of Private Equity Buyouts: Evidence from the Restaurant Industry
←
→
Page content transcription
If your browser does not render page correctly, please read the page content below
The Operational Consequences of Private Equity Buyouts:
           Evidence from the Restaurant Industry

      Shai Bernstein, Stanford Graduate School of Business
               Albert Sheen, Harvard Business School

                                June 8, 2013

                                ABSTRACT

What, if anything, do private equity firms do with businesses they
acquire? We find evidence of significant operational changes in 101
restaurant chain buyouts between 2002 and 2012. Establishment-level
analysis of more than 50,000 restaurants in Florida shows that health and
sanitation violations, particularly those most attributed to foodborne illness,
decline after private equity takeover. These violations are strongly correlated
with overall consumer satisfaction. Within a chain, we use independently
owned franchised stores, over which private equity owners have limited
control, as carbon-copy counterfactuals to directly owned stores to support a
causal interpretation. Improvements in sanitation and food-safety occur
while target chains employ fewer workers per store, and menu prices decline.
This evidence suggests that private equity firms are not simply financial
engineers but rather active investors that improve operations management
practices in the firm. Moreover, cost-cutting activities do not come at the
expense of consumer product quality.

                                     1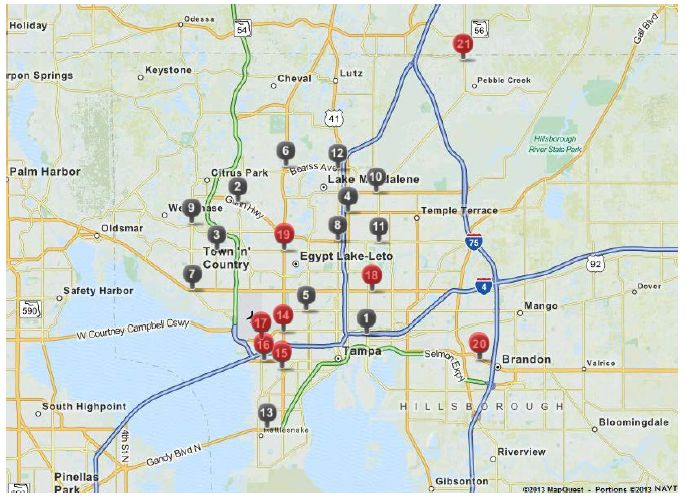
What do private equity firms do with the businesses they acquire? One view is that

private equity firms are financial engineers who simply load companies with debt for short-

term gains. Prior literature provides evidence for a second view in which the main source of

value creation of PE buyouts is through cost cutting and reallocations of labor and capital

(Kaplan 1989; Lichtenberg and Siegel 1990). Recent evidence shows that while net

employment effect following the buyout is modest, PE targets experience increased job

creation and destruction via reallocation across new establishments and closures (Davis, et al.

2011). A third view suggests that PE ownership creates value through the introduction of

better management practices. While we have little direct evidence, survey evidence suggests

that PE-owned firms illustrate strong operations management practices (Bloom, Sadun and

Van Reenen 2009). In this paper we provide an in-depth view of the operational consequences

of PE buyouts, and find evidence of both cost-cutting and improved management practices

activities.

         A major challenge in understanding the operational consequences of private equity

buyouts is data limitations. PE-backed firms are private companies and therefore not required

to disclose any financial information. Even if financial information were available, that, by

itself, would still provide only a limited view of how PE buyouts affect their targets

operationally. Moreover, defining “good” management practices is a hard task, regardless of

data limitation, as management practices are often contingent on a firm’s environment and

varies between and even within industries (Bloom and Van Reenen 2007).

         To overcome these obstacles, this paper performs a deep dive into a single industry:

restaurants. This industry is particularly well suited. First, restaurants are covered by a wealth

of industry sources, which track many margins of activity. This is likely due to the fact that

restaurants are simple to understand, and of great interest to the general public. Second,

                                                2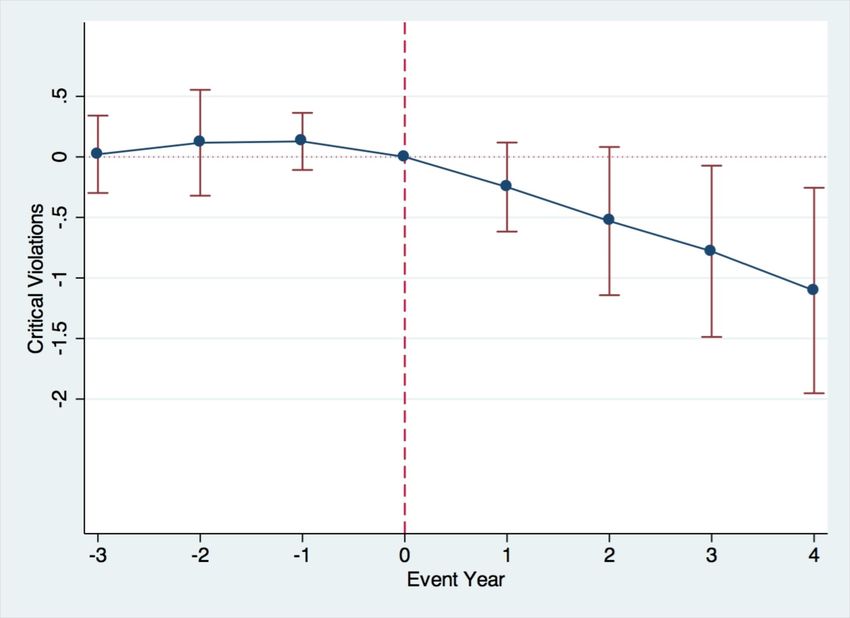
restaurants are fairly homogeneous and share basic and well-defined practices, allowing

meaningful comparison of operational changes across firms. Third, perhaps because of their

stable, acyclical cash flows, restaurants have attracted much attention from private equity firms

resulting in a sizable sample of deals. Lastly, the prevalence of franchising creates a dual

ownership structure, which can be exploited to help mitigate endogeneity concerns.

         We peer into restaurant firm operations first through the lens of health inspections,

which provide a “back-stage” view of restaurants. Restaurants are evaluated on such

dimensions such as food handling, restaurant maintenance, consumer advising, and employee

training. Thus, these inspections provide a unique view on practices and routines employed by

restaurant managers, which dictate food safety.1

         All restaurants in the United States are subject to periodic inspections conducted by

trained specialists in food service evaluation certified by the Food and Drug Administration.

These inspections aim to mitigate foodborne illnesses, which pose a substantial threat to

public health safety. Poor performance on any of these dimensions poses health risks

associated with food poisoning, hospitalization, and even death.2 Failed inspections can result

in fines, suspensions, and closure.

         We gather inspection outcomes for all restaurants in Florida between 2002 and 2012.3

Private equity firms acquired 101 restaurant chains with presence in Florida over this period,

accounting for approximately 3,500 individual restaurants.4 Using restaurant customer reviews

1 In the appendix, we provide a complete list of practices examined by inpsectors.
2 Each year roughly 48 million people get sick, 128,000 are hospitalized, and 3,000 die of foodborne diseases in
the United States (Center for Disease Control and Prevention).
3 Health inspections in the U.S. are commonly conducted at the level of the county. Each county has its own

inspection standards and grading system, making cross-county health inspection comparisons difficult. The
choice to conduct the study in Florida was motivated by the fact that health inspections in Florida are conducted
at the level of the state, not the county, allowing consistent comparison of inspection outcomes across a larger
sample.
4 Recent buyouts of restaurant chains by private equity funds include Burger King, Sbarro, California Pizza

Kitchen, Chilis, Quiznos, PF Changs, Outback Steakhouse, among others.

                                                        3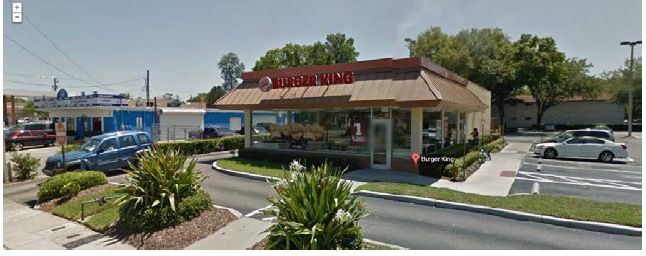
from Yelp.com in 2012, we establish that health inspection outcomes are strongly correlated

with overall customer satisfaction. Combining this data with additional sources provides

comprehensive information on each restaurant, including the number of employees, number

of seats, genre, and average check size.

        We find that restaurants commit fewer health violations after being acquired by a

private equity firm. This effect is driven by those hygiene practices whose potential hazards

are deemed most dangerous for customers. The effect remains strong even when we control

for changes in number of employees and number of seats per restaurant. The improvement in

restaurant sanitation and food-safety is particularly apparent in practices related to the handling

of food (e.g., clean food contact surfaces, toxic items properly stored, food worker hygiene

practices, etc.), maintenance of kitchen appliances (thermometers well operated, maintenance

of product temperature, etc.) and consumer advising and warning (properly label and advertise

food and beverages, etc.).

        A natural question is whether these changes would have happened even without

private equity involvement. We deal with endogeneity concerns in three ways. First, we show

that there is no pre-existing trend in health inspection results before private equity takes over.

In any case, predicted improvements in restroom cleanliness and food handling would not

likely be of first-order consideration for buyout targets.      Second, we employ non-private

equity owned restaurants as a control group. Here we are aided by the homogeneity of the

restaurant industry and our establishment-level focus, as all of the establishments in our

sample appear in the same 6-digit SIC code. We also include zip code by year fixed effects.

Thus, instead of simply comparing Applebee’s to Chili’s Bar and Grill, we compare a particular

Applebee’s to a Chili’s Bar and Grill down the street. Third, the ideal experiment to test the

                                                4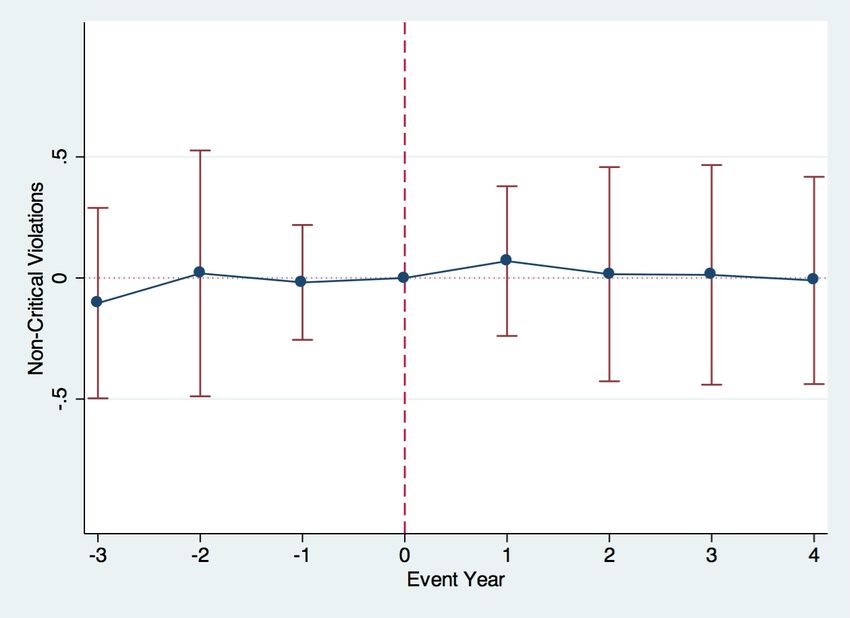
causal impact of PE ownership would be to compare two identical restaurants, one treated

with PE ownership and one without. We exploit the franchise ownership structure common in

the restaurant industry to achieve a close variation of this ideal experiment. An individual store

can be owned and run by either the parent company or a franchisee. Franchisees are legally

independent entities that acquire a turnkey business format from a franchisor, to whom

royalties and fixed fees are paid.          Franchised outlets have the same brand, menus, and

appearance as those run by the brand concept owner. Beyond such contractual specifications,

however, the franchisor headquarters has limited ability to influence decision-making of the

franchisee.5 Hence, our prediction is that soft management changes will be passed down to

company-owned stores more easily than to franchisees. Thus we are able to use restaurants

that are identical in all outward characteristics—brand, logo, food, building design—and that

differ only in ownership as a clean counterfactual. Indeed, we find that, within a brand, health

and maintenance improvements are concentrated among those stores over which private

equity exerts direct control.

         These improvements in health practices coincide with efficiency changes and cost

reductions. At the chain level, we do not find evidence for a change in the number of stores.

We do find, however, that PE-backed restaurants reduce employee headcount at the store

level. Moreover, more efficient operations translate into lower prices for the consumer. Using

a panel of menu samples from nearly 2,200 restaurant chains from 2005 to 2012, we find

restaurants under private equity control lower prices relative to those of similar menu items

sold by competitors in the same cuisine and price segment. Thus, while we find evidence for

5 Quickly following the acquisition of Burger King by TPG Capital, the new management appointed by TPG
stated that Burger King NFA (National Franchisees Association), which organizes 90% of Burger King’s
franchisees, is one of the main problems interfering with improving company operations. Over the next several
years the TPG and NFA relationship devolved into several major lawsuits around issues such as hours of
operation and menu pricing (Gibson, Richard (17 May 2010). “Have it Whose Way?”, Wall Street Journal).

                                                       5
lower headcount per restaurant, these cost-reductions occur in parallel with significant
improvements to customers in terms of menu prices and improved safety and sanitation
practices.6
Our work relates to several strands in the literature. First, we contribute to the
literature on the consequences of private equity, as our findings illustrate that private equity
firms affect the organization through improving operational management practices as apparent
in better restaurant level cleanliness, food-handling procedures, and consumer advising which
ultimately translate into lower food hazard. Existing literature focuses on labor and capital
reallocation (Kaplan 1989; Lichtenberg and Siegel 1990; Boucly, Sraer and Thesmar 2011;
Davis, et al. 2011; John, Lang and Netter 1992). Our paper is consistent with the papers above,
as we also find substantial changes in employment turnover. Importantly, our findings
illustrate that despite such cost-cutting activities, consumer product quality is not adversely
affected but rather improved.
A second related strand is work on the impact of human resource management (HRM)
on productivity, illustrating a link between management practices and firm performance.7 Our
findings illustrate that PE firms improve operations management practices, consistent with
Bloom, Sadun and Van Reenen (2009) who survey over 4,000 firms in Asia, Europe, and the
U.S. to assess their management methods. They show that PE-backed firms are on average the
best-managed group in the sample. However, they cannot rule out the possibility that these
firms were better managed before private equity takeover. Our paper is also closely related to
Matsa (2011) who explores the impact of leverage on product quality, captured by supermarket
product availability. Matsa (2011) finds that firms that undertook high leverage appear to
6 These results can be interpreted more broadly given that we find strong correlation between health inspections
and restaurant customer reviews at Yelp.com.
7 For example, Bartel, Ichniowski, and Shaw, (2007), Black and Lynch (2001), Bloom and Van Reenen (2007),
Ichniowski, Shaw, and Prennushi (1997), and Lazear (2000).
6degrade their products’ quality. While we find improvements in product quality following PE
buyouts, it is important to remember that the nature of PE buyouts and amounts of leverage
taken have changed over time (Guo, Hotchkiss and Song 2011). Our focus on the recent wave
of private equity buyouts may explain the discrepancies.
The remainder of the paper proceeds as follows. Section I describes data sources and
particularly describe health violations. Section II provides empirical results on the impact of
private equity on restaurant operations, and Section III concludes.
I. Data description
The data in this analysis is constructed from numerous sources combining information
on PE buyouts (CapitalIQ), health inspection results and restaurant ownership in Florida
(Florida Department of Business and Professional Regulation), employees per restaurant
(InfoUSA), restaurant menu prices (Datassential) and restaurant consumer reviews (Yelp.com).
In this section we also provide basic correlations that illustrate key characteristics of the health
inspection results and their correlation with consumer satisfaction.
A. Health Inspections Data
Restaurants vary across different characteristics such as food type, geographic location,
price, and quality. Quality can be measured on multiple dimensions including food, service,
and sanitation and safety. The focus of this paper is the latter measure of quality, sanitation
and food-hazard safety. While we show in section I.C that hygiene practices are strongly
correlated with overall consumer satisfaction, safety and sanitation practices are important in
their own right, as they pose a threat to public health safety. Each year in the U.S. roughly one
in six people get sick (48 million people), 128,000 are hospitalized, and 3,000 die of foodborne
7diseases in the United States (Center for Disease Control and Prevention). Most of these
outbreaks originate from commercial food facilities through food held at improper
temperature, poor personal hygiene of workers, food handling, and cross contamination
(Collins 1997). Due to such concerns, all restaurants in the United States are subject to
periodic health inspections conducted by trained specialists in food service evaluation certified
by the Food and Drug Administration. Failed inspections can result in fines, suspensions, and
closure.
We gather health inspection data from the Florida Department of Business and
Professional Regulation. This data encompasses every restaurant inspection conducted in the
state of Florida from 2002 through 2012. U.S. health inspections are typically organized and
conducted at the county level, and each county is free to use its own criteria and scoring
methodology. There is no common standard used across states and counties. The advantage
of using data from Florida is that inspections here are conducted at the state level using
consistent criteria, and historical records are available back to 2002. Each record gives the
name of the restaurant, the address, the date of the inspection, and the health results.
Florida health inspections check the violation incidence of 58 separate practices, split
into critical and non-critical. Critical violations are those “likely to directly contribute to food
contamination, illness or environmental degradation.” Examples of critical violations are
improper disposal of waste, improper temperatures for cooked or stored food, dirty
restrooms, and contaminated food surfaces. Non-critical violations “do not directly relate to
foodborne illness risk, but preventive measures are required.” Examples include clean non-
food contact surfaces, adequate lighting, clean clothes and hair restraints. A complete
8description of inspection violations, split into critical and non-critical violations, is provided in
Appendix A8.
Florida inspections fall primarily into three categories: routine surprise, follow-up, and
initial setup. We consider only surprise inspections for this study. Follow-ups are arranged in
response to violations that need to be fixed and, like startup inspections, occur on known
dates, which allow restaurants to put their best foot forward. Table I summarizes surprise
inspections by year. Approximately 40,000 eating establishments are inspected roughly twice
each year.9 The mean number of critical violations found is 4.1 with a standard deviation of
4.3.
B. Other data sources
We supplement the inspection data with restaurant ownership data, also from the
Florida Department of Business and Professional Regulation. Restaurants needs to renew
licensing agreements with the state each year, thus this information, available from 2002 to
2012, provides the name of the licensed owner of each address and the name of the restaurant.
These data allow us to separate restaurant branches into those owned directly by the parent
brand and those that have been franchised to independent owners. We incorporate data from
InfoUSA, which makes phone calls to establishments to gather, among other data items, the
number of full-time equivalent employees. This data is also gathered on an annual basis.
Employee count is matched to the inspection database by name, address, and geocode
8 Each inspection results in a “disposition”—an action taken in response to the net effect of all violations. The
three main disposition categories are Pass, Warning Issued, and Emergency Closure. In the full sample, these
outcomes are given 78.4%, 21.2%, and 0.4%, respectively. Results throughout this paper are similar using
disposition categories instead of violation counts.
9 There are fewer inspection in 2002 because the data do not cover the entire year.
9coordinates. We also collect median income at the county level from the Bureau of Economic
and Business Research (BEBR) at the University of Florida.
We gather restaurant-pricing information from Datassential. This provider samples a
representative menu from over 2,000 chains each year from 2005 to 2012. These menus give
the item name, food category, and price. Datassential also categorizes each restaurant by price
range and cuisine type. We also collect information on restaurant consumer reviews from
Yelp.com. While the website was founded in 2004, it stared to become popular in Florida only
from around 2010.
To determine which of these restaurants were acquired by private equity firms, we
download from Capital IQ all Leveraged Buyout, Management Buyout, and Secondary LBOs
in the restaurant industry. We research each deal to find the names of the restaurant chains
involved and record the date the deal closes. There are 101 separate deals involving 117
distinct brand names and approximately 3,500 individual restaurant locations in Florida.
C. Correlation between health inspection and other restaurant dimensions
Before introducing the impact of private equity, we begin by studying the determinants
of restaurant hygiene generally. In Table II, columns 1 and 3, we regress critical and non-
critical violations on a number of variables. Larger restaurants—those with more seats and
employees—have more violations. Richer neighborhoods see fewer violations. The more
units in the restaurant chain, the better the inspection outcomes. This may be evidence of
professional management; a firm running multiple stores has more experience and better
controls and procedures in place to monitor hygiene than a proprietor opening her first store.
More expensive menus are associated with more violations. By cuisine type, Asian
establishments fare the worst, while donut shops, ice cream parlors, and beverage stores are
10the cleanest. These latter categories offer simpler items and less variety, which may explain
fewer violations. Columns 2 and 4 add restaurant chain fixed effects and drop chain-invariant
variables. The remaining results are unchanged. Higher median county income leads to fewer
violations even within the same chain.
Hygiene is one dimension on which restaurants serve customers. Food quality, service,
ambiance, and prices are all also certainly part of the value proposition. One way of measuring
overall customer satisfaction is through restaurant reviews. We extract such data from
Yelp.com, a consumer review website. People who register as users with Yelp by providing a
valid email address can leave star ratings, ranging from 1-5, and comments on restaurants and
other businesses. Anyone can read these reviews. In Florida, review quantity is sparse before
2010 and increases significantly by 2012. We thus do not have a sufficient panel structure to
examine the impact of PE on consumer satisfaction, but we examine the cross-sectional
correlation between this review-based restaurant quality measure and health violations in Table
III.
For the year 2012, by restaurant chain, we average the number of critical violations
found in all inspections for all branches. We also average the number of stars given in Yelp
for that chain. Column 1 shows the results of a simple univariate regression of stars on critical
violations. The coefficient on critical violations is -0.025 and highly significant. A four-
violation increase (one standard deviation) is thus associated with a rating lower by 1/10 of a
star. This is meaningful given that 90% of ratings fall between 2 and 5 stars, and half-stars are
associated with significant changes in revenue (Luca 2011). Column 2 adds price range by
cuisine fixed effects (e.g., $10-$15 check size – Asian). Violations and customer satisfaction
are strongly negatively related even among similar restaurants. Column 3 shows the results of
11robustness check requiring at least five Yelp reviews for a restaurant or chain, and the results
remain the same.
This relationship between hygiene and perceived quality could be a direct effect—
customers down rate stores with poor hygiene levels. The correlation may also reflect more
broadly that a restaurant that manages to sustain high levels of sanitation and food-safety may
also perform better on other quality dimensions such as service and food. Both explanations
suggest that our findings, described below, may have a broader interpretation on customer
satisfaction.
II. Results
A. Health Inspections and Private Equity Ownership
We turn to the relationship between private equity ownership and health violations.
We create a variable, PostPE, which equals one if an inspection at a particular restaurant occurs
after it was acquired by a private equity firm. Panel A of Table IV regresses critical violations
on PostPE. The sample here consists of all restaurants, not just those purchased by private
equity. Year fixed effects are included to pick up any changes in violations over time that
happen for all restaurants. Hence, the other restaurants in Florida serve as the counterfactual
for PE treated chains. In column 1a, chain (e.g., Burger King) fixed effects are included to
control for different baseline levels of cleanliness so that the impact of PE entry can be
isolated The coefficient on PostPE is -0.662 and significant at the 1% level. Given that
inspections average 4.1 critical violations, this is a sizable decline of 16%. Column 2a includes
seats and employees as controls, motivated by Table II. The larger the restaurant, the more
critical violations, but the PostPE coefficient remain unchanged and maintain similar
magnitude. This suggests that practices related to sanitation and food-hazard improve
12following the PE acquisition, regardless of changes in restaurant size and number of
employees.
Critical health violations at the chain fall when private equity takes over. Two distinct
effects could drive this. Individual restaurants could be getting cleaner, or poor performing
branches could be closing. To extract this composition effect, columns 3a and 4a replace
chain fixed effects with individual store fixed effects. The coefficient on PostPE remains the
same with slightly lower significance, now at the 5% level, in this stricter test. Thus a given
restaurant sees improvement in health outcomes.
We introduce an even more precise counterfactual in columns 5a and 6a by replacing
year fixed effects with zip code-by-year fixed effects. This specification compares PE treated
restaurants to competitors in the same zip code. Restaurants are serving different
demographics, and experience different economic conditions across neighborhoods, which
could lead to different patterns in hygiene effort. Even after adjusting for such variations,
critical violations still decline after PE entry.
Panel B of Table IV replaces critical with non-critical violations. In all six
specifications, the effect of private equity management is essentially zero. Non-critical
violations have a much smaller effect on health outcomes, and thus effort appears to be
concentrated where it violated practices may matter, and may actually reflect danger to public
safety.
Figure 1a shows the path of critical violations around private equity takeover. Plotted
here are the coefficients of a regression in which critical violations are regressed on private
equity entry event year dummies10. Violations are flat in the three years before PE entry. Thus
there does not appear to be a pre-deal trend. This helps mitigate endogeneity concerns that
10 The regression results are in the Appendix, Table 1A.
13private equity was simply capitalizing on a trend of improved health and sanitation. The
decline in critical violations then occurs steadily over the subsequent four years (becoming
statistically significant in year 2 onward). This is consistent with anecdotal evidence on the
speed of operational change in restaurants (Gompers, Mugford and Kim 2012). Figure 1b
plots the evolution of non-critical violations. There appears to be no pattern before or after
the PE buyout.
To provide a better understanding of the critical violations that drive the results, Table
V breaks these critical and non-critical violations down into specific categories. Appendix A
provides a list of which violations belong to which category. Improvements are concentrated
in practices such as food handling, kitchen maintenance, and consumer advising. These results
suggest that better operations management practices are installed following the PE buyout that
generate improved performance on these margins.
B. Endogeneity Concerns
The results thus far indicate that after private equity firms take over a restaurant, health
inspection outcomes improve. It could be the case, however, that private equity firms are
simply passive owners who target brands that would have experienced improvement regardless
of the buyout. We employ a number of strategies to address this concern. First, arguably,
predicted improvements in restroom cleanliness and food handling would not be of first-order
consideration for selecting buyout targets. Second, as illustrated in Figures 1a and 1b, there
was no pre-existing trend in health scores in the three years leading up to the deal, suggesting
that sanitation and food-safety practices changed only after the deal. Third, we implicitly
match our treated stores with non-treated restaurants by including all restaurants in Florida in
our regressions – all in the same 6-digit SIC code. Further, because our analysis is at the
14establishment level, on top of restaurant fixed effects, we can include zip code by year fixed
effects. Therefore, for example, the counterfactual for a McDonalds restaurant is a Burger
King branch in the same neighborhood. The two restaurants cater to similar demographics;
compete in the same market, and likely experience similar fluctuations in demand.
The ideal counterfactual experiment, however, would be to compare two identical
restaurants, one treated with PE ownership and one without. The prevalence of the
franchising model in the restaurant industry allows us to run a close variation of this
experiment. In a franchising arrangement, a parent franchisor sells a business format, typically
including a brand, operating strategies, and design concepts, to a franchisee. Franchisees range
from a single proprietor running a single restaurant to publicly traded firms that operate
hundreds of restaurants across multiple brands. In return for an “off-the-shelf” business, the
franchisee supplies the capital for the restaurant and pays royalties and fixed fees to the
franchisor. Importantly, a franchise is a legally independent business not vertically integrated
with the parent company and has a connection to headquarters only through contractual
agreements.11 Such contracts are typically for 10 to 20 years.
Restaurant chains vary in the fraction of individual stores that are franchised. Each
Olive Garden, for example, is run directly by parent company Darden Restaurants, while
Subway sandwich shops are all franchised. Half of TGI Friday’s nationwide are franchised.
For such chains that employ a mixture of outsourcing and direct ownership, there thus exist
outwardly identical restaurants that differ only in ownership. When a private equity firm
acquires a chain, legally, they only acquire the company-owned branches and the contractual
obligation of the franchisees to pay royalties. While the name of the store, its logo, basic menu
11Since franchisees are independent legal entities, their capital structure is separate and thus they do not
experience any increases in debt loads following the PE buyout.
15and food are the same, there can be substantial differences in the ability of PE owners to
actively affect the operations of franchisees relative to directly owned restaurants.
These differences can be dramatic. For example, private equity owned Burger King
faced numerous lawsuits in 2010 from the Burger King National Franchisees Association
(NFA), a group representing a majority of their independent operators in the United States.
The franchisees “opposed a company mandate [to] sell a double cheeseburger for $1,”
“challenged a mandate that they keep their restaurants open late at night,” and “haven’t
upgraded their checkout terminals as quickly as management wanted” (Wall Street Journal,
5/17/10). Hence, our prediction is that any effects of private equity takeover of a parent will
manifest more strongly in company-owned than in franchised stores.
There can, of course, be endogeneity in the decision to franchise. Why are certain
stores company-owned, and do these same underlying reasons drive the hygiene results? The
literature on franchising (see Lafontaine and Slade (2007) for a recent survey) explores the
determinants of the variation across firms in the degree of vertical integration of retail
branches. One prediction from a moral-hazard model borne out in the data is that when
individual store effort matters more, franchising is more common. Some additional variables
modeled and tested include branch size and complexity of tasks to be performed by store
managers. As units of a particular restaurant chain are nearly identical, however, most of these
cross-sectional predictions cannot explain why Burger King chooses to own store A but
franchise store B. One theory that can apply, because stores of a chain do differ in location, is
that stores further from headquarters are more likely to be franchised. This is because it is
more costly for HQ to monitor product quality for more distant stores, and thus incentives
need to be stronger for distant managers to do the right thing. This is achieved by giving them
claim over residual franchise profits. One concern may arise if distance to HQ is for correlated
16with hygiene practices through channels other than PE degree of control. For example, if areas
closer to HQ have higher income, such areas tend to correlate with less health violations (as
illustrated in Table II). We mitigate with this concern by including zip code-by-year fixed
effects in our regressions.
For the sake of this test, we are interested in chains that have a mixture of both
franchises and directly owned restaurants. Therefore, our sample only includes chains that
employ franchising for at least 5% of its units and no more than 95% of its units in Florida.12
In Table VI we regress critical violations on PostPE but now also include the indicator variable
DirectOwn and the interaction PostPE * DirectOwn. We have the licensed owner each year at
each address, and thus DirectOwn equals one if the storeowner is the same as the ultimate
parent. This specification allows extraction of a differential private equity effect on directly
owned versus franchised units. We also include store and year fixed effects. In column 1 the
interaction term is negative and significant. The coefficient on PostPE * DirectOwn is -0.32,
while the coefficient on PostPE alone is still negative at -0.22 but is insignificant13. Thus the
reduction in critical violations is concentrated at directly owned stores. In column 2 we
include the number of employees and seats and results are similar, suggesting that
improvements at health practices at directly owned restaurants are not driven by alternations
of number of employees or number of seats. Moreover, these improvements in health
practices cannot be driven by hidden variation in strength of brand, popularity of food genre,
or advertising strategy because all branches are identical along these dimensions. In columns 3
and 4 we replace year fixed effects with zip code-by-year fixed effects to address concerns
regarding franchisee location choice. The results are unchanged.
12Results are very similar if we use a 10% top/bottom cutoff.
13The independent variable DirectOwn does not drop out of the regression with store fixed effects because some
stores switch between parent and franchise ownership.
17Overall, these results suggest that within the organization, improvements in health and
sanitation practices are concentrated in stores in which PE has greater control.
C. Employment
Private equity firms may make operational changes to restaurants along margins
besides health and sanitation. The effect of private equity on employment is controversial.
The popular press often chides private equity for eliminating jobs for debt service and short-
term profits. Davis, et al. (2011) find that private equity transactions result in increased job
creation and destruction via reallocation across new establishments and closures, but the net
impact on employment is modest.
We explore the effect on this stakeholder in Table VII. First, do PE firms increase the
number of stores? We total all units by chain each year. We regress the log of this annual
restaurant count on PostPE in column 1 with chain and year fixed effects and find a positive,
but insignificant coefficient14. Acquired chains do not appear to be expanding more or less
quickly than before. One caveat is our data covers only Florida, so we do not know if PE
firms are expanding or contracting nationally. Next, we calculate the average number of
employees by chain each year. Across all chains, the mean and median employee counts are 20
and 12. In column 2 of Table VII, we regress the mean employee count by chain on PostPE
and a chain fixed effect. The coefficient is -0.14 and significant at the 5% level. The average
store in the chain has approximately one less full-time equivalent employee after PE takes
over. In column 3, the log of the average number of seats in the chain is included as a control.
Larger restaurants employ more people, and the coefficient on PostPE is still negative.
14Because employees are measured at an annual frequency at an unknown date during each year, we drop data
points in the year of PE entry since we cannot pinpoint whether the employee count that year was made before
or after the deal closing date.
18Employees per store at the chain level can fall for two reasons: PE firms could be
shifting the composition to smaller, more efficient stores or reducing headcount at existing
stores. To distinguish between these possibilities we turn our analysis to the restaurant level,
and individual restaurants are now the unit of observation. In column 4 the dependent variable
is number of employees, and we add individual store fixed effects. The coefficient on PostPE
is still negative and significant, and thus PE firms do appear to operate existing restaurants
with fewer employees than before. To control for the possibility that PE targets are located in
areas that, perhaps due to varying economic conditions, have employment patterns different
from other restaurants, we include zip code-by-year fixed effects in column 5. PE restaurants
still see a decline in workers even when adjusting for geographic variation. In columns 6 and 7
of Table VI we include the PostPE * DirectOwn interaction to see if the employment effect is
stronger in directly controlled branches. The interaction is essentially zero, meaning both
company-owned and franchised outlets see a similar decline in headcount. It is possible that
relative to hygiene practices, employee counts are more easily contractible and hence easier for
the parent to mandate. Franchisees may also be more amenable to suggestions which lower
their costs.
D. Menu prices
To continue identifying operational changes at private equity owned restaurants, we
turn to pricing. Does the increase in leverage associated with buyout firms and improved
food-safety practices come at the expense of higher prices? Or is cost cutting passed on to the
consumer? We gather annual menus from 2005-2012 for 2,178 restaurant chains from
Datassential. Datassential draws a representative menu each year from each of these chains.
There can be regional differences in pricing; we assume that the randomly drawn menu is
19representative of the entire chain. Unlike with inspections and employment, our pricing
analysis will thus necessarily be at the overall chain level, not the individual establishment
level.15 The menu data includes the restaurant name, every menu item (e.g., “Hot and sour
soup”), its price, and its broad item category (“Soup—appetizer”). Each restaurant is also
categorized into one of four segments (Quick service, Casual, Midscale, Fine dining) and one
of 24 cuisine types (e.g., Chinese).
For each restaurant-year, we first generate itemtype_price, which averages the prices of all
items in each broad category. Thus instead of having five soups with different prices, we
collapse these into a single average “soup” price for each restaurant, each year. We also again
create the variable PostPE which equals one for all restaurant-year menus drawn after a private
equity firm has acquired the chain. The unit of observation is restaurant’s itemtype_price each
year. In Table VIII, column 1, itemtype_price is regressed on PostPE and chain and year fixed
effects. The coefficient is -0.29 and weakly significant. This means, relative to average prices
for all restaurants, the average menu item is 29 cents cheaper in years after PE takeover than it
was before.
We refine this analysis by using only close competitor pricing as a counterfactual.
Holding steak prices constant is actually a relative decline if other steakhouses charge more.
We replace year fixed effects with “year × cuisine type × segment × item type” fixed effects.
The unit of observation in these regressions is a restaurant’s itemtype_price each year. For
Applebee’s “cold sandwich” price in 2005, then, the new fixed effect controls for “cold
sandwich” (item type) prices sold by all other American (cuisine type), Casual (segment)
15 Unfortunately, individual restaurant pricing information is not widely available.
20restaurants in 200516. The regression in column 2 with these fixed effects shows a coefficient
of -30 cents on PostPE, still significant at 10%. Thus private equity restaurant prices fall
relative to those of their closest competitors. Regressions 3-7 look at pricing changes in
specific categories. Entrées, the most expensive menu item, show the largest and most
significant declines.
Overall, the results illustrate that item prices go down following the PE buyout,
suggesting that improvements in sanitation practices and food safety do not translate into
higher prices for consumers.
IV. Conclusion
We study what private equity firms actually do operationally with firms they buy in the
context of the restaurant industry. We find that restaurants commit fewer health violations
after being acquired by a private equity firm. This effect is driven by those critical hazards
most dangerous for customers and public health. Violations are strongly negatively correlated
with online review scores, and thus customer satisfaction is likely to be higher as well. On the
cost side, PE restaurants achieve efficiency improvements, as employee headcount at existing
stores declines after takeover. PE appears to pass these savings to customers, as pricing
declines relative to competitors.
These findings are inconsistent with the portrayal of private equity as solely an exercise
in financial engineering with a negative influence on the real economy. Rather, PE firms take
an active managerial role in the firms they acquire and improve operations management
16For these fixed effects to provide meaningful comparisons, we drop observations without at least 10 cuisine
type × segment × item type competitors. For example, “Italian, Fine Dining, Fried Chicken” data points, for
example, would likely be dropped. For consistency, we also apply this cutoff in column 1 of Table VIII.
21practices, beyond the reallocation of labor and capital that was previously documented in the
literature.
22References
Bartel, Ann, Casey Ichniowski, and Kathryn Shaw, 2007, How does information
technology affect productivity? Plant-level comparisons of product innovation,
process improvement, and worker skills, The Quarterly journal of Economics 122,
1721-1758.
Black, Sandra E, and Lisa M Lynch, 2001, How to compete: The impact of workplace
practices and information technology on productivity, Review of Economics and
statistics 83, 434-445.
Bloom, Nicholas, and John Van Reenen, 2007, Measuring and explaining management
practices across firms and countries, The Quarterly Journal of Economics 122,
1351-1408.
Bloom, Nick, Raffaella Sadun, and John Van Reenen, 2009, Do private equity owned firms
have better management practices?
Boucly, Quentin, David Sraer, and David Thesmar, 2011, Growth lbos, Journal of
Financial Economics 102, 432-453.
Collins, Janet E, 1997, Impact of changing consumer lifestyles on the
emergence/reemergence of foodborne pathogens, Emerging Infectious Diseases 3,
471.
Davis, Steven J, John C Haltiwanger, Ron S Jarmin, Josh Lerner, and Javier Miranda,
2011, Private equity and employment, (National Bureau of Economic Research).
Gompers, Paul, Kristin Mugford, and J. Daniel Kim, 2012, Bain capital: Outback
steakhouse, Harvard Business School Case study N2-212-087.
Guo, Shourun, Edith S Hotchkiss, and Weihong Song, 2011, Do buyouts (still) create
value?, The Journal of Finance 66, 479-517.
Ichniowski, Casey, Kathryn Shaw, and Giovanna Prennushi, 1997, The effects of human
resource practices on manufacturing performance: A study of steel finishing lines,
American Economic Review 87, 291-313.
John, Kose, Larry HP Lang, and Jeffry Netter, 1992, The voluntary restructuring of large
firms in response to performance decline, The Journal of Finance 47, 891-917.
Kaplan, Steven, 1989, The effects of management buyouts on operating performance and
value, Journal of financial economics 24, 217-254.
Lafontaine, Francine, and Margaret Slade, 2007, Vertical integration and firm boundaries:
The evidence, Journal of Economic Literature 629-685.
Lazear, Edward P, 2000, Performance pay and productivity, American Economic Review
1346-1361.
Lichtenberg, Frank R, and Donald Siegel, 1990, The effects of leveraged buyouts on
productivity and related aspects of firm behavior, Journal of Financial Economics
27, 165-194.
Luca, Michael, 2011, Reviews, reputation, and revenue: The case of yelp. Com, (Harvard
Business School).
Matsa, David A, 2011, Running on empty? Financial leverage and product quality in the
supermarket industry, American Economic Journal: Microeconomics 3, 137-173.
23Figure 1a: Critical violations around private equity deal date.
This figure plots the coefficients and 95% confidence interval bands of a regression of critical
violations on event year dummy variables around the date private equity acquires a restaurant.
Additional control variables are restaurant fixed effects, year fixed effects, number of employees and
number of seats. Standard errors are clustered at the level of the chain. Event year 0 is the omitted
variable, corresponding to inspections that occur from 1 to 365 days after the deal close date.
24Figure 1b: Non-Critical violations around private equity deal date.
This figure plots the coefficients and 95% confidence interval bands of a regression of non-critical
violations on event year dummy variables around the date private equity acquires a restaurant.
Additional control variables are restaurant fixed effects, year fixed effects, number of employees and
number of seats. Standard errors are clustered at the level of the chain. Event year 0 is the omitted
variable, corresponding to inspections that occur from 1 to 365 days after the deal close date.
25Figure 2: Burger King Restaurants in Tampa, Florida
Map presents the locations of Burger King restaurants in Tampa, Florida, as of December 2012. Black
circles are restaurants directly owned by Burger King headquarters, while red cirlcle are franchisees.
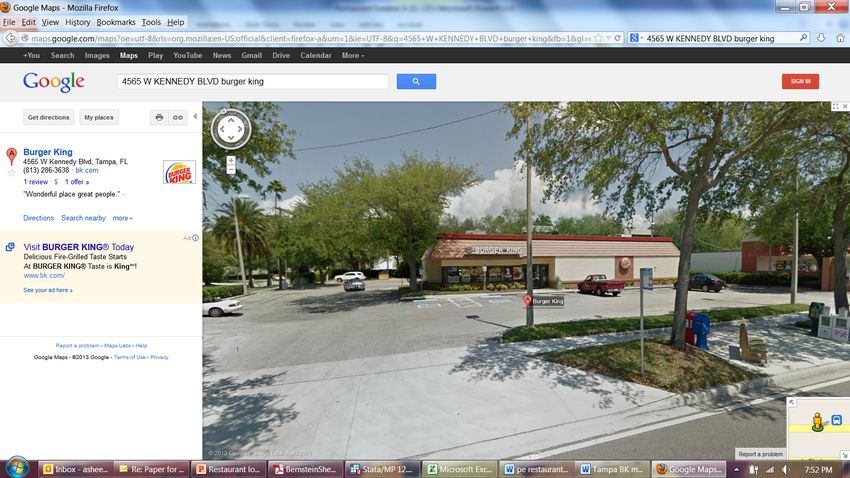
26Figure 3: Franchised vs. Directly owned Burger King restaurants – Tampa, Florida
Restaurant numbers indicate the location in the map in Figure 2.
#5
Direct-‐owned
#16
Franchised
27Table I
Inspection Summary Statistics
This table summarizes the Florida restaurant health inspection data. Critical violations are those “likely to directly
contribute to food contamination, illness or environmental degradation.” Non-critical violations “do not directly
relate to foodborne illness risk, but preventive measures are required.” Only routine, surprise inspections are
counted.
Inspections Restaurants Inspections per Avg # critical Avg # non-crt
Year conducted inspected restaurant violations violations
2002 45,437 35,265 1.29 1.46 1.84
2003 84,089 38,682 2.17 1.96 2.65
2004 67,569 37,925 1.78 2.08 3.20
2005 73,419 40,397 1.82 2.50 3.59
2006 75,872 40,840 1.86 4.42 4.08
2007 76,857 41,246 1.86 6.06 3.44
2008 89,680 43,371 2.07 5.76 3.43
2009 101,819 44,610 2.28 4.97 2.85
2010 99,264 44,760 2.22 4.91 2.88
2011 105,914 45,917 2.31 4.31 2.41
2012 106,067 48,561 2.18 4.18 2.31
Mean 4.07 2.96
St Dev 4.27 3.27
28Table II
Drivers of Restaurant Health and Cleanliness
This table reports general determinants of restaurant health inspection outcomes. Critical violations are those
“likely to directly contribute to food contamination, illness or environmental degradation.” Non-critical
violations “do not directly relate to foodborne illness risk, but preventive measures are required.” Units in chain
counts the total number of separate stores of that particular restaurant chain in Florida each year. Median county
income is the median income each year in the restaurant’s county. Standard errors are omitted for cuisine types
for brevity; positive significance is bolded, negative significance is bolded and italicized. Standard errors are
clustered by restaurant chain. *, **, *** indicate significance at 10%, 5%, 1%.
Critical Critical Non-critical Non-critical
violations violations violations violations
(1) (2) (3) (4)
Log(Units in chain) -0.238*** -0.112***
(0.026) (0.020)
Log(Seats) 0.262*** 0.195*** 0.223*** 0.141***
(0.024) (0.027) (0.022) (0.022)
Log(Employees) 0.065** 0.079*** 0.179*** 0.096***
(0.033) (0.020) (0.024) (0.015)
Log(Median county income) -0.535*** -0.334** -0.509*** -0.345***
(0.101) (0.132) (0.074) (0.088)
Average check under $7 -0.632** -0.232
(0.275) (0.219)
$7 - $10 -0.394** -0.095
(0.164) (0.128)
$10 - $20 0.220* 0.207*
(0.132) (0.120)
Cuisine type
American- omitted category
Asian 1.628*** 1.050***
Chicken 0.032 0.543***
Donut, ice cream, beverage -0.542** -0.530**
Hamburgers -0.240 -0.433
Other ethnic -0.101 -0.224
Pizza, pasta, Italian 0.178 -0.136
Sandwiches, soup, deli -0.417* -0.594***
Steak, seafood -0.263 -0.038
Year fixed effects X X X X
Chain fixed effects X X
Observations 345,489 345,489 345,489 345,489
R2 0.20 0.32 0.10 0.21
29Table III
Health Violations and Customer Satisfaction
This table presents results from OLS regressions of customer satisfaction on restaurant sanitation. Each
observation is a restaurant chain. The dependent variable Avg Yelp stars is the average star rating (which can
range from 1 to 5) for all reviews given to all branches in a chain in 2012 on the website Yelp.com. The
dependent variable Avg critical violations similarly averages the critical violations for all inspections for all
branches in a chain in 2012. The restriction “5 or more reviews” refers to the number of Yelp reviews for the
chain in 2012. Standard errors are in parentheses. *, **, *** indicate significance at 10%, 5%, 1%.
Dependent variable = Avg Yelp stars
(1) (2) (3)
Avg critical violations -0.025*** -0.022*** -0.022***
(0.003) (0.004) (0.004)
Price × Cuisine fixed effects X X
5 or more reviews X
Observations 5,876 3,775 2,123
R2 0.012 0.031 0.051
30Table IV
Violations under Private Equity Ownership
This table presents results from OLS regressions of restaurant inspection results on private equity ownership
and store characteristics. An observation is an inspection on a specific date at a specific restaurant address.
The dependent variable Critical violations is the number of critical violations, those “likely to directly contribute
to food contamination, illness or environmental degradation,” recorded during the inspection. Non-critical
violations are those that “do not directly relate to foodborne illness risk, but preventive measures are required.”
PostPE is a dummy variable which equals one if a restaurant is owned by a private equity firm on that
inspection date. Log(Seats) and Log(Employees) count the number of seats and full-time equivalent employees at
the restaurant in the year of the inspection. Zip × Year fixed effects use the zip code of each restaurant.
Standard errors are in parentheses and clustered by restaurant chain. *, **, *** indicate significance at 10%,
5%, 1%.
Panel A: Dependent variable = Critical violations
(1a) (2a) (3a) (4a) (5a) (6a)
PostPE -0.662*** -0.647*** -0.627** -0.625** -0.614** -0.612**
(0.238) (0.240) (0.249) (0.251) (0.252) (0.253)
Log(Seats) 0.212*** 0.239*** 0.178***
(0.0257) (0.0503) (0.054)
Log(Employees) 0.0676*** -0.0289 -0.028
(0.0169) (0.0188) (0.020)
Chain fixed effects X X
Store fixed effects X X X X
Year fixed effects X X X X
Zip × Year fixed effects X X
Observations 553,471 541,147 553,471 541,147 553,471 541,147
R2 0.122 0.134 0.122 0.137 0.536 0.535
Panel B: Dependent variable = Non-Critical violations
(1b) (2b) (3b) (4b) (5b) (6b)
PostPE 0.0526 0.0685 0.087 0.084 0.024 0.023
(0.139) (0.141) (0.154) (0.156) (0.148) (0.150)
Log(Seats) 0.155*** 0.006 0.037
(0.0208) (0.041) (0.037)
Log(Employees) 0.0841*** -0.007 -0.003
(0.0134) (0.012) (0.012)
Chain fixed effects X X
Store fixed effects X X X X
Year fixed effects X X X X
Zip × Year fixed effects X X
Observations 553,471 541,147 553,471 541,147 553,471 541,147
R2 0.031 0.046 0.030 0.031 0.471 0.470
31Table V
Restaurant Health Violations by Category
This table presents results from OLS regressions of violations in disaggregated categories of restaurant
maintenance and sanitation on private equity ownership and store characteristics. An observation is an
inspection on a specific date at a specific restaurant address. Appendix A details the specific critical and non-
critical violations that belong to each category. The independent variables are as defined in Table IV.
Standard errors are in parentheses and clustered by restaurant chain. *, **, *** indicate significance at 10%,
5%, 1%.
Food Maintenance Maintenance Consumer Training/
Handling (Kitchen) (Non-Kitchen) Advising Certification
(1) (2) (3) (4) (5)
PostPE -0.351*** -0.0274* -0.0743 -0.0929*** -0.0167
(0.133) (0.0163) (0.0530) (0.0321) (0.0194)
Log(Seats) 0.107*** 0.0111 0.0301** 0.0151* 0.00854
(0.0301) (0.00873) (0.0125) (0.00828) (0.00758)
Log(Employees) -0.0112 -0.000521 -0.00705 -0.00524* -0.00574**
(0.0107) (0.00237) (0.00551) (0.00278) (0.00235)
Store fixed effects X X X X X
Year fixed effects X X X X X
Observations 540,366 540,366 540,366 540,366 540,366
32Table VI
Inspection Results in Directly Owned versus Franchised Stores
This table presents results from OLS regressions of restaurant inspection results on private equity ownership
and store characteristics. An observation is an inspection on a specific date at a specific restaurant address.
The independent variable DirectOwn is a dummy variable which equals one if the restaurant is owned and
operated by its brand’s parent company in a given year. DirectOwn equals zero if the restaurant is run by an
independent franchisee. The remaining variables are as defined in Table IV. Standard errors are in
parentheses and clustered by restaurant chain. *, **, *** indicate significance at 10%, 5%, 1%.
Critical Violations Critical Violations Critical Violations Critical Violations
(1) (2) (3) (4)
PostPE -0.223 -0.222 -0.160 -0.159
(0.306) (0.306) (0.266) (0.266)
PostPE * DirectOwn -0.316** -0.315** -0.319** -0.319**
(0.150) (0.150) (0.141) (0.141)
DirectOwn 0.106 0.102 0.114 0.111
(0.133) (0.134) (0.121) (0.121)
Log(Seats) 0.232*** 0.146*
(0.071) (0.086)
Log(Employees) -0.034 -0.023
(0.024) (0.025)
Store fixed effects X X X X
Year fixed effects X X
Zip × Year fixed effects X X
Observations 179,524 179,390 179,524 179,390
R2 0.107 0.111 0.520 0.520
33Table VII
Restaurant Employment under Private Equity Ownership
This table presents results from OLS regressions of restaurant count and employment characteristics on private
equity ownership. Number of restaurants is at the chain level, measured each year, and only includes stores in Florida.
Avg employees/store across chain is a single average for all restaurants in a chain in a year. The remaining variables are as
defined in Table VI. Standard errors are in parentheses and clustered by restaurant chain. *, **, *** indicate
significance at 10%, 5%, 1%.
Log avg Log avg
Log Log Log Log Log
emp/store emp/store
number of employees employees employees employees
across across
restaurants / store / store / store / store
chain chain
(1) (2) (3) (4) (5) (6) (7)
PostPE 0.074 -0.140** -0.142** -0.032** -0.026* -0.022* -0.019*
(0.120) (0.059) (0.059) (0.014) (0.014) (0.012) (0.011)
PostPE * 0.002 0.000
DirectOwn
(0.012) (0.010)
DirectOwn 0.009 0.018
(0.010) (0.012)
Log avg seats 0.180*** 0.021*** 0.028*** 0.007 0.013
(0.018) (0.007) (0.008) (0.009) (0.009)
Chain fixed effects X X X
Store fixed effects X X X X
Year fixed effects X X X X X
Zip × Year fixed X X
effects
Observations 126,101 123,788 111,733 241,337 235,090 74,065 70,554
R2 0.904 0.940 0.926 0.961 0.971 0.954 0.967
34Table VIII
Restaurant Prices under Private Equity Ownership
This table presents results from OLS regressions of restaurant menu prices on private equity ownership. An observation is a menu
item type at a particular restaurant in a given year. The dependent variable Item type price is the average price of all menu items in a
food category (e.g., “cold sandwiches”) sold by a particular restaurant in a given year. An example of a Year × Cuisine × Segment ×
Item type fixed effect is “2005, Chinese, Fine dining, dessert.” The data comprise menus from 2,178 restaurant chains sampled
annually from 2005-2012. Standard errors are in parentheses and clustered by restaurant chain. *, **, *** indicate significance at
10%, 5%, 1%.
Menu items All All Appetizer Beverage Dessert Entrée Side
Dependent variable = Item type price
(1) (2) (3) (4) (5) (6) (7)
PostPE -0.285* -0.304* -0.144 -0.178* -0.318 -0.456** -0.0896
(0.171) (0.180) -0.374 -0.0976 -0.523 -0.208 -0.115
Chain fixed effects X X X X X X X
Year fixed effects X
Year × Cuisine × Segment × X X X X X X
Item type fixed effects
Observations 374,891 374,891 65,281 67,757 32,635 116,190 77,076
R2 0.185 0.497 0.51 0.426 0.523 0.479 0.427
35You can also read