MARRIOTT INTERNATIONAL, INC. EXECUTIVE AND DIRECTOR COMPENSATION - Investor Relations | Marriott ...
←
→
Page content transcription
If your browser does not render page correctly, please read the page content below
The following information is excerpted from Marriott International’s 2019 Proxy Statement, issued April 10, 2019. We
advise you to refer back to the Proxy in its entirety for the most complete Executive Compensation information.

MARRIOTT INTERNATIONAL, INC.
EXECUTIVE AND DIRECTOR COMPENSATION
Report of the Compensation Policy Committee
Marriott is consistently recognized as a global hospitality leader. The Company believes that strong and consistent leadership is
the key to long-term success in the hospitality industry. Each of the NEOs is a long-standing member of our senior management
team, averaging over 24 years of hospitality experience with the Company. They have continued Marriott’s long history of
delivering results for stockholders by working with talented, dedicated associates who uphold the Company’s ideals and unique
culture. This culture is reflected in, and reinforced by, the design and implementation of the Company’s executive compensation
program, which emphasizes the following principles:
• There should be a strong correlation between NEO pay and Company performance. Therefore, a substantial portion of NEO
  pay should be tied to achieving key performance goals.
• NEOs should be paid in a manner that contributes to long-term stockholder value. Therefore, equity compensation should be
  the most significant component of total pay opportunity for the NEOs.
• Compensation should be designed to motivate the NEOs to perform their duties in ways that will help the Company meet its
  short- and long-term objectives. Therefore, compensation should consist of an appropriate mix of the following compensation
  elements: cash and non-cash, annual and multi-year, and performance-based and service-based.
• The executive compensation program must be competitive so that the Company can attract key talent from within and outside
  of our industry and retain key talent at costs consistent with market practice. Therefore, compensation should reflect market
  data, individual performance, and internal pay equity considerations, including the ratio of the CEO’s compensation to the other
  NEOs’ compensation.
The Compensation Policy Committee (the “Committee”), which is composed solely of independent members of the Board,
assists the Board in fulfilling its responsibilities relating to executive compensation. The Committee is responsible for overseeing
compensation programs that enable the Company to attract, retain and motivate executives capable of establishing and
implementing business plans in the best interests of the stockholders. The Committee, on behalf of and, in certain instances,
subject to the approval of the Board, reviews and approves compensation programs for certain senior officer positions. In this
context, the Committee reviewed and discussed with management the Company’s CD&A required by Item 402(b) of SEC
Regulation S-K. Following the reviews and discussions referred to above, the Committee recommended to the Board that the
CD&A be incorporated by reference in the Company’s annual report on Form 10-K and included in this proxy statement.
Members of the Compensation Policy Committee:
Steven S Reinemund (Chair)
Mary K. Bush
Eric Hippeau
Aylwin B. Lewis
Susan C. Schwab

Compensation Discussion and Analysis
This section discusses the Company’s executive compensation program for the following NEOs for 2018:

   Arne M. Sorenson        President and Chief Executive Officer
   Anthony G. Capuano      Executive Vice President and Global Chief Development Officer
   Stephanie C. Linnartz   Executive Vice President and Global Chief Commercial Officer
   David J. Grissen        Group President
   Kathleen K. Oberg       Executive Vice President and Chief Financial Officer

Overview
Our executive compensation program continues to be designed to drive performance through a combination of near-term
financial and operational objectives and long-term focus on our stock price performance. We believe that the consistency in how
we manage our executive compensation program and our goals under that program has proven to be an important factor in the
Company’s long-term success in the highly cyclical hospitality industry. Our philosophy continues to emphasize equity
compensation as the most significant component of our NEOs’ total pay opportunity which supports our pay-for-performance
objectives.
Compensation for 2018 reflects that financial and operational performance for the year was strong and exceeded guidance that
we provided at the beginning of the year. Declines in the Company’s stock price across a year of global trade and economic
tensions (i.e., stock market decline, China trade discussions, Brexit developments) are reflected in our NEOs’ realizable
compensation. In addition, the Committee took into account the Data Security Incident when determining our CEO’s annual
incentive compensation, although it believes that our NEOs engaged proactively and appropriately to respond to and help
contain the impact of the event, and the Company does not expect the incident to affect the Company’s long-term financial
health.
2018 Executive Compensation at a Glance
• Base Salary: The Committee did not increase Mr. Sorenson’s base salary and increased the base salaries of the other NEOs
3% based on the Committee’s review of external market data.
• Annual Incentive: The annual cash incentive program resulted in an overall above target but less than maximum payout for
each NEO for 2018. Specifically, the Committee noted that the Company achieved Adjusted EPS (as defined below) well
above the maximum achievement level, and that other performance criteria had strong but varying results. However, while
observing no significant adverse effect on the Company’s strong 2018 financial and operational results, Mr. Sorenson noted to
the Committee and the Board the impact on guest experience from the Data Security Incident and from challenges with the
unified loyalty program rollout. Accordingly, he recommended that the Committee and the Board not approve any payout for
the Individual Achievement, RevPAR Index and Guest Satisfaction components of his annual incentive, all of which are wholly
or partially intended to evaluate/reflect guest experience. The Board, on recommendation of the Committee, exercised its
discretion to adjust Mr. Sorenson’s annual cash incentive plan accordingly.
• Equity Compensation: In February 2018, the Committee approved awards with values that were higher than the 2017 annual
stock awards for each NEO based on the Committee’s review of external market data, individual performance, and internal pay
equity considerations. PSUs continued to comprise the largest component of the NEOs’ equity awards, representing 50% of
equity for the CEO and 40% of equity for the other NEOs.
• 2016-2018 PSUs: PSUs granted in 2016 were earned for the three-year performance period ending in 2018 at an overall
payout of 104% of target based on performance over the three-year performance period against pre-established goals for
Global Gross Room Openings (80% of target payout), Global RevPAR Index (150% of target payout) and Global Net
Administrative Expenses (83% of target payout). Business Integration PSUs (“BI-PSUs”), one-time special awards granted in
connection with the Starwood combination, were earned for the three-year performance period ending in 2018 at an overall
payout of 97% of target, based on performance over the three-year performance period against pre-established goals for
Management Synergies and Cost Savings (109% of target payout), Hotel Revenue Synergies (33% of target payout) and Hotel
Margin Synergies (150% of target payout).
2018 Compensation in Detail
Base Salary
For 2018, the Human Resources Department presented to the Committee market data on base salary levels at the
50th percentile for each position and recommended base salary increases of approximately 3% for Mr. Capuano, Ms. Linnartz,
Mr. Grissen and Ms. Oberg after it completed a comprehensive review of market data in 2018 as described below. These
increases were consistent with salary increases for other management. Further, notwithstanding the Company’s continued
success under Mr. Sorenson’s leadership, following its review of the external market data the Committee determined not to
increase Mr. Sorenson’s base salary for 2018. The Company’s independent compensation consultant, Pearl Meyer (the
“Compensation Consultant”), reviewed and supported the recommendations which were discussed in detail and approved by the
Committee and, with respect to Mr. Sorenson, by the independent members of the Board.
2017 to 2018
2018 Base Salary ($) 2017 Base Salary ($) Increase (%)
Arne M. Sorenson 1,300,000 1,300,000 0
Anthony G. Capuano 824,000 800,000 3.0
Stephanie C. Linnartz 824,000 800,000 3.0
David J. Grissen 824,000 800,000 3.0
Kathleen K. Oberg 772,500 750,000 3.0
Annual Incentives
To promote growth and profitability, the Company’s annual cash incentive program is based on actual performance measured
against pre-established financial and business operational targets. The annual cash incentive design rewards executives for
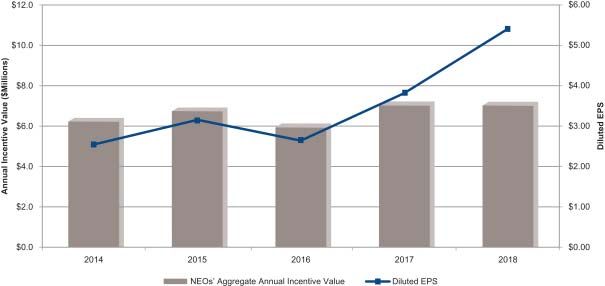
achieving annual corporate and individual performance objectives that support long-term financial and operational success.The following graph illustrates how the aggregate annual incentives paid to the NEOs have changed relative to changes in the
Company’s annual diluted earnings per share (“EPS”), over the past five years. EPS for 2016 and 2017 reflects $386 million and
$159 million in merger-related costs attributable to the Starwood combination, respectively.
NEOs’ Aggregate Annual Incentive Value vs. Diluted EPS
At its February 2018 meeting, the Committee approved specific performance objectives and targets under the annual cash
incentive program for 2018. In February 2019, upon review of the 2018 fiscal year’s strategic integration achievements and
financial and operational results and taking into account the Company’s performance relative to lodging and other comparator
companies, the Committee reviewed each NEO’s performance against the pre-established performance objectives to determine
the actual cash incentive payments, as discussed below. All the Committee’s decisions regarding annual cash incentives for
Mr. Sorenson, including adjustments to certain elements of his annual incentive compensation as discussed above, were subject
to and received Board approval.
As reflected in the following table, target awards under the annual cash incentive program were 150% of salary for Mr. Sorenson
and 75% for the other NEOs. The Committee reviewed market data for each position and determined that the incentive amounts
payable upon achievement of target performance levels would result in total cash compensation (base salary plus annual
incentive) that would be at or near the 50th percentile.
Target Award as a
Name % of Salary
Arne M. Sorenson 150
Anthony G. Capuano 75
Stephanie C. Linnartz 75
David J. Grissen 75
Kathleen K. Oberg 75The annual cash incentive program performance factors are intended to establish high standards consistent with the Company’s
quality goals, which are designed to be achievable but not certain to be met. The Company believes that these factors are
critical to achieving success within the hospitality and service industry. The weighting of performance factors varies among the
NEOs by position due to differences in responsibility. The table below displays the respective weightings of the relevant
performance measures and the aggregate actual payout as a percent of target for 2018 under the annual cash incentive
program.
Actual
Payout
Adjusted as a
Operating Percent
Adjusted Profit - Room Global Associate RevPAR Guest Individual of
Name EPS Americas Growth(1) Sales(1) Engagement(1) Index (1) Satisfaction(1)(2) Achievement(2) Total Target(3)
Arne 60 n/a 10 n/a 5 10 10 5 100 150%(4)
M. Sorenson
Anthony
G. Capuano 10 n/a 75 n/a 5 5 n/a 5 100 192%
Stephanie
C. Linnartz 40 n/a n/a 20 5 15 15 5 100 149%
David J. Grissen 25 25 15 n/a 5 15 10 5 100 154%
Kathleen
K. Oberg 60 n/a 10 n/a 5 10 10 5 100 172%
(1)
Each of these factors is measured against Company-wide results except that Mr. Grissen’s components are measured against the Americas division,
his primary area of responsibility. Ms. Linnartz’s annual cash incentive plan includes a Global Sales component, a major area of responsibility for her.
(2)
The Guest Satisfaction component was temporarily removed for 2017 but was reintroduced in 2018 after the Company incorporated a combined
reporting system reflecting the Starwood combination. As a result, for 2018, the Individual Achievement component’s weighting decreased by 10%
for Messrs. Sorenson and Grissen and Ms. Oberg, and by 15% for Ms. Linnartz, such that the component only has a 5% weighting for each NEO.
(3)
We report the potential payouts under the annual cash incentive program for 2018 in dollars in the Grants of Plan-Based Awards for Fiscal 2018
table, and the actual amounts earned under the annual cash incentive program for 2018 in dollars in the Summary Compensation Table following the
CD&A.
(4)
Notwithstanding strong 2018 financial and operational results, in consideration of the Data Security Incident and challenges with the unified loyalty
program rollout, and, at Mr. Sorenson’s recommendation, the Board exercised its discretion not to approve any payout for the Individual
Achievement, RevPAR Index and Guest Satisfaction components of Mr. Sorenson’s annual cash incentive plan.
The performance factors for each NEO under the annual cash incentive program for 2018 are described following the Grants of
Plan-Based Awards for Fiscal 2018 table on page 50.
The graph below sets forth the Company’s performance, compared to target, for the Company-wide performance goals
applicable to our NEOs under the annual cash incentive program for 2018 compared to 2017.
* For Mr. Grissen, in addition to Adjusted EPS, his financial performance objectives included operating profit from the Americas division. The 2018
Americas Adjusted Operating Profit achievement versus target was 106% and 2017 Americas Adjusted Operating Profit achievement versus target
was 107%.
Long-Term Incentive Awards
Annual Stock Awards
The Company grants equity compensation awards to the NEOs under the Marriott International, Inc. Stock and Cash Incentive
Plan (the “Stock Plan”) on an annual basis to link NEO pay to long-term Company performance and to align the interests ofNEOs with those of our stockholders. The Committee approved 2018 annual equity awards based on its review of external
market data, individual performance, and internal pay equity considerations. The aggregate target values of the awards granted
to the NEOs are set forth in the following table (amounts reflected in the Summary Compensation Table reflect actual grant date
fair value as determined in accordance with accounting guidance):
2018 Target Value of 2017 Target Value of
Annual Annual
Stock Awards ($) Stock Awards ($) 2017 to 2018 Change (%)
Arne M. Sorenson 9,000,000 7,500,000 20
Anthony G. Capuano 3,733,040 3,344,725 12
Stephanie C. Linnartz 3,100,000 2,850,000 9
David J. Grissen 3,100,000 2,850,000 9
Kathleen K. Oberg 3,000,000 2,600,000 15
The NEOs’ stock awards for 2018 were granted on February 20, 2018, in a mix (based on the target values) of 50% PSUs, 25%
SARs and 25% RSUs for Mr. Sorenson and 40% PSUs, 30% SARs and 30% RSUs for other NEOs, vesting ratably over three
years for SARs and RSUs and vesting after three years for PSUs (as described below). The number of RSUs and PSUs granted
was determined based on the average of the high and low prices of a share of our Class A common stock on the grant date,
which was $139.54 per share, and the number of SARs granted was determined based on an estimated binomial value of 34%
of that stock price. In addition, as in prior years, Mr. Capuano received a separate grant of RSUs which vest on the third
anniversary of the grant date, subject to Mr. Capuano’s continuous employment. This separate RSU award had a target value
approximately the same as the annual cash incentive that Mr. Capuano earned for fiscal year 2017. The Committee established
the separate RSU award based on Mr. Capuano’s most recent annual cash incentive in order to further the objective of
compensating Mr. Capuano primarily in recognition of his development activities and performance. By also imposing three-year
cliff vesting, this grant offers additional retention value and further links Mr. Capuano’s pay with the long-term interests of
stockholders.
PSUs
PSUs are restricted stock units that may be earned after three years based on achievement of pre-established targets for
RevPAR Index, gross room openings, and net administrative expenses over a three-year period, with one-third of the target
number of shares subject to each performance measure. These three financial and operating metrics are the same measures
that were selected for the 2017-2019 PSU performance period and were selected by the Committee for the 2018-2020 PSU
grants because they reflect management efforts that are directly tied to the long-term strength of our brands, as opposed to
other performance measures that are more prone to be impacted by economic or other factors beyond our executives’ control.
The performance measures establish clean and quantifiable criteria that we believe are key drivers of long-term value creation,
as follows:
• Global Gross Room Openings: Gross room openings includes the total number of system-wide, managed, franchised and
owned/leased rooms added to our system, excluding rooms added through merger and acquisition activity, and reflects our
executives’ achievements in attracting financing and owner/franchisee interest in our brands over those of our competitors.
• Global RevPAR Index: RevPAR Index measures the strength/performance of our brands by comparing each hotel’s RevPAR
against the RevPAR of a group of comparable hotels generally in the same market and lodging segment, stated as a
percentage. RevPAR Index is an industry-specific measure of relative performance. Global RevPAR Index is a weighted
average of the RevPAR Index of all our hotels, except for hotels that recently opened, recently underwent a significant
renovation, or had incomplete competitive reporting.
• Global Net Administrative Expense Growth: Net administrative expense measures our operating efficiency through our ability to
control certain expenses, including direct and indirect expenses, unrecovered expenses, development expenses, and
architecture and construction expenses, but excluding costs for mergers and acquisitions.
For each of the three metrics, NEOs can receive 50% of the target PSU award level if performance is at least threshold and up
to 150% of the target PSU award level if performance is above target. PSUs do not accrue dividend equivalents or pay
dividends; NEOs receive dividends and other rights of stockholders only after the awards vest and shares are issued. The
Committee approved the performance goals, which are competitively sensitive, at levels that are consistent with our strong
historical performance and with internal forecasts at the time of grant so that target performance would be difficult, but
attainable. It is also reasonably possible that awards could fall to zero or rise to maximum achievement levels.
In February 2019, the PSUs granted for the 2016-2018 performance period were settled at an overall payout of 104% of target,
based on performance over the three-year performance period against pre-established goals for Global Gross Room Openings
(80% of target payout), Global RevPAR Index (150% of target payout) and Global Net Administrative Expenses (83% of target
payout). The target and results for each component relative to target are shown in the graph below.In 2016, the NEOs were granted supplemental BI-PSUs in connection with the Starwood combination, with vesting criteria tied to specific goals that we identified as key drivers to realizing the benefits of the Starwood combination and creating long-term value by assessing overall management synergies and cost savings, hotel RevPAR Index improvements, and hotel margin improvements. In February 2019, the Committee confirmed the performance results under which BI-PSUs will be settled at an overall payout of 97% of target, based on performance over the three-year performance period against pre-established goals for Management Synergies and Cost Savings (109% of target payout), Hotel Revenue Synergies (33% of target payout) and Hotel Margin Synergies (150% of target payout). New Performance Measures for 2019 PSU Grants The PSUs granted in February 2019 for the 2019-2021 PSU performance period will be earned based on gross room openings (the same measure used for prior PSU grants) and two new performance measures: active Marriott BonvoyTM loyalty member growth and adjusted operating income growth. The Committee determined that these new financial and operational metrics should replace the RevPAR Index and net administrative expense measures used for prior PSU grants to reflect current areas of focus under the Company’s long-term business strategy. Specifically, all three measures for the 2019 grants continue to address three key constituencies—our owners, our guests, and our stockholders—and focus upon key drivers of long-term growth of the business. Gross room openings measures success of development activities and brand strength; active Marriott BonvoyTM member growth measures success in attracting and retaining high-value guests through our unified loyalty program; and operating income growth measures success in balancing both revenue and expense considerations to deliver increased financial profits from business operations to our stockholders. In addition, the Committee believes that these performance criteria will appropriately complement the performance measures used in our annual cash incentive program. Supplemental Stock Awards Supplemental stock awards tend to be infrequent and may be presented for consideration at quarterly Board meetings in recognition of special performance, promotions or assumption of additional responsibilities, to retain key talent or as a sign-on employment inducement. None of the NEOs received a supplemental stock award in 2018. Grant Timing and SAR Exercise Price The Company typically grants annual stock awards each year on the second trading day following the Company’s annual earnings conference call for the prior fiscal year. This timing is designed to avoid the possibility that the Company could grant stock awards prior to the release of material, non-public information that may result in an increase or decrease in its stock price. Similarly, supplemental stock awards may be granted throughout the year, but not during Company-imposed trading black-out periods in Company stock. Executives derive value from their SARs based on the appreciation in the value of the underlying shares of Company stock. For purposes of measuring this appreciation, the Company sets the exercise or base price as the average of the high and low quoted prices of the Company stock on the date the awards are granted. This average price valuation is common practice and offers no inherent pricing advantage to the executive or the Company. Other Compensation Perquisites The Company offers limited perquisites to its executives that make up a very small portion of total compensation for NEOs. One benefit that is consistent with practices within the hospitality industry is complimentary rooms, food and beverages at Company- owned, operated or franchised hotels and the use of hotel-related services such as Marriott-managed golf and spa facilities while on personal travel. These benefits are offered to encourage executive officers to visit and personally evaluate our properties. In addition, to enhance their efficiency and maximize the time that they can devote to Company business, NEOs are permitted to use the Company jet for personal travel in limited circumstances. None of the NEOs used the corporate jet for
personal travel during 2018. The value of these benefits is included in the executives’ wages for tax purposes, and the Company
does not provide tax gross-ups to the executives with respect to these benefits.

Other Benefits
Executives may participate in the same Company-wide benefit programs offered to all eligible U.S. associates. Some programs
are paid for solely by the enrollees (including executives) such as 401(k) plan elective deferrals, vision coverage, long- and
short-term disability, group life and accidental death and dismemberment insurance, and health care and dependent care
spending accounts. Other benefit programs are paid for or subsidized by the Company for all enrollees such as the 401(k)
Company match, group medical and dental coverage, $50,000 Company-paid life insurance, business travel accident insurance
and tuition reimbursement.

Nonqualified Deferred Compensation Plan
In addition to a tax-qualified 401(k) plan, the Company offers the NEOs and other senior management the opportunity to
supplement their retirement and other tax-deferred savings under the Marriott International, Inc. Executive Deferred
Compensation Plan (“EDC”). The Company believes that offering this plan to executives is critical to achieve the objectives of
attracting and retaining talent, particularly because the Company does not offer a defined benefit pension plan. The EDC,
including each NEO’s benefits under the EDC and the Company’s 2018 contributions to the EDC, is described under
“Nonqualified Deferred Compensation for Fiscal Year 2018” on page 56.

Change in Control
The Company provides limited, “double trigger” change in control benefits under the Stock Plan and the EDC upon a NEO’s
qualifying termination of employment in connection with a change in control of the Company, as described under “Potential
Payments Upon Termination or Change in Control” on page 57. The Committee believes that, with these carefully structured
benefits, the NEOs are better able to perform their duties with respect to any potential proposed corporate transaction without
the influence of or distraction by concerns about their employment or financial status. In addition, the Committee believes that
stockholder interests are protected and enhanced by providing greater certainty regarding executive pay obligations in the
context of planning and negotiating any potential corporate transactions.
The Company does not provide for tax gross-ups on these benefits and limits the Stock Plan benefits to avoid adverse tax
consequences to the Company. Specifically, the Stock Plan benefits are subject to a cut-back, so that the benefit will not be
provided to the extent it would result in the loss of a tax deduction by the Company or imposition of excise taxes under the
“golden parachute” excess parachute payment provisions of the Internal Revenue Code. The discussion of Potential Payments
Upon Termination or Change in Control below includes a table that reflects the year-end intrinsic value of unvested stock awards
and cash incentive payments that each NEO would receive if subject to an involuntary termination of employment in connection
with a change in control.

Compensation Process and Policies
2018 “Say-on-Pay” Advisory Vote on Executive Compensation and Stockholder Engagement
At the Company’s 2018 annual meeting, stockholders once again expressed substantial support for the compensation of our
NEOs with approximately 98% of the votes cast for approval of the “say-on-pay” advisory vote on our 2017 NEO compensation.
During 2018, the Committee also sought and received comments from some of the Company’s significant institutional
stockholders regarding the Company’s compensation process and policies. The Committee also reviewed with its Compensation
Consultant the elements and mix of annual and long-term executive officer compensation, the external compensation market
data described below, and the long-term effectiveness of the Company’s compensation programs. Based on the foregoing, the
Committee determined that the structure and operation of the executive compensation program have been effective in aligning
executive compensation with long-term stockholder value, and therefore determined to maintain the basic structure of the
program.
Stock Ownership Policies
The Company reinforces its performance-based and long-term philosophy through its stock ownership policy which requires
that, within five years of becoming subject to the policy, each NEO own Company stock with a total value equal to a multiple of
three to six times his or her individual salary grade midpoint. Each NEO is in compliance with this policy.

We have adopted a number of related policies that further reflect alignment with long-term stockholder value.
• Executive officers and directors are required to retain 50% of the net after-tax shares received under any equity awards until
  they satisfy the required stock ownership levels.
• The Company prohibits all associates, including the NEOs, and directors from engaging in short sale transactions or entering
  into any other hedging or derivative transaction related to Marriott stock or securities.
• PSUs and RSUs do not provide for accelerated distribution of shares upon retirement to ensure that executives have a
  continuing stake in the Company’s performance beyond the end of their employment, thereby strengthening their interest in the
  Company’s long-term success.

Clawbacks
In addition to the compensation clawback provisions of the Sarbanes-Oxley Act of 2002 that apply to the Chief Executive Officer
and Chief Financial Officer, the Company’s Stock Plan includes a separate clawback provision that applies to all equity awards
issued to all NEOs. Under the Stock Plan, the Company has the authority to limit or eliminate the ability of any executive to
exercise options and SARs or to receive a distribution of Company stock under PSUs, RSUs or other stock awards if the
executive terminates employment for serious misconduct, engages in criminal or tortious conduct that is injurious to the
Company or engages in competition with the Company.
The Committee has discretion to require reimbursement of any annual cash incentive payment awarded to a NEO if the amount
of such incentive payment is calculated based upon the achievement of certain financial results that are required to be restated,
provided that such discretion may only be exercised if the NEO has engaged in intentional misconduct that caused or partially
caused the need for the restatement. The amount of the reimbursement would be the difference in the amount determined
before and after the restatement.

The Compensation Policy Committee
In designing and determining 2018 NEO pay, the Committee considered recommendations from the Company’s Executive Vice
President and Global Chief Human Resources Officer, from Mr. Sorenson with regard to the compensation of the NEOs other
than himself (except for his recommendation to adjust his 2018 annual incentive compensation), and from the Company’s
Executive Chairman and Chairman of the Board, J.W. Marriott, Jr., as well as the advice and recommendations of the
Compensation Consultant. The Committee also obtained input and approval from the full Board, with the independent directors
meeting in executive session, regarding the compensation for Mr. Sorenson.
In its determinations, the Committee does not set rigid, categorical guidelines or formulae to determine the mix or levels of
compensation for the NEOs. Rather, it relies upon its collective judgment as applied to the challenges confronting the Company
as well as subjective factors such as leadership ability, individual performance, retention needs, and future potential as part of
the Company’s management development and succession planning process.
The Committee carefully reviews numerous factors when setting NEO total pay opportunity, allocating total pay opportunity
among base salary, annual incentives and annual stock awards, and determining final pay outcomes based on performance.
The Committee considers our executives’ job responsibilities, tenure and experience, and Company and individual performance
against internal targets as well as performance of competitors, competitive recruiting and retention pressures, internal pay equity
and succession and development plans.
The Committee also reviews total pay opportunity for executives at the 50th percentile of a broad-based and select group of
companies described in the discussion of Market Data below. In reviewing relevant market data, the Committee may utilize
discretion in determining the relevance of each compensation survey. For 2018, because the surveys do not reflect a
comparable position for Mr. Capuano, our Executive Vice President and Global Chief Development Officer, the Committee
considered multiple factors, including a review of publicly-disclosed compensation data for development and real estate
executives at other hotel companies, internal pay equity and Mr. Capuano’s historical contributions to the Company and his
experience in the Marriott development organization.
This review of total pay opportunity is designed as a market check to align the potential range of total direct compensation
outcomes with our long-term performance expectations and actual results. An understanding of external market data helps the
Company attract and retain key executive talent without serving as a rigid standard for benchmarking compensation. For
example, although performance comparisons are difficult given the differences in size, customer distribution, global geographic
exposure and price tier distribution, the Committee considers historical and annual business results relative to other individual
lodging companies to provide additional context for evaluating annual compensation actions. The Committee also regularly
reviews historical financial, business and total stockholder return results for lodging companies as well as a selected group of
comparator companies prior to determining final pay amounts.

Independent Compensation Consultant
The Committee selected and retained the Compensation Consultant to assist the Committee in establishing and implementing
executive and director compensation strategy. The Compensation Consultant reports to and is instructed in its duties by the
Committee and carries out its responsibilities in coordination with the Human Resources Department. Other than providing the
Company with executive compensation data from one survey, which was pre-approved by the Committee, the Compensation
Consultant performs no other services for the Company. Based on materials presented by management and the Compensation
Consultant and the factors set forth in the SEC’s Exchange Act Rule 10C-1, the Committee determined that the Compensation
Consultant is independent and that the Compensation Consultant’s engagement did not raise any conflicts of interest.

Market Data
The external market data utilized by the Company for 2018 includes several broad, revenue-based surveys as well as a custom
survey of companies specifically selected by the Committee. The Committee believes, based on the advice of the Compensation
Consultant, that the similarly-sized companies participating in the revenue-based surveys and the companies selected for the
custom survey represent the broad pool of executive talent for which the Company competes. To avoid over-emphasizing the
results of one or more surveys, the Company considers the results of the revenue-based surveys as well as those of the custom
survey, in terms of total pay and each component of pay. The Committee also considers compensation practices at select
lodging companies. This process for identifying relevant market data is used consistently for all senior executives of the
Company, including the NEOs.

Revenue-Based Survey
In general, the revenue-based surveys used as a market reference for NEO pay include companies with annual revenue similar
to that of the Company. For 2018, the surveys were the Executive & Senior Management Total Compensation Survey (provided
by Pearl Meyer), the Aon Hewitt TCM Total Compensation by Industry Executive and Senior Management Survey, the WTW
CDB Executive Compensation Database, the Equilar Top 25 Survey, and the Fred Cook Survey of Long-Term Incentives. The
same set of surveys was also referenced last year. The Committee did not consider the individual companies in the revenue-
based surveys when making compensation decisions.
Custom Survey
There are no other U.S. publicly-traded lodging companies similar to our size. Therefore, in consultation with the Compensation
Consultant, the Committee selected appropriate comparator group companies from a broad universe of companies that compete
with Marriott for executive talent, are of similar size in annual revenue or have a similar focus on marketing, e-commerce,
consumers and brand image even if they do not compete directly in the lodging business. The Committee reviews the
comparator group annually for potential changes (e.g., due to mergers and acquisition activity or changes in company size and
business mix) but does not generally anticipate making significant changes every year, in order to allow for consistency and
comparability of market data from year-to-year. The comparator group companies reviewed for 2018 are shown below along
with select financial and non-financial metrics the Committee considered and Marriott’s percentile ranking on each of these
metrics.

                                                 2018 Revenues(1)           Market Capitalization(1)          Enterprise Value(1)         Number of
                                              as of December 31, 2018       as of December 31, 2018        as of December 31, 2018        Employees
  Lodging Companies(2)
  Hilton Worldwide Holdings, Inc.                               $ 8,906                 $ 21,168                            $ 28,054          169,000
  Hyatt Hotels Corp                                                4,454                    7,208                               8,163          54,000
  Other Hotel, Restaurant & Leisure
   Companies
  Carnival Corp                                                   18,881                   41,962                              51,303          88,000
  Las Vegas Sands Corp                                            13,729                   40,339                              48,737          51,500
  McDonald’s Corp                                                 21,025                  136,214                             166,423         210,000
  MGM Resorts International                                       11,763                   12,797                              30,461          55,000
  Royal Caribbean Cruises Ltd                                      9,494                   20,440                              31,472          77,000
  Starbucks Corp                                                  24,720                   78,813                              82,958         291,000
  Other Retail & Consumer Branded
   Companies
  Best Buy Company, Inc.                                          42,879                   17,092                              16,500         125,000
  Macy’s Inc.                                                     25,739                    7,912                              11,501         130,000
  Nike, Inc.                                                      36,397                  118,464                             117,904          73,100
  The TJX Companies, Inc.                                         38,973                   60,301                              59,504         249,000
  The Walt Disney Company                                         59,434                  160,950                             182,361         201,000
  E-Commerce Companies
  eBay, Inc.                                                      10,746                   25,684                              26,355          14,000
  Expedia, Inc.                                                   11,223                   16,575                              19,398          24,500
  Booking Holdings                                                14,527                   78,597                              72,554          24,500
                             (3)
  Marriott International, Inc.                                    20,758                   36,813                              45,844         176,000
  Percentile Rank                                                   59th                     51st                                52nd             74th

Source: Bloomberg
(1)
    Amounts are reported in millions. Enterprise Value is the sum of market capitalization, debt and preferred stock, less cash and cash equivalents.
(2)
    Wyndham Worldwide Corp. was also selected as a comparator lodging company for 2018, but is not shown in the table because, on May 31, 2018,
    Wyndham Worldwide Corp. spun off its hotel business into a separate publicly traded company, Wyndham Hotels & Resorts, Inc. Wyndham
    Worldwide Corp. continued its vacation ownership and destination network business and was renamed Wyndham Destinations, Inc.
(3)
    Revenue amount for the Company is shown as reflected in our financial statements. However, system-wide revenues, including revenues of our
    franchisees, are much higher. Similarly, the number of Marriott employees shown does not include hotel personnel employed by our owners,
    franchisees, and management companies hired by our franchisees.

Tax Considerations
Internal Revenue Code Section 162(m) limits the Company’s federal income tax deduction for compensation in excess of one
million dollars paid annually to our Chief Executive Officer and certain other executive officers (“covered employees”). Following
adoption of the 2017 Tax Cuts and Jobs Act (the “Tax Cuts and Jobs Act”), the exceptions from Section 162(m)’s deduction limit
for performance-based compensation and for the chief financial officer’s compensation were eliminated effective for taxable
years beginning after December 31, 2017. Under the Tax Cuts and Jobs Act, compensation paid to covered employees in
excess of one million dollars annually will not be deductible except for certain arrangements in place as of November 2, 2017.
We cannot be certain that compensation arrangements that were in place before such date that were intended to qualify as
performance-based compensation under Section 162(m) will in fact be deductible. Because the Committee believes it is
important to manage our compensation programs to meet the objectives of our executive compensation philosophy and a variety
of other corporate objectives, such as attracting and retaining key management in a competitive marketplace, managing equity
dilution, workforce planning, and customer satisfaction, the Committee expects to maintain its performance-based and other
executive compensation programs without regard to whether such arrangements will be fully tax deductible.
Risk Considerations The Committee considered risk in determining 2018 NEO compensation and believes that the following aspects of NEO pay discourage unreasonable or excessive risk-taking by executives: • Base salary levels are commensurate with the executives’ responsibilities (and the external market) so that the executives are not motivated to take excessive risks to achieve an appropriate level of financial security. • Annual cash incentive plans include a diverse mix of corporate and individual performance metrics. • Annual cash incentive opportunities are capped so that no payout exceeds a specified percentage of salary, thereby moderating the impact of short-term incentives. • The Committee and the Board have discretion to decrease annual cash incentive payouts, for example, if they believe the operational or financial results giving rise to those payouts are unsustainable or if they believe the payout would unfairly reward the NEOs for events that are unrelated to their performance. • The mix of short- and long-term incentives is balanced so that at least 50% of total pay opportunity is in the form of long-term equity awards. • PSUs are subject to relative and absolute performance measures that are directly tied to long-term growth, cost control, and the strength of our brands over a three-year period, which balances the annual cash incentive focus on near-term results. • Annual stock awards are generally granted as a mix of PSUs, RSUs, and SARs that generally vest over or after at least three years, which together encourage the NEOs to focus on sustained stock price performance. • The Committee reviews and compares total compensation and each element of compensation to external market data to confirm that compensation is within an acceptable range relative to the external market, while also taking into consideration the Company’s relative performance. • The NEOs are subject to compensation clawback provisions (as discussed above). • Stock ownership requirements align the long-term interests of NEOs with the interests of stockholders. • All associates, including the NEOs, and directors are prohibited from engaging in hedging or derivative transactions related to Marriott stock or securities. • The NEOs are prohibited from holding Company stock in margin accounts or pledging such stock as collateral for loans.
Executive Compensation Tables and Discussion
Summary Compensation Table
The following Summary Compensation Table presents the compensation we paid in fiscal years 2016, 2017 and 2018 to our
Chief Executive Officer, our Chief Financial Officer and our other three most highly compensated executive officers.

                                                                                                                Change in
                                                                                                              Pension Value
                                                                                                                   and
                                                                                                               Nonqualified
                                                                                             Non-Equity          Deferred
                                                                   Stock         SAR       Incentive Plan     Compensation        All Other
Name and                     Fiscal      Salary       Bonus       Awards       Awards      Compensation         Earnings        Compensation          Total
Principal Position            Year       ($)(1)        ($)        ($)(2)(3)     ($)(2)         ($)(4)             ($)(5)            ($)(6)             ($)
Arne M. Sorenson              2018    1,300,000              0   6,222,315    2,207,473    2,925,000             23,309           255,895          12,933,992
President and Chief
Executive Officer             2017    1,300,000     1,000,000    5,310,583    1,838,959    3,628,950             45,635           187,490          13,311,617

                              2016    1,236,000              0   6,010,081    2,000,062    2,756,527             90,184           205,524          12,298,378
Anthony G. Capuano            2018      824,000              0   2,857,618      822,221    1,187,590              3,630            52,285          5,747,344
Executive Vice
President and Global          2017      800,000       500,000    2,528,334      735,220    1,133,040              7,358            45,247          5,749,199
Chief Development
Officer                       2016      750,000              0   4,158,052      666,709      994,725             15,128            53,701          6,638,315

Stephanie C. Linnartz         2018      824,000              0   2,104,657      980,480      917,730                528           111,483          4,938,878
Executive Vice
President and Global          2017      800,000       500,000    1,916,238      891,608    1,074,880                226            71,938          5,254,890
Chief Commercial
                              2016      700,000              0   3,144,810      666,709      650,510                   0           21,716          5,183,745
Officer
David J. Grissen              2018      824,000              0   2,005,349      912,502      951,376             26,620            97,186          4,817,033
Group President
                              2017      800,000       500,000    1,878,664      838,610    1,029,280             49,398            68,641          5,164,593

                              2016      750,000              0   3,404,381      833,337      814,425             97,037            69,768          5,968,948
Kathleen K. Oberg             2018      772,500              0   1,940,374      883,017      996,526              4,683           107,957          4,705,057
Executive Vice
President and Chief           2017      750,000       500,000    1,713,792      765,020    1,046,850              7,141            77,167          4,859,970
Financial Officer
                              2016      650,000              0   2,977,048      600,045      724,815             11,806            37,237          5,000,951

(1)
      This column reports all amounts earned as salary during the fiscal year, whether paid or deferred under the EDC.
(2)
      The value reported for Stock Awards and SAR Awards is the aggregate grant date fair value of the awards granted in the fiscal year as determined in
      accordance with accounting guidance for share-based payments, and therefore differs from the target award values approved by the Committee. The
      assumptions for making the valuation determinations are set forth in the footnotes captioned “Share-Based Compensation” to our financial
      statements in each of the Company’s Forms 10-K for fiscal years 2016 through 2018. For additional information on 2018 awards, see the Grants of
      Plan-Based Awards for Fiscal 2018 table, below.
(3)
      Approximately 66% of the value reported in this column for Mr. Sorenson in 2018, and 57% of the value reported for the other NEOs (disregarding
      Mr. Capuano’s separate RSU described in the CD&A) represents the value of PSUs at the grant date based upon target performance which is the
      most probable outcome with respect to performance. Assuming that the highest level of performance conditions will be achieved for all PSUs, the
      grant date fair values of the PSUs included in the 2018 Stock Awards column for Messrs. Sorenson and Capuano, Ms. Linnartz, Mr. Grissen and
      Ms. Oberg would be $6,172,650, $1,504,270, $1,793,622, $1,701,355 and $1,646,231, respectively.
(4)
      This column reports all amounts earned under the Company’s annual cash incentive program during the fiscal year, which were paid in February of
      the following fiscal year unless deferred under the EDC.
(5)
      The values reported equal the earnings credited to accounts in the EDC to the extent they were credited at a rate of interest exceeding 120% of the
      applicable federal long-term rate, as discussed below under “Nonqualified Deferred Compensation for Fiscal Year 2018.”
(6)
      All Other Compensation consists of Company contributions to the Company’s qualified 401(k) plan of $8,938 for each NEO other than Mr. Capuano,
      and $8,750 for Mr. Capuano; Company contributions to the EDC of $222,336, $18,540, $89,958, $88,248 and $86,976 for Messrs. Sorenson and
      Capuano, Ms. Linnartz, Mr. Grissen and Ms. Oberg, respectively; and perquisites and personal benefits, including spousal accompaniment while on
      business travel and complimentary rooms, food and beverages at Company-owned, operated or franchised hotels and the use of other hotel-related
      services such as golf and spa facilities while on personal travel. The values in this column do not include perquisites and personal benefits that were
      less than $10,000 in aggregate for any NEO for the fiscal year.
Grants of Plan-Based Awards for Fiscal 2018
The following table presents the plan-based awards granted to the NEOs in 2018.
All
Other
Stock Grant
Estimated Possible Estimated Possible Awards All Other Date
Payouts Under Payouts Under (Number SAR Fair
Non-Equity Incentive Equity Incentive Plan of Awards Value
Plan Awards(2) Awards(3) Shares (Number Exercise of
of Stock of or Base Stock/
Board or Securities Price of SAR
Grant Approval Threshold Target Maximum Threshold Target Maximum Units) Underlying SARs Awards
Name Date(1) Date(1) ($) ($) ($) (#) (#) (#) (#) SARs) (#) ($/sh) ($)(4)
Mr. Sorenson
Cash Incentive 438,750 1,950,000 3,900,000 — — — — — — —
PSU 2/20/18 2/9/18 — — — 16,125 32,250 48,375 — — — 4,115,100
RSU 2/20/18 2/9/18 — — — — — — 16,125 — — 2,107,215
SAR 2/20/18 2/9/18 — — — — — — — 47,391 139.54 2,207,473
Mr. Capuano
Cash Incentive 347,625 618,000 1,236,000 — — — — — — —
PSU 2/20/18 2/7/18 — — — 3,728 7,455 11,183 — — — 1,002,847
RSU 2/20/18 2/7/18 — — — — — — 5,592 — — 762,469
RSU 2/20/18 2/7/18 — — — — — — 8,120 — — 1,092,302
SAR 2/20/18 2/7/18 — — — — — — — 16,428 139.54 822,221
Ms. Linnartz
Cash Incentive 154,500 618,000 1,236,000 — — — — — — —
PSU 2/20/18 2/7/18 — — — 4,445 8,889 13,334 — — — 1,195,748
RSU 2/20/18 2/7/18 — — — — — — 6,666 — — 908,909
SAR 2/20/18 2/7/18 — — — — — — — 19,590 139.54 980,480
Mr. Grissen
Cash Incentive 131,325 618,000 1,236,000 — — — — — — —
PSU 2/20/18 2/7/18 — — — 4,445 8,889 13,334 — — — 1,134,236
RSU 2/20/18 2/7/18 — — — — — — 6,666 — — 871,113
SAR 2/20/18 2/7/18 — — — — — — — 19,590 139.54 912,502
Ms. Oberg
Cash Incentive 130,359 579,375 1,158,750 — — — — — — —
PSU 2/20/18 2/7/18 — — — 4,301 8,601 12,902 — — — 1,097,488
RSU 2/20/18 2/7/18 — — — — — — 6,450 — — 842,886
SAR 2/20/18 2/7/18 — — — — — — — 18,957 139.54 883,017
(1)
The Committee approved the annual stock awards for Mr. Capuano, Ms. Linnartz, Mr. Grissen and Ms. Oberg at its February 7, 2018 meeting, and
the Board approved the annual stock awards for Mr. Sorenson at its February 9, 2018 meeting. Pursuant to the Company’s equity compensation
grant procedures described in the CD&A, the grant date of these awards was February 20, 2018, the second trading day following the Company’s
annual earnings conference call for the 2017 fiscal year.
(2)
The amounts reported in these columns include potential payouts corresponding to achievement of the threshold, target and maximum performance
objectives under the Company’s annual cash incentive program.
(3)
These columns report the number of shares issuable under PSUs granted to the NEOs for the 2018-2020 performance period. Annual PSUs
reported in these columns are conditioned on the achievement over a three-year performance period of Global RevPAR Index, Global Gross Room
Openings and Global Net Administrative Expense goals, with threshold representing 50% of the target number of shares and maximum representing
150% of target. For these PSUs, one-third of the target number of shares is subject to each performance objective, with otherwise identical terms.
(4)
The value reported for Stock Awards and SAR Awards is the aggregate grant date fair value of the awards granted in 2018 as determined in
accordance with accounting standards for share-based payments, although the Company recognizes the value of the awards for financial reporting
purposes over the service period of the awards. The assumptions for making the valuation determinations are set forth in the footnotes captioned
“Share-Based Compensation” to our financial statements in the Company’s Form 10-K for the fiscal year 2018. For PSUs, the value reported is
based on the probable outcome with respect to performance.
The Grants of Plan-Based Awards table reports the dollar value of cash-based annual incentive program awards (at their
threshold, target and maximum achievement levels) and the number and grant date fair value of PSUs, RSUs and SARs granted
under the Stock Plan to each NEO during the 2018 fiscal year. With regard to cash incentives, this table reports the range of
potential amounts that could have been earned by the executive under the annual cash incentive program for 2018, whereas the
Non-Equity Incentive Plan Compensation column in the Summary Compensation Table reports the actual value earned by the
executive for 2018.Annual Cash Incentives. The Compensation Policy Committee carefully evaluates rigorous performance factors for each NEO
under the annual cash incentive program. The performance factors used for 2018 are described below.
• Adjusted EPS and Operating Profit: The Company places a heavy emphasis on adjusted EPS as a performance measure
because adjusted EPS is an important indicator of Company profitability and aligns the interests of management with those of
our stockholders. For purposes of the annual cash incentive program, the Company modifies EPS as reported under U.S.
GAAP during the target-setting process, which is an extensive annual budgeting process. Each hotel and individual corporate
unit develops and submits a budget, which the Company then consolidates and adjusts based on external market factors such
as global and domestic economic forecasts and lodging industry outlook as well as internal factors such as current revenue
from group bookings, expected unit growth for the year and expected capital needs. The adjusted EPS target is determined
based on the anticipated approximate impact on EPS of the Company’s planned share buy-back program for the year and
excluding items that are not expected to have a direct impact on the business going forward, such as merger and related costs,
changes in accounting standards, tax adjustments and gains/losses on sale.
The Board reviewed and approved the budget in February 2018. In setting the adjusted EPS target for 2018 (“Adjusted EPS”),
EPS was adjusted to exclude the impact of asset sales, impact of differences in cost reimbursement revenues and reimbursed
expenses, merger and related costs, windfall tax adjustments, and updates on guidance on the application of the Tax Cuts and
Jobs Act. In addition, consistent with how we present our adjusted results in our earnings announcements, Adjusted EPS
excludes cost reimbursement revenue and reimbursed expenses as a result of our adoption of new revenue recognition
accounting rules in 2018. These amounts relate to property-level and centralized programs and services that we operate for the
benefit of our hotel owners and would offset one another each quarter under prior accounting standards. Because these
activities are not designed to generate profits or losses, but cause period-to-period variability under the new accounting
standards adopted in 2018, we exclude the net impact when evaluating period-over-period changes in our operating results.
Considering these factors, the Committee set the Adjusted EPS target for 2018 at a level that the Committee believed was
achievable but not certain to be met, which was $5.03. This target was approximately 22% higher than the Company’s full-year
Adjusted EPS for 2017 of $4.12. Adjusted EPS for 2018 was $5.46, which resulted in a maximum achievement level and payout
relative to target. For 2018, the Committee had established the following payout scale for Adjusted EPS performance:
Adjusted EPS
Achievement vs. Target Incentive Award Payout as % of Target*
Below 87% No Payment 0%
87% Threshold Payment 25%
100% Target Payment 100%
107% and Above Maximum Payment 200%
* If the achievement falls between two of the stated performance levels, the incentive payment is interpolated between the corresponding incentive
levels.
For Mr. Grissen, in addition to Adjusted EPS, his financial performance objectives included operating profit from the Americas
division, his primary area of responsibility. The Americas Adjusted Operating Profit target was $2,012 million and the results
were $2,124 million, corresponding with a maximum achievement level and payout.
• Room Growth: Assessment of room growth is based on a net present value estimate/calculation utilized by our management
and Board in evaluating the potential performance of completed development projects. The room growth target was reviewed
and approved by the Board in February 2018 at a level significantly above 2017 targets. This target level is based on an
extensive annual budgeting process whereby a budget was developed for each geographic region that was identified for
potential growth and was consolidated and finalized by the Company’s Lodging Development Department after consideration
of external market factors such as global and domestic economic forecasts and lodging industry outlook. For Mr. Grissen, this
same process is followed to establish the room growth target for the Americas division.
For each NEO whose cash incentive plan includes the room growth performance measure, except Mr. Capuano,
achievement of less than the target results in no component payout, and for Mr. Capuano achievement of 59% of the target
results in a threshold component payout. Maximum payout is achieved at achievement of 118% of the room growth target for
each NEO other than Mr. Capuano, for whom maximum payout is achievement of 176% of target. The Committee established
a wider performance and payout range for Mr. Capuano to more accurately measure and incentivize him for achieving growth
goals. For 2018, the net present value of rooms approved for development significantly exceeded each NEO’s target
performance level.
• Global Sales: Assessment of sales is measured by percentage point difference between the actual growth rate over the prior
year versus the budgeted growth percentage for global constant dollar RevPAR. For 2018, the Company’s results exceeded
the target performance level, resulting in an above target but below maximum payout.
• Associate Engagement: Assessment of associate engagement is measured by the results of the Company’s annual associate
engagement survey (conducted by a third party) as compared against external benchmark results provided by the third-party
company. For 2018, the Company exceeded the “Best Employer” benchmark, which resulted in a maximum achievement levelYou can also read