Creating an Effective Customer Value Proposition Process - Vinod Kumar Kundu - Core
←
→
Page content transcription
If your browser does not render page correctly, please read the page content below
Vinod Kumar Kundu

Creating an Effective Customer Value Proposition
Process

Helsinki Metropolia University of Applied Science

Master’s Degree

Information Technology

Master’s Thesis

30th May 2020
Abstract

Author(s)                                       Vinod Kumar Kundu
Title                                           Creating an Effective Customer         Value
                                                Proposition Process
Number of Pages                                 49 Pages
Date                                            30thMay 2020
Degree                                          Master of Engineering (M Eng)

Degree programme                                Information Technology

Instructor                                      Ville Jaaskelainen

The objective of the present study was to establish a Customer Value Proposition building
process for the company, Micromax Informatics Private Limited. Micromax is an Indian
company that operates in electronic gadgets and mobile phones sales and service industry and
market territories are India and some Asian countries.

Micromax faced with the challenges of low market share and decline stage of customer base.
Accordingly, this study is intended in aiding the case company to meet the challenges
through the development of a superior value proposition by addressing the most important
needs of the specified customers.

This study followed the Action Research methodology as a research approach as it utilizes an
Iterative approach in a systematic way to find the solutions and improvements for the
problems. This study also utilizes the data from various sources such as top management of
company and employees working in different department with questionnaire sent to them and
some telephonic interview with that questionnaire and document analysis. Accordingly, data
collection from different sources not only enabled to have sufficient stakeholder perspectives
but also aided in the triangulation of the study.

The conceptual framework of this study is constructed based on the existing knowledge of the
Building blocks of a customer value proposition. Accordingly, the conceptual framework
describes the importance of the CVP type in shaping a business strategy. The conceptual
framework then establishes the significance of core offering based on core competencies in
building a value proposition that delivers superior value to the customers. Furthermore, con-
ceptual framework also highlights the prominence of positioning of a differentiated
valueproposition for a targeted customer segment in order to gain a competitive edge for the
company in the market.

The outcome of this study is a proposal of a well-defined and focused Customer Value
Propositioning process, specifying value offerings of the case company for meeting the most
important customer requirements. Customer Value Proposition (CVP) proposal also includes
the core competences of the case company for improving the value offerings, competitive
positioning against the market leader offerings and the recommendations for the future
business development.
Keywords                 Customer Value Proposition, Needs of customers, Marketing, Sales,
                         Additional Values
Table of Contents Abstract Table of Contents List of Tables List of Figures List of Abbreviations 1. INTRODUCTION 1 1.1 Business Context 1 1.2 Market Evolution 2 1.3 Consumerization 2 1.4 Analysis over Targeted Market 3 1.5 Approaches to Gain Customer Interest 4 1.6 Business problem and objective of the thesis 4 1.7 Objectives 5 2. METHOD AND MATERIAL 6 2.1 Questionnaire 6 3.BEST PRACTICE OF BILDING A CUSTOMER VALUE PROPOSITION 9 3.1 Definition of Value 9 3.2 Building a Customer Value Proposition 10 3.3 Step 1- Definition of Customer Value Proposition 10 3.4 Step-2 Value Maps 11 3.5 Step 3- Value Delivery 11 3.6 Step-4 Three Kinds of Value Propositions 12 3.7 Step-5 The Framework for Identifying Customer Value Propositions 12 3.8 Step-6 CVP Canvas 13 3.9 Step-7 Monetary Value 14
4. ANALYSIS OF MICROMAX COMPANY CVP AND CURRENT CUSTOMER
POTENTIAL
Error! Bookmark not defined.

  4.1 Micromax Company Background                          16

  4.2 Description of Current Customer Value Proposition    16

  4.3 Asset Data Management                                17

  4.4 The responses and analyses of survey questionnaire   17

  4.5 Financial Planning and Analysis                      33

  4.6 Operational awareness                                33

  4.7 Strengths and Weaknesses of the Current CVP          33

5. BUILDING THE CVP FOR MICROMAX SELCTED CUSTOMERS         35

  5.1 Initial CVP                                          35

  5.2 Customer Need Analysis                               36

  5.3 Definition of Information Products                   38

  5.4 Summary of the Initial CVP                           38

6. GETTING FEEDBACK ON PROPOSED CVP                        39

  6.1 Overview of the Feedback Process                     39

  6.2 Conclusions of the Feedback Process                  39

  6.3 Summary                                              40

7. FINDINGS OF THE STUDY                                   41

  7.1 Solution of the problem                              43

  7.2 Conclusion                                           44

References                                                 46
List of Tables

Table 2.1: Questionnaire For Micromax Employees
Table 4.1: Analysis of Micromax Company CVP and Current Customer Potential
Table 4.2: Gender
Table 4.3: From how long you have been working with the company?
Table 4.4: In which department you have been working in the company?
Table 4.5: Do you think that company gives preferences to customer satisfaction over
profitability?
Table 4.6: How often do you get complaints from customers about the products/services
of the company?
Table 4.7:What are the most complaints from customers related to?
Table 4.8:Do you think that company follows an attractive price range for the products?
Table 4.19: Which is the target age group of the company?
Table4.10: As per you what is the best approach of the company to satisfy the
customers?
Table 4.11: How many customers are happy and satisfied with the brand?
Table 4.12: Do you think that customers find the brand reliable or cost worthy?
Table 4.13: As per you how satisfied are the customers with the performance relevancy
to the cost of the handsets?
Table 4.14: According to you how much time will it take to resolve the
complaints/queries of the customers?
Table 4.15: Do you think that some of the handsets need to be changed or modify?
Table 4.16: As per you which of the following is the biggest competitor in the domestic
and international market?
Table 4.17: Strengths and Weaknesses of the Current CVP
Table 5.1: Customer Need Analysis
Table 6.1: Overview of the Feedback Process
List of Figures

Figure 3.1: Best practices of Building a Customer Value Proposition
Figure 3.2: Building a Customer Value Proposition
Figure 3.3: Value Maps
Figure 3.4: The Framework for Identifying Customer Value Propositions
Figure 3.5: CVP Canvas
Figure 4.1: Gender
Figure 4.2: From how long you have been working with the company?
Figure 4.2: In which department you have been working in the company?
Figure 4.4: Do you think that company gives preferences to customer
satisfaction over profitability?
Figure4.5: How often do you get complaints from customers about the
products/services of the company?
Figure 4.6: What are the most complaints from customers related to?
Figure 4.7: Do you think that company follows an attractive price range
for the products?
Figure 4.8: Which is the target age group of the company?
Figure 4.9: As per you what is the best approach of the company to satisfy
the customers?
Figure 4.10: How many customers are happy and satisfied with the brand?
Figure 4.11: Do you think that customers find the brand reliable or cost
worthy?
Figure 4.12: As per you how satisfied are the customers with the
performance relevancy to the cost of the handsets?
Figure4.13: According to you how much time will it take to resolve the
complaints/queries of the customers?
Figure 4.14: Do you think that some of the handsets need to be changed or
modify?
Figure 4.15: As per you which of the following is the biggest competitor in
the domestic and international market?
Figure 5.1: Initial CVP
  Figure 5.2: Customer Need Analysis

List of Abbreviations

CVP: Customer Value Proposition
1

1. INTRODUCTION

The customer value proposition is the approach that helps to critically analyze the
relationship among customers as well as sales authorities. This could be determined as the
major necessity to attain the approaches which provide the objectives of attaining an efficient
customer base. In brief for understanding purpose customer value proposition indicates the
values and services which will be attained by a customer after using the services which is
usually provided by the sales department of the particular organization. Customer value
proposition is one of the important approaches to develop a strong and long term relationship
between the customers and organisation which not only ultimately promotes brand loyalty
among the customers but also tries to secure upmost satisfaction amongst them. Brand loyalty
leads to word of mouth promotion strategy. In the 21 st century, globalisation becomes
universal phenomenon where no country survives in isolation. Globalisations have both pros-
cons but truth is that it makes whole world as one single market.

Micromax company, which is India, based organisations involved in electronic gadgets
manufacturing and service providing is taken for the purpose of conducting the study. The
reason behind opting for this company is that it is lost its customer base and it needs
turnaround in the present scenario to survive in the market.

1.1 Business Context

Micromax, is an India based smart phone manufacturer and consumer electronics company
which headquartered located in Gurugram, Haryana, Originally it was established as an IT
software company operating in the embedded devices domain and later entered into
the mobile handset business. During 2010, Micromax was one of the largest domestic
companies making handsets in the low-cost feature phone segment in India. During 3rd
quarter of 2014, Micromax was the tenth largest Smart phone vendor in the world. During
that time Company was facing stiff competition from Chinese companies that are penetrating
the Indian market. It began selling mobile phones in year 2008, focussed on democratising
technology for masses to compete with international players.

The company also introduced handsets with innovative features. For instance, Micromax's
co-founder Rahul Sharma once saw a public call office being powered by a truck battery
2

because of frequent power cuts in its locality which prompted him to launch a feature mobile
phone with a long battery life. And after that X1i phone was also introduced as Micromax's
first telephone along with a month-long battery back-up.

More surprisingly in the year 2014, Micromax sales in India exceeded those of Samsung. It
became the mobile telephone manufacturer to ship the most telephones in one quarter in
India. On 24 January 2014, Micromax became the first Indian mobile company to sell their
products in Russia market.

1.2 Market Evolution

According to industry report in year 2013, around 60 mobile handsets companies were used
to marketing in India, and which made difficult for all companies to grow at a healthy rate. In
addition to tough competition, these companies were not only making profitable business, but
also expanding the business base by targeting new market. Companies like Micromax were
leaving no stone unturned in the bid to increase their presence across the world. If the
analysts were to be believed, the major challenge for these local brands had begun during
2011. According to analysts during that time companies’ performances would be tested in the
coming years, when Indian consumers have to choose between Indian vs global phones.

Products manufactured by Micromax include Mobile phones, LED TVs, LED lights and
Tablets. Government in hope of increasing production provided land to Micromax for setting
up the new centre, which has a capacity to produce 1 million devices a month, which include
mobile phones, LED TVs, LED lights and Tablets and it presently employs 700 people. The
firm's first facility in Uttarakhand has a capacity to produce 16 million devices.

1.3 Consumerization

Consumerization is defined as the specific impact that consumer-originated technologies can
have on enterprises. It indicates how enterprises will be affected by, and can take advantage
of, new technologies and models that originate and develop in the consumer space. Moreover,
it is not a strategy or something to be “adopted.” Consumerization can be embraced and it
must be dealt with care which cannot be stopped.
3

Micromax company aims to manufacture 100% of its products within India at its four
factories in Andhra Pradesh, Telangana, Madhya Pradesh and Rajasthan. In the present time,
Micromax makes 60% of its products from its local factories. Micromax plans to invest 357
million Euro in the new factories also which will have a capacity to make 5 million phones a
month in the nearby future. It is desired that, in-house manufacturing will boost the
company’s profits as the government has allowed a 10% duty exemption on smart phones
made and sold in India, which can add to Micromax profit margins.

1.4 Analysis over Targeted Market

Micromax provides a large range of phones with different features thus serving a variety of
customers. The major differentiating factor of Micromax is that it has managed to distinguish
different unique needs of customers and offer a product that solves them like providing rural
customers with long battery life along with providing urban customers with the best variety
minimum cost with excellent quality of smart phones.
The company use a unique marketing strategy that targets the Indian market position.
One strategy that it used very successfully by the company was that it targeted the rural
market when it started out. This was a unique strategy considering the fact that most
companies start with the urban market before moving to the rural markets.

Micromax has already achieved traction in terms of penetrating the Indian mobile market
which currently stands at 22% and now the company is engaged in a marketing strategy that
creates awareness for its products.

Pricing strategy is always at the core of Micromax marketing strategy and is aimed at
providing quality phones at an affordable price. So the company has adopted a penetration
pricing strategy in both rural and urban market. The company has also prepared long term
plans and wants to expand its growth to other Asian countries.

Thus, long battery life and minimum cost with high frequency quality opted by a Micromax
to scattered its business in both rural as well as urban area
4

1.5 Approaches to Gain Customer Interest

Micromax is trying to stay relevant by entering into tie up with other brands for marketing
and distribution of the products by using their manufacturing capacities and capabilities to
produce phones for some other brands or markets at the global level. Micromax has also
diversified into the consumer durables segment and few of its promoters are venturing into
electric vehicles market.

Micromax always focuses on price ranges between (60-120 Euro) mobile phone markets in
India. This price range has very competitive brands which are very difficult to beat easily.
The company never tried their hands in the premium phone market which might be a
profitable segment.

Thus, company initiated with tie up with other brands, diversified its business, engaged in
new ventures and enhanced manufacturing capacity in tune of covers more market as a
business strategy.

1.6 Business problem and objective of the thesis

Declining Customer Value proposition

Micromax company falls under the category of leading telecommunication organization but
at this very movement, the company is facing challenges such as how to maintains present
customer base as well as how to enter into new market areas both at domestic and also in
global level too. For the time being, business is facing the decline phase, when there is no
reliable and efficient customers base attached with them in a manner desired by the company
and there consumers are shifting to another brands that indicates that Micromax customer
value proposition is on a declining stage.

Challenges of Worthy Service Delivery

On the other hand, marketing values and approaches which were delivered by the
organization also don’t seem to have as good impact as they did earlier. These challenges has
a negative impact on the status and marketplace values that had been attained by the
organization and also required to initiate certain changes in customer value proposition to get
better results in the future (Naik, 2019) The entire study focused on introducing certain
5
changes and modifications in Customer Value Proposition process which will be helpful to
resolve the challenge in an efficient manner by the company to make resilience in the global
as well as in domestic markets.
Aim: To design a customer value proposition and marketing recommendations for direct
sales customers by the company. The case study is about Micromax Company.
1.7 Objectives
The objectives of the research include some of the concepts and aspects which are necessary
to be discussed in the entire process of the study. These are the actually approaches that
provide better engagement in terms of the values and processes which are necessary to be
analysed for the purpose of attaining in-depth information related to the processing and
execution of the entire study (Yrjölä, et. Al., 2019).The objectives of this particular study are
mentioned below:
To analyse the concept and necessity of the customer value proposition
To determine the concept of marketing and recommendations for its effectiveness.
To evaluate the customer’s value proposition and marketing recommendations for
direct sales customers.
These are some of the objectives and aspects which researcher wants to cover in this study for
the purpose to solve the problem faced by the company as well as to attain domain
knowledge related to the subject.6 2. METHOD AND MATERIAL For this particular research, a quantitative research methodology was used as the research topic is very wide and it required direct first hand information in order to complete the research (Vorbach, et. Al., 2019).In quantitative research methodology, primary data has been collected from some specific groups of the people in the form of their opinions and specific answers as well. The data has been collected by using the primary data selection methods and a set of questionnaire was prepared. The information or data has been collected from the employee of the Micromax company in India so that it would be easy to identify the role of value chain propositions and the impact of them to marketing strategy. Micromax company have more the 700 employees in India and they are currently using the product and service offered by the company as a customer so it was easy to collect first hand information from them to analyze the current customer value proposition. Since the employees could easily pass their judgment about the services or products which has been offered by the company as they got the complaints of product and service as well, it was important to collect the data first hand from the employees of the company so that the company can easily identify the challenges of their services. In total there were a total of 100 employees which provided their responses to a set of 15 questions about the value chain analysis of the company’s services and products. The questionnaires were sent to selected employees in the e-mails and their responses were analysed and discussed in later section 4. Thiscoverage considered to be enough to fulfil the requirements of this research topic (Tian, et. Al., 2019). 2.1 Questionnaire This section includes the questionnaire which will use to collects data from the employee of Micromax company. This will give data to analyse the current state analysis of company and gives the current customer value proposition model uses by company.
7
Table 2.1 Questionnaire for employees of Micromax.
1. What is your gender?
Male
Female
Others
2. From how long you have been working with the company?
Less than one year
More than one year
Less than five year
3. In which department you have been working in the company?
Marketing
Administration
Manufacturing
4. Do you think that company gives preferences to customer satisfaction over
profitability?
Yes
No
Not sure
5. How often do you get complaints from customers about the products/services of
the company?
Every day
Once in three days
Once in every week
6. What are the most complaints from customers related to?
Quality of the products
uses about the technological advancements
late responses for queries
7. Do you think that company follows an attractive price range for the products?
Yes
No
Not sure
8. Which is the target age group of the company?
16 to 24 years
25 to 34 years
35 to 45 years
9. As per you what is the best approach of the company to satisfy the customers?
Improvised customer services
Regular deals and discounts
Advance technology in handsets8
10. According to you how many customers are happy and satisfied with the brand?
Less than 50 percent
More than 50 percent
Not sure
11. Do you think that customers find the brand reliable or cost worthy?
Yes
No
Sure
12. As per you how satisfied are the customers with the performance relevancy to
the cost of the handsets?
Very satisfied
Satisfied
Not satisfied
13. According to you how much time will it take to resolve the complaints/queries of
the customers?
Less than 24 hours
Less than 48 hours
Less than a week
14. Do you think that some of the handsets need to be changed or modify?
Handsets old than six months
Handsets older than one year
Handsets older than five years
15. As per you which of the following is the biggest competitor in the domestic and
international market?
Blackberry
Apple
Samsung9
3. BEST PRACTICE OF BILDING A CUSTOMER VALUE
PROPOSITION
In this section, discussion has been planned about the process which can be used to analyse
the value proposition in a concise manner and this is the approach which provides access over
those values that helps to develop the changes and interpretation among customers and their
demands need to be fulfilled and ultimately help to access the values which are necessary to
be processed and analysed by the organisation (Dingus and Milovic, 2019).This sections will
be further classified on the following basis as figure 3.1
Definition of Value
Building a Customer Value Proposition
Focus Customer Group
Customer Need Analysis
Defining Informaion Products
Figure 3.1: Best practices of Building a Customer Value Proposition
3.1 Definition of Value
Value in marketing terms known as customer-perceived value and in reality it is the
difference between a prospective customer's evaluations of the benefits derived from the
product and costs of one product when compared with some others products. Value can also
be expressed in a straightforward relationship between perceived benefits and perceived
costs: Value = Benefits / Cost.There are four types of value namely: functional
value, monetary value, social value, and psychological value. The sources of value
acquisition are not equally important to some consumers. How much important a value is10
depends on the consumer and the purchase.For any organization to deliver value, it has to
improve its value and cost ratio. Whenever any organization delivers high value at high price,
the perceived value or the customers might be low. When it delivers high value at low price,
the perceived value might be high. The key of success to deliver high perceived value is
attaching value to each of the individuals or organizations by making them believe that what
business are offering is beyond expectation and ultimately helping customers to solve a
problem, offering a solution, giving results, and providing them delight.
3.2 Building a Customer Value Proposition
To create and build a customer value proposition following process will be followed-
Defination of Customer Value Proposition
Value Maps
Value Delivery
Three Kinds of Value Proposition
The Framwork for Identifying Customer Value Proposition
CVP Canvas
Monetory Value
Figure 3.2: Building a Customer Value Proposition
3.3 Step 1- Definition of Customer Value Proposition
Customer value proposition is defined as a business’s way of generating value in their
product or service when targeting actual and potential customers and it is sometimes11
calculated by considering the total sum of benefits that organisation put forward to their
consumers.To provide customers better services and values it is very important to analyse the
targeted marketplace in a significant manner (Clauss, et. al., 2019).
3.4 Step-2 Value Maps
Value map usually gives information about the process to be followed by the organisation to
deliver the services to large customers simultaneously. It indicates the process used by the
organization to maintain the productivity level and presentation towards the customers (Olson
and Cohen, 2019). Value maps are made up of the procedure focusing on three important
aspects namely- increasing quality along with increasing cost, decreasing quality along with
declining cost or increasing the quality without increasing cost according to the organisation
strategy.
High Price
Apple Sony
Samsung HTC
High Low
Quality Quality
Micromax Motorola
Karbonn
Low Price
Figure 3.3: Value Maps
3.5 Step 3- Value Delivery
Value delivery is defined as the way in which organisation design their product specification
such that it generates maximum value to the customer using it. The value delivered to
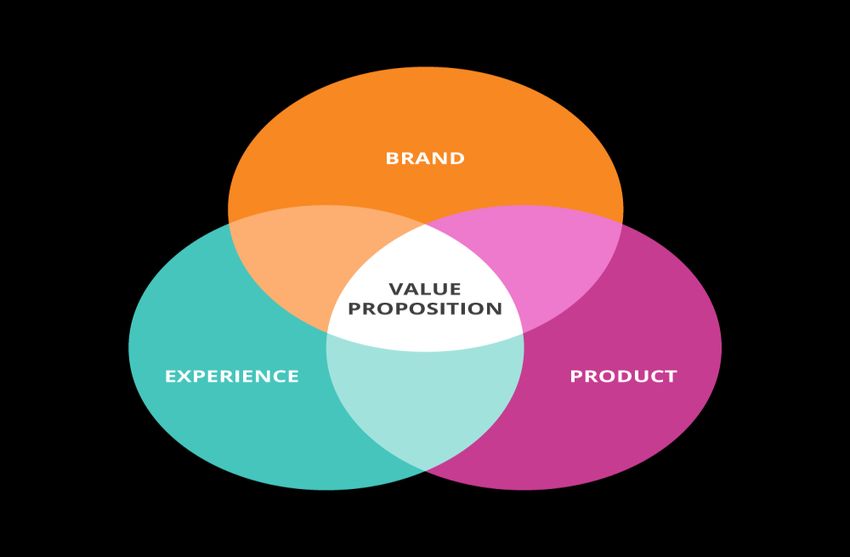
customers can be in the either any of the following form- products, benefits, attributes etc.12 Anything which creates value for organisation customer must be included in value delivery process. Micromax company was the second number amongst five top mobiles brands in India at 2014 by shipment, 3.6 Step-4 Three Kinds of Value Propositions Having strong value propositions is most necessary for successful selling therefore many organisations spend lot of time to think of the perfect value propositions. There are three approaches to analyse the value proposition. These are the key aspects that help organisations to analyse the values and demands which are necessary to be processed and fulfilled to ensure the proper customer management (Vladimirova, 2019).These are the following- Technical value: focus on technical values derived from the product or services Business value: In this aspect business realizes need to improve the performance. Personal value: This is the approach tomake awareness about value-driven aspects. These are the key parameters that must be ensured to maintain the services on effectual aspects. This can be defined as the strategy to manage changes and processes effectually in the organisation. This also helpful in managing the customer’s preferences and demands during the introduction stage of the organisation. 3.7 Step-5 The Framework for Identifying Customer Value Propositions The framework helps in determining target customers and also support in analysing the performance measures necessary to be accessed and fulfilled for the broader control and management of the whole process of customer value propositions. The framework for Identifying Customer Value Propositions provides information about several aspects that will benefit organization in the future aspects (Antikainen, et. al., 2019) and ultimately helps in determining significant tasks to attain the progress and development in the efficient and effective manner by the organisation.
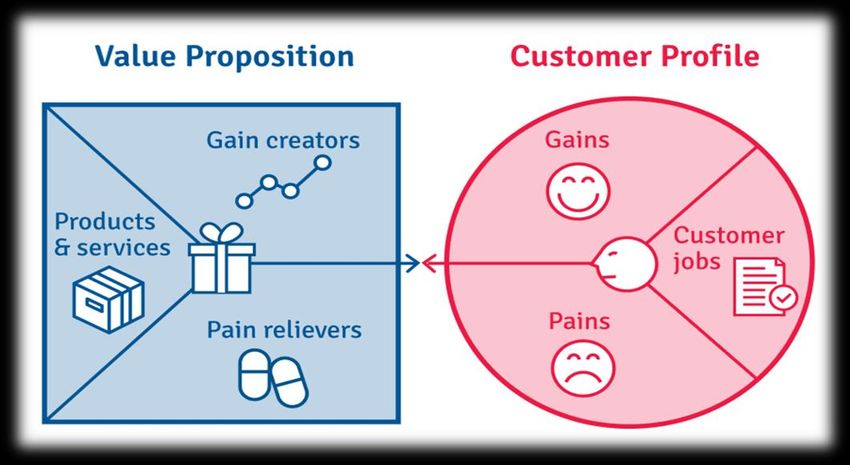
13

Figure 3.4: The Framework for Identifying Customer Value Propositions (Smith and Colgate
2007)

3.8 Step-6 CVP Canvas

The customer value proposition canvas helps in understanding values and needs which create
demand by the customers. It includes various aspects which help in continuously maintaining
the process of the customer's demand and also provides the idea about aspects that are
necessary to be fulfilled in terms of managing the performance by the organisations in the
short as well as in the long run (Van Le and Suh, 2019).
14

Figure 3.5: CVP Canvas (Osterwalder et al 2014: 61)

3.9 Step-7 Monetary Value

Monetary value is defined as the value in terms of currency that a person, business, or any
market put on a resource, product or service. In fact, almost all goods and services in today’s
modern economy are priced based on monetary value.

The monetary benefit of Micromax company seems to be low in the current time frame. It
becomes necessary for the organization to attain an idea about the values which should be
encountered to resolve the challenges (Straker and Nusem, 2019). On the other side, it is also
necessary to maintain the process of managing the services effectually.
15
4. ANALYSIS OF MICROMAX COMPANY CVP AND CURRENT
CUSTOMER POTENTIAL
This section describes the case company’s current Customer Value Proposition, how it
hasbeenformedandanalysesitsstrengthsandweaknesses.Thesectioncontainsthebackgroundofthe
casecompany’suseofCustomerValue Proposition is described also contains the current
Customer Value Proposition is described and finally in the last part the strengths and
weaknesses of the current CVP are analysed.
The data for the current state analysis was collected from Micromax Company’s employees.
The interviewees were selected based on their knowledge, experience and position in
thecompany.Itwasidentifiedthatitisimportanttohavetheperspectiveoftopmanagement for the
study to strengthen its validity.
Qualitative components
Value Proposition
The value of Micromax is offering feature rich smart phones at very affordable price
Having high commission for retailers and distributors (5%)
Strategic resources
Market knowledge
Sustainable partnership with Chinese manufacturers
Dynamic process
Quick launch of mobile models
Table 4.1: Analysis of the Micromax Company’s CVP’s and Current Customer Potential16 Table 4.1 shows that Micromax brand which enjoyed a strong 16.22 percent market share in 2015, witnessed ahuge steep decline. The company market share for the year 2016 were remarked as 10.8 percent for the feature phone and 8.80 per cent for smart phones, In the year 2017, the company market share for feature phones and smart phones were experienced 8.70 percent and 4.20 percent respectively. In the year 2018, the company market share for smart phones was 4.30 percent and 2.80 per cent in feature phones. The primarily reason for this downfall noted due to emergence of the Chinese players like Xiaomi, Oppo, Vivo, Gionee who offered great features at an affordable price point and also adopted the new revolution with both hands. 4.1 Micromax Company Background Micromax was incorporated as Micromax Informatics Ltd. During the year 2000 by Mohit Sharma, Dewas and Rohit Patel, Nagora and finally began selling mobile phones in the year 2008, by focusing on democratising technology for masses to compete with domestic and international players. There are few challenges which are associated with the services delivered by the company but huge lyinefficient management of the resources makes a negative impact on sales and processing. That should be determined as the major necessity to deliver the services and ensure to attain the idea about changes and processes necessary to be introduced in terms of building the services and values by the organisation (Polizzotto and Molella, 2019). 4.2 Description of Current Customer Value Proposition In the study when employees shared their view and experience with the organization. It was further determined that employees were the key asset of an organization who provided goods and deliver services to the customers. Therefore one of the important objectives of the study includes their view point regarding the actual and potential performance of the company. Micromax, during its earlier days came out with some innovative features including a month long battery life, which was the most popular phone brand with its sales in India exceeding those of Samsung products. But by the end of 2015, the brand, which sold phones under the sub 10,000 category, started to lose its strong position as consumers across the country started opting for the brand like Xiaomi, Vivo and Oppo, among others. By 2016,major incident took
17
place when these Chinese brands had taken the market by storm with more impressive
camera features along with 4G on their devices, while Micromax was still going providing
3G phone in the market. But in a major incident during 2018, Micromax got a 1,500 million
Euro deal from the Chattisgarh government to distribute 5 million smart phones in their state.
4.3 Asset Data Management
Asset and data management is important aspect which focuses on discovery, ownership,
value, acceptable use, protection, and disposal of information-related assets. Assets are
tangible like hardware and intangible like software and data.
The data management is determined as the key approach for management of the business
production. Use of right tool and data management gives surety of attaining reliable and up-
to-date process supervision. This is important aspect which helps in sharing the data
withinthe organization along with information related to access of stakeholder engagement in
the management of the organisation. (Seno, et. al., 2019)
4.4 The responses and analyses of survey questionnaire.
This section shows the responses and analysis of survey questionnaire (Method and material
section 2 .1) and the interpretation of the answer to this questionnaire. The below analysis is
based on the data provided by the employee of Micromax company.
Table 4.2: Gender.
1 What is your gender? Frequency
Male 50
Female 45
Others 518
Frequency
Frequency
Ø Male Ø Female Ø Others
Figure 4.1: Gender
Interpretation – Figure 4.1shows that among the employees of the company, there are lion
share i.e. 50 per cent emerged as of the male employees in comparison to the female
employees whose share is found 45 per cent. Now, It ultimately indicates that there are more
number of male employees in the company as compare to the female employees.
Table 4.3: From how long you have been working with the company?
2. From how long you have been Frequency
working with the company?
Less than one year 30
More than one year 20
Less than five year 50
Table 4.3 shows the response from the Micromax employees from how long they have been
working for company.19
Frequency
50
40
30
Frequency
20
10
0
Ø Less than one Ø More than Ø Less than five
year one year year
Figure 4.2: From how long you have been working with the company?
Interpretation – Above figure 4.2 illustrate that the massive number includes that category
of employees who were working in the company for the period of less than 5 years whose
share is uncovered to 50 per cent whereas 30 per cent of employees under study were
working for the period less than one year and again 20 per cent working in the company for
the period of more than one year only.20
Table: 4.4 In which department you have been working in the company?
3. In which department you have Frequency
been working in the company?
Marketing 60
Administration 10
Manufacturing 30
Table 4.4 shows the employee’s department information.
Frequency
60
50
40
30 Frequency
20
10
0
Ø Marketing Ø Ø
Administration Manufacturing
Figure 4.3: In which department you have been working in the company?
Interpretation – It has been rationalized from above figure 4.3 fact that gigantic number that
is 60 per cent of employees under the study works in the marketing department whereas 30
per cent of them works in manufacturing and very few i.e. only 10 per cent works in
administration department of the company.Thus, more employee of the company observed as
working in marketing department.21
Table 4.5: Do you think that company gives preferences to customer satisfaction over
profitability?
4. Do you think that company gives Frequency
preferences to customer
satisfaction over profitability?
Yes 80
No 5
Not sure 15
Table 4.5 shows the responces from employees that compny gives preference to customer
satisfaction or profability.
Frequency
80
70
60
50
40 Frequency
30
20
10
0
Ø Yes Ø No Ø Not sure
Figure 4.4: Do you think that company gives preferences to customer satisfaction over
profitability?
Interpretation – Success of any company depend upon their strategy adopted as well their
primary objectives behind the start up of the organisation. Figure 4.4 shows details provided
by the employees of the company it indicates that Micromax company put more weight age
for customer satisfaction as compare to profit making. Enormous i.e. 80 per cent of
employees accept that the company gives priority to the customers' satisfaction. However, 5
per cent expressed their disagreement in this regard whereas 15 per cent of the respondents
replied that they were not sure about it.22
Table 4.6: How often do you get complaints from customers about the products/services of
the company?
5. How often do you get complaints Frequency
from customers about the
products/services of the company?
Every day 50
Once in three days 10
Once in every week 40
Table 4.6 shows the responses of employees towards the customer complaints ratio.
Frequency
50
40
30
Frequency
20
10
0
Ø Every day Ø Once in three Ø Once in every
days week
Figure 4.5 : How often do you get complaints from customers about the products/services of
the company?
Interpretation – It has been identified from the figure 4.5 that as per the 50 per cent
employees, the company received complaints about the products/services on every day basis
but 40 per cent of employees agreed that it was happened once in the week only when the
the company received complaints. It simply indicates that daily complaint related to the
company products become a natural phenomenon for the Micromax company.23
Table 4.7: What are the most complaints from customers related to?
6. What are the most complaints Frequency
from customers related to?
Quality of the products 40
uses about the technological 30
advancements
late responses for queries 30
Table 4.7 shows the responses from the employee for complaints types received from
customers.
Frequency
40
35
30
25
20
15 Frequency
10
5
0
Ø Quality of the Ø uses about Ø late
products the responses for
technological queries
advancements
Figure 4.6: What are the most complaints from customers related to?
Interpretation – It is very crucial that the company can identify the main causes of the
complaints from the customers. According to the figure 4.6 the employees of the company
large number i.e. 40 per cent of employees agreed on the quality-related issues, 30 per cent
about the technologies and equally 30 per cent about the responsive behaviour so far. It
implies that complaints are related to all factors like- technology issues, quality related as
well as late response to the queries.24
Table 4.8: Do you think that company follows an attractive price range for the products?
7. Do you think that company Frequency
follows an attractive price range
for the products?
Yes 75
No 5
Not sure 20
Table 4.8 shows the responses from employees about the price range for customer is
attractive or not.
Frequency
80
70
60
50
40 Frequency
30
20
10
0
Ø Yes Ø No Ø Not sure
Figure 4.7: Do you think that company follows an attractive price range for the products?
Interpretation – Pricing tool is the best tool to gain competitive advantage over a
competitors. It has been identified in figure 4.7 that bulk i.e. 75 per cent of employees agree
that the pricing strategy of the company is impressive and able to attract the customers. At the
same time, 20 per cent of employees respond in a opposition about the current company
pricing strategy so far whereas 5 per cent employees showed their non surety regarding it.25
Table 4.9: Which is the target age group of the company?
8. Which is the target age group of the Frequency
company?
16 to 24 years 40
25 to 34 years 40
35 to 45 years 20
Table 4.9 shows the responses from employees about the target age group of customer for
company’s products and services.
Frequency
40
35
30
25
20 Frequency
15
10
5
0
Ø 16 to 24 Ø 25 to 34 Ø 35 to 45
years years years
Figure 4.8: Which is the target age group of the company?
Interpretation – Target group implies who is the primary customer of the particular good or
services. This question and figure 4.8 helps to identify the target age group of the company.
According to above discussion, it vindicates that 40 per cent of employees considered as age
group of 16 to 24 years as their targets customers and similarly equal per cent i.e. 40 per cent
of employees considered age group of 25 to 34 years as their target customers. 20 per cent of
employees think that age group 35 to 45 years are the target customers of the company.26
Table 4.10: As per you what is the best approach of the company to satisfy the customers?
9. As per you what is the best Frequency
approach of the company to
satisfy the customers?
Improvised customer services 35
Regular deals and discounts 40
Advance technology in handsets 25
Tables 4.10 shows the employees responses about the best approach to satisfy the customers.
Frequency
40
35
30
25
20
15 Frequency
10
5
0
Ø Improvised Ø Regular deals Ø Advance
customer and discounts technology in
services handsets
Figure 4.9: As per you what is the best approach of the company to satisfy the customers?
Interpretation – It has been identified from above facts and figure 4.9 that 40 per cent of
employees believe that regular deals and discounts attract customers the most on the other
hand 35 per cent of employees think that the improvised customer services increases the
satisfaction of the customers as well and 25 per cent considers advancement in technology
can be proved as a tool of satisfying customers.27
Table 4.11: How many customers are happy and satisfied with the brand?
10. According to you how many Frequency
customers are happy and satisfied
with the brand?
Less than 50 percent 30
More than 50 percent 60
Not sure 10
Table 4.11 shows the employees responses towards the customer brand loyalty and
satisfaction.
Frequency
60
50
40
30 Frequency
20
10
0
Ø Less than 50 Ø More than 50 Ø No sure
percent percent
Figure 4.10: How many customers are happy and satisfied with the brand?
Interpretation – It is very important that the employees must have knowledge about
numbers of satisfied and dissatisfied customers.Figure 4.10 shows In total 60 per cent of
employees believes that more than 50per cent of customers are satisfied with the company.
30per cent of employees accepted that less than 50 per cent of customers are not satisfied as
well and very few per cent i.e. 10 per cent of employees are not sure about this fact.28
Table 4.11: Do you think that customers find the brand reliable or cost worthy?
11. Do you think that customers find Frequency
the brand reliable or cost worthy?
Yes 85
No 5
Sure 10
Table 4.11 shows the responses from employees towards the customer reliability with brand.
Frequency
90
80
70
60
50 Frequency
40
30
20
10
0
Ø Yes Ø No Ø Sure
Figure 4.11: Do you think that customers find the brand reliable or cost worthy?
Interpretation – It is clear from above fact from figure 4.11 enormous number i.e.85 per
cent of employees strongly agreed that the customers found the brand reliable and cost
worthy whichindicate that the brand has been running in the right perspective. However, 5
per cent of employees denied it and a total of 10 per cent expressed their not surety towards
identified fact.29
Table 4.13: As per you how satisfied are the customers with the performance relevancy to the
cost of the handsets?
12. As per you how satisfied are the Frequency
customers with the performance
relevancy to the cost of the
handsets?
Very satisfied 75
Satisfied 20
Not satisfied 5
Table 4.13 shows the responses from employees about the customer satisfaction for brand
with performance relevancy with price .
Frequency
80
70
60
50
40
Frequency
30
20
10
0
Ø Very satisfied Ø Satisfied Ø Not satisfied
Figure 4.12: As per you how satisfied are the customers with the performance relevancy to
the cost of the handsets?
Interpretation – It has been identified from figure 4.12 that bigger i.e. 75 per cent of
employees were satisfied with the performance of the company in the context of price and
performance relevancy. It made it clear that as per the employees the brands have been
performing well whereas rest 20 per cent and very few 5 per cent are employees are shown
their satisfaction and not satisfaction respectively.30
Table 4.14: According to you how much time will it take to resolve the complaints/queries of
the customers?
13. According to you how much time Frequency
will it take to resolve the
complaints/queries of the
customers?
Less than 24 hours 60
Less than 48 hours 25
Less than a week 15
Table 4.14 shows the responses from employees for the time taken by company to resolve the
customer complaints.
Frequency
60
50
40
30 Frequency
20
10
0
Ø Less than 24 Ø Less than 48 Ø Less than a
hours hours week
Figure 4.13: According to you how much time will it take to resolve the complaints/queries
of the customers?
Interpretation – The time which has been taken to resolve customer queries can play an
important role when it comes to customer satisfaction. As per the data provided in figure 4.13
above 60 per cent of employees the customers’ complaints/queries gave their views that it
would be resolved within 24 hours whereas 25 per cent of employees opined , it takes less
than 48 hours so far in resolving customer queries.31
Table 4.15: Do you think that some of the handsets need to be changed or modify?
14. Do you think that some of the Frequency
handsets need to be changed or
modify?
Handsets old than six months 20
Handsets older than one year 30
Handsets older than five years 50
Table 4.15 shows the responses from employees if they want to change or modify the
products.
Frequency
50
40
30
20 Frequency
10
0
Ø Handsets old Ø Handsets Ø Handsets
than six months older than one older than five
year years
Figure 4.14: Do you think that some of the handsets need to be changed or modify?
Interpretation – It has been analysed that employees of the brand are very well aware of the
requirement of the changes in the handsets of the companies. Figure 4.14 shows gigantic
number i.e. 50 per cent of employees agreed on the changes required in the handsets more
than five years older. However, 20 percent of employees think that handsets older than six
months need change. A part from this, 30 per cent of employees feels the requirement of
changing the handsets older than one year as well.32
Table 4.16: As per you which of the following is the biggest competitor in the domestic and
international market?
15. As per you which of the following Frequency
is the biggest competitor in the
domestic and international
market?
Blackberry 30
Apple 20
Samsung 50
Table 4.16 shows the responses from employees about the biggest competitor of Micromax.
Frequency
50
40
30
Frequency
20
10
0
Ø Blackberry Ø Apple Ø Samsung
Figure 4.15: As per you which of the following is the biggest competitor in the domestic and
international market?
Interpretation – It is very important that the employees must have information about the
biggest competitors of the brand. As per details provided in above figure 4.15,50 per cent
employees suggested that Samsung is the biggest competition of the brand .Further, 30
per cent of employees think Blackberry and rest 20 per cent of employees assisted that
Apple is the biggest competitor of the Micromax company products.33
4.5 Financial Planning and Analysis
Financial planning and analysis is actually a group within a company finance department that
provides senior management with a forecast of the company's income statement and along
with operating performance for the upcoming quarter and year.
Financial planning and analysis main duty is to transform the company strategy, into a long
term plan with annual operating and capital budgets. By using financial modelling, it
forecasts operating and profitability performance and also determines annual targets for Key
Performance Indicators.Financial planning and analysis can be defined as the budgeting,
forecasting and analytical processes that provide support to organization's financial health
and business strategy.
4.6 Operational awareness
Operational awareness gives information about several activities that impact the company
culture and values. This is configured and based upon the idea of determining the changes
necessary to be processed and accessed in the organisation. This approach helps in
maintaining the collaboration and communication between the entire business departments
and also ensures to build the idea and process which are necessary to be involved in terms of
improving the performance and values (Venkatesh, 2019).
4.7 Strengths and Weaknesses of the Current CVP
The strength and weakness of the current CVP is shown below in table number 4.18.
Table 1.17: Strengths and Weaknesses of the Current CVP
Strength Weakness
It gives platform message which are related It does not gives priority on the industry
with company performance. aspects which affect the research and
development.
It provides the information about uniqueness Failure to access the need and demands of the
and reliability of the company which inherits current as well as potential customers
competitive advantage for the company.
Focus of management to provide better Lack of monetary planning and access affects
services to the customers (Fernandes, et. al., the organisations working (Kauppinen, 2019)34 2019). This includes the access and management This requires doing a lot of work before upon the informative aspects more the accessing certain information which may necessary research. create challenges for the organisation.
35

5. BUILDING THE CVP FOR MICROMAX SELCTED CUSTOMERS

This section presents the building of the initial customer value proposition for the selected
customers. The findings from Current State Analysis are used as a base for building the initial
CVP. The building process is based on the conceptual framework. Each process step is
explained in detail and the results of each phase presented. The section is finalized with a
summary of the initial customer value proposition.

5.1 Initial CVP

The initial CVP of organisation puts light on information about aspects which are necessary
to be processed and managed to attain the changes and values which are necessary to be for
survival of the organisation in the business environment (Leroi-Werelds, 2019). It also
includes the information related to those values necessary to build and maintain organisation
goodwill.

Figure 5.1: Initial CVP

Experience related to the previous usage of goods and services, along with product itself and
brand name of the goods and services affects the value proposition of the organisation.
36

5.2 Customer Need Analysis

Customer needs analysis can be defined as the process of identifying about requirements of
the customers for a product or service. Customer need analysis would use in variety of
product and brand management contexts like concept development, product development,
Value Analysis, and Means End Analysis .The five needs of customers are classified as :
Action, Appreciation, Price, Service and Quality Price. Rational customers are always search
for the best price which matches their needs. Quality customers always demand good and
durable products.
The business lines which will be analysed to determine regarding the values are the shown in
figure-5.2 following:

       Development                       Marketing                     Sales

        Investment                   Construction                  Maintenance

Figure 5.2: Customer Need Analysis

All of these aspects will be analysed in relation of values that are necessary to be processed
and managed by the organisation (Evans, 2019).This also cons derided about the
development and processing of necessary information to achieve business values and manage
them in a better and efficient manner.
37
Table 5.1: Customer Need Analysis
Function Jobs Pain Gain
Development To Choose right The informative aspects The information
product for the hard to be analysed and specified in the area
services interpret. can be reached by
and to Deliver It requires several managing pricing
different values and statically tools and details
offerings. techniques.
Marketing It provides This can become The customer
information about the difficult to find the segmentation helps in
right target customers. desired customer base. product differentiation.
Focus to deliver an Necessary to have a It helps in increasing
efficient and determination about the productivity of the
significant message. customer's behaviour organisation.
and wants (Sheresheva
and Dunaeva, 2019).
Sales It helps to analyse the The price level aspects Offers efficient
right pricing strategy. require to gather servicesand values to
It provides the right information from the unrested and
product to different sources. valuable customer
communicate with the The data gathering base.
customer base. process becomes costly. It helps to improve the
utilization rate.
Investment It helps to determine Comparison of the Help in determining
the right investment competitive companies best investment
approach. to grab the chance of opportunity.
gaining better position.
Construction Manages the entire The information need Plan and manage
construction process to store at multiple logistics aspects of the
of the organisation. locations. organisation. (Ma and
Wang, 2019).
Maintenance Focus on process and Work gets managed It helps in leading the
maintenance control. manually and fails to processing of projects
ensure access to the efficiently.
changes.
Management Makes decision which Deficiency of efficient It helps in timely
are required for resources to grab the access of the necessary
running of the management information in suitable
business. approaches (Mertler, preformat.
2019).38 5.3 Definition of Information Products An Information Product is actually means data mining and defined as an article often in digital form where some data and information are kept in a specific format to instruct, educate and guide the consumer in order to achieve a predefined purpose. It also consider the interpretation of the data values which are necessary to be understood for the purpose of managing the culture and values (Roberts, et. al., 2019).These are important aspects which share information about those things which are necessary to be managed and process by the organisation. While dealing with the manufacturing jobs, it become necessary to attain the changes and processes which leads to improvements in company products (Snyder, 2019). 5.4 Summary of the Initial CVP The initial CVP provides information about some aspects which are necessary to be processed and determined in a better manner during the phase of accessing the information. This provides a broader detail about the services delivered by the business and also share information about those processes which are necessary to be managed and build in terms of processing of information regarding tool and techniques by the organisation. Along with all of this, it also helps to analyse the customer value and approaches which are essential to be determined for the purpose of processing the information in concise manner. This also helps to access the value proposition which play valuable role in terms of building the performance engagement. This can act as a tool to attain the changes and development necessary to be managed and build to be processed for better customer value proposition by the organisation (Mishra, et. al., 2019).
39

6. GETTING FEEDBACK ON PROPOSED CVP

This section focuses on the validation process of the CVP proposal draft. Accordingly, this
section describes the findings of data collection and discusses the recommendation for future
business development.

6.1 Overview of the Feedback Process

The Feedback process deals with the information about feedback conducted by the
stakeholders related to the productivity. It helps in ensuring changes in processes which are
necessary to be accessed and managed by the organisation (Satar, et. al., 2019). It also put
light on information about significant aspects which needs to processed and managed
effectually by the organisation. The table below shows the overview of feedback process.
Table 6.1: Overview of the Feedback Process

Topic           Question                 Suggestion
Feedback of the Does the business        The current process can be defined efficient
business  value process     is    going  and effective to certain extent, it require
framework       efficiently         and  certain changes in values to attain the
                effectively?             development.
Feedback of the Are the products         In the existing time, the products are
proposed        matches       all   the  delivering the services to customers to certain
information     demands and wants of     valuable level and that is creating challenges
products.       the customers?           in management of the process and access of
                                         the values (Wan, et. al., 2019).
Feedback            Does the feedback The feedback share information about those
regarding the       provideknowledge     aspects which are necessary to be fulfilled.
benefits message    about      necessary This also helps in access of the values critical
                    changes    in    the for the betterment of the company.
                    business?

6.2 Conclusions of the Feedback Process

The feedback process share information about some aspects that are associated with
managing the business values and development (Zhang, et. al., 2019). This also helps in
accessing the changes in values .While coping up with the changes and innovation this
approach provides the idea about changes attained by the business module. (Naik, 2019).
You can also read