Deletion of Von Hippel-Lindau Interferes with Hyper Osmolality Induced Gene Expression and Induces an Unfavorable Gene Expression Pattern - MDPI
←
→
Page content transcription
If your browser does not render page correctly, please read the page content below
cancers
Article
Deletion of Von Hippel–Lindau Interferes with Hyper
Osmolality Induced Gene Expression and Induces an
Unfavorable Gene Expression Pattern
Alexander Groß, Dmitry Chernyakov, Lisa Gallwitz , Nicola Bornkessel and Bayram Edemir *
 Department of Medicine, Hematology and Oncology, Martin Luther University Halle-Wittenberg,
 Ernst-Grube-Str. 40, 06120 Halle (Saale), Germany; alexander.gross.halle@gmx.net (A.G.);
 Dmitry.Chernyakov@uk-halle.de (D.C.); lgallwitz@biochem.uni-kiel.de (L.G.);
 nicola.bornkessel@student.uni-halle.de (N.B.)
 * Correspondence: bayram.edemir@uk-halle.de; Tel.: +49-345-557-4890; Fax: +49-345-557-2950

 Received: 6 December 2019; Accepted: 6 February 2020; Published: 12 February 2020

 Abstract: Loss of von Hippel–Lindau (VHL) protein function can be found in more than 90% of
 patients with clear cell renal carcinoma (ccRCC). Mice lacking Vhl function in the kidneys have urine
 concentration defects due to postulated reduction of the hyperosmotic gradient. Hyperosmolality
 is a kidney-specific microenvironment and induces a unique gene expression pattern. This gene
 expression pattern is inversely regulated in patients with ccRCC with consequences for cancer-specific
 survival. Within this study, we tested the hypothesis if Vhl function influences the hyperosmolality
 induced changes in gene expression. We made use of the Clustered Regularly Interspaced Short
 Palindromic Repeats (CRISPR)/Cas9 technology to inhibit functional Vhl expression in murine
 collecting duct cell line. Loss of Vhl function induced morphological changes within the cells similar
 to epithelial to mesenchymal transition like phenotype. Vhl-deficient cells migrated faster and
 proliferated slower compared to control cells. Gene expression profiling showed significant changes
 in gene expression patterns in Vhl-deficient cells compared to control cells. Several genes with
 unfavorable outcomes showed induced and genes with favorable outcomes for patients with renal
 cancer reduced gene expression level. Under hyperosmotic condition, the expression of several
 hyperosmolality induced genes, with favorable prognostic value, was downregulated in cells that do
 not express functional Vhl. Taken together, this study shows that Vhl interferes with hyperosmotic
 signaling pathway and hyperosmolality affected pathways might represent new promising targets.

 Keywords: von Hippel–Lindau; EMT like; hyperosmolality

1. Introduction
      Renal cell carcinomas (RCC) are a heterogeneous group of cancers and are among the top 10
cancers worldwide. RCC arises from renal tubular epithelial cells and more than 80% of all renal
neoplasms belong to RCC [1]. The major RCC subtypes are clear cell RCC (ccRCC) with a frequency
of around 70–80%, papillary RCC with a frequency of around 10%–15%, and chromophobe RCC
with a frequency of around 3–5% [2]. RCC incidence increases with age and is higher for men than
women. Risk factors for RCC are, for example, obesity, hypertension, cigarette smoking, chronic kidney
disease, hemodialysis, renal transplantation, or acquired kidney cystic disease [3]. Moreover, genetic
risk factors are involved in the pathogenesis of RCC including the von Hippel–Lindau (VHL) gene,
the protein polybromo-1 gene (PBRM-1), and the SET Domain Containing 2 (SETD2) gene [4,5].
      VHL is a tumor suppressor that plays a pivotal role in the development of ccRCC and gene
alterations can be found in up to 90% of ccRCC cases [6]. VHL can be altered and transmitted rarely

Cancers 2020, 12, 420; doi:10.3390/cancers12020420                             www.mdpi.com/journal/cancers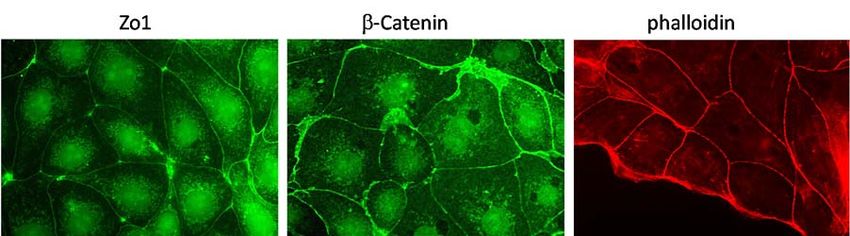
Cancers 2020, 12, 420                                                                              2 of 17

in an autosomal dominant fashion, which is associated with the VHL disease, or in most cases to a
sporadic manner [6].
     Several studies have been performed to generate ccRCC in mouse kidneys by inactivating
Vhl. The first study used the phosphoenolpyruvate carboxykinase (Pepck)-Cre to generate proximal
tubule-specific knock out (KO) mice. These mice developed a modest phenotype and after 12 months
25% of the mice had renal microcysts [7]. Using Ksp1.3-Cre, as deleter Cre, led to generation of distal
tubule and collecting duct (CD) specific deletion of Vhl. These mice developed hydronephrosis but
no further abnormalities [8]. However, the combined KO of Vhl together with the phosphatase and
tensin homolog (Pten) resulted in hyperproliferation and kidneys with multiple epithelial tubule cysts
in the cortex and medulla. A further study on mouse showed that deletion of Vhl caused increased
medullary vascularization and, as a physiological consequence, developed a diabetes insipidus like
phenotype by excretion of highly diluted urine. The authors hypothesized that the increased medullary
vasculature alters salt uptake from the renal interstitium, resulting in a disruption of the osmotic
gradient and impaired urinary concentration [9]. The rate-limiting factor in the urine concentration is
the expression of the aquaporin-2 (Aqp2) water channel. Aqp2 is expressed in the principal cells of
the collecting duct, and the binding of the antidiuretic hormone vasopressin (AVP) to the vasopressin
type 2 receptor induces the translocation of Aqp2 bearing vesicles to the apical plasma membrane [10].
The expression of Aqp2 in the mentioned mouse model was decreased [9]. The expression of Aqp2 on
the mRNA level is regulated by the cAMP-responsive element-binding protein [11] and by the action
of the nuclear factor of activated T cells 5 (Nfat5) [12]. Nfat5 is activated by hyperosmotic environment
of the kidney [13]. It has been recently shown that in renal cancer Nfat5 expression is targeted by
microRNAs that led to reduced expression of Nfat5 target genes [14].
     The cells of the renal inner medulla are challenged with a hyperosmotic environment, the driving
force for water retention. We have shown that this environment is also important to regulate a specific
gene expression pattern of several kidney-specific genes [15]. Further, we have recently shown that
the expression of osmolality affected genes is inversely regulated in the ccRCC samples compared
to normal tissue, and we were able to generate an Osm-score that allows the prediction of patients’
survival [16]. We were also able to induce the expression of the E74-like factor 5 (ELF5), a tumor
suppressor in RCC [17], in the 786-0, VHL deficient, RCC cell line under hyperosmotic cell culture
conditions. Interestingly, the expression level was higher in 786-0 that ectopically expressed wild type
VHL [16], suggesting that VHL somehow interferes with hyperosmolality associated gene expression.
     Based on these data we hypothesized that Vhl also plays an important role in the expression of
hyperosmolality induced genes and that loss of Vhl function induces a ccRCC like phenotype in a
normal murine collecting duct cell line. Indeed, the results of this study showed massive functional,
morphological abnormalities and changes in gene expression that are Vhl and osmolality dependent.

2. Results

2.1. Generation of VHL-Deficient Cells
     We have used the murine mpkCCD cells to analyze the role of Vhl in the collecting duct. This cell
line has been intensively used to analyze the regulation of Aqp2 and the role of Nfat5 on hyperosmotic
adaptation and they are capable of genetic manipulation [18,19]. We decided to use the CRISPR/Cas9
method to efficiently knock out functional Vhl protein expression. We used 3 different guide RNA
sequences (Supplemental Table S1) and a non-targeting (Scr) sequence. Single cells were isolated
and mutations within the Vhl locus were analyzed by Sanger sequencing using specific primer pairs
(Supplemental Table S1 and Supplemental Figure S1). The type of mutation was analyzed by the online
tool Tracking of InDels by Decomposition (TIDE) [20]. Based on this analysis, we selected single clones
that showed InDels leading to a frameshift (Supplemental Figure S2).
     Based on these results, the functional expression of Vhl should be lost in these clones. To validate
this on protein level, Western blot experiments were performed. Since the loss of Vhl stabilizes the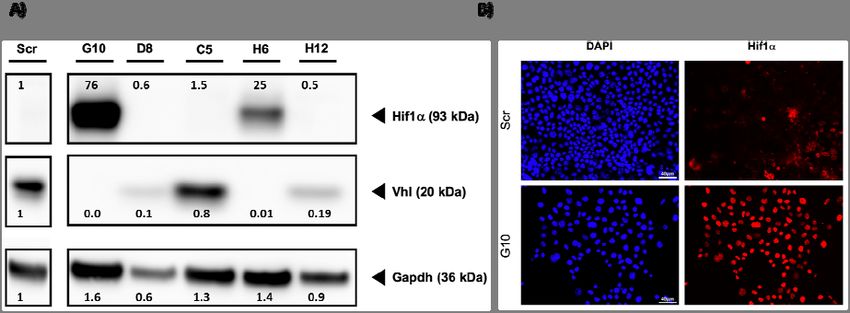
Cancers 2020, 12, x FOR PEER REVIEW 3 of 17
analysis, we selected single clones that showed InDels leading to a frameshift (Supplemental Figure
S2).
Cancers 2020, 12, 420 3 of 17
Based on these results, the functional expression of Vhl should be lost in these clones. To
validate this on protein level, Western blot experiments were performed. Since the loss of Vhl
expression
stabilizes the of expression
Hif1a, we have alsowe
of Hif1a, tested
haveifalso
thistested
is the ifcase
thisin
is our model.
the case Asmodel.
in our a control,
As awe used Scr
control, we
gRNA expressing cells and 5 Vhl-targeted single-cell clones. Vhl protein expression
used Scr gRNA expressing cells and 5 Vhl‐targeted single‐cell clones. Vhl protein expression was was lost in clones
H6
lostand G10 (Figure
in clones H6 and1).G10
This was associated,
(Figure 1). This wasas associated,
expected, with Hif1a expression.
as expected, with Hif1a expression.
Figure 1.1.Loss
Figure Lossofofvon
vonHippel–Lindau
Hippel–Lindau (VHL)
(VHL)protein induces
protein nuclear
induces Hif1AHif1A
nuclear expression. (A) Cell(A)
expression. lysates
Cell
from control cells (Scr) and 5 VHL clones were prepared and the expression of VHL
lysates from control cells (Scr) and 5 VHL clones were prepared and the expression of VHL and and Hif1a was
analyzed
Hif1a wasbyanalyzed
Westernby blot. An antibody
Western blot. Andirected
antibodyagainst Gapdh
directed served
against Gapdhas control.
served asThe numbers
control. The
indicate
numbersratios in signal
indicate intensity
ratios compared
in signal intensityto compared
Scr. (B) Cells
to were
Scr. cultivated on glass
(B) Cells were coverslips.
cultivated on After
glass
fixation, theAfter
coverslips. cells fixation,
were incubated
the cellswith
werea specific
incubated Hif1a
withantibody.
a specificA Hif1a
secondary Alexa-568
antibody. labeled
A secondary
antibody was used to visualize the signals. The staining of the nuclei was done by incubation
Alexa‐568 labeled antibody was used to visualize the signals. The staining of the nuclei was done with
by
0 ,6-diamidino-2-phenylindole (DAPI) (scale bar = 40 µm).
4incubation with 4′,6‐diamidino‐2‐phenylindole (DAPI) (scale bar = 40 μm).
Hif1a
Hif1a was
wasonly
onlydetectable
detectablewhen
when VhlVhl
protein expression
protein was was
expression completely lost. For
completely lost.example, in clone
For example, in
D8 and C5, the expression of Vhl is weak compared to Scr. However, no stabilization
clone D8 and C5, the expression of Vhl is weak compared to Scr. However, no stabilization of Hif1a of Hif1a was
observed for these
was observed for clones. This data
these clones. Thisshows
data that
showsourthat
cell model
our cellshows
model similar
shows changes
similaraschanges
described
as
by other groups. In a second approach, we have analyzed the intracellular localization
described by other groups. In a second approach, we have analyzed the intracellular localization of Hif1a.
of
Hif1a acts as a transcription factor and should be localized within the nucleus.
Hif1a. Hif1a acts as a transcription factor and should be localized within the nucleus. We have, We have, therefore,
performed immunofluorescence
therefore, performed analysis withanalysis
immunofluorescence Scr -cells andScr
with clone G10and
‐cells using a specific
clone Hif1aaantibody.
G10 using specific
As expected,
Hif1a no Hif1a
antibody. signal was
As expected, detectable
no Hif1a signalinwas
the detectable
nucleus of inScrthe
cells (Figure
nucleus of 1).
Scr cells (Figure 1).
Since
Since we
we were
were able
able to
to validate
validate the
the loss
loss of
of Vhl
Vhl expression
expression in in these
these cells,
cells, we
we will
will name
name them
them as
as
Vhl-KO hereafter.
Vhl‐KO hereafter.
2.2. Vhl Deletion Induces Loss of Epithelial Structures
2.2. Vhl Deletion Induces Loss of Epithelial Structures
Loss of Vhl is associated with an epithelial to mesenchymal transition (EMT) like phenotype [21].
Loss of Vhl is associated with an epithelial to mesenchymal transition (EMT) like phenotype
We have, therefore, analyzed if this is also the case in the cell model that we used. We have performed
[21]. We have, therefore, analyzed if this is also the case in the cell model that we used. We have
immunofluorescence analysis using specific antibodies for markers of tight (Zona occludens 1, Zo1)
performed immunofluorescence analysis using specific antibodies for markers of tight (Zona
and adherence junctions (β-catenin). While the control cells showed localization of ß-catenin at the
occludens 1, Zo1) and adherence junctions (β‐catenin). While the control cells showed localization of
cell–cell contacts, this was not the case in Vhl-KO cells (Figure 2).
ß‐catenin at the cell–cell contacts, this was not the case in Vhl‐KO cells (Figure 2).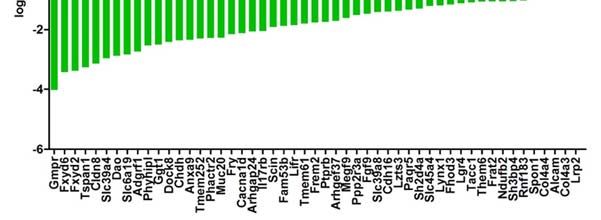
Cancers 2020, 12, 420 4 of 17
Cancers 2020, 12, x FOR PEER REVIEW 4 of 17
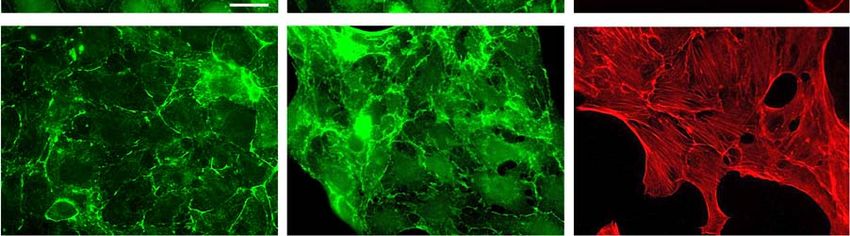
Figure 2.
Figure 2. Loss
Loss of von Hippel–Lindau
of von Hippel–Lindau (Vhl)
(Vhl) protein
protein induces
induces morphological
morphological changes.
changes. Cells were
Cells were
cultivated on glass coverslips. After fixation, the cells were incubated with specific antibodies
cultivated on glass coverslips. After fixation, the cells were incubated with specific antibodies directed
directedZo1
against against Zo1 and β‐catenin.
and β-catenin. A secondary A secondary
Alexa-488Alexa‐488 labeledwas
labeled antibody antibody was
used to used tothe
visualize visualize
signals.
the signals. For actin filament staining, after fixation, the cells were incubated with an Alexa‐568
For actin filament staining, after fixation, the cells were incubated with an Alexa-568 labeled phalloidin
labeled
(scale phalloidin
bar = 20 µm).(scale bar = 20 μm).
Similar to to β‐catenin,
β-catenin,losslossofofVhl
Vhlfunction
functiondisturbs
disturbs proper tight
proper junction
tight assembly
junction assembly(Figure 2). The
(Figure 2).
staining
The for Zo1
staining showed
for Zo1 showedinterruption of the
interruption oftight junction
the tight band.band.
junction This This
indicates that in
indicates Vhl‐KO
that in Vhl-KOcells
the epithelial
cells cell tocell
the epithelial celltoassembly is disturbed.
cell assembly This is
is disturbed. alsoisfurther
This supported
also further by staining
supported for the
by staining foractin
the
filaments
actin (Figure
filaments 2). Scr
(Figure 2). cells showed
Scr cells showed actin enrichment
actin enrichment predominantly
predominantlyatatthe thecell–cell
cell–cell contacts,
contacts,
indicating an
indicating anintact
intactepithelial
epithelialstructure
structureandand polarity,
polarity, which
which is not
is not the the
casecase in Vhl-KO
in the the Vhl‐KOcells.cells. The
The cells
cells develop
develop a fibroblast‐like
a fibroblast-like phenotype phenotype with intracellular
with intracellular actin stressactin
fibersstress fibersany
and hardly andenrichment
hardly any at
enrichment
the cell–cell at the cell–cell contacts.
contacts.
Since the changes in morphology are related to an EMT-like EMT‐like phenotype, we have also analyzed
mRNAexpression
the mRNA expression of EMT
of EMT marker marker
genes genes like fibronectin,
like fibronectin, alphamuscle
alpha smooth smooth
actin,muscle actin,
N-cadherin,
N‐cadherin,
and and vimentin Figure
vimentin (Supplemental (Supplemental Figuresignificant
S3). We observed S3). We differences
observed in significant
expressiondifferences
for fibronectinin
expression
and for fibronectin
alpha smooth and However,
muscle actin. alpha smooth muscle actin.
the expression However,and
of N-cadherin the vimentin
expressionwere of not
N‐cadherin
affected,
and vimentin
which were notan
could implicate affected,
incompletewhich could implicate an incomplete EMT.
EMT.
2.3. Vhl
Vhl Deletion
Deletion is
is Associated
Associated with
with Changes in Proliferation and Migration Behavior
In the
the next
nextstep,
step,weweanalyzed
analyzedififVhl
Vhldeletion
deletionis is
associated with
associated functional
with changes.
functional Given
changes. thatthat
Given the
morphological and molecular changes might represent an incomplete EMT like
the morphological and molecular changes might represent an incomplete EMT like phenotype, wephenotype, we set
out to determine
set out to determinewhether these
whether changes
these changesareare
associated
associatedwithwithother
otherphenotypic
phenotypicchanges.
changes. We have
first tested if there are differences inin the
the proliferation
proliferation rate between Scr and Vhl-KO
Vhl‐KO cells using the
IncuCyte S3 live-cell
live‐cell analysis system. We have done this by calculation of the mean doubling time of
the cells. The
The results showed
showed that Vhl‐KO
Vhl-KO cells had significant longer doubling time, resulting in a
lower proliferation rate, compared
compared toto Scr
Scr cells
cells (Figure
(Figure 3).
3).
Cancers 2020, 12, 420                                                                                                                                                5 of 17
 Cancers 2020, 12, x FOR PEER REVIEW                                                                                                                                   5 of 17

      A)                                                                                         B)
                                                                                                                                              150
                                         500
                                                                                                                                                           *    *
                                                       Scr 300
                                                       H6 300

                                                                                                       changes in doubling time ( % of Scr)
                                         400           G10 300
       relative proliferation rate [%]

                                                                                                                                              100

                                         300

                                         200
                                                                                                                                              50

                                         100

                                          0                                                                                                    0
                                               0   4             8   12           16   20   24    28                                                Scr   G10   H6
                                                                          t [h]

       Figure3.3.von
     Figure       vonHippel–Lindau
                        Hippel–Lindau(Vhl)
                                         (Vhl)deletion
                                                 deletionisisassociated
                                                               associatedwith
                                                                           withlonger
                                                                                 longerdoubling
                                                                                         doublingtime.
                                                                                                     time.Cells
                                                                                                           Cellswere
                                                                                                                   were
     cultivated
       cultivated in 96‐well plates and the proliferation was measured by live‐cell imaging usingIncuCyte
                 in 96-well plates  and the   proliferation  was  measured    by live-cell imaging   using   IncuCyte
     S3S3system
          systemtaking
                  takingananimage
                             image every
                                     every 44 h.
                                              h. The
                                                  Therelative
                                                       relativecell
                                                                celldensity
                                                                     densitywas
                                                                              was  plotted
                                                                                 plotted    and
                                                                                          and  thethe doubling
                                                                                                   doubling      time
                                                                                                              time  was
     was  calculated  by nonlinear   exponential    growth   equation  using  GraphPad     Prism  (A).
       calculated by nonlinear exponential growth equation using GraphPad Prism (A). The doubling timesThe  doubling
     times
       werewere   normalized
              normalized       to the
                           to the  ScrScr cells
                                       cells     (B).One
                                              (B).    OneWay
                                                           WayANOVA
                                                                 ANOVA was was performed
                                                                                 performed to toidentify
                                                                                                 identifystatistically
                                                                                                           statistically
     significant                                 cell and  are marked   by * (p value < 0.05;  n >
       significant differences compared to Scr cell and are marked by * (p value < 0.05; n >5).5).
                 differences  compared   to  Scr

      Since we wanted to test if Vhl function is involved in hyperosmolality affected pathways, we tested
       Since we wanted to test if Vhl function is involved in hyperosmolality affected pathways, we
the proliferation rate of Scr and Vhl-KO cells also under hyperosmotic conditions. Hyperosmolality
  tested the proliferation rate of Scr and Vhl‐KO cells also under hyperosmotic conditions.
alone reduced the proliferation of Scr cells (Supplemental Figure S4). This was also the case for the
  Hyperosmolality alone reduced the proliferation of Scr cells (Supplemental Figure S4). This was also
Vhl-KO cells. Under hyperosmotic conditions, however, the differences between Scr and Vhl-KO
  the case for the Vhl‐KO cells. Under hyperosmotic conditions, however, the differences between Scr
cells were still detectable. To test if the phenotype of Vhl deficient mpkCCD correlates with that of
  and Vhl‐KO cells were still detectable. To test if the phenotype of Vhl deficient mpkCCD correlates
classical RCC cell lines, we tested the proliferation rate using the RCC cell line 786-0. We tested cells
  with that of classical RCC cell lines, we tested the proliferation rate using the RCC cell line 786‐0. We
that do not express VHL and 786-0 cells that ectopically express human VHL (786-0-VHL). In contrast
  tested cells that do not express VHL and 786‐0 cells that ectopically express human VHL
to the collecting duct cells, there were no differences between the 786-0 and 786-0-VHL expressing cells
  (786‐0‐VHL). In contrast to the collecting duct cells, there were no differences between the 786‐0 and
(Supplemental Figure S5).
  786‐0‐VHL expressing cells (Supplemental Figure S5).
      Besides cell proliferation, we have analyzed the migration behavior of Scr and Vhl-KO as well
       Besides cell proliferation, we have analyzed the migration behavior of Scr and Vhl‐KO as well
as that of the 786-0 and 786-0-VHL RCC cells by scratch wound healing assay using the IncuCyte S3
  as that of the 786‐0 and 786‐0‐VHL RCC cells by scratch wound healing assay using the IncuCyte S3
live-cell imaging system. The results showed that Vhl-KO cells migrate at a significantly faster speed
  live‐cell imaging system. The results showed that Vhl‐KO cells migrate at a significantly faster speed
(~25% faster) compared to Scr cells (Figure 4A and Supplemental Figure S6). Similar to the results
  (~25% faster) compared to Scr cells (Figure 4A and Supplemental Figure S6). Similar to the results
obtained for cell proliferation, VHL expression in 786-0 cells has a different effect on cell migration
  obtained for cell proliferation, VHL expression in 786‐0 cells has a different effect on cell migration
compared to the mpkCCD cells. The ectopic expression of VHL induced a significantly higher cell
  compared to the mpkCCD cells. The ectopic expression of VHL induced a significantly higher cell
migration speed (Supplemental Figure S7).
  migration speed (Supplemental Figure S7).
      So far the data showed that functional deletion of Vhl in mpkCCD cells is associated with massive
       So far the data showed that functional deletion of Vhl in mpkCCD cells is associated with
changes in cell morphology, proliferation, and migration. These differences are cell context-specific
  massive changes in cell morphology, proliferation, and migration. These differences are cell
since 786-0 RCC cell lines showed different effects. All these experiments were performed with
  context‐specific since 786‐0 RCC cell lines showed different effects. All these experiments were
cells cultivated under normal (isoosmotic) cell culture conditions. Since we postulate that Vhl has
  performed with cells cultivated under normal (isoosmotic) cell culture conditions. Since we
an osmolality dependent function, we have repeated the analysis under hyperosmotic conditions.
  postulate that Vhl has an osmolality dependent function, we have repeated the analysis under
In contrast to proliferation, the Vhl-KO cells behaved differently in the cell migration analysis under
  hyperosmotic conditions. In contrast to proliferation, the Vhl‐KO cells behaved differently in the cell
hyperosmotic conditions. While the Vhl-KO cells migrated faster under isotonic conditions, this was
  migration analysis under hyperosmotic conditions. While the Vhl‐KO cells migrated faster under
reversed under hyperosmotic conditions (Figure 4B).
  isotonic conditions, this was reversed under hyperosmotic conditions (Figure 4B).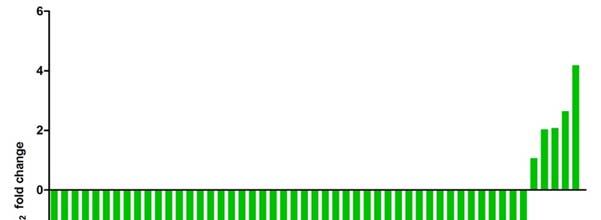
Cancers 2020, 12, x FOR PEER REVIEW 6 of 17
Cancers 2020, 12, 420 6 of 17
A) B) ***
***
100 ns
***
Scr 50
***
H6
G10
80
changes in migration rate ( % of Scr)
relative wound density (%)
60
0
40
20
-50
0
0 2 4 6 8 10 12 14 16 18 20 22
t [h] Scr 300 G10 300 H6 300 Scr 600 G10 600 H6 600
Figure4.4.Loss
Figure Lossofofvon
vonHippel–Lindau
Hippel–Lindau(Vhl) (Vhl)expression
expressioninduces
inducescell
cellmigration
migrationcapacity.
capacity.Cells
Cellswere
were
cultivated
cultivatedinin96-well
96‐wellplates until
plates confluency
until confluency and a wound
and a woundto the cell cell
to the monolayer was was
monolayer applied usingusing
applied the
AutoScratch wound
the AutoScratch making
wound tool. Cell
making migration
tool. was observed
Cell migration by live-cell
was observed byimaging
live‐cellusing the IncuCyte
imaging using the
S3 system. (A)
IncuCyte S3 Representative plot of the wound
system. (A) Representative plotdensity
of theover time. density
wound (B) Cellsover
weretime.
cultivated in 96-well
(B) Cells were
plates until confluency either at 300 or 600 mosmol/kg. The relative wound
cultivated in 96‐well plates until confluency either at 300 or 600 mosmol/kg. The relative density after 12 wound
h was
calculated by linear
density after regression
12 h was analysis
calculated using
by linear GraphPadanalysis
regression Prism. using
The migration
GraphPad speed was
Prism. normalized
The migration
tospeed
Scr cells
wascultivated
normalizedatto300Scrmosmol/kg. OneatWay
cells cultivated ANOVA wasOne
300 mosmol/kg. performed
Way ANOVA to identify statisticallyto
was performed
significant differencessignificant
identify statistically and are marked by ***and
differences (p value < 0.001;by
are marked > 3).
n *** (p value < 0.001; n > 3).
2.4. Vhl Deletion Affects Expression of Hyperosmolality Regulated Genes
2.4. Vhl Deletion Affects Expression of Hyperosmolality Regulated Genes
These results showed that Vhl deletion has a cell and osmolality specific effect on cellular behavior.
These results showed that Vhl deletion has a cell and osmolality specific effect on cellular
We next asked if this is also associated with changes in the gene expression level. The expression
behavior. We next asked if this is also associated with changes in the gene expression level. The
level of Aqp2 served as a marker gene. The water channel Aqp2 expression in mpkCCD cells is either
expression level of Aqp2 served as a marker gene. The water channel Aqp2 expression in mpkCCD
induced by vasopressin stimulation or by hyperosmotic cultivation conditions. Studies have shown
cells is either induced by vasopressin stimulation or by hyperosmotic cultivation conditions. Studies
that the expression of Aqp2 was decreased in Vhl deficient mice. Therefore, we cultivated the Scr and
have shown that the expression of Aqp2 was decreased in Vhl deficient mice. Therefore, we
Vhl-KO cells under hyperosmotic conditions and analyzed Aqp2 gene expression by real-time PCR.
cultivated the Scr and Vhl‐KO cells under hyperosmotic conditions and analyzed Aqp2 gene
The expression of Aqp2 is nearly lost in Vhl-deficient cells (Supplemental Figure S8). This indicates
expression by real‐time PCR. The expression of Aqp2 is nearly lost in Vhl‐deficient cells
that Vhl deletion has a direct effect on AQP2 expression and probably interferes with hyperosmotic
(Supplemental Figure S8). This indicates that Vhl deletion has a direct effect on AQP2 expression
pathways. To identify additional genes that are differentially expressed in Vhl-KO cells, we cultivated
and probably interferes with hyperosmotic pathways. To identify additional genes that are
Scr and Vhl-KO cells at 300 or 600 mosmol/kg, isolated total RNA, and performed gene expression
differentially expressed in Vhl‐KO cells, we cultivated Scr and Vhl‐KO cells at 300 or 600 mosmol/kg,
profiling by RNA-Seq. In Scr cells, more than 2700 genes were differentially expressed between cells
isolated total RNA, and performed gene expression profiling by RNA‐Seq. In Scr cells, more than
cultivated at 300 vs 600 mosmol/kg (Supplemental Figure S9). For example, Ranbp3l, Prss35, or Slc6a12
2700 genes were differentially expressed between cells cultivated at 300 vs 600 mosmol/kg
are within the top upregulated genes (Supplemental Excel File S1). These genes were also identified in
(Supplemental Figure S9). For example, Ranbp3l, Prss35, or Slc6a12 are within the top upregulated
primary cultured inner medullary collecting duct (IMCD) cells [15], which indicates that the mpkCCD
genes (Supplemental Excel File S1). These genes were also identified in primary cultured inner
cell line behaves similarly to primary cultured IMCD cells. We next compared Scr cells with Vhl-KO
medullary collecting duct (IMCD) cells [15], which indicates that the mpkCCD cell line behaves
cells cultivated at 300 or 600 mosmol/kg. The deletion of Vhl was always associated with massive
similarly to primary cultured IMCD cells. We next compared Scr cells with Vhl‐KO cells cultivated
changes in gene expression. The total number of differentially expressed genes was over 4700 for the
at 300 or 600 mosmol/kg. The deletion of Vhl was always associated with massive changes in gene
300 and more than 4200 genes for the 600 mosmol/kg comparison (Figure 5).
expression. The total number of differentially expressed genes was over 4700 for the 300 and more
than 4200 genes for the 600 mosmol/kg comparison (Figure 5).Cancers 2020, 12, 420 7 of 17
Cancers 2020, 12, x FOR PEER REVIEW 7 of 17
Figure5.5.VHL
Figure VHL(von(vonHippel–Lindau)
Hippel–Lindau)deletion
deletioninduces
inducesmassive
massivechanges
changesiningene
geneexpression.
expression.Scr-
Scr‐and
and
Vhl-KO
Vhl‐KOcells
cellswere
werecultivated
cultivatedatat300
300oror600600mosmol/kg.
mosmol/kg.Total
TotalRNA
RNAwaswasisolated
isolatedand
andgene
geneexpression
expression
was
wasanalyzed
analyzedusing
using Next-Generation
Next‐GenerationSequencing
Sequencingtechnology
technologyand
anddifferentially
differentiallyexpressed
expressedgenes
geneswere
were
identified (p < 0.05, n
identified (p < 0.05, n == 3). The volcano plots show the number of genes, the p-values, and
show the number of genes, the p‐values, and log log fold
2 2 fold
changes
changesforforcells
cellscultivated
cultivatedatat300
300(left)
(left)or
or600
600(right)
(right)mosmol/kg.
mosmol/kg.
Functional
Functionalanalysis
analysisidentified
identifiedenrichment
enrichmentofofgenes
genesininspecific
specificKyoto
KyotoEncyclopedia
EncyclopediaofofGenesGenesand
and
Genomes (KEGG) pathways. Within the top 20 enriched KEGG pathways using
Genomes (KEGG) pathways. Within the top 20 enriched KEGG pathways using the list of genes that the list of genes that
were
weredifferentially
differentiallyexpressed
expressedininthethe300
300mosmol/kg
mosmol/kgcomparison
comparisononly onlyone
onecancer-associated
cancer‐associatedpathway
pathway
(“proteoglycans
(“proteoglycansin in cancer”) was was
cancer”) detected. The top
detected. Theenriched KEGG pathway
top enriched KEGG was “metabolic
pathway was pathways”
“metabolic
(Supplemental Figure S10 andFigure
pathways” (Supplemental Supplemental
S10 andExcel File S2). Similar
Supplemental Excelanalyses
File S2).were performed
Similar withwere
analyses the
differentially expressed genes in cells cultivated at 600 mosmol/kg. Again, the top
performed with the differentially expressed genes in cells cultivated at 600 mosmol/kg. Again, the enriched pathway
was
top “metabolic pathways”.
enriched pathway was In contrast to
“metabolic the 300 mosmol/kg
pathways”. In contrast comparison,
to the 300 more cancer-associated
mosmol/kg comparison,
pathways were enriched namely “pathways in cancer”, “viral carcinogenesis”,
more cancer‐associated pathways were enriched namely “pathways in cancer”, “viral “proteoglycans in
cancer”, and “central
carcinogenesis”, carbon metabolism
“proteoglycans in cancer”.
in cancer”, and “centralTwocarbon
of the high-ranking
metabolism inpathways
cancer”. Twoare “focal
of the
adhesion” and “regulation of actin cytoskeleton”, revealing higher gene expression
high‐ranking pathways are “focal adhesion” and “regulation of actin cytoskeleton”, revealing higher for f-actin proteins
but alsoexpression
gene actin-binding for factors
f‐actin like vinkulin
proteins butoralso
α-actinin. Furthermore,
actin‐binding high
factors ranking
like is theor“PI3K-Akt
vinkulin α‐actinin.
pathway”
Furthermore,that is strongly
high rankingassociated with ccRCCpathway”
is the “PI3K‐Akt tumors [22].thatInterestingly, these data support
is strongly associated with ccRCCthe
observed morphological and functional changes in Vhl-KO cells since these pathways
tumors [22]. Interestingly, these data support the observed morphological and functional changes in are associated
with cell morphology
Vhl‐KO andpathways
cells since these migration.are associated with cell morphology and migration.
The
Thescreening
screeningofofthe thegene
geneexpression
expressiondatadataforforclassical
classicalEMT
EMTmarker
markergenesgenesshowed
showedthat thatthe
the
expression of desmin is significantly induced in Vhl-KO cells. The expressions of
expression of desmin is significantly induced in Vhl‐KO cells. The expressions of other markers like other markers like
Snail1,
Snail1,Snail2,
Snail2,Zeb1,
Zeb1,or orAxl
Axl[23]
[23]were
werenotnotaffected
affected(Supplemental
(SupplementalExcel ExcelFile
FileS1).
S1).Again,
Again,this
thismight
mightbebe
explained by an incomplete EMT like
explained by an incomplete EMT like phenotype.phenotype.
2.5.
2.5.Loss
LossofofVhl
VhlFunction
FunctionLeads
Leadstotoan
anUnfavorable
UnfavorableGene
GeneExpression
ExpressionPattern
Pattern
The
Thedata
dataofofTCGA
TCGAandandthe
theHuman
HumanPathology
PathologyAtlas
Atlas[24][24]allowed
allowedthetheidentification
identificationofofprognostic
prognostic
genes that are associated with favorable or unfavorable clinical
genes that are associated with favorable or unfavorable clinical outcome.outcome. We have,Wetherefore,
have, analyzed
therefore,
ifanalyzed
the loss ofifVhl function has an impact on expression of genes that are prognostic for
the loss of Vhl function has an impact on expression of genes that are prognostic patients with renal
for
cancer.
patientsHowever,
with renal thecancer.
HumanHowever,
Pathology Atlas
the doesPathology
Human not discriminate between
Atlas does the renal cancer
not discriminate entities.
between the
renalWe have entities.
cancer used genes that showed at least 2/−2 log2 fold changes in gene expression and that are
prognostic
We haveclinical
on outcome
used genes of the patients.
that showed at least About
2/−2 log151 genes fitted to the scheme. 91 genes were
2 fold changes in gene expression and that are
associated
prognosticwith unfavorable
on clinical and of
outcome 60the
with a favorable
patients. Aboutclinical outcome
151 genes (Figure
fitted to the6).
scheme. 91 genes were
associated with unfavorable and 60 with a favorable clinical outcome (Figure 6).Cancers 2020,
Cancers 2020, 12,
12, 420
x FOR PEER REVIEW 88 of
of 17
17
Cancers 2020, 12, x FOR PEER REVIEW 8 of 17
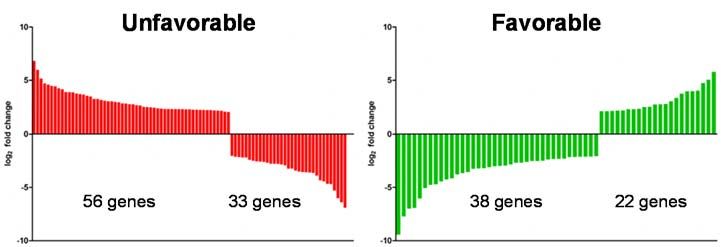
Figure 6. Deletion of VHL (von Hippel–Lindau) induces an unfavorable gene expression pattern. The
list of genes
Figure with aofof
6. Deletion
Deletion log
VHL 2 fold
VHL (von ofHippel–Lindau)
(von 2Hippel–Lindau)
or higher andinduces
−2induces
or loweranwas compared
an unfavorable withexpression
genegene
unfavorable genespattern.
expression thatpattern.
have
Thea
prognostic
list of
The listgenes impact
of genes aonlog
withwith apatient’s
2 fold
log 2 foldoutcome
of 2
ofor
2 or with
higher renal
and
higher −2
and cell
−2or carcinomas
orlower was
lower was(RCC). The
compared
compared left
with
with panel
genesshows
genes that
that genes
have a
with unfavorable
prognostic
prognostic impact and
impact the right
on patient’s with favorable
outcome prognostic
with renal outcome.
cell carcinomas The The
(RCC). expression level
left panel showsafter Vhl
genes
deletion
with is plottedand
unfavorable
unfavorable as log 2 fold
the
the right
rightchange.
with
with favorable
favorable prognostic
prognostic outcome.
outcome. The expression level after Vhl
deletion is plotted as log22 fold change.
When we compare the changes in expression, we observed that Vhl‐KO cells showed reduced
When
When we
expression we
of 33compare
compare the
the changes
unfavorable changes
and inducedin
in expression,
expression,
expressionwe
we observed
observed that
that Vhl-KO
of 22 favorable genes.cells
Vhl‐KO But showed
cells showed reduced
reduced
the upregulated
expression of
expression of 33 33
moreunfavorable
unfavorable
unfavorable and induced
andgenesinduced expression
(56)expression of 22 favorable
of 22 favorable
and predominantly reducedgenes.
genes. But the
But the of
expression upregulated
upregulated
favorable
expression
genes (38) of
expression ofmore
moreunfavorable
indicates unfavorable
that, in summary,genes
genes (56) and
(56)
the and
loss predominantly
functional reduced
of predominantly Vhl reduced
in theexpression ofcells
expression
mpkCCD favorable
ofinducesgenes
favorable
an
(38) indicates that,
genes (38) indicates
unfavorable in summary, the
that, in summary,
gene expression loss of functional Vhl in the mpkCCD cells
pattern. the loss of functional Vhl in the mpkCCD cells induces an induces an unfavorable
gene expression
We
unfavorablehavegene pattern.
shown that the
expression expression of hyperosmolality induced genes is reduced in RCC
pattern.
We
We have
samples haveshown
and shown
that that
a gene the
that expression
the
signature expression of hyperosmolality
affected induced
of hyperosmolality
of osmolality genesinducedgenes
can is reduced
genes
be used is the
for in RCC
reduced samples
in RCC
prediction of
and that
samples a gene
patient’s and signature
thatoutcome
clinical of osmolality
a gene signature
[16]. We have, affected
of osmolality genes
therefore, can
affectedbe
analyzedused
genes for the prediction
can isbealso
if this used thefor of patient’s
theinprediction
case clinical
the present of
outcome
patient’s
study. We[16].
clinical
have Weoutcome
have, therefore,
generated [16].
a listWeofanalyzed
have,
genes if this
therefore,
that areis also theifcase
analyzed
upregulated thisbyin the
alsopresent
ishyperosmolality
the case study. theWe
in and havea
present
have
generated
study.
favorable ahave
list ofgenerated
Weprognostic genes thata are
outcome forupregulated
list of geneswith
patients byRCC.
that hyperosmolality
are upregulated
This list wasby and have a withfavorable
hyperosmolality
compared prognostic
and
the list ofhave
genes a
outcome
favorable for patients
that were prognostic
differentiallywith RCC.
outcome
expressed This list
for patients was
(and a with compared
RCC.change
log2 fold with the
This list
of waslist of genes
compared
at least that
1/−1) inwith were
Vhl‐KO differentially
the list
cellsof under
genes
expressed
that were (and
hyperosmotic a log2 fold
differentially
conditions. We change
expressed of
identified at least
(and 51a log 1/−1)
genes2 fold inchange
that Vhl-KO
met the cells
ofcriteria under
at least hyperosmotic
1/−1)
(Figure in
7).Vhl‐KO conditions.
cells
Only 5 genes under
were
We identified
higher 51
expressed
hyperosmotic genes that
compared
conditions. Wemet the criteria
toidentified
Scr in Vhl‐KO (Figure
51 genes 7).
cellsthat
underOnly 5 genes
methyperosmotic were
the criteria (Figure higher
conditions.expressed
7). Only compared
The5 majority,
genes were 46
to Scr inexpressed
higher
genes, Vhl-KO
were cells under hyperosmotic
compared
downregulated toinScr in Vhl‐KO
expression. conditions.
cellsagain
This underThedemonstrates
majority, 46 genes,
hyperosmotic wereofdownregulated
conditions.
that loss The
Vhl majority,
induces an in
46
expression.
genes, wereThis
unfavorable gene again demonstrates
downregulated
expression inpattern. thatThese
expression. lossThis
ofdata
Vhl induces
again an unfavorable
also demonstrates
show that Vhl gene
thathaslossanofexpression
Vhl induces
influence pattern.
an
on the
These data
unfavorable also
expression ofgene show that Vhl has
expression affected
hyperosmolality an influence
pattern. genes. on the expression of hyperosmolality
These data also show that Vhl has an influence on the affected genes.
expression of hyperosmolality affected genes.
Figure 7. Deletion of von Hippel–Lindau (Vhl) reduces expression of hyperosmolality induced genes
with favorable
Figure
with favorable prognostic
7. Deletion value.TheThe
of von Hippel–Lindau
prognostic value. list list of reduces
of(Vhl)
genesgenes that
that are (1)are (1) of
expression
inducedinduced
by by hyperosmolality,
hyperosmolality
hyperosmolality,induced (2)
genes
(2) favorable
favorable
with
for foroutcome,
favorable
patients patients outcome,
prognostic andThe
value.
and (3) (3) differentially
differentially of genesexpressed
list expressed that are in
in Vhl-KO Vhl‐KO
(1)cell withcell
induced a bywith
log a log 2 fold change
hyperosmolality,
2 fold change of 1 (2)
or
of 1 or higher
favorable
higher andfor and −1 plotted
−1patients
or are or are plotted
outcome, andhere.
here. (3) differentially expressed in Vhl‐KO cell with a log2 fold change
of 1 or higher and −1 or are plotted here.Cancers 2020, 12, 420 9 of 17
Vhl-KO reduces, for example, the expression of Fxyd2, Fxyd4, Rnf183, and Ranbp3l, which
are prognostically favorable in patients with ccRCC [16]. Since the Human Pathology Atlas does
not discriminate between the RCC entities, we have used selected genes and queried the KIRC
TCGA database if they could serve as prognostic markers for patients with ccRCC. In all cases,
high expression of these genes was associated with a significant overall survival of the patients
(Supplemental Figure S11).
Vice versa, we have also analyzed if the Vhl-KO leads to induced expression of unfavorable genes,
which are downregulated by hyperosmolality. Moreover, 20 genes showed upregulation in expression
and only 3 downregulated expression in Vhl-KO cells (Supplemental Figure S12).
3. Discussion
The CRISPR/Cas9 technology has been used in a study before to delete VHL in the RENCA renal
cancer cell line [25] where the authors described an EMT like phenotype due to a Vhl knock out.
To our knowledge, this study is the first one that used a healthy renal epithelial cell line to introduce
CRISPR/Cas9-mediated Vhl deletion and characterizes the phenotype of the cells. The limitations
of the study might be: 1. that we used renal collecting duct cells, although the ccRCC is originated
from proximal tubulus and 2. The use of a murine cell line. However, we are convinced that this was
the right strategy to test the hypothesis that Vhl function interferes with hyperosmolality affected
gene expression.
We successfully introduced mutation into the Vhl locus, leading to a frameshift and expression of
nonfunctional Vhl protein. Loss of Vhl function induced stabilization of Hif1a. The deletion of Vhl
was associated with loss of epithelial structure that is similar to the phenotype observed in RENCA
cells [25]. Similar to RENCA cells, loss of Vhl induces a more metastatic phenotype in mpkCCD cells as
they migrate faster. However, the 786-0 RCC cell line showed different behavior. Ectopic expression of
VHL was associated with an increased cell migration speed. In contrast to the cell migration analysis,
Vhl-KO cells showed a slower doubling time. There were no differences observed between 786-0 and
786-0-VHL cells. This indicates that Vhl deletion has a cell type-specific effect on cellular function.
However, the knockdown of Vhl in lung cancer cell lines showed similar effects to what we observed
in the mpkCCD cells, higher migration and lower proliferation capacity [26]. These data show that the
mpkCCD cell line is a suitable model to study the role of Vhl in renal cells. Traditionally it has been
thought that ccRCC originates from cells of the proximal tubulus [1]. However, there is also evidence
that subsets can also originate from distal tubulus or even collecting duct [27–30]. Therefore, these
studies indicate that the use of the mpkCCD cells as a collecting duct cell line might not represent a
major limitation. A mouse model using Hoxb7-Cre as driver to delete Vhl expression in the collecting
duct developed epithelial disruption, fibrosis, and hyperplasia [31]. However, Vhl deletion alone
is not sufficient and only in combination with deletion of other genetic factors it was possible to
induce ccRCC. The combined loss of Vhl, Tp53, and Rb1 induced, for example, ccRCC [32]. The same
group showed that renal Vhl deletion is associated with disturbed urine concentration capability [9].
More than 14 different cell types are involved in the urine concentration and water retention in the
kidneys representing a specific transcriptome [33]. Most of the water retention is mediated by the action
of aquaporin water channel family [10]. The driving force for water transport is a cortico-medullary
osmotic gradient. The cells of the renal medulla are faced with a hyperosmotic environment. We have
also shown that the hyperosmotic environment induces a kidney and even cell-specific gene expression
pattern [15]. In a recent study, we have shown that the hyperosmotic gene expression pattern is lost
in ccRCC samples and that this has also consequences for patients’ outcome [16]. In the mentioned
study, the initial gene list was generated in rat primary collecting duct cells [15,16] and we were able to
develop a translational comparison from healthy rat cell to human renal cancer and survival prediction,
showing the translational potential of the data [16].
In the collecting duct, the rate-limiting factor in water retention is the water channel Aqp2.
The expression of Aqp2 is downregulated in Vhl-deficient mice [9,32]. Downregulation of Aqp2 hasCancers 2020, 12, 420 10 of 17
been also shown in patient-derived ccRCC samples [34,35]. The expression of Aqp2 is regulated by the
action of Nfat5 transcription factor. Nfat5 is activated by the hyperosmotic environment [13]. The group
of Schönenberger et al. postulated that Vhl deletion induces reduction of the osmotic gradient by the
increased angiogenesis that could lead to decreased Aqp2 expression [9]. Loss of Aqp2 is also evident
in a mice model that developed renal cancer [32]. We have shown that hyperosmolality regulates the
expression of several hundred genes (including Aqp2), that this expression pattern inversely correlates
with ccRCC tumor samples, and that this can be used for prediction of cancer-specific survival [15,16].
Within this study, we have shown that Vhl deletion has a direct negative effect on Aqp2 expression.
Besides the massive morphological changes, loss of Vhl induced changes in gene expression. More than
4700 genes were differentially expressed compared to control cells under isosmotic conditions. Loss
of Vhl function was associated with more than 8500 differentially expressed genes in the RENCA
RCC cell line after CRIPSR/Cas9 deletion of Vhl [25]. Unfortunately, the total list of genes and the
used significance level is not published to compare the list of genes. However, in both cases, loss of
Vhl function alone induces massive changes in gene expression in either cancer or normal cell lines.
KEGG Pathway analysis showed that loss of Vhl affects, for example, “PI3K-Akt signaling pathway”
or “Regulation of actin cytoskeleton” pathway. Dysregulation of these pathways could explain the
observed EMT like phenotype. Since we were able to detect increased expression of selected markers
genes for EMT like fibronectin and smooth muscle actinin, no changes were observed for vimentin,
E-cadherin, or Snail1. Therefore, the observed changes might represent an incomplete EMT. Since the
expression of fibronectin is induced, the observed changes might be due to pro-fibrotic changes. Besides
Col1a1 no other classical markers like Mmp9, Timp1, or Col3a1 were induced on gene expression level.
As explained for EMT, this might indicate a partial or mild pro-fibrotic change. However, further
studies are needed to specifically analyze if the observed changes might represent incomplete EMT,
pro-fibrotic changes, or a mixture of both.
The KEGG pathway analysis might be used for the identification of novel therapeutic targets.
For example, targeting PI3K-Akt pathways has been in focus in treatment of different cancer types
including RCC [22,36]. These data show that Vhl deletion in mpkCCD cells induces a gene expression
associated with a cancer-related phenotype and this is also supported by the enrichment of genes
that are involved in “Pathways in cancer”. This is also supported by the comparison of our data
with the data from the Human Pathology Atlas [24]. Vhl deletion induced the expression of more
genes that are unfavorable and predominantly reduced expression of genes that are associated with a
favorable outcome of patients with RCC. Nonetheless, the data from the Human Pathology Atlas does
not discriminate between the RCC entities. However, the query of the TCGA KIRC cohort for selected
genes showed that they could serve as prognostic markers for patients with ccRCC.
Since the cells in the inner medulla of the kidneys are faced with a hyperosmotic environment,
we also compared the gene expression pattern in Vhl-KO and Scr cells under hyperosmotic conditions.
Several genes are regulated by changes in hyperosmolality and their expression is inversely regulated
in ccRCC samples compared to normal tissue [15,16]. For example, the expression of the E74 like ETS
transcription factor 5 is not detectable in ccRCC samples and ectopic ELF5 expression reduced tumor
development in mice [17]. This indicates that ELF5 can act as a tumor suppressor in ccRCC. We have
shown that Elf5 expression is highly induced by hyperosmotic environment [15]. The expression of
ELF5 was also inducible in the 786-0 ccRCC cell line when the cells were cultivated under hyperosmotic
conditions. However, the level of induction was even more striking in 786-0-VHL cells [16]. When we
compare the influence of Vhl on hyperosmolality affected gene expression again several thousand
genes are affected. KEGG pathway analysis showed that 4 cancer-associated pathways are within
the top 20 enriched pathways compared to one in the isosmotic comparison. There are also several
genes within the significantly downregulated genes that are known to be induced in expression by
hyper osmolality. For example, the expression of gamma subunit of Na K-ATPase (Fxyd2) and the
FXYD domain containing ion transport regulator 4 (Fxyd4) are upregulated by hyperosmolality [15,37].
The expressions of both genes are downregulated in human ccRCC and a mouse ccRCC model [32,35].Cancers 2020, 12, 420 11 of 17
Other prominent genes are the ran-binding protein 3 like (RanBP3L) or the ring finger 183 (Rnf183).
The expression of both genes is induced by hyperosmolality [15,38,39]. However, in Vhl-KO cells,
the expression of both genes is significantly downregulated. FXYD2, RanBP3L, and Rnf183 expression
level is associated with clinical outcome of patients with ccRCC [16]. This is also the case in the Vhl-KO
cells. About 51 genes that are induced by hyperosmolality and have a favorable outcome for patients
with RCC are differentially expressed in Vhl-KO vs. Scr cells under hyperosmotic conditions and
46 of them are downregulated in expression when Vhl function is missing. We have shown that the
expression of hyperosmolality affected genes are inversely regulated in ccRCC samples and that high
expression of genes in patients, which are downregulated by hyperosmolality, have an unfavorable
outcome [16]. These data show that Vhl-KO cells under hyperosmotic conditions express a gene
expression pattern that is described to be unfavorable for patients with ccRCC. These data also support
our hypothesis that loss of Vhl function is associated with disturbed hyperosmotic adaptation capacity,
as it is shown by differences in proliferation and migration capacity. Of course, we have to be aware
of the fact that up to 30% of patients with ccRCC have functional VHL protein or at least no genetic
alterations that would affect the functional expression of VHL.
The main transcription factor that is activated under hyperosmotic condition is Nfat5 [40], inducing
the expression of osmoprotective genes [41]. As an example, NFAT5 induces the expression of the solute
carrier SLC6a12 [41] and the expression of Slc6a12 is massively downregulated in Vhl-KO cells (log2
fold change of −3.3). This implicates that probably loss of Vhl function has an influence on Nfat5 activity.
Nfat5 has also a function in the immune system for the macrophage and T lymphocyte function [42],
and haploinsufficiency is associated with immunodeficiency [43]. However, the role of Nfat5 in cancer
is controversial. Nfat5 deficiency promoted hepatocellular carcinogenesis and metastasis [44] in one
study. Another study showed that Nfat5 promoted apoptosis and inhibited invasion in hepatocellular
carcinoma cell lines [45]. A further study reports that S100a4 protein promoted proliferation and
migration of ccRCC cell line through NFAT5 [46]. A recent study showed that NFAT5 is a target of
metabolically active micro RNAs (miRNA) [14]. The gene expression of NFAT5 is downregulated in
ccRCC samples compared to normal tumor samples [14] as well as expression of NFAT5 target genes.
The authors postulate that the miR-106b-5p and miR-122-5p are involved in the downregulation of
NFAT5 and also downstream of NFAT5 target genes [14]. However, VHL-dependent regulation of
NFAT5 remained unclear. Our data indicates at least an interaction of VHL and NFAT5 functions and
further analysis are needed to identify the molecular mechanisms in more detail. Since Vhl deletion
alone did not induce renal cancer in mice model, it might be interesting to test if a Vhl/Nfat5 double
KO develops renal cancer.
Taken together, we have shown that Vhl deletion in collecting duct cells induces an EMT like
phenotype, an unfavorable gene expression pattern, and that loss of Vhl function significantly regulates
the expression of hyperosmolality expressed genes that are favorable prognostic markers for patients
with ccRCC.
4. Material and Methods
4.1. Cell Culture
HEK293T cells were obtained from the DSMZ-German Collection of Microorganisms and Cell
Cultures and cultivated in Dulbecco’s Modified Eagle’s Medium (DMEM) supplemented with
10% serum (fetal calf serum (FCS)) and 1% penicillin/streptavidin. The 786-0 and ectopic VHL
expressing 786-0-VHL cells were a kind gift of Prof. Barbara Seliger [47]. These cells were
maintained in DMEM supplemented with 10% fetal calf serum (FCS), 2 mM glutamine, 1 mM
pyruvate, and 1% penicillin/streptomycin. The mpkCCD cell line was a kind gift of Prof. Mark
Knepper [48]. These cells were cultivated in DMEM Ham F-12 medium supplemented with 10%
FCS and 1% penicillin/streptavidin. All cell lines were cultured at 37 ◦ C and 5% CO2 . The mediumCancers 2020, 12, 420 12 of 17
osmolality was adjusted to 600 mosmol/kg by the addition of 100 mM NaCl and 100 mM urea to the
corresponding medium.
4.2. Oligos and Primers
The selection of the sequences for the guide RNAs (gRNA) targeting Vhl was performed according
to the DNA 2.0 online tool [49] Three different sequences were selected (Supplemental Table S1).
Real-time PCR primers and the PCR primers for amplification of the targeted Vhl locus were designed by
NCBI Primer BLAST [50]. All oligos were purchased from Biolegio B.V. (Nijmegen, The Netherlands).
4.3. Cloning of gRNAs and Vector Production in Escherichia coli
Three different gRNAs targeting murine Vhl locus and random scrambled (Scr) gRNA were cloned
into lentiCRISPRv2. The lentiCRISPR v2 was a gift from Feng Zhang (Addgene plasmid # 52,961;
Addgene, Watertown, MA, USA). The cloning was performed as described [49]. Plasmid isolation was
performed using GeneJET Miniprep Kit (Thermo Scientific, Waltham, MA, USA). Isolated plasmids
were analyzed by Sanger sequencing (Eurofins Genomics, Ebersberg, Germany) using human U6
primer. Positive plasmids were used for further experiments.
4.4. Vectors
The lentiviral particles were produced in HEK293T cells. For the production, the pLP1, pLP2,
and pLP/VSVG vectors were used from ViraPower™ Lentiviral Packaging Mix (Thermo Fisher,
Waltham, MA, USA). The HEK293T cells were cultivated to 70% confluency. Cell culture medium was
reduced to starve cells and then lentiviral vectors pLP1 (7.2 µg), pLP2 (2.4 µg), pLP/VSVG (4.0 µg),
and ligated lentiCRISPRv2 vector (10.4 µg) were added to the medium together with transfection
reagent Turbofect™ (Thermo Fisher). Cells were incubated for 24 h. After exchange, medium cells
were incubated for another 48 h. The conditioned virus-containing medium was removed, sterile
filtrated, and kept at −20 ◦ C.
4.5. Viral Transfection of mpkCCD Cells and Sequencing of Vhl Locus
The mpkCCD cell line was seeded into 6-well cell culture dishes and cultivated to 40–50%
confluency. Medium was removed and conditioned medium containing the virus particles and fresh
medium in a 1:1 ratio was added. After 48 h, medium containing 2 µg/mL puromycin for selection of
transduced cells was added. Genomic DNA was isolated and targeted genomic regions were amplified
by PCR using specific primers. The PCR products were purified using GenElute™ PCR Clean-up Kit
(Sigma Aldrich, St. Louis, MO, USA) and analyzed by Sanger sequencing using the sequencing service
of Eurofins Genomics GmbH (Eberberg, Germany).
4.6. Isolation of Single-Cell Clones and Tracking of Indels (TIDE)
Single-cell clones were isolated in 96-well cell culture plates by serial dilution. Total DNA
was isolated and the targeting region was amplified by PCR and analyzed by Sanger sequencing.
The sequences were analyzed by TIDE for the identification of specific mutations of Vhl gene [20]. Single
clones harboring frameshift mutations on both alleles were finally selected and used for further analysis.
4.7. Western Blot
Total protein was isolated from cells using Pierce® RIPA lysis and extraction buffer with protease
inhibitor mix (40 µL/mL, Thermo Fisher Scientific, Waltham, MA, USA). Protein lysates were separated
by SDS-PAGE with 4–12% Novex™ Bis-Tris gradient gel (Thermo Fisher Scientific). Separated protein
bands were then blotted onto 0.45 µm nitrocellulose membrane by Western blotting. Successful blotting
was confirmed by Ponceau S staining. All washing steps of the membrane were performed with
phosphate buffered saline + 0.1% Tween 20 (PBST). Unspecific binding sites were blocked with 5% BSAYou can also read