Quantifying the factors influencing people's car type choices in Europe - Results of a stated preference survey
←
→
Page content transcription
If your browser does not render page correctly, please read the page content below

Quantifying the factors
influencing people’s car type
choices in Europe
                    Results of a stated
                    preference survey

                    Gómez Vilchez, J., Harrison, G.,
                    Kelleher, L., Smyth, A., Thiel, C.

                    with contributions from
                    Lu, H. and Rohr, C.

                    2017

                                                         EUR 28975 EN
This publication is a Science for Policy report by the Joint Research Centre (JRC), the European Commission’s
science and knowledge service. It aims to provide evidence-based scientific support to the European
policymaking process. The scientific output expressed does not imply a policy position of the European
Commission. Neither the European Commission nor any person acting on behalf of the Commission is
responsible for the use that might be made of this publication.

JRC Science Hub
https://ec.europa.eu/jrc

JRC109452

EUR 28975 EN

 PDF        ISBN 978-92-79-77201-6        ISSN 1831-9424        doi:10.2760/695017

 Print      ISBN 978-92-79-77200-9        ISSN 1018-5593        doi:10.2760/98060

Luxembourg: Publications Office of the European Union, 2017

© European Union, 2017

Reuse is authorised provided the source is acknowledged. The reuse policy of European Commission documents
is regulated by Decision 2011/833/EU (OJ L 330, 14.12.2011, p. 39).
For any use or reproduction of photos or other material that is not under the EU copyright, permission must be
sought directly from the copyright holders.

How to cite this report: Gómez Vilchez, J., Harrison, G., Kelleher, L., Smyth, A., Thiel, C. with contributions
from Lu, H. and Rohr, C., Quantifying the factors influencing people’s car type choices in Europe: Results of a
stated preference survey, EUR 28975 EN, Publications Office of the European Union, Luxembourg, 2017, ISBN
978-92-79-77201-6, doi:10.2760/695017, JRC109452

All images © European Union 2017

Quantifying the factors influencing people’s car type choices in Europe
This study aims at tracking the evolution of the attitude of car drivers towards electro-mobility. The results of a
new survey conducted in six European countries are shown. The purchase price continues to represent the
major hurdle to widespread adoption of zero tailpipe emission cars.
Contents

Acknowledgements ................................................................................................ 1
Executive summary ............................................................................................... 2
1 Introduction ...................................................................................................... 4
2 Survey design ................................................................................................... 5
   2.1 Description of the approach .......................................................................... 5
   2.2 Sample representativeness ........................................................................... 6
       2.2.1 Socio-economic characteristics .............................................................. 6
       2.2.2 Car ownership and travel patterns ......................................................... 9
   2.3 Respondents’ engagement in the stated choice experiments ........................... 11
       2.3.1 Influence of attribute levels on choices ................................................. 11
       2.3.2 Trading behaviour across alternatives .................................................. 12
3 Key survey results ........................................................................................... 13
   3.1 Comparing the results of the 2012 and 2017 surveys ..................................... 13
   3.2 Novel insights ........................................................................................... 16
4 Conclusions .................................................................................................... 18
   4.1 Summary and concluding remarks ............................................................... 18
   4.2 Limitations and further research .................................................................. 18
References ......................................................................................................... 20
List of abbreviations and definitions ....................................................................... 23
List of figures ...................................................................................................... 24
List of tables ....................................................................................................... 25
Annexes ............................................................................................................. 26
   Annex 1. Survey questionnaire .......................................................................... 26

                                                            i
Acknowledgements
This study was supported by RAND Europe researchers [Dr. Hui Lu and Charlene Rohr].
RAND Europe is an independent not-for-profit research institute whose mission is to help
improve policy and decision making through research and analysis.
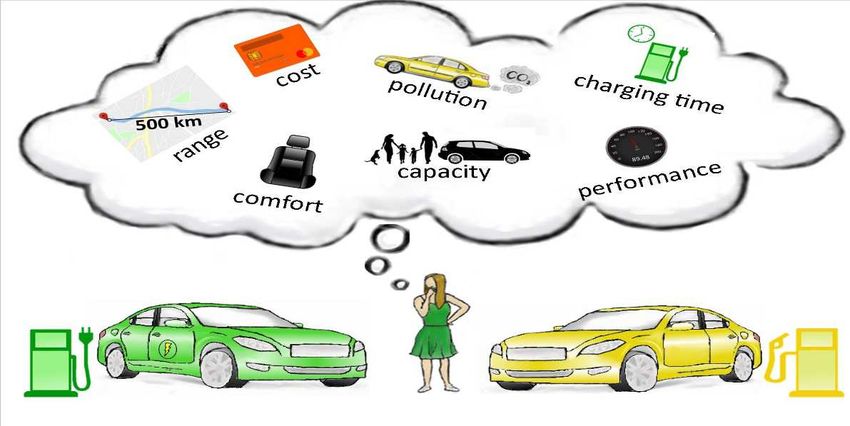
We gratefully thank Federica Tenuta for having designed the cover image of this report
during her school traineeship at the Sustainable Transport Unit of the Joint Research
Centre (JRC).
Authors
Gómez Vilchez, Jonatan (JRC)
Harrison, Gillian (University of Leeds)
Kelleher, Luke (University of Hertfordshire)
Smyth, Austin (University of Hertfordshire)
Thiel, Christian (JRC)
Contributors
Lu, Hui (RAND Europe)
Rohr, Charlene (RAND Europe)
1
Executive summary
In this study, the results of a new survey on attitudes and preferences towards electric
vehicles (in this case synonymous with battery electric vehicles) are reported. In
addition, these results are compared with those of a similar survey conducted in 2012, so
that the evolution of preferences towards electric cars by European drivers can be
mapped.

Policy context
The transition to a low-carbon economy is a key political priority for the European
Commission. Low- and zero-emission vehicles will need to become a widespread reality in
Europe (EU, 2017a).
The CO2 standards for cars and vans (EU, 2014a) (EU, 2014b) (EU, 2017b) have an
impact on low- and zero-emission vehicle models offered in the market. Incentives for
these technologies, available in several Member States, can improve the value
proposition these vehicles have for consumers (EU, 2017c).
The Directive (2014/94/EC) and its related Action Plan (EU, 2017d) aim to address
refuelling infrastructure needs for the deployment of alternative fuels (EU, 2014c). To
promote the mass adoption of electric and fuel cell cars, a better understanding of
consumers’ attitudes and preferences is needed.

Key conclusions
The fact that almost half of the survey sample never chose an electric or fuel cell car as
option for their next car purchase in the stated choice experiments leads to the key
conclusion that zero tailpipe emission cars still face certain acceptance challenges in
Europe.
The purchase price continues to represent the major hurdle to widespread adoption of
these powertrains. Other reasons, the respondents mentioned for not buying electric
cars, were: lack of recharging infrastructure, short range, little model choice. Policies
may help to overcome these challenges.
Furthermore, in general, attitudes towards electric cars in Europe have remained
relatively stable in the last five years. Because of the size of the sample, knowledge gaps
and uncertainties about the attitudes and preferences of European drivers towards low-
and zero-emission vehicles remain.

Main findings
In comparison with the results of the 2012 survey, the proportion of consumers strongly
agreeing with the statement that electric cars are currently quite expensive has declined
during the past five years. This could be attributed to an improvement of the cost
competitiveness of this technology in the last five years together with the introduction of
purchase subsidies (e.g. in Germany and Spain, in addition to the then already existing in
France and the UK) that lowers their price tag.
A second finding shows that the proportion of the surveyed drivers that strongly agree
with the statement on the operating cost of electric cars (“100km costs less than 2
Euros”) has increased over time. Thus European drivers seem to better appreciate now
the economic advantage of using electricity over conventional fuels in electric cars.
A third finding relates to the fact that the consumer awareness on the environmental
benefits of electric cars (“Electric cars have no tailpipe emissions”) compared to
conventional cars seems to have worsened, due to an increase in ‘do not know’ answers.
This may be a sign of growing consumer awareness on life cycle emission aspects,
although the question was limited to tailpipe emissions. In this context it may become
important to explain the role of the European policy mix to ensure decarbonisation across
sectors and ensuring that emissions are not shifted from one sector to another (EU,

                                            2
2016). Indeed, zero-emission vehicles could help accelerating the decarbonisation of the
power sector (Thiel et al., 2016).

Related and future JRC work
Future work involves the econometric estimation of discrete choice models that quantify
the factors influencing people’s car type choices and the embedment of this information
into the JRC in-house Powertrain Technology Transition Market Agent Model (PTTMAM)
(Harrison et al., 2016).

Quick guide
This study is based on a stated preference survey consisting of two stated choice
experiments, in which respondents were asked to choose between different types of cars,
with a focus on electric vehicles. In this report, electric vehicles refer to battery electric
vehicles and plug-in hybrid electric vehicles. The survey was conducted in France,
Germany, Italy, Poland, Spain and the UK. In total, 1,248 European car owners
answered a questionnaire that contained 23 questions, including those of an attitudinal
nature and questions related to the demographic and lifestyle characteristics of the
respondent.

                                              3
1 Introduction
Transport decarbonisation requires the deployment and widespread adoption of cleaner
vehicle powertrain technologies. There is a need to better understand the factors that
influence people’s vehicle type choices. Alternative fuel vehicles (AFVs) such as liquefied
petroleum gas (LPG), compressed natural gas (CNG) and flexible-fuel vehicles (FFVs)
powered by biofuels are beyond the scope of this report. This report focuses on private
passenger cars, so excluding attitudes of those who manage business fleets.
Increasing our knowledge of people’s attitudes and preferences, specifically towards
electric vehicles (EVs), helps us in our task to scientifically support transport-related
policy making of the European Commission (EC). In particular, understanding the
influence of car attributes such as range and recharging time on the attractiveness of
electric cars, as perceived by consumers, makes a contribution towards determining
recharging infrastructure needs in the market. The link between refuelling/recharging
infrastructure and car demand is characterised as a ‘chicken-and-egg’ problem (Achtnicht
et al., 2012). At the European Union (EU) level, the Directive (2014/94/EC) on the
Deployment of Alternative Fuels Infrastructure (AFI) aims to address infrastructure needs
for the deployment of alternative fuels, including electricity (EU, 2014c). Recently, the EC
has adopted the ‘Clean Mobility Package’ that includes an action plan and investment
solutions for the trans-European deployment of AFI (EC, 2017).
In 2012, the JRC published a study (Thiel et al., 2012), based on a survey conducted
that year, that aimed at:
1. Testing the familiarity of car drivers with EVs;
2. Investigating consumers’ interests to purchase an EV; and
3. Inquiring about car owners’ priorities for improving the features of current EVs.
The present report, to some extent a follow-up of that study, has the objective of
tracking the evolution of the attitudes of European car drivers towards electro-mobility by
incorporating the results of a survey conducted in 2017. This new survey deviates from
previous work in two significant ways:
1. It does not seek to elicit priorities for improving the features of EVs; and
2. It serves as a basis for further work, to be reported as econometric output
   separately.
In the 2012 survey, six European countries were chosen as a proxy for the 28 Member
States (MS) of the European Union (EU28): France (FR), Germany (DE), Italy (IT),
Poland (PL), Spain (ES) and the United Kingdom (UK). In the new survey, the same
countries were again selected. Whereas these countries accounted for more than 75% of
new car sales in the EU in 2011 (Thiel et al., 2012); they held a market share of ca. 78%
in 2016 (ACEA, 2017a).
This report is structured as follows. After the introduction, section 2 describes the survey
design. In section 3, a comparison of the results of the 2012 survey is made with the
results of the 2017 survey. Conclusions are drawn in section 4. An annex showing the
actual questionnaire completes this report.

                                             4
2 Survey design
Three aspects of survey design are described in this section: the approach adopted to
carry out the survey, the degree of representativeness of the survey and the level of
respondents’ engagement in the stated choice (SC) experiments.

2.1 Description of the approach
This study is based on a new stated preference (SP) survey that incorporated two SC
experiments. In an SC experiment, respondents are asked to choose between two or
more alternatives described by their key attributes. In this study, respondents
participated in two experiments. First, they were asked to make choices between two
generic (unlabelled) car type alternatives, described by key car type attributes (SP1).
The aim of this experiment was to provide information on the relative importance of
different car type factors. Second, they were asked to choose between a range of
different car types, described by their specific attributes, e.g. purchase price, range
(SP2). The aim of this experiment was to collect information on their preferences for
different car types and to quantify substitution rates between the different alternatives.
In the survey, each respondent was presented with eight different SP choice tasks (four
choices for SP1 and four choices for SP2).
Based on the outcomes of a literature review (Jensen et al., 2013) (Hackbarth and
Madlener, 2013) (Franke and Krems, 2013) (Kim et al., 2014) (Hoen and Koetse, 2014),
the following six car attributes were identified as being important in consumers’ car type
choices and were therefore included in SC experiments: purchase price, operating cost,
depreciation, range, refuelling/recharging times and emissions. Three car sizes were
considered: small, medium and large. In order to reduce the cognitive burden on
respondents, the second experiment considered five car alternatives only: internal
combustion engine (ICE)-petrol, ICE-diesel, hybrids (conventional or plug-in hybrid
(PHEV)), battery electric (BEV) and hydrogen fuel cell (FC).
The questionnaire contained 23 questions, including those of an attitudinal nature and
questions related to the demographic and lifestyle characteristics of the respondent,
including gender, age group, household income and residential location by area type as
well as car ownership profile. Education attainment was used as a surrogate for
propensity to adopt EVs.
The questionnaire of the 2012 survey was answered by 3,723 respondents, ranging from
548 in Poland to 716 in the UK. In the 2017 survey, 1,248 respondents answered the
questionnaire (see Table 1). Therefore, the size of the sample of this study is smaller,
almost a third, than the one on which the 2012 study was based. Whereas IPSOS was
chosen in 2012, the 2017 survey was conducted by Gesellschaft für Konsumforschung
(GfK).

Table 1. Number of respondents in 2012 and 2017, by country

                    FR              DE              IT            PL        ES    UK

   2012             623            606             613          548(*)      617   716

   2017             200            200             248            200       200   200
(*) A section of this Polish survey was answered by only 397 respondents.
Source: (Thiel et al., 2012) and survey results (N=1,248).

The new survey was conducted in June 2017. The questionnaire was made available to
respondents in the national languages of all countries surveyed in order to maximise
respondent engagement and understanding. Budget constraints limited the design of the
questionnaire so that it could be completed within 10 minutes. A pilot survey of 30

                                                      5
respondents was     undertaken     in   the UK       to test    the    questionnaire and    survey
methodology.

2.2 Sample representativeness
How representative can the survey presented in this report be considered? The aim of
the sampling approach specified by the research design was to secure a broadly
representative sample. The respondents were recruited from online panels, with the
survey being conducted using computer assisted web interviewing (CAWI). However,
members of such panels are usually not recruited in a random fashion. An evident
feature of web-based surveys is a bias towards certain groups in the population. Often in
their raw form the datasets are not designed to be wholly representative of relevant
‘populations’ but typically require application of weights or other tools to ensure they are
robust for an intended purpose.
The sampling approach adopted for this study involved using a random sampling
approach applied to national online panels using the GfK network. To participate in the
survey respondents had to own a car. The sample design is therefore not intended to be
representative of the wider population, but rather of households owning cars. The
samples were drawn by setting target quotas by age, gender and educational level.
Respondents entered the sample when they passed the demographic and car ownership
screening questions and completed the questionnaire.
Statistical tests (encompassing a combination of parametric and non-parametric
indicators including binomial, chi square and t-tests) have been undertaken for
differences between sub-samples, the panel and, where comparable official data was
readily available, for wider national statistics.

2.2.1 Socio-economic characteristics
The type of location where people live is expected potentially to have a significant impact
on the EV car market. Overall, nearly 40% of respondents lived in urban areas with
population greater than 200,000, with 11.6% living in large urban areas with population
more than 1 million. The distribution of responses from the online sample is shown in
Figure 1.

       Figure 1. Distribution of population by area where the household lives, by country

                                             (*) 2015.
                            Source: (Eurostat, 2017) and survey results.

The sample from Spain shows a higher proportion of respondents living in urban areas,
compared to the other countries. Almost one third of respondents lived in non-urban
areas, with higher proportions of respondents in France and Italy. Though the differences
are not dramatic, urban households tend to be unrepresented compared to the

                                                 6
population as whole for the UK, France Germany and Italy, while the opposite is the case
for Poland and Spain. This may suggest differences in the distribution of car ownership
and non-car owning sections of the population and yet further differences between these
patterns in more affluent MS and other countries.
Figure 2 shows the distribution of the sample and population by gender. As can be seen,
the sample is representative of the total population by gender.

                     Figure 2. Distribution of population by gender, by country

                                                (*) 2016.
                               Source: (Eurostat, 2017) and survey results.

Table 2 shows the age profile. It seems that the sample is broadly consistent with what
can be expected for the household car owning population groups in the respective
countries.

Table 2. Age distribution of population, by country

                      Age            FR          DE           IT              PL       ES     UK

                     18-34
                                  26.0%        24.0%        20.2%       30.0%        24.0%   28.5%
                     years

    Survey           35–54
                                  34.0%        34.5%        42.7%       33.5%        38.0%   34.5%
    sample           years

                       55+
                                  40.0%        41.5%        37.1%       36.5%        38.0%   37.0%
                      years

                     18–34
                                  25.9%        24.5%        21.7%       29.5%        23.1%   28.6%
                     years

  Observed           35–54
                                  33.9%        34.0%        36.6%       33.3%        39.3%   34.1%
proportions(*)       years

                       55+
                                  40.2%        41.5%        41.7%       37.2%        37.6%   37.3%
                      years
(*) 2016.
Source: (Eurostat, 2017) (% shown based on population aged 18+ years) and survey results.

Education attainment was included explicitly in the survey instrument design as
surrogate for both income and likely attitude towards mass adoption of EVs. The sample
from France, Poland and Spain contained higher proportions of respondents who had

                                                    7
‘elementary (primary) school education or less’. The sample from Italy also had much
lower proportions who completed secondary school or achieved university graduation.
Figure 3 shows the proportion of the population achieving graduation at tertiary level.
Inspection of the data on educational attainment among respondents compared to
national data for graduation rates at tertiary level suggests the samples for the UK,
Germany, Poland and Spain are broadly representative of the wider populations in those
countries. It also seems reasonable to assume that the samples are broadly
representative of the educational attainment levels of the car owning sections of their
respective populations.
Figure 3. Distribution of population achieving graduation at tertiary level, by country
(*) 2014. (**) Observed proportion for France not available (N/A).
Source: (OECD, 2017) and survey results.
Given the importance of income in understanding developments in the car market,
respondents were requested to provide an estimate of their households combined yearly
income (before tax), in the currency of their country. Respondents were then classified
into eight separate income categories (including a ‘Prefer not to say’ category). Their
responses are summarised for Eurozone MS in Table 3.
Table 3. Household income distribution in the survey sample for Eurozone MS
Income level FR DE IT ES
Up to EUR 11,999 10.0% 3.5% 13.7% 4.5%
EUR 12,000 – EUR 17,999 12.0% 7.5% 12.5% 13.5%
EUR 18,000 – EUR 29,999 27.5% 15.5% 27.8% 20.5%
EUR 30,000 – EUR 39,999 19.5% 17.0% 17.8% 18.5%
EUR 40,000 – EUR 59,999 16.0% 20.0% 9.3% 15.0%
EUR 60,000 – EUR 89,999 4.5% 12.5% 4.0% 12.0%
EUR 90,000+ 1.0% 5.5% 2.0% 2.0%
Prefer not to say 9.5% 18.5% 12.9% 14.0%
Source: Survey results.
82.2.2 Car ownership and travel patterns
Below Figure 4 displays national statistics for car ownership and household
characteristics. Inspection of the sample data and available national statistics, statistical
tests and a sense check across the selection of countries suggests, on the basis of the
indicator ‘cars per household’, that the samples drawn from the national panels are
typical of conditions applying to each of the MS surveyed.
Furthermore, around 6% of respondents have access to a personal company car, 5%
have access to a car pool for employees and a very small number of respondents are
self-employed with a company car.
Figure 4. Cars per household, by country
(*) 2015 and 2016.
Source: (Eurostat, 2017) and survey results.
With regards to car size, respondents in Italy owned the highest proportion of small cars,
respondents in Germany and Poland owned the highest proportion of medium-sized cars
and respondents in Spain owned the highest proportion of large cars. The survey sample
appears to underrepresent small cars, although generally the representation is in the
right order of magnitude across the countries. The distribution of respondents (N=1,248)
by the size of the car they owned at the time the survey was conducted can be seen in
Figure 16 (see section 3.2).
Figure 5. Distribution of new versus second-hand car purchase, across all surveyed countries
(*) 2010. (**) Data for Poland was N/A.
Source: ACEA/National Trade Bodies in (BCA, 2012) and survey results.
9Respondents were invited to indicate whether their last car purchase was a new or
second-hand car. The distribution of responses can be seen in Figure 5. A larger
proportion of the survey sample report that they last purchased a new car compared to
general market data (although it is noted that these data are from 2010). Whereas
respondents in Italy and Spain were much more likely to purchase new cars, respondents
in Poland were much more likely to purchase second-hand cars.
The next two figures do not intend to measure the degree of representativeness of the
sample, but provide information on the travel patterns of the respondents. Given the
importance of car ownership for commuting, respondents were asked whether they
usually commute by car. Nearly half of the respondents commute by car every weekday.
As illustrated in Figure 6, very small proportions never or hardly ever commute by car,
except in the UK and Spain.
Figure 6. Commuting by car, by country
Source: Survey results.
Respondents were also asked about their regularity of travel to large urban areas, which
could influence perceptions of charges introduced in such areas for car travel (particularly
in the SP2 experiment). Around 40% of respondents regularly (i.e. 2-3 times per week)
travel to a large urban area (population greater than half a million). Figure 7 shows the
results by country.
Figure 7. Regularity of travel to large urban areas, by country
Source: Survey results.
102.3 Respondents’ engagement in the stated choice experiments
Two measures to examine respondents’ engagement in the SC experiments were
explored. The first one looked at the influence of attribute levels on the choices that the
respondents made. Secondly, trading behaviour across alternatives was investigated.
2.3.1 Influence of attribute levels on choices
One way to examine respondents’ engagement in the SC experiment is to look at
respondents’ sensitivities to changing attribute levels in the choices they made. As an
example, the variable ‘purchase price’ is considered.
Figure 8 presents the proportion of respondents that chose an alternative at a specific
purchase price level in the first SC experiment, in each of the countries sampled. It is
emphasised that in the choices the other attributes are also varying, and this is not taken
into account in the figure (but was taken into account in the modelling analysis). The
vertical axes of the charts show the proportion of respondents choosing an alternative;
the horizontal axes are the purchase price levels included in the SP1 experiment for each
car size. As can be seen, the impact of purchase price is as expected, i.e. as the
purchase price increases, the percentage of the respondents that selected the option
decreases, especially for the small and medium-sized car. This pattern occurs across all
six countries.
Figure 8. Influence of purchase price levels on stated choices, by country
FR DE
IT PL
ES UK
Source: Survey results.
112.3.2 Trading behaviour across alternatives
With a focus on the SP2 experiment, the extent to which respondent’s choices varied
across the five alternatives in the choice scenarios is explored. Figure 9 presents the
percentage of respondents who always selected the same alternative across the choices
presented in the experiment. Over 20% of respondents did this for petrol cars in the UK.
The proportions of respondents who always chose hybrid, BEV and FC cars are relatively
low. However, none of these proportions is very high, suggesting substantial trading
within the experiment.
Figure 9. Proportion of respondents who always choose one alternative, by country
Source: Survey results.
Furthermore, Figure 10 summarises in country-specific Venn diagrams the trading
behaviour across the five different car alternatives (aggregated into three classes). The
overlap area in the diagrams show the proportion of respondents who switch between the
car types within the experiment. In all the six countries nearly a third of people always
selected ICE cars. Smaller proportions are found for hybrid than for zero emission cars.
Overall, a relatively good balance of trading different car types can be observed.
Figure 10. Trading behaviour across alternatives, by country
FR DE IT
PL ES
UK
Source: Survey results.
123 Key survey results
The results of the survey reported here cover two facets. Firstly, a comparison with the
results of the 2012 survey is made. Secondly, novel insights are given.
3.1 Comparing the results of the 2012 and 2017 surveys
Before comparing the results of both surveys, it is salutary to take stock and examine the
role of expectations. In the 2012 survey, respondents were asked to communicate their
expectations about the percentage of electric car sales in the next 10 years. From that
question, mean values were calculated for each country. Figure 11 shows these, together
with 2012-2017 data from (EAFO, 2017). It is unknown whether 2012 survey
respondents had in mind a linear or a non-linear market uptake between 2012 and 2022.
What is clear is that, after five years, growth in the percentage of electric car sales has
taken place (albeit marginal in Italy and Poland). However, if the expectations the
respondents from the 2012 survey had are to be met, faster sales growth is needed in
the next five years to meet the 2022 expected levels.
Figure 11. Expectations in 2012 on EV market uptake by 2022 versus data
Source: (Thiel et al., 2012) (N=3,723) and (EAFO, 2017) [as of October 2017].
The questionnaire used in the 2017 survey (see Annex 1) is an amended version of the
one employed in the 2012 survey (cf. Annex in (Thiel et al., 2012)). Therefore, both
surveys are, strictly speaking, not comparable. Despite this, a comparison of the results
of both surveys, which took place in a time span of ca. five years, is deemed to be a
useful exercise.
In 2012, 46% of the respondents declared that they were “not at all familiar” with
electric cars. Particularly high percentages were found among French and British
respondents. In 2017, this question was not asked because of the aforementioned time
limit. However, in theory European car drivers should have become more familiar with
this technology since then, for more recharging stations are visible in public areas, more
models are now available in the market and registrations of electric cars have gathered
pace in the last two years (see (EAFO, 2017)).
In the 2012 survey, respondents were asked to indicate the level of agreement with a set
of statements, with answers ranging from 1 (the highest level of disagreement) to 10
(the highest level of agreement). In the new survey, five of these statements were
retained and the results across all countries are shown in Figure 12:
— “Electric cars have no tailpipe emissions”: 63% of the sample strongly agreed;
13— “The charging time is never less than 30 minutes”: 38% of the sample strongly
agreed;
— “Electric cars run for a maximum of 150 km between charges”: 33% of the sample
strongly agreed;
— “Driving 100 km on an electric car costs less than 2 euros”: 31% of the sample
strongly agreed; and
— “Electric cars are currently quite expensive”: 69% of the sample strongly agreed.
Figure 12. Percentage of agreement with key statements in 2012 versus 2017
Source: (Thiel et al., 2012) (N=3,572) and survey results (N=1,248).
In both 2012 and 2017, a substantial proportion of respondents agree with the statement
that electric cars are expensive and that they have no tailpipe emissions. Across the five
statements there is a substantial proportion of respondents who indicated ‘don’t know’,
both in 2017 and 2012. Interestingly, the proportions who answer ‘don’t know’ are very
similar between the two time periods. The lowest level of ‘don’t know’ responses are
observed for the statements on whether electric cars are expensive or whether they have
no tailpipe emissions. The highest levels are around operating costs levels. The highest
levels of ‘don’t know’ responses were observed in the UK (not shown) for all of the
statements.
Figure 13. Top factors in car choices across all surveyed countries
Source: (Thiel et al., 2012) (N=3,572) and survey results (N=1,248).
14Respondents were then asked to indicate the top three factors that would be important to
them when choosing a car. Their responses, aggregated across countries, are shown in
Figure 13. In this figure, the 2017 values refer to ‘first choices’ (the 2012 values reflect
the ‘most chosen improved feature’, which was the wording used in the 2012 survey).
The top factor was purchase price, which was chosen by 77% of respondents across all
countries as their first choice (interestingly but not shown in that figure, it was never
chosen as a second or third choice). The priority of this factor was consistent across
countries. Further, fuel costs and maintenance costs become important in the second
choices (not shown), followed by brand/manufacturer. Again, these patterns were quite
consistent across countries (although more Polish respondents report maintenance costs
to be important compared to fuel costs).
A range of other factors become important in the third choices, including maintenance
costs, insurance costs, brand/manufacturer, perceived reliability, safety rating and
comfort. It is noteworthy that some of the choice considerations widely associated with
EVs did not emerge as particularly significant when consideration is not focused explicitly
on such vehicles. In particular driving range, recharging time and access to recharging
infrastructure did not generate high ratings. Maximum speed and, especially, recharging
availability were identified as influencing factors in 2012 but not in the 2017 survey. In
fact, all top factors were cost-related in the new survey. In contrast, charging-related
factors featured more prominently in the 2012 survey results. In both surveys, range
appeared to be more important for respondents than recharging time.
Figure 14. Share of respondents who never chose an electric or fuel cell car, by country
Source: Survey results.
In the second SC experiment, it is noteworthy that 46% of the sample did not select
electric or FC cars. This information can be seen by country in Figure 14. If respondents
never chose an electric or FC car, they were asked to provide a reason from a pre-
defined list. The reported reasons for not choosing these alternatives are shown in Figure
15 (see Annex 1 for an accurate description of the stated reasons). In all the surveyed
countries, the most important reason for not choosing electric or FC cars was the
purchase price. This was followed by the risk of limited recharging opportunities when
travelling for Polish, German and British respondents and insufficient driving range for
German and French respondents. The concern over excessively long recharging times
was also pointed out, particularly by German respondents. When asked for reasons why
people didn’t purchase EVs in 2012, the purchase price was also the main reason,
followed by issues with the battery (mainly related to recharging time and longevity).
Since purchase subsidies for electric cars lower the purchase price of these powertrains,
the respondent’s views on purchase subsidies for electric cars is of interest. A question
on this was asked in 2012 and retained in the 2017 survey. The results will be reported
in a separate publication.
15Figure 15. Reported reasons for not choosing electric or fuel cell cars, by country
Source: Survey results.
3.2 Novel insights
This section centres on new information that was not gathered in the 2012 survey.
Although the next figures provide insights into the surveyed European markets in general
(that is, they do not address electric cars directly), they do have implications for new
sales of low-emission and zero tailpipe emission cars.
Figure 16 shows the distribution of respondents by the size of the car they owned at the
time the survey was conducted as well as the size the respondent would probably
purchase, if they were to purchase a new car. Across all countries, a reduction in
reported purchases of small cars compared to the size of currently owned cars can be
seen, and an increase in medium-sized cars (except Poland), with a small increase in
large cars (mixed across countries).
Figure 16. Distribution of car sales by size, data versus sample (current and future)
(*) Data refers to 2016 (average excluding Poland, which was N/A).
Source: (ACEA, 2017b) and survey results (N=1,248).
Respondents were also asked when they would be likely to purchase their next car.
Nearly half of the respondents indicated that they were planning to purchase a new car in
the next two to five years (see Figure 17). Circa 22% were planning to purchase their car
in the next year, with more respondents in Italy planning to purchase a new car in the
next year and fewer in Germany and Spain. Nearly 15% indicated that they do not plan
to replace their car.
16Figure 17. When respondent is planning to purchase their next car, by country
Source: Survey results.
Moreover, respondents were asked how they would likely purchase their car. They were
offered three purchasing options: (i) that they would pay cash or take out a personal
loan, (ii) that they would purchase the car through a ‘hire purchase’ (HP) option (i.e.
they would make a down payment and pay monthly instalments for the car); or (iii) that
they would make a purchase under a ‘personal contract purchase’ (PCP) plan (i.e. they
would pay a deposit and make monthly payments for the car and after 3 years they
would not own the car but would have the option of paying off the balance owed or
starting a new plan on another vehicle). Figure 18 summarises the answers to this
question.
Figure 18. Reported purchase option for new car, by country
Source: Survey results.
The highest proportion of respondents indicating that they would pay cash (or take out a
loan) were in the UK and France. Italy and Spain had the lowest proportion of
respondents who indicated that they would pay this way. However, they had much higher
proportions of respondents who said that they would pay by HP, along with respondents
in Poland. This was the least favourite way of purchasing a vehicle for respondents from
the UK and France. Overall, arguably surprising given actual purchasing behaviour in the
UK, the proportion of respondents proposing to purchase a PCP plan was small, with the
highest proportions in the UK, France and Germany. However, it must be emphasised
that for practical reasons this question was positioned in the survey instrument prior to
the prospective respondent being presented with details of payment requirements.
Subsequent questioning of some pilot survey interviewees and the car retail sector
highlights the significance of the salesperson’s role in making the potential car buyer
aware of the initial outlay savings to the purchaser under the PCP model.
174 Conclusions
4.1 Summary and concluding remarks
This study shows the results of a new survey on car type choices, conducted five years
after a 2012 survey reported in (Thiel et al., 2012). In the new survey, 1,248 car owners
in total were surveyed in France, Germany, Italy, Poland, Spain and the UK. The 2017
questionnaire consisted of 23 questions and two stated choice experiments, including a
variety of awareness and attitudinal questions in relation to electric cars, whereas the
original survey focused on the attitudinal questions.
In the second experiment, nearly half of the respondents never chose the electric or fuel
cell car option. The main reason given for this was the purchase price. Therefore, the
higher upfront cost consumers face for electric and fuel cell cars continue to be a key
barrier, as the 2012 survey revealed that reducing purchase price was a priority to
improve the value proposition of electric cars. Interestingly, fuel costs and maintenance
costs (which were not considered in 2012) also play a role in the car purchasing decision
(Figure 13), but they are not as important as purchase price. For a recent comprehensive
analysis of total cost of ownership, see (Lévay et al., 2017).
Due to a robust survey design and execution of the stated choice experiments and a
thorough analysis of their results, we can expect to gain an improved understanding on
the factors that influence people’s car type choices, specifically in relation to electric
vehicles. This will add to the existing literature on this subject, such as the one
mentioned in section 2.1.
Although the stated choice experiment focused on the purchase of a new car, nearly half
of the 2017 sample survey purchased a second-hand car for their last car purchase.
Purchasing second-hand cars can have a negative impact on the adoption of novel
powertrain technologies, which are yet to enter the second-hand car market. However,
over the next years this impact is thought to be lower for electric than for fuel cell cars.
For manufacturers, the finding that driving range appears to be more important for
respondents than recharging time can have direct implications on their strategies for
electric vehicle battery capacity.
Altogether, the main reasons that respondents mentioned for not buying electric cars
were: their relatively high purchase price, lack of recharging infrastructure, range
concerns, and too little model choice. Policies can help to remove or overcome these
adoption hurdles.
Comparing our 2017 findings to the 2012 survey, attitudes towards electric cars in
Europe can be described as relatively stable, with three main findings:
1. While the purchase price continues to be identified as the most important factor for
respondents when it comes to choosing a car, the proportion of the sample that
strongly agrees with the statement that electric cars are currently quite expensive
has decreased over time;
2. The proportion of the surveyed drivers that strongly agree with the statement that
driving an electric car has a cost of less than 2 euros per 100 km has increased over
time; and
3. Consumer awareness on the environmental benefits of electric cars compared to
conventional cars seems to have worsened, due to an increase in ‘do not know’
answers.
4.2 Limitations and further research
A main limitation relates to the duration of the survey, which was constrained to a time
limit of 10 minutes. Additional resources and time could have led to a full replication of
the 2012 survey questions, thereby ensuring a more consistent comparison between the
results of both surveys.
18It is pertinent to note that the size of the sample in the survey on which this study is
based is smaller, by almost two thirds, than the one on which the 2012 study was based.
Again, this was limited by resources available for the study. Overall, the sample obtained
had a satisfactory degree of representativeness for the purpose it was designed for,
although some characteristics of the sample with regards to the reference universe can
be challenged. It is worthwhile to remember that the benchmark for the sample is not
the wider population, but the households owning cars. An advantage over the 2012
survey is an explicit consideration of three car sizes (small, medium and large) as well as
several purchasing options.
Much of the information gathered in this new survey has been used to quantify
econometrically the factors that influence people’s car type choices in the selected
European countries. As a result, discrete choice models have been estimated. These will
be reported in a separate publication.
19References
ACEA, 2017a. Historical series 1990-2016: new passenger car registrations by country.
ACEA - European Automobile Manufacturers’ Association [WWW Document]. URL
http://www.acea.be/statistics/tag/category/by-country-registrations (accessed
5.15.17).
ACEA, 2017b. Historical series 1990-2016: new passenger car registrations by segments
& body. ACEA - European Automobile Manufacturers’ Association [WWW
Document]. URL http://www.acea.be/statistics/tag/category/segments-body-
country (accessed 5.15.17).
Achtnicht, M., Bühler, G., Hermeling, C., 2012. The impact of fuel availability on demand
for alternative-fuel vehicles. Transp. Res. Part Transp. Environ. 17, 262–269.
https://doi.org/10.1016/j.trd.2011.12.005
BCA, 2012. The European Used Car Market Report 2012. Centre for Automotive
Management. The University of Buckingham.
EAFO, 2017. European Alternative Fuels Observatory [WWW Document]. URL
http://www.eafo.eu/ (accessed 5.15.17).
EC, 2017. Energy Union: Commission takes action to reinforce EU’s global leadership in
clean vehicles. European Commission [WWW Document]. URL
http://europa.eu/rapid/press-release_IP-17-4242_en.htm
EU, 2017a. COMMUNICATION FROM THE COMMISSION TO THE EUROPEAN PARLIAMENT,
THE COUNCIL, THE EUROPEAN ECONOMIC AND SOCIAL COMMITTEE AND THE
COMMITTEE OF THE REGIONS Delivering on low-emission mobility. A European
Union that protects the planet, empowers its consumers and defends its industry
and workers. European Union Law [WWW Document]. URL http://eur-
lex.europa.eu/legal-content/EN/TXT/?uri=CELEX:52017DC0675 (accessed
12.4.17).
EU, 2017b. Proposal for a REGULATION OF THE EUROPEAN PARLIAMENT AND OF THE
COUNCIL setting emission performance standards for new passenger cars and
for new light commercial vehicles as part of the Union’s integrated approach to
reduce CO2 emissions from light-duty vehicles and amending Regulation (EC) No
715/2007. European Union Law [WWW Document]. URL http://eur-
lex.europa.eu/legal-content/EN/TXT/?uri=COM:2017:676:FIN (accessed 12.4.17).
EU, 2017c. COMMISSION STAFF WORKING DOCUMENT Detailed Assessment of the
National Policy Frameworks Accompanying the document COMMUNICATION FROM
THE COMMISSION TO THE EUROPEAN PARLIAMENT, THE COUNCIL, THE
EUROPEAN ECONOMIC AND SOCIAL COMMITTEE AND THE COMMITTEE OF THE
REGIONS Towards the broadest use of alternative fuels - an Action Plan for
Alternative Fuels Infrastructure under Article 10(6) of Directive 2014/94/EU,
including the assessment of national policy frameworks under Article 10(2) of
Directive 2014/94/EU [WWW Document]. URL http://eur-lex.europa.eu/legal-
content/EN/TXT/?qid=1512384850915&uri=CELEX:52017SC0365
EU, 2017d. COMMUNICATION FROM THE COMMISSION TO THE EUROPEAN PARLIAMENT,
THE COUNCIL, THE EUROPEAN ECONOMIC AND SOCIAL COMMITTEE AND THE
COMMITTEE OF THE REGIONS Towards the broadest use of alternative fuels - an
Action Plan on Alternative Fuels Infrastructure under Article 10(6) of Directive
2014/94/EU, including the assessment of national policy frameworks under Article
10(2) of Directive 2014/94/EU. European Union Law [WWW Document]. URL
http://eur-lex.europa.eu/legal-content/EN/TXT/?uri=CELEX:52017DC0652
(accessed 12.4.17).
EU, 2016. COMMUNICATION FROM THE COMMISSION TO THE EUROPEAN PARLIAMENT,
THE COUNCIL, THE EUROPEAN ECONOMIC AND SOCIAL COMMITTEE, THE
20COMMITTEE OF THE REGIONS AND THE EUROPEAN INVESTMENT BANK Clean
Energy For All Europeans. European Union Law [WWW Document]. URL
http://eur-lex.europa.eu/legal-content/en/TXT/?uri=CELEX:52016DC0860
(accessed 12.4.17).
EU, 2014a. Regulation (EU) No 333/2014 of the European Parliament and of the Council
of 11 March 2014 amending Regulation (EC) No 443/2009 to define the modalities
for reaching the 2020 target to reduce CO 2 emissions from new passenger cars.
European Union Law [WWW Document]. URL http://eur-lex.europa.eu/legal-
content/EN/TXT/?toc=OJ%3AL%3A2014%3A103%3AFULL&uri=uriserv%3AOJ.L_.
2014.103.01.0015.01.ENG (accessed 5.15.17).
EU, 2014b. Regulation (EU) No 253/2014 of the European Parliament and of the Council
of 26 February 2014 amending Regulation (EU) No 510/2011 to define the
modalities for reaching the 2020 target to reduce CO 2 emissions from new light
commercial vehicles. European Union Law [WWW Document]. URL http://eur-
lex.europa.eu/legal-content/EN/TXT/?uri=celex%3A32014R0253 (accessed
12.4.17).
EU, 2014c. Directive 2014/94/EU of the European Parliament and of the Council of 22
October 2014 on the deployment of alternative fuels infrastructure. European
Union Law [WWW Document]. URL http://eur-lex.europa.eu/legal-
content/EN/TXT/?uri=celex%3A32014L0094 (accessed 5.22.17).
Eurostat, 2017. Your key to European statistics. European Commission (EC) [WWW
Document]. URL http://ec.europa.eu/eurostat/web/main/home
Franke, T., Krems, J.F., 2013. What drives range preferences in electric vehicle users?
Transp. Policy 30, 56–62. https://doi.org/10.1016/j.tranpol.2013.07.005
Hackbarth, A., Madlener, R., 2013. Consumer preferences for alternative fuel vehicles: A
discrete choice analysis. Transp. Res. Part Transp. Environ. 25, 5–17.
https://doi.org/10.1016/j.trd.2013.07.002
Harrison, G., Thiel, C., Jones, L., 2016. Powertrain Technology Transition Market Agent
Model (PTTMAM): An Introduction (EUR - Scientific and Technical Research
Reports). Publications Office of the European Union.
Hoen, A., Koetse, M.J., 2014. A choice experiment on alternative fuel vehicle preferences
of private car owners in the Netherlands. Transp. Res. Part Policy Pract. 61, 199–
215. https://doi.org/10.1016/j.tra.2014.01.008
Jensen, A.F., Cherchi, E., Mabit, S.L., 2013. On the stability of preferences and attitudes
before and after experiencing an electric vehicle. Transp. Res. Part Transp.
Environ. 25, 24–32. https://doi.org/10.1016/j.trd.2013.07.006
Kim, J., Rasouli, S., Timmermans, H., 2014. Expanding scope of hybrid choice models
allowing for mixture of social influences and latent attitudes: Application to
intended purchase of electric cars. Transp. Res. Part Policy Pract. 69, 71–85.
https://doi.org/10.1016/j.tra.2014.08.016
Lévay, P.Z., Drossinos, Y., Thiel, C., 2017. The effect of fiscal incentives on market
penetration of electric vehicles: A pairwise comparison of total cost of ownership.
Energy Policy 105, 524–533. https://doi.org/10.1016/j.enpol.2017.02.054
OECD, 2017. Graduation rate - Tertiary education (indicator). doi: 10.1787/b858e05b-en
[WWW Document]. URL (accessed 5.15.17).
Thiel, C., Alemanno, A., Scarcella, G., Zubaryeva, A., Pasaoglu, G., 2012. Attitude of
European car drivers towards electric vehicles: a survey (EUR - Scientific and
Technical Research Reports). Publications Office of the European Union.
https://doi.org/10.2790/67556 (online)
21Thiel, C., Nijs, W., Simoes, S., Schmidt, J., van Zyl, A., Schmid, E., 2016. The impact of
the EU car CO2 regulation on the energy system and the role of electro-mobility
to achieve transport decarbonisation. Energy Policy 96, 153–166.
https://doi.org/10.1016/j.enpol.2016.05.043
22List of abbreviations and definitions
AFI Alternative fuels infrastructure
AFV Alternative fuel vehicle
BEV Battery electric vehicle
CAWI Computer assisted web interviewing
CNG Compressed natural gas
DE Germany
EAFO European Alternative Fuels Observatory
EC European Commission
ES Spain
EU European Union
EV Electric vehicle
FC Fuel cell vehicle
FFV Flexible-fuel vehicle
FR France
GfK Gesellschaft für Konsumforschung
HP Hire purchase
ICE Internal combustion engine
IT Italy
LPG Liquefied petroleum gas
MS Member State
N Sample size
N/A Not available
PCP Personal contract purchase
PHEV Plug-in hybrid electric vehicle
PL Poland
SC Stated choice
SP Stated preference
UK United Kingdom
23List of figures
Figure 1. Distribution of population by area where the household lives, by country ....... 6
Figure 2. Distribution of population by gender, by country ......................................... 7
Figure 3. Distribution of population achieving graduation at tertiary level, by country ... 8
Figure 4. Cars per household, by country ................................................................ 9
Figure 5. Distribution of new versus second-hand car purchase, across all surveyed
countries .............................................................................................................. 9
Figure 6. Commuting by car, by country ................................................................10
Figure 7. Regularity of travel to large urban areas, by country ..................................10
Figure 8. Influence of purchase price levels on stated choices, by country ..................11
Figure 9. Proportion of respondents who always choose one alternative, by country ....12
Figure 10. Trading behaviour across alternatives, by country....................................12
Figure 11. Expectations in 2012 on EV market uptake by 2022 versus data ................13
Figure 12. Percentage of agreement with key statements in 2012 versus 2017 ...........14
Figure 13. Top factors in car choices across all surveyed countries ............................14
Figure 14. Share of respondents who never chose an electric or fuel cell car, by country
..........................................................................................................................15
Figure 15. Reported reasons for not choosing electric or fuel cell cars, by country .......16
Figure 16. Distribution of car sales by size, data versus sample (current and future) ...16
Figure 17. When respondent is planning to purchase their next car, by country ..........17
Figure 18. Reported purchase option for new car, by country ...................................17
24List of tables
Table 1. Number of respondents in 2012 and 2017, by country .................................. 5
Table 2. Age distribution of population, by country ................................................... 7
Table 3. Household income distribution in the survey sample for Eurozone MS ............. 8
25Annexes
Annex 1. Survey questionnaire
Questionnaire Template
Example for Italy
INTRODUCTION: This survey explores what things are important to you when considering your next car
purchase. Click next to start with the questions.
Base: all respondents
S1 [Q]
How old are you?
Scripter: min=10, max=99; screenout when younger than 18 years old
Base: all respondents
S2 [S]
Are you a man or a woman?
Scripter: ONE ANSWER ONLY
1. Man
2. Women
Base: all respondents
S3 [S]
What is the highest level of education you have successfully completed?
Scripter: ONE ANSWER ONLY
1. Elementary (primary) school or less
2. Some high (secondary) school
3. Graduation from high (secondary) school
4. Graduation from college, university or higher
Base: all respondents
S4 [S]
Do you own a car? (It can also be a company car, family car, etc.)
Scripter: ONE ANSWER ONLY
1. Yes
2. No (Screenout)
Base: all respondents
Q1 [M]
26What size of car do you own?
Scripter: MULTIPLE ANSWERS POSSIBLE
1. Small, e.g., Fiat 500, Ford Fiesta, SEAT Ibiza, Nissan Juke, Open/ Vauxhall Corsa, Volkswagen up!, Volkswagen
Polo, Renault Zoe, Renault Clio, Peugot 208, Honda Jazz, Toyoto Yaris
2. Medium / family car, e.g., Volkswagen Golf, Ford Focus, Ford Kuga, Opel/Vauxhall Astra, Nissan Leaf, Toyota
Prius, KIA Sportage, Hyundai Tucson, Nissan Qashqai, Skoda Octavia, Audia A3, BMW 3 Series, Mercedes C-class
3. Large / executive style, e.g., Volkswagen Sharan, SEAT Alhambra, Citroen Picasso, Ford Galaxy, Land Rover
Discovery, Tesla Model S, Audi A6, BMW 5 series, Mercedes E-class
Base: all respondents
Q2 [S]
Was your last car purchase a new car or second hand car?
Scripter: ONE ANSWER ONLY
1. New car
2. Second hand car
Base: all respondents
Q6 [SGRID]
We would now like you to tell us how much you agree with the following statements about electric cars.
Please give one answer for each statement.
Scripter: ONE ANSWER PER LINE
Columns:
1. Totally disagree / 2. / 3. / 4. / 5. / 6. / 7. / 8. / 9. / 10. Totally agree / 11. Don’t know
Rows :
1. Electric cars are currently quite expensive
2. Electric cars can run for a maximum of 150 km between two charges
3. The charging time is never less than 30 minutes
4. 100 km cost less than 2 Euros
5. Electric cars have no tailpipe emissions
Base: all respondents
Q3[S]
If you were to purchase a new car, what size of vehicle would you probably purchase?
Scripter: ONE ANSWER ONLY
1. Small, e.g., Fiat 500, Ford Fiesta, SEAT Ibiza, Nissan Juke, Open/ Vauxhall Corsa, Volkswagen up!, Volkswagen
Polo, Renault Zoe, Renault Clio, Peugot 208, Honda Jazz, Toyoto Yaris
2. Medium / family car, e.g., Volkswagen Golf, Ford Focus, Ford Kuga, Opel/Vauxhall Astra, Nissan Leaf, Toyota
Prius, KIA Sportage, Hyundai Tucson, Nissan Qashqai, Skoda Octavia, Audia A3, BMW 3 Series, Mercedes C-class
3. Large / executive style, e.g., Volkswagen Sharan, SEAT Alhambra, Citroen Picasso, Ford Galaxy, Land Rover
Discovery, Tesla Model S, Audi A6, BMW 5 series, Mercedes E-class
27You can also read