AUTOMATION IN THE FLORICULTURE SECTOR - Flowers Canada Growers
←
→
Page content transcription
If your browser does not render page correctly, please read the page content below
AUTOMATION IN THE FLORICULTURE SECTOR

Automation in the Floriculture Sector

    1. Table of Contents
    1. Table of Contents........................................................................................................................ 1
    2. Acknowledgements.................................................................................................................... 2
    3. Introduction and Using This Document.................................................................................... 2
    4. Executive Summary.................................................................................................................... 3
    5. State of Ontario's Floriculture Sector........................................................................................ 4
    6. Study Background and Engagement......................................................................................... 7
    7. Characterizing Floriculture Automation.................................................................................... 9
       7.1. Current State of Automation............................................................................................... 9
       7.2. Automation Equipment on Farms Now............................................................................ 15
       7.3. Automation Systems Available......................................................................................... 17
    8. COVID-19 and Automation....................................................................................................... 19
       8.1 Survey 1 Results - Automation to address COVID-19 risks................................................ 19
       8.2 Discussions with other organizations and Health & Safety representatives.................... 25
    9. Mapping Farm Productivity and Labour................................................................................. 25
       9.1. Current State of Labour..................................................................................................... 25
       9.2. Impact of Labour on Productivity..................................................................................... 27
       9.3. Impact of Automation on Productivity............................................................................. 30
       9.4. Impact of Automation on Labour..................................................................................... 30
    10. Opportunities in Automation................................................................................................. 32
       10.1. Farm Automation Priorities............................................................................................ 32
       10.2. Projecting Future Farm Automation Investment........................................................... 35
       10.3. Barriers to Automation.................................................................................................... 37
    11. Conclusions and Summary.................................................................................................... 41
       11.1. Observations the State of Automation........................................................................... 41
       11.2. Determining the Opportunity to Offset the Risk of COVID-19 Using Automation........ 41
       11.3. Characterize the Opportunity to Increase Productivity Using Automation................. 41
       11.4. Explore Strategies to Encourage Automation Uptake in the Sector............................. 42
       11.5. Final Statements and Recommendations...................................................................... 43
    12. Appendices............................................................................................................................. 44
       12.1. Appendix I - Survey 1....................................................................................................... 44
       12.2. Appendix II - Survey 2...................................................................................................... 44
       12.3. Appendix III - Equipment Database................................................................................ 44
       12.4. Appendix IV - Visual Matrix.............................................................................................. 45

1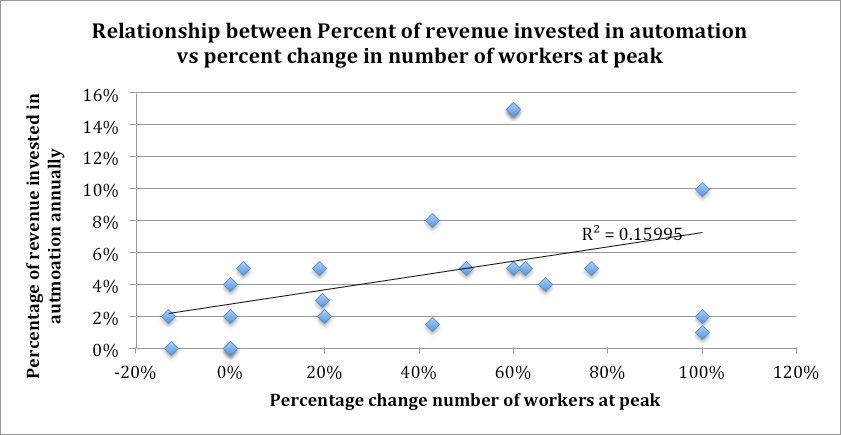
2. Acknowledgements
Funding for this project was provided by the Ontario Ministry of Agriculture, Food and Rural Affairs as part of their Agri-
food Prevention and Control Innovation program. The Flowers Canada (Ontario) Inc. (FCO) team is grateful to OMAFRA
for facilitating this project. The views expressed in this report are the views of the Recipient and do not necessarily reflect
those of the Province.

FCO would also like to thank the many ornamental greenhouse farmers who provided data and information to support
the completion of this project. FCO would like to recognize the contribution of some regional health authorities for their
valuable insight into the impact that automation could have on COVID-19. Finally, FCO would like to thank the members
of the project steering committee, inclusive of numerous farm operators, greenhouse builders, service providers and
other specialists. Without the assistance of all these individuals, this project would not have been possible.

3. Introduction and Using This Document
Flowers Canada (Ontario) Inc. is the provincial trade association of Ontario's flower producers. Our members across the
province include greenhouse farmers, distributors and importers/exporters all dealing with cut flowers, potted plants,
bedding plants, cut greens and propagative material. It is our goal to improve and strengthen the unity of the floriculture
sector. We strive to create an environment for ornamental farmers in which they will thrive and contribute as major
contributors to the economy and to the quality of life in Ontario.

Automation has long been proposed as an opportunity for the advancement of Ontario's agricultural community,
both through improvements to productivity and reductions in labour demand, but for many of Ontario's flower farms,
increases in automation have been and remain inaccessible. As the Province reels from the impacts of the COIVD-19
pandemic, FCO has been tasked with exploring the potential of mechanization and automation to lower transmissibility
risk associated with COVID-19 as well as evaluating opportunities for automation to both increase productivity while
reducing labour demand for the floral sector. This study was initiated with a number of broad objectives in mind:
        • Characterize the state of automation in the floriculture sector
        • Determine the opportunity to offset the risk of COVID-19 using automation
        • Characterize the opportunity to increase productivity using automation
        • Explore strategies to encourage automation uptake in the sector

This document represents a review of the results from FCO's technology study regarding automation in the floriculture
sector. Great detail is presented within each of the above broad objectives. The study also contains FCO's analysis of
these results and their significance to the industry today and the future.

                                                                                                                                  2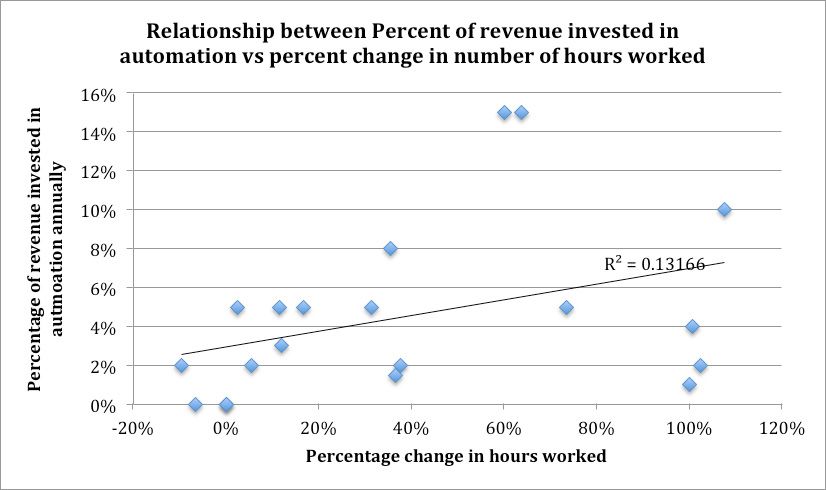
4. Executive Summary
    This report outlines the results of numerous efforts to characterize automation and COVID-19 risk in Ontario's floriculture
    sector

    The four key objectives that FCO sought to address include:
           • Characterize the state of automation in the floriculture sector
           • Determine the opportunity to offset the risk of COVID-19 using automation
           • Characterize the opportunity to increase productivity using automation
           • Explore strategies to encourage automation uptake in the sector

    Characterize the state of automation in the floriculture sector:
    FCO found that, generally, most farms had previously engaged in automation advancement, though there exists
    considerable opportunity and desire for further expansion of automation technologies.
    In addition, it was determined that farms are spending between 2.4% and 6% of their annual revenue on automation,
    equating to between $20 million and $49 million annually across the province.

    Determine the opportunity to offset the risk of COVID-19 using automation:
    Based on farmer responses, automation appears to provide limited opportunity to offset COVID-19 risk on farms. The
    on-farm tasks that appear to enhance COVID-19 risk include packaging and planting, that happen to be production
    responsibilities where significant automation presently exists. Survey respondents indicated that 80% of farms have
    automation infrastructure in place in key COVID-19 risk areas. Sixty percent of farmers believed that their automation
    systems had some benefit (or co-benefit) to reducing COVID-19 on their property, while 40% felt that their automation
    systems provided no benefit.

    Characterize the opportunity to increase productivity using automation:
    Farms have undertaken considerable improvements in terms of labour productivity over the past 12 years. Farms that
    added more labour clearly saw enhancements in productivity, with a strong positive relationship between labour and
    productivity. Also observed was that farms that invested more on automation saw greater improvements in productivity
    with a moderate relationship between automation expenditure and productivity. Interestingly, farms that spent more on
    automation systems did not see reductions in workforce or staffing hours. In fact, farms that spent more on automation
    generally saw increases to their workforces when increasing expenditures on automation.
    These results imply that automation may not be an ideal tool for reducing workforce on a farm, but a strong tool for
    increasing productivity and may be an important factor in overall farm growth.

    Explore strategies to encourage automation uptake in the sector:
    Survey participants expressed a wide diversity of rationales for automation, with production/efficiency gains, labour
    reduction, and quality improvement being the three most desirable outcomes. Other motives included worker safety,
    meeting customer specifications, and allowing for crop changes. Financial barriers were by far the most significant
    obstacle to increasing automation on farms. The average cost for the a future automation purchase among ornamental
    farms surveyed was $300,000 per farm, with a median value of $150,000. Approximately 40% of farms favour investment
    in greenhouse expansion over investment in automation expansion. The vast majority of farms (100% large farms, 93%
    medium farms, 86% small farms) would invest in automation should their barriers (financial) be addressed.

    Recommendations:
    FCO recommends that incentivization programs for automation uptake avoid focus on specific outcomes such as
    workforce reduction or mobilizing the workforce beyond activity-based employment. Numerous automation priorities
    were identified in this study, and the results highlight the need for funding that targets a diverse range of automation
    outcomes.

    Incentivization programs must provide sufficient capital to cover the extensive cost of automation tools - an average cost
    of $300,000 was reported in this study, with median costs being $150,000. FCO recommends increasing maximum value
    of incentivization cost-share share programs to a minimum of $300,000.

3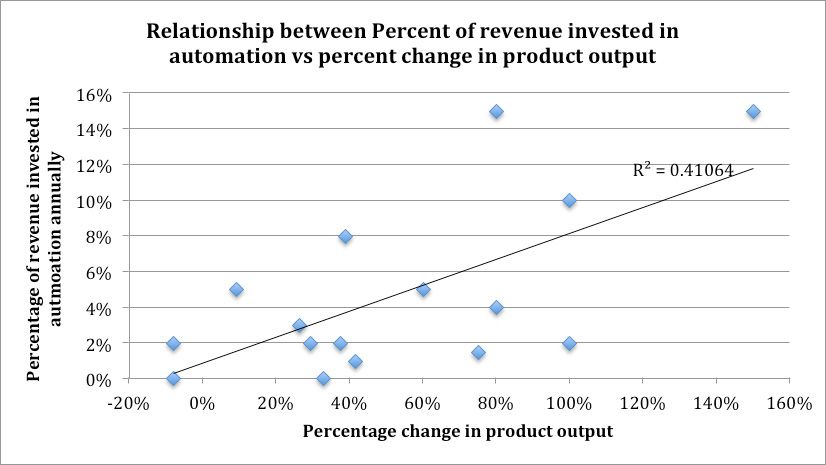
5. State of Ontario's Floriculture Sector

Figure 1. Ontario flower and plant sales and resales between 2015 and 2019 (Source: Statistics Canada, 2019)

Ontario’s floriculture sector is growing. Both the provincial and national farm gate values dipped in 2017 before
rebounding and increasing by 5.5%. Ontario accounts for just over half of the national floriculture farm gate.

Figure 2. Value of floriculture exports from Ontario between 2015 and 2019 (Source: Statistics Canada, 2019)

Exports appear to be driving the growth of the floriculture sector. In fact, domestic consumption has decreased over the
past 5 years and had the industry realized steady increases in export capacity, the sector would have seen a contraction.

                                                                                                                            4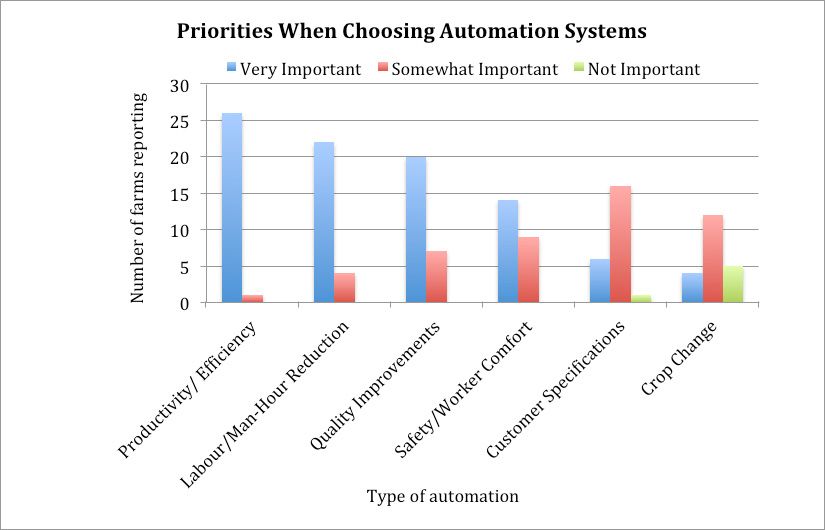
Ontario Farm Cash Receipts 2019
         Agriculture Products                    Crops Only
     #1 Dairy products                 #1 Soybeans
     #2 Soybeans                       #2 Corn
     #3 Corn                           #3 Greenhouse Vegetables
     #4 Hogs                           #4 Field Vegetables
     #5 Cattle                         #5 Ornamental Horticulture*
                                       #6 Cannabis Seeds, Vegetative
     #6 Greenhouse Vegetables
                                          Plants and Flowering Tops
     #7 Chickens for Meat              #7 Total Fresh Fruit
     #8 Field Vegetables               #8 Wheat (Excluding Durum)
     #9 Ornamental Horticulture*       #9 Unstemmed Leaf Tobacco
                                                                         Table 1. Summary of Ontario farm cash receipts
     #10 Cannabis Seeds, Vegetative                                      in 2019 for agricultural products and crops alone
                                       #10 Ginseng Root, Medicinal
       Plants and Flowering Tops                                         (Source: Statistics Canada, 2019)

    Ornamental Horticulture, which includes Floriculture, Nursery & Sod, was the ninth largest agricultural product produced
    in Ontario and the fifth largest agricultural crop in 2019.

    Figure 3. Value of estimated cumulative COVID-19 national farmgate losses in 2020 between March and May. (Source: Grower Survey conducted May/
    June 2020)

    As with many commodities and industries, the COVID-19 pandemic and subsequent public shutdown events damaged
    the ornamental industries substantially across Canada. Nationally, by May 2020, loss estimates (based on an FCG
    farmer survey) were estimated at between $75 and $105 million. The cause of these significant losses is attributable
    to the shutdown arriving prior to Easter – a major sales event for the ornamental industry. On average, 40-50% of the
    floriculture farm gate is generated between Easter and the end of the spring planting season. A provincial shutdown
    was implemented just before Easter resulting in devastating losses to many growers producing crops for this holiday as
    demonstrated in Figure 3. However, it should be stated that the industry has experienced a resurgence from the extreme
    losses experienced between March and May 2020 with farm gate and export numbers demonstrating tremendous year-
    over-year growth.

5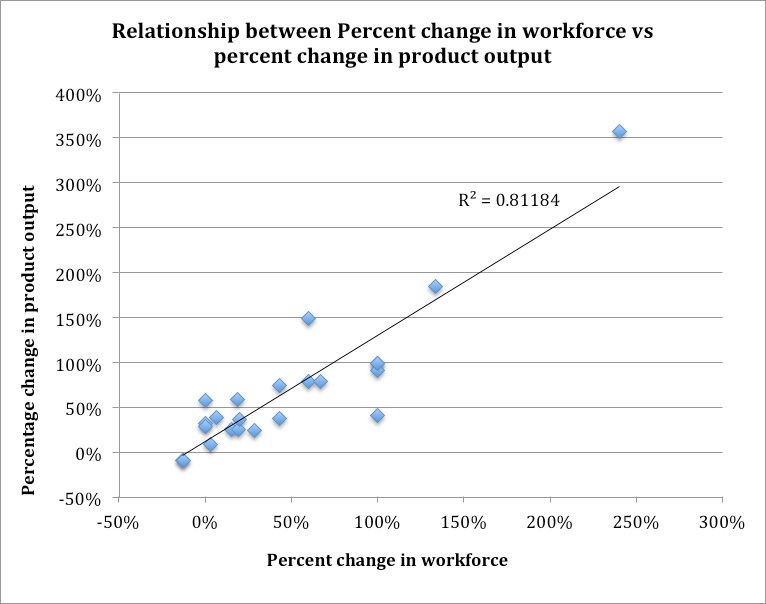
Figure 4. The number of greenhouse floriculture farms in Ontario between 2015 and 2019 (Source: Statistics Canada, 2019)

However, success is not equally distributed across all farms. The actual number of floricultural farms is decreasing
(Figure 4). This provincial trend also exists nationally. Over the past 4 years, across Canada, 31,251 ft2 square feet of
greenhouse production space is lost every week.

Figure 5. Gross annual payroll as a percentage of overall expenses (Source: Statistics Canada, 2019)

Gross annual payroll is the largest expense, on average, that a floriculture farm will incur in any given year. Labour
costs appear to correlate with sales (Figure 1), and this suggests that labour-saving opportunities should be explored to
facilitate growth of the sector.

                                                                                                                            6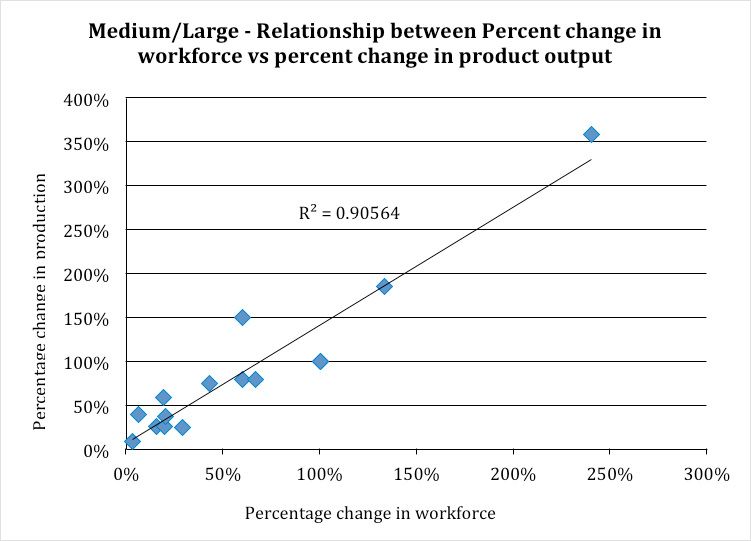
6. Study Background and Engagement
    This study is composed of data derived from five resources:
        1. A preliminary survey distributed by FCO to member farms (Appendix I)
        2. A late survey distributed by FCO to key farms with an interest in automation (Appendix II)
        3. A literature review on current automation systems for floriculture production (Appendix III)
        4. Publicly available data provided by Statistics Canada (CANSIM Database)
        5. Private data collected and maintained by FCO through regular operation

    While other data was used to supplement the findings within the project study, Surveys 1 and 2 provided the majority
    of data used in the assessment of automation herein. This report links all data to its original source in the text. All
    questions and data collection were aimed at addressing the following broad objectives of the study:
        1. Characterize the state of automation in the floriculture sector
        2. Determine the opportunity to offset the risk of COVID-19 using automation
        3. Characterize the opportunity to increase productivity using automation
        4. Explore strategies to encourage automation uptake in the sector

    Survey 1 was available for completion between January 29, 2021 and March 2, 2021 and was delivered as an online
    survey via SurveyMonkey to member farms. Farms had the opportunity to remain anonymous or avoid answering
    specific questions while responding. FCO staff reviewed all answers and removed any potential double completions by
    analyzing IP addresses of respondents.

    Survey 2 was initially offered as a phone interview but was adjusted for delivery as an online survey via SurveyMonkey to
    address significant time constraints on members due to the onset of the production season. Survey 2 was also modified
    to remove several questions that were deemed challenging (or impossible) to answer by respondents. Similar to Survey
    1, farms had the opportunity to remain anonymous or avoid answering specific questions while completing the survey.
    Also, FCO staff reviewed all responses and removed any potential double completions by analyzing IP addresses of
    respondents.

    Both surveys asked growers to self-identify their overall greenhouse farm size (650,000 ft2) (Figure 6, 7). Size designations of farms were established to divide the entirety of production space in FCO's
    membership into thirds. Large, medium and small growers each independently represent approximately one third of all
    production area in FCO's membership. This division in size was used to validate that survey responses were relevant to
    the applicable farm sizes within FCO's membership

    Survey 1 received a total of 62 responses out of 185 FCO members (Figure 6). Survey 2 received a total of 30 responses out
    of the FCO membership (Figure 7).

7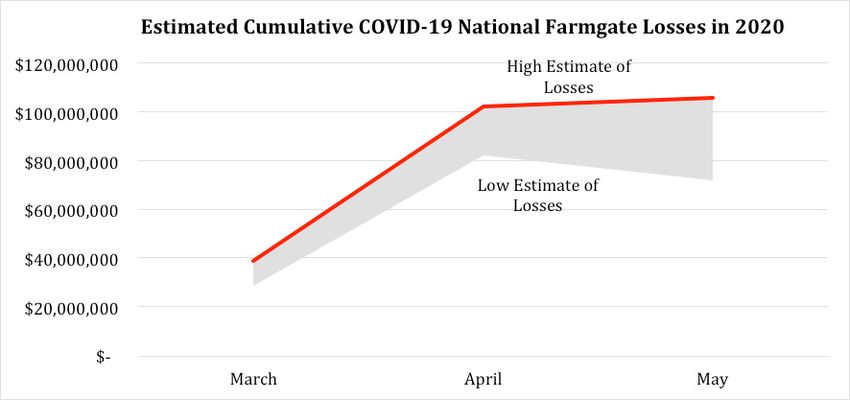
Figure 6. Percentage of the grower population that provided responses to survey 1 (Source: FCO Survey 1, 2021)

Figure 7. Percentage of the grower population that provided responses to survey 2 (Source: FCO Survey 2, 2021)

A larger proportion of growers responded to the first survey over the second survey. The discrepancy in survey responses
is likely attributable to:
          • Survey 2 being requested during one of the busiest production periods of the year
          • Survey 2 took more than double the amount of time to complete
          • Survey 2 asked for more in depth and potentially more sensitive information
          • Survey 2 encouraged farms to self-identify

Both surveys saw a larger proportion of FCO's large and medium producer members respond, though FCO has a
larger number of small grower members overall than medium and large growers combined. As a result of the reduced
completion rate in Survey 2, medium and large farms needed to be grouped together for analysis to protect the identity
of large farms. This was not necessary in Survey 1 due to strong completion rates by all farm size categories. The response
rate was consistent with FCO's past member engagement experience and suggests that responses received in Survey 1
may be reflective of greater than two-thirds of FCO members' production area. Regardless of completion rates, both
surveys yielded useful data.

Many questions throughout both surveys received answers with varying degrees of completeness. This report attempts
to highlight any data that were derived from such answers or caveat the FCO team's confidence in the responses received.

                                                                                                                              8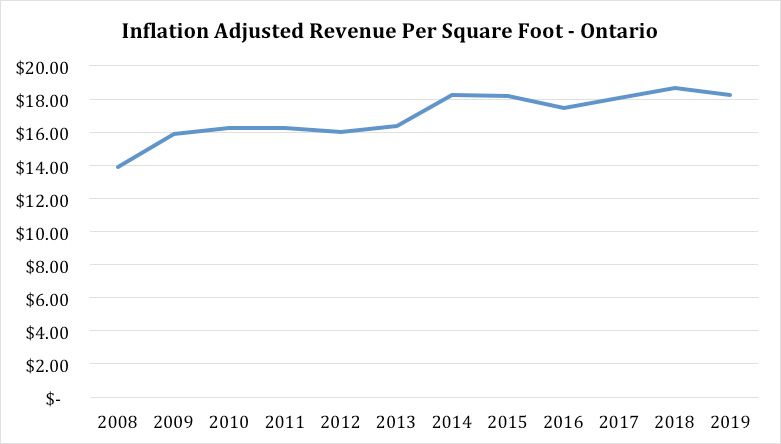
7. Characterizing Floriculture Automation
    7.1. Current State of Automation
    Please note: respondents were asked to rate their perceived level of automation based on a subjective scale. Due
    to personal interpretation and the customized nature of automation, growers may consider their automation level
    differently than that of their peers. Farms were asked to rate their degree of automation of multiple standard production
    tasks from 0% to 100%, 0% meaning nothing was automated, where 100% meant everything that could be automated
    has been automated.

    Figure 8. Percentage of growers, of various sizes, that had no automation for major production activities/tasks (Source: FCO Survey 1, 2021)

    Figure 8 displays the proportion of different sized growers that responded to the survey question with “0% Automation”
    within each activity category. The largest group who responded in this manner were small farms distributed over most
    activity categories. A larger sample size may result in an even larger population of small members using no automation
    compared to the medium and large growers. Propagation automation appeared to differ notably between farm sizes.
    It appears that all but the largest farms are outsourcing this activity (i.e., larger farms automating, and smaller and
    medium size farms contracting this work out so automation is irrelevant).

9
Figure 9. The average percentage of automation of small, medium and large farms based on responses above 0% (Source: FCO Survey 1, 2021)
Responses on automation progress presented (Figure 9) are shown for farms reporting greater than 0% automation. The
average perceived automation level appears to be comparable regardless of farm producer size. This appears especially
true for medium and large farms, which are close in all categories, though the reasoning for this similarity warrants
further investigation.
Shipping automation processes had the most opportunity for growth. It would be interesting to investigate which
shipping technologies various sized farms are using, and where opportunities to automate may exist.
For the high level of COVID-19 management automation, it is difficult to characterize what responding farms interpreted
as automation. We provided examples such as screening, sanitation and ventilation technologies. It may be that there
are too few automation technologies available (e.g., facial scanners, cameras, disinfectant dispensers) that are specific
to health so that it is not difficult to achieve high levels of automation with a relatively small investment. For example, if
one were to add automated disinfectant dispensers, is one then 50% closer to automating everything one could in terms
of COVID-19? This report will explore COVID-specific technology (Section 8) in more detail and demonstrate that while
farms have not deliberately invested in technology for COVID risk mitigation, some co-benefit was achieved through
automation for other production purposes.
Figures 10, 11 and 12 explore in more detail the perceived automation level between small, medium and large farm sizes.
10Figure 10. The level of automation on small farms based on common farm tasks (Source: FCO Survey 1, 2021)
For all categories other than production (33%) and shipping (48%), half or more responding small farms reported
between 0% and 25% automation. This broadly suggests that many small farms may not have yet undertaken significant
automation efforts.
Figure 11. The level of automation on medium farms based on common farm tasks (Source: FCO Survey 1, 2021)
Medium sized greenhouse ornamental farmers provided a wide diversity of responses on perceived automation levels.
Fewer farms indicated that their level of planting and production automation was between 0% and 25% implying that the
majority of businesses had invested in these key automation areas, though the vast majority of producers still reported
50% or less automation in all common task areas.
11Figure 12. The level of automation on large farms based on common farm tasks (Source: FCO Survey 1, 2021)
Large farms appear to have made investments into most automation categories, with all farms reporting possession of
production automation systems. While all large farms invested in production automation systems, only 17% reach the
75%-100% automation levels. This result may imply significant demand for production automation systems. Demand
for each automation system will be explored in more detail later in this report.
Figures 13, 14 and 15 compare the perceived automation levels for each production type.
12Figure 13. The level of automation in cut flower production based on common farm tasks (Source: FCO Survey 1, 2021)
A low level of automation is generally observed for propagation and planting activities among cut flower growers, with
higher automation (>25%) observed in production and shipping. It is unclear if this perceived relationship is related
to cut flower producers having less automation in these task areas, or due to farms being generally smaller than their
potted plant or spring plant counterparts. Over 35% of cut flower producers responding in Survey 1 were small farms,
with 16% and 17% of cut flower producers responding from the medium and large farms, respectively.
Figure 14. The level of automation in potted flower production based on common farm tasks (Source: FCO Survey 1, 2021)
13Most potted plant farms have less than 50% automation among all activities, indicating potential opportunities for
automation improvement. More than half of respondents reported very low levels of automation for shipping related
tasks.
Figure 15. The level of automation in seasonal flower production based on common farm tasks (Source: FCO Survey 1, 2021)
Figure 15 demonstrates that more than half of the farms automate less than 50% or even less than 25% for each
production task. More than 50% of farms reported below 25% automation in both propagation and shipping.
Figure 16. Percentage of annual automation spending between small and medium/large growers (Source: FCO Survey 2, 2021)
Expenditures on automation are closely guarded among flower growers, and many producers expressed concern with
providing specific values. Survey 2 requested that farms estimate their expenditures on automation as a percentage of
their annual revenue in an effort to reduce the sensitivity of data collected while still benchmarking the degree to which
farms are focusing on automation in their business. It is not currently possible to conclusively identify the total amount
14invested in automation by the floriculture sector on an annual basis. While actual expenditure on automation can vary
significantly from one farm to another, considering the average outlay (between 2.5% and 6% of revenue) shown in
Figure 16, in coordination with the annual revenue of Ontario's floriculture sector there is a strong suggestion that an
annual automation expenditure of between $20 and $49 million exists. This estimate could be inaccurate considering
that the number of respondents to Survey 2 is not large enough to assign a high level of confidence to these figures.
7.2. Automation Equipment on Farms Now
Survey 1 included several open-ended questions on automation equipment installed on farms - these questions are
often challenging to interpret, and the resulting data should be considered cautiously when compared to questions with
binary responses. However, these questions are effective in gathering responses that can be useful in navigating further
assessment. Responses from these open-ended sections were carefully considered while designing Survey 2.
Figure 17. Percentage of farms housing common automation equipment (Source: FCO Survey 1, 2021)
Figure 17 illustrates the proportion of survey respondents that reported having automation equipment that is commonly
found on floriculture farms. The results presented in Figure 17 should be considered carefully: the broad categories
of automation systems listed were prepared by FCO based on open ended responses from farms and aggregated into
groupings for data review. For example, irrigation equipment is highly variable by and within crops depending on the
producer, and further complicated by customization. For clarity, the survey included some examples of equipment under
some of the activities. Planting equipment was the most commonly present automation system of respondents, though
the reasoning behind this priority (i.e. technology available, cost of systems, labour offset potential, ROI for systems etc.)
is currently unclear.
While some technologies seem to be common or uncommon across the sector, splitting responses by farm size (Figures
18, 19, 20) shows that some technologies are in greater use for different farm sizes than others.
15Figure 18. Percentage of small growers that currently house common automation equipment (Source: FCO Survey 1, 2021)
Figure 19. Percentage of medium growers that currently house common automation equipment (Source: FCO Survey 1, 2021)
16Figure 20. Percentage of medium growers that currently housed common automation equipment (Source: FCO Survey 1, 2021)
All farm sizes demonstrated considerable utilization of soil/potting machines and related equipment. Larger farms
were more likely to possess packaging systems (70% of large farms, compared to 26% and 27% of small and medium
farms respectively). Small farms were less likely to possess planting equipment (21% of small farms possessed these,
contrasted against 46% and 50% of medium and large farms respectively).
7.3. Automation Systems Available
A literature review on automation and available technologies for the floriculture sector was conducted from a few different
sources: FCO associate members, Canadian Greenhouse Conference trade exhibitors, Agriculture and Horticulture
Development Board (AHDB), Greenhouse Canada, HortiDaily, MMJDaily, FloralDaily, GPN Greenhouse Product News,
and others.
In total there were 43 manufacturers or suppliers found, which market a total of 400 different automation products to
the floriculture sector. These products can either help to offset labour requirement, to increase productivity, to improve
product quality, or to improve worker safety. None of them so far are designed specifically for COVID-19 mitigation,
however, by using some of this technology, fewer people are required to work in close proximity and workers are able to
conduct their jobs effectively at a distance, which is a co-benefit of reducing COVID-19 exposure and spread. Within the
40 companies, 19 are from Northern America (either domestically or from US), 16 from Netherlands, and the remaining
are from other countries. Approximately 14 companies can provide automated greenhouse environmental control,
irrigation, etc. There are also 3 companies that provide devices that can be used for body temperature measurement,
which is helpful for site entry assessments.
Within the 43 companies, there are only 11 companies that provided detailed information, including the product cost/
budget, time for installation, amount of labour that could be offset, return on investment (ROI), etc. Table 2 demonstrates
the price range, ROI, and increased productivity of each technology type based on the limited data available.
17Table 2. Comparison between technology types on price, return on investment, and increased productivity (Source: Equipment Database)
Appendix III – Equipment Database provides detailed information on the companies reviewed, details on the products
available, the cost of automation products (only 11 companies provided cost estimates), contact details etc. Appendix IV
is a visual matrix that can help the growers to visualize the equipment database and assist them to locate the equipment
of interest. All automation and technology equipment is categorized into 5 groups: propagation (e.g. taking cuttings,
sowing seed, sticking), planting (e.g. potting, transplanting), production (e.g. spraying, irrigation, applying/scouting
biocontrols, trimming/pinching), shipping (e.g. picking/harvesting, packaging, boxing), and COVID-19 (e.g. screening,
site entry assessment, ventilation enhancement), which are paired with Survey 1.
188. COVID-19 and Automation
8.1 Survey 1 Results - Automation to address COVID-19 risks
This section summarizes results from multiple open-ended questions in Survey 1. Again, results must be cautiously
interpreted. Regardless, the responses provide insight into farm perception of COVID-19 management and the
opportunities presented by automation to reduce the risk of spread and infection.
Figure 21. Percentage of farms that identified ornamental farm production tasks that they felt represented a high risk of COVID-19 spread or infection
(Source: FCO Survey 1, 2021)
As evidenced in Figure 21, two farm tasks stand out as providing the most risk of COVID-19 exposure: planting and
packaging activities. In a previous iteration of this graph, we included a category that was “None, if we are careful/
modify activities”, as was reported by 7% of respondents. Farms that are able to fully segregate staff and accomplish
viral exposure avoidance have a considerable advantage, but realistically, few farms can manage production without
some level of worker interaction. Comparing responses between farm sizes indicated minimal differences in perceived
risk for small, medium and large sized farms (Figures 22, 23, 24).
19Figure 22. Percentage of respondents from small farms that perceive the risk of COVID-19 infection or spread for specific tasks
(Source: FCO Survey 1, 2021)
Figure 23. Percentage of respondents from medium farms that perceive the risk of COVID-19 infection or spread for specific tasks
(Source: FCO Survey 1, 2021)
20Figure 24. Percentage of respondents from large farms that perceive the risk of COVID-19 infection or spread for specific tasks
(Source: FCO Survey 1, 2021)
All farm sizes listed planting and packaging as the first and second largest problem areas for COVID-19 spread, but only
medium sized farms listed spacing as an issue. All farm sizes reported some concern with potting, transplanting and
propagation, though at a lower frequency than planting and packaging.
It is possible that that automation may increase COVID-19 exposure risk in some scenarios. For example, potting
machines are often acquired to increase potting efficiency and productivity, but the design of many potting systems is
to have a crew of several labourers assembled closely together. Alternatively, automation in some instances may help
reduce COVID-19 risk by reducing the total number of individuals needed for an activity. Ideally, automation improves
productivity while minimizing increased proximity risk in the context of the COVID-19.
In terms of level of automation adopted that would have the co-benefit of reducing the risk of COVID-19 exposure,
there was a wide range provided by farmers (Figure 27). Survey 1 provided ranges in ten percent increments for level of
adoption, however, the perception of the level of automation by various respondents complicated the analysis. Looking
at the total responses, most farms indicated some level of automation that would lessen the impacts of COVID-19.
21Figure 25. Percentage of growers by farm size that have automation equipment for COVID-19 (Source: Survey 1, 2021)
Small farms appeared to have the lowest degree of automation that would assist with risk exposure, with medium and
large farms consistently reporting more automation that would provide the co-benefit of mitigating COVID-19 risks.
Figure 26. Percentage of growers that have at least some automation equipment specifically to address COVID-19 risks (Source: Survey 1, 2021)
Overall, almost 80% of respondents indicated they had at least some level of automation that would have the additional
benefit of addressing risks for COVID-19 exposure. Of the growers that cited COVID-19 risk areas, 80% (range of 69-100%
by activity) of them also indicated that they had automation specific to those tasks (Figure 27).
22Figure 27. Percentage of growers that reported automation equipment for activities identified as higher risk for COVID-19 transmission
(Source: Survey 1, 2021)
The number of farms purchasing automation equipment primarily to address COVID-19 risks paints quite a different
picture than farms that have purchased automation equipment for other reasons (Figure 28 compared to Figure 17).
Figure 28. Degree of COVID-19 infection control technology on farms (Source: FCO Survey 1, 2021)
Very little automation has been installed to directly address COVID-19 on farms (5% of responses), and 40% of
respondents did not believe that their automation systems were reducing COVID-19 risk for their workers. Farms likely
achieve enhanced COVID-19 protection by eliminating staff or spacing workers using existing automation equipment
already installed (totals over 50% of respondents). Additionally, there may be little motivation to invest anything but
nominal amounts in COVID-19 automation as a return to common production practices may occur following vaccination
rollout.
23Figure 29. COVID-19 automation investments planned by all farms compared to all other investments (Source: FCO Survey 1, 2021)
Farms are planning on investing in automation for primarily farm-related activities (Section 10, Figures 41-43), but there
is some interest in investments related specifically to COVID-19 mitigation, about 15%. If automation systems have the
co-benefit of spacing or reducing worker interaction, it is likely these types of systems will appeal to floriculture farmers.
In addition to the belief that investing in COVID-19 automation may be redundant if the vaccination rollout is successful
in mitigating the risks of exposure on farm, there are other barriers to investing in COVID-19 automation.
Figure 30. COVID-19 automation investments planned by all farms compared to all other investments (Source: FCO Survey 1, 2021)
Based on the responses from Survey 1, it is clear that knowledge and availability of COVID-19 specific automation is very
limited. Interestingly, no farms responded that there was insufficient need for addressing COVID-19 through automation.
Pandemics are not a common occurrence, and thus, technologies to prevent disease spread have not been developed or
incorporated into production machinery.
24Summary of Survey 1 COVID-19 and Automation Findings:
• High risk activities for all farms include propagation, planting and packaging
• These high-risk activities are often the most automated
• Automation can have some co-benefits for mitigating the risks of COVID-19
• Automation may have the impact of bringing workers closer together physically
• The availability of specific automation to decrease COVID-19 exposure risk is limited
• Farms are more likely to consider automation for other purposes (productivity, etc.)
• Farms are considering COVID-19 risks when purchasing equipment in the future
8.2 Discussions with other organizations and Health & Safety representatives
The risks for COVID-19 transmission are more likely to be mitigated through addressing congregate settings such as
entrances/exits, lunchrooms, washrooms, farm vehicles, locker rooms, propagation and potting areas, and on-farm
housing. Management of these spaces through automation may be considered, for example: sanitizing mists at regular
intervals in washrooms and lunchrooms, decreased capacity limits for common areas, installation of facial scanners to
replace punch clocks, and improving ventilation of indoor workspaces by installing air exchangers. However, education
and administrative controls (physical barriers, signage (posted and floor markings), active screening) may be equally
effective. When implementing administrative controls, compliance must be encouraged and enforced by management.
9. Mapping Farm Productivity and Labour
9.1. Current State of Labour
There are several labour and productivity measurements available through Statistics Canada for the state of labour in
the sector.
Figure 31. Average number of square feet per employee in Ontario (Source: Statistic Canada, 2019)
25Figure 32. Estimated revenue per square foot in Ontario with inflation adjustments (Source: Statistic Canada, 2019)
Figure 33. Estimated revenue generated per employee in Ontario with inflation adjustments (Source: Statistic Canada, 2019)
Figures 31, 32 and 33 highlight a trend of increasing productivity in the sector:
• Figure 31 shows that the amount of square feet one employee can farm has increased by 26% since 2008.
• Figure 32 shows that inflation adjusted revenue per square foot has increased by 31% since 2008.
• Figure 33 shows that inflation adjusted revenue per employee has increased by 65% since 2008.
There are many potentially interconnected explanations for these increases including; growers transferring to either more
profitable crops or crops that are easier to farm, exchange rate gains, price increases outside of inflation, etc. However,
this data, when taken in conjunction with the findings of our surveys, demonstrates that advances in technology and
automation play a key role in the growth of the sector.
269.2. Impact of Labour on Productivity
Figure 34. Relationship between the percentage of change in a workforce against the percentage of change in product output (Source: Survey 2, 2021)
Survey 2 requested that farms disclose the change in their workforce (by number of people and number of hours), and
percent change in productivity by number of plants produced (pots/cuts/plants etc.). Figure 34 compares changes in
productivity with changes in workforce size by percent change, and demonstrates the existence of a strong relationship
between the number of workers added to a farm and the number of plant units produced by the farm: farms that
proportionately add more workers produce proportionately more product. Splitting responses between small and
medium/large growers illustrates some variability in this relationship.
27Figure 35. Relationship between the percentage of change in a work force against the percentage of change in product output on small farms (Source:
Survey 2, 2021)
Figure 36. Relationship between the percentage of change in a work force against the percentage of change in product output on medium/large farms
(Source: Survey 2, 2021)
28As shown by Figure 35 and 36, medium/large growers have stronger relationships between productivity and labour than
do small farms. As demonstrated previously, small farms are more likely to have no automation in any given section of
the farm and are, on average, less automated than medium and large farms. While the difference in this relationship
between farm size is pronounced, it may be caused by the small sample size of small farm respondents or may imply that
automation plays a key role in improving productivity.
Figure 37. Total greenhouse floriculture workers in Canada (Source: Statistics Canada, 2019)
Additionally, the total number of greenhouse workers has decreased since 2015 (Figure 37); however, output has
increased. As previously stated, there are numerous potential explanations for the observed increase in productivity,
though automation and technology are undoubtedly part of the cause. Furthermore, had productivity per employee not
improved since 2008, the sector would have theoretically needed 29,605 workers in 2019 to match the revenue achieved;
nearly 10,000 more workers than were employed by the sector in 2019 (19,651).
299.3. Impact of Automation on Productivity
Figure 38. Relationship between the percentage of revenue invested in automation on a farm against the percentage change in product output
(Source: Survey 2, 2021)
Figure 38 displays the relationship between investment in automation (by percent of revenue spent on automation
annually) and the change in product output (by percent increase in plant output). While the relationship is not as strong
as the relationship between output and labour, a significant relationship exists (R2 = 0.4106). Farms that spent higher
proportions of their revenue on automation tended to have greater increases in product output.
9.4. Impact of Automation on Labour
Broad sector statistics have shown that the worker population on flower farms is in steady decline (Figure 37), yet
productivity has increased and automation has been shown to improve productivity. Assuming that automation
expansion is the primary cause of workforce population reduction is reasonable, exploring relationships between
automation investment and workforce population changes suggests a different explanation.
Figure 39. Relationship between percent of revenue invested in automation against the percentage change in the number of workers at Peak production
(Source: Survey 2, 2021)
30Figure 40. Relationship between the percent of revenue invested in automation against the percentage change in the number of hours worked (Source:
Survey 2, 2021)
Figures 39 and 40 explore the relationship between the percent of revenue invested by farms and the proportionate
changes in their workforce. Counterintuitively, automation expenditures showed weak or no relationship to workforce
changes. Farms that spent more on automation saw no change in their workforce, or possibly small increases in their
workforce.
These findings imply that expanding automation investment has not created the primary benefit of reducing a workforce
population by the farms that completed Survey 2. However, increasing automation expenditure did indeed improve
productivity for respondents, as did increasing workforce. Automation likely holds greater potential for expansion of
productivity than workforce reduction.
One possible explanation for these results may be the nature of automation within the floriculture sector. Floricultural
automation, in general, results in augmenting the productivity of a worker. Automation rarely replaces or eliminates
a worker’s job. Therefore, when farms add automation, they typically need to keep labour levels at pre-automation
levels, if not increase them, to maximize any output gains from automation. Farms adding automation may see labour
improvements, but rather than releasing workers, those workers may be shifted to other roles to further improve output
or address other farm priorities (e.g., improved quality). Considering that increasing labour is very strongly related
to increasing productivity, transitioning workers to new roles, rather than reducing the workforce after automating a
labour-intensive task, holds great opportunity to both maintain worker opportunity in the sector and increase product
output.
3110. Opportunities in Automation
The following sections will explore which tasks farms are attempting to automate, the rationale for automating, and the
anticipated next investments in automation.
10.1. Farm Automation Priorities
Figure 41. Types of automation equipment that various segments of the ornamental industry would like to add to their farm (Source: Survey 1, 2021)
Potted and seasonal farms are looking broadly at all types of automation, but for cut flower growers, shipping is their first
priority, compared to the other farm tasks. Please note: cut flower producers reported a low desire to add propagation
and planting automation systems, and a low level of automation progress among those farm tasks (see Figure 12). This
may imply that these automation systems are less important to cut flower producers.
Figure 42. Type of automation equipment farms would like to add based on farm size (Source: Survey 1, 2021)
32Large farms are frequently seeking planting/potting machines, and are then eager to automate propagation and
production systems. However, as indicated within the survey results, large farms are presently at higher levels of
automation than their small and medium counterparts. It is possible that the return on investment is shorter, or the
financial barriers are different for larger farms. There is no particular difference between small and medium farms as
to which types of automation equipment they would like to add in their farms. Compared to large facilities, small and
medium farms are less automated.
Figure 43. Specific types of automation equipment farms of varying sizes would like to add as a percentage of total respondents (Source: Survey 1, 2021)
Figure 43 illustrates the number of respondents within each farm size that responded with a ‘yes’ in each of the more
specific automation task categories provided. As shown in Figures 42 and 43, larger farms have notable interest in
automation improvements across nearly all activities at the farm. Of note, large farms did not have a consistent desire to
automate within the more general automation task categories (i.e., propagation, production, etc.). While most specific
categories were in demand for automation by large farms, less demand was seen for automation in sowing seeds,
potting, spraying, irrigation, and environmental control. It is possible that larger farms may have already invested in
these particular farm activities, while smaller farms have yet to invest in these systems.
This information supports the argument that floriculture producers are conscious of which automation they want, and
where on the farm it is needed. It’s not from lack of knowledge that they are not automating, as evidenced in the barriers
to automation figures below (Figures 48-51).
33Figure 44. Automation system priorities based on the number of reporting farms (Source: Survey 2, 2021)
Improving productivity and decreasing workforce demands have long been presented as good reasons to invest in
automation, though in truth the intent behind automation is less uniform. Figure 44 above indicates that there are
competing considerations that can vary drastically depending on an individual automation system and operational
needs. Notable reasons for automation may include production/efficiency, labour/workforce reduction, product quality
improvements, worker safety, customer specifications, and even crop changes. Regardless of the variability in why
farms automate, the top three priorities for the average piece of automation equipment are:
1. Production/Efficiency Improvements
2. Labour/Work Hour Reduction
3. Quality Improvements
Please note; these results were based on subjective answers - farms identified which automation objectives were very
important, somewhat important, or not important. Each of the priorities presented above were identified as "very
important" by at least one farm.
Beyond the relative automation priorities and desires listed by farms, the anticipated outcomes of farms' next automation
purchase provide further insight into the opportunities farms are seeking for their business. Survey 2 requested that
farms disclose the next automation purchase, including the anticipated impacts on:
1. Number of employees on the farm
2. Number of staff-hours worked on the farm
3. Changes in plant output (i.e., increases in production)
Comparing the anticipated outcomes from future purchases demonstrated that farms anticipated a decrease in their
workforce by 8.5%, decrease staff-hours by 10.2%, but an increase in productivity by 47%. This generally implies that
the next systems to be added to farms will hold greater potential for increases in productivity rather than workforce
reduction.
3410.2. Projecting Future Farm Automation Investment
Figure 45. The estimated cost of upland automation investment for responding flower farmers (Source: Survey 2, 2021)
Figure 45 displays the estimated cost of respondents next planned automation investment. The cost for medium and
large growers was considerably higher than that of small growers. Across all respondents, the average cost of the next
investment was $1.73 per square foot of production area. Extrapolating the anticipated next expenditure in automation
to the entire sector would imply an approximate automation investment of $32 million, which is well within the range
estimated in Figure 16 (section 7.1) of between $20 and $49 million. Again, this estimate must be carefully considered
given the low sample size of Survey 2.
Further exploring the cost and outcomes from the stated “next automation investment” by farms suggests that on
average a farm will spend $88,900 to reduce their workforce by one worker, or $77.40 to reduce their staff-hours by one
hour.
It is important to also recognize that expenditures on automation are not entirely linked to the purchase of new
equipment. Increased automation comes with both maintenance and upgrade costs as floriculture products “in-
demand” continues to evolve. Farms investing in automation must also consider costs of equipment upkeep and regular
upgrades for increased capacity.
35Figure 46. The average proportion of automation expenditures on new investments versus maintenance versus upgrades (Source: Survey 2, 2021)
New purchases account for, on average, over 54% of a farm's automation expenditure, while 30% of expenditure is
assigned to maintenance with over 15% to upgrades.
Despite the opportunity for automation investment, many farms continue to seek other investments to help further
improve their business.
Figure 47. The percentage of respondents who indicated that a farm expansion was to be their next major investment (Source: Survey 2, 2021)
For many growers, expanding their growing area is a priority. Approximately 40% of respondents to Survey 2 expressed
their prioritization of farm expansion over automation expansion (Figure 47). While there are many explanations for
this, two major contributing factors could be that farm expansions come with considerably less risk and have historically
offered a higher return on investment.
3610.3. Barriers to Automation
Figure 48. Barriers to automation on farms of various sizes (Source: Survey 1, 2021)
Less than 10% of the responses indicated that they didn’t have enough information to expand their automation systems.
For large growers, 20% of barriers to automation were linked to the lack of existing systems that suited their needs.
Financial reasons were by far the most reported barriers to expansion of automation on Ontario's flower farms. Financial
barriers may include access to credit, willingness to take on debt, or cost of equipment compared to relative return.
Determining accurate ROI’s for these technologies within the context of this study has not been feasible due to custom
pricing and general supplier hesitancy to share costing information.
Financial barriers to automation were consistent for small, medium and large producers, regardless of the automation
category they were investigating. The next three figures explore barriers to automation for each producer size within
each automation category.
37Figure 49. Perceived barriers to automation of specific tasks provided by small farms (Source: Survey 1, 2021)
Figure 50. Perceived barriers to automation of specific tasks provided by medium farms (Source: Survey 1, 2021)
38Figure 51. Perceived barriers to automation of specific tasks provided by large farms (Source: Survey 1, 2021)
Financial barriers were paramount for small, medium, and large producers for all farm tasks other than for COVID-19,
though the barrier was especially pronounced for "production" automation equipment. Financial barriers do not appear
to be key in the decision to adopt COVID-19 automation equipment.
Figure 52. Summary of financial barriers provided by various farm sizes (Source: Survey 1, 2021)
39Break down of financial reasons further indicates that access to credit/financing is not a major barrier for medium and
large farms, while all farms are concerned with the cost of adopting new technologies. These barriers may include the
equipment being too costly, or the cost recovery period being too long - both of which can be solved through cost share
programs or investment in the agricultural sector while the potential of increased demand should lower the price of
equipment in the longer term. New technologies may need time on the market before the required capital investment
decreases. The “Other investments” response is challenging to interpret because a farm may be willing to invest in some
technologies that have a greater perceived value than others to the business. Not all of these decisions are based on full
cost analyses.
Figure 53. Degree of motivation to automate based on farm size (Source: Survey 1, 2021)
Finally, if the barriers were addressed most growers would advance automation on their farm.
4011. Conclusions and Summary
This study explored a wide array of factors influencing the status of automation in Ontario's flower growers, with a broad
aim to:
1. Characterize the state of automation in the floriculture sector
2. Determine the opportunity to offset the risk of COVID-19 using automation
3. Characterize the opportunity to increase productivity using automation
4. Explore strategies to encourage automation uptake in the sector
Each of these priorities are explored individually below.
11.1. Observations on the State of Automation
The vast majority of farms have begun automation or are automated to a high degree, though smaller growers have
less on-site automation than their larger counterparts. Similarly, cut flower growers appear to be less automated than
their potted or seasonal plant growing peers. Regardless, all producer sizes and product types showed eagerness to
further invest in automation indicating that the floral sector can indeed expand its automation systems. Despite the
opportunity for more expenditure, farms are investing between 2.5% and 6% of annual revenue into new automation
systems every year, which equates to between $20 million and $49 million annually.
Within the sector, some types of automation systems appear to be more common than others. Soil and potting machines
were the most common automation system on farms, followed by irrigation systems. Packing systems appeared to be
much more present on large farms than on medium and small farms.
11.2. Determining the Opportunity to Offset the Risk of COVID-19 Using Automation
The activities of highest risk of spreading COVID-19 (across all farm sizes) were considered to be packaging and planting;
activities that are presently highly automated within the farm community. In addition, 80% of respondents reported
having automation systems present in use for tasks that could provide heightened COVID-19 mitigation. In validating
whether or not farms believed that their current automation systems that were used primarily for production activities
(i.e., propagation, planting, production and shipping) could reduce COVID-19 risk, 40% of respondents did not believe
their automation would reduce risk. Sixty percent of respondents believed that their systems would reduce risk through
either co-benefit of reducing labour, enabling distancing on the farm, or through having systems specifically designed to
reduce COVID-19 risk. Within this group, only 5% reported having systems to specifically address COVID-19.
In short, automation systems are available for key COVID-19 risk areas, though few systems are available to directly and
specifically offset COVID-19 risk, and most of the COVID-19 protection comes from the co-benefit of enabling distancing
or reducing workforce numbers. Technologies that specifically aim to reduce COVID-19 exposure risk are limited (e.g.,
screening, sanitation, ventilation), however, there is a desire by farms to adopt these technologies if they become
available, as 16% of all responses indicated a willingness to invest in COVID-19 automation.
11.3. Characterize the Opportunity to Increase Productivity Using Automation
Improving productivity through increasing output, reducing workforce, or both, has long been thought to be key
justifications for automation investment. Historically, the floriculture sector has seen considerable improvements
in labour productivity despite fewer workers being required to increase revenue and production area. The worker
population in the sector has continued to decline, though output and revenue have both increased.
This study showed clear relationships between labour, automation investment, and productivity. Farms which added
more labour saw greater increases in production output, indicating that adding labour is a clear and predictable path
to increasing production output. Similarly, farms that invested more in automation saw greater increases in production
output, but with a somewhat weaker relationship than adding labour.
Considering that automation was shown to increase productivity, it was postulated that increases in automation would
also enable farms to reduce their workforce per unit of production. Conversely, no detectable relationship was found
41You can also read